1. Introduction
In recent years, the Chinese government has been actively addressing global climate change and accelerating the green energy transition. In order to achieve this goal, the Chinese government put forward the demand of building a novel type of power system. This will achieve carbon peak by 2030 as well as carbon neutral by 2060. Now, China is in a critical period of green and low-carbon energy transition development. Wind power and photovoltaic power generation as well as other new energy are developing very rapidly. The total installed capacity of wind power and photoelectric power generation is expected to be about 1.2 billion kilowatts or more by 2030. This is to ensure the safe and stable operation of the power grid. The power supply needs to be regulated more urgently. In addition, construction of a new power system with new energy sources as the mainstay power will put higher demands on the pumped storage development. Pumped storage is an important way to ensure the power systems’ safe and stable operation around the world. According to the Global Hydropower Report released by the International Hydropower Association (IHA) 2021, the total installed capacity of pumped storage is 159 million kilowatts, accounting for about 94% of the total energy storage scale. With its vast territory, China has rich resources for building pumped storage power plants. Pumped storage was first used at Hebei Gangnan Power Station in the 1960s. With the rapid economic and social development, the number and layout of pumped storage projects have been expanding. At present, the total scale of pumped storage power plants in China has put into operation about 32.49 million kilowatts, mainly in Eastern, Northern, Central, and Southern China. The pumped storage plants under construction are about 55.13 million kilowatts, of which about 60% are also located in Eastern and Northern China. Pumped storage development in China has made some achievements, but there is still a large demand for it, and with the construction of new power systems, pumped storage development is still very promising. On the other hand, both the China Development and Reform Commission and the Energy Bureau have set out the requirement for pumped storage projects in the 14th Five-Year Plan period to be “as open as possible”, indicating that China’s pumped storage development has entered a golden period.
At the same time, pumped storage power plants are being built to serve the peaking and frequency regulation of the power grid. Power flow in China will gradually shift from the original “reverse transmission” to “external power inward” in the new power system period, i.e., the power supply side will rely on delivering power from regional grids to load centers. New energy generation instability will bring impact and challenged regional power grids to stability. On the other side, new energy resource endowment and areas’ power consumption show an inverse distribution; the power needs to rely on the transmission system with extra high voltage as the backbone. With uncertain wind power and photoelectric power generation, grid power output needs to have higher quality standards. Additional factors are also needed to support peak regulation, energy storage, and flexible operation on the grid side, and the development and improvement of auxiliary services are an inevitable trend. Considering pumped storage potential as well as its safe stable operation and characteristics of the grid, this paper provides a study of previous pumped storage power plants and carries out follow-up work.
This goal will achieve carbon peak by 2030 as well as carbon neutral by 2060. Considerate building of green power may generate energy waste. Therefore, the building of the storage power plant is very important. Compared to pumped storage, electrochemical energy storage has a shorter life span, and nuclear power is less safe. Therefore, pumped storage power plants are a better choice for storage energy.
The above background shows that China is currently developing pumped storage power plants and that there is a trend towards investment in pumped storage power plants. In order to ensure the efficiency of the investment, we need to think about the efficiency of investing in pumped storage power plants in different regions of China, as well as whether these pumped storage power plants can really fit into the safe and stable operation of the regional grid. The assessment of project investment efficiency is an essential part of project management. When investors analyze the factors which impact a project’s efficiency to determine whether or not it should be built, they are able to determine what the level of benefit is and what specific factors may affect investment efficiency, which is important for them to make sound decisions. This paper discusses the investment efficiency of pumped storage power stations from the perspective of operational needs. It is different from the general project efficiency management approach that stresses capital, engineering complexity, and the regional grid needs for pumped storage power stations, which will improve the construction of new power systems.
The contributions of this study are as follows: firstly, we innovated the index system for evaluating the investment efficiency of pumped storage power plants, and secondly, we used a combination of AHP and cloud models for the first time to judge the pumped storage investment efficiency results in different regions of China. Finally, we analyze and summarize the different scores of different indicators in our conclusions, and finally, we propose policy recommendations with universal applicability.
2. Literature Review
2.1. Pumped Energy Storage
The new energy represented by wind power and photoelectricity is the main part of the new power system. Their inherent intermittency, randomness, and volatility increase the system’s reliance on energy storage facilities. Compared to the various types and different energy storage degrees of technology development, pumped storage technology is already more mature. We argue that pumped storage must be the mainstay of the future Chinese power system storage grid. The demand for pumped hydro energy storage has driven the development of related academic research, including technical aspects, operation and dispatch, and investment decisions. Rehman S et al. [
1] reviewed the existing global PHES capacities, technological development, and hybrid systems, specifically including pumped storage of wind, photovoltaic, and seawater. The energy efficiency of pumped hydro energy storage (technology/plant) was considered to be between 70% and 80%, with large pumped storage plants always installed at 2000 MW–3000 MW, but 1000–1500 is more common, and the typical sizes of turbines were found to be 300 to 400 MW. Mélanie Guittet et al. [
2] studied pumped storage characteristics from a system perspective, and compared to an open loop system, the closed loop system including upper and lower reservoirs can provide more advantages in terms of energy conversion, service life, and maintenance costs. J.P. Hoffstaedt et al. [
3] conducted research in the areas of pump turbine design and configuration, grid integration, and electrical machines and control. He found that axial flow pump turbines, Archimedes screws, counter rotating and rotary positive displacement reversible pump turbines coupled with axial flux permanent magnet synchronous motor generators have a wide range of applications and can be used in pumped storage to provide excellent auxiliary services for the grid. It is easy to see that the development of pumped storage is well established and that its main purpose is also to store energy as well as serve grid operation. In order to explore the performance of pumped storage plants with non-technical aspects, Shahid Ali et al. [
4] examined drivers and barriers to the deployment of pumped hydro energy storage applications, finding that energy storage demand, revenue, and renewable energy integration are the drivers of pumped storage development, while high costs and lack of transmission lines are the main impediments. Songrui Li et al. [
5] researched the coupling relationship between pumped storage power plants and ecosystems and found that construction cost, installed capacity, and pumping capacity will affect the synergy between power station and ecology. Wu and Zhang [
6] considered that energy storage power plants in their construction and operation will meet some efficiency concerns regarding time or money. A reasonable efficiency assessment can provide decision support for plant management. These studies suggest that the development of a pumped storage plant requires consideration of multiple efficiency factors. From a traditional project efficiency management perspective, the focus is generally on the economic, environmental, and technical uncertainties of the project. Wu et al. [
7] analyzed the portfolio planning of energy storage technologies from the perspective of grid applications, which shows that the mutual development of grid and energy storage technologies is complex. Therefore, it is important to consider grid operation needs to invest in the development of pumped storage. He Y X et al. [
8] analyzed pumped storage plants’ full life cycle efficiency from the perspective of electricity prices, and we can find that pumped storage plants’ efficiency is related to the operation and improvement of the grid. Wu et al. [
9] highlighted that pumped storage plants can interact effectively with grid operation and enhance the energy flexibility of power systems.
Liebensteiner M et al. [
10] provided novel causal estimates, used an econometric instrumental-variables framework, and data on Austrian pumped storages to prove the notion that the subsidies for renewable energy may distort price signals, thereby adversely undermining the profitability of energy storages. This study contributes to the general debate on the design and effects of environmental regulation. Lamp et al. [
11] provided evidence that battery deployment in the years 2013 through 2017 lowered average intra-day wholesale price spreads and that current market conditions limit the profitability of batteries in this market. The findings are partially consistent with the solution of an arbitrage maximizer.
In summary, pumped storage has great potential for development and is an important support for power grids’ safe and stable operation in new power systems. However, pumped storage development requires consideration of many efficiency factors. Traditional studies have mostly focused on the investment cost, construction cycle, and environmental as well as project technical efficiency from the perspective of investors. Because fewer studies have considered pumped storage power plants’ investment efficiency from the demand side of the grid, considering that pumped storage’s main function is to serve the grid, assessing pumped storage power plants’ investment efficiency from the grid demand side is a new research perspective and is of great significance.
2.2. Investment Efficiency Assessment
Project investment efficiency assessment can be considered as a multi-attribute decision problem; i.e., after collecting information on the corresponding indicators and constructing a unique efficiency assessment indicators system, efficiency assessment values are obtained by analyzing the significance and integrated attribute values of the efficiency indicators. For the collection of information, fuzzy numbers are gradually replacing crisp values as popular in the field. It was first proposed by Zadeh, and using a range of numbers to represent the thing’s characteristics, there is a higher information inclusion degree than a single numerical value. In the field of efficiency assessment decision making, mostly the information value is converted into corresponding efficiency level affiliation to determine the final efficiency level. In this process, Wu et al. [
12,
13] proposed a fuzzy number-based efficiency decision framework and directly use triangular fuzzy numbers to represent the indicators’ efficiency values compare the magnitude of the resulting fuzzy values to judge the project efficiency level. Wu et al. [
14] assigned the performance index values of the evaluated items to the corresponding performance in terms of rank, and the final project performance level is obtained by calculating the corresponding affiliation degree. The above two papers can be used as references for different approaches to efficiency assessment decisions, but the latter can provide a more comprehensive project’s situation understanding, as it allows them to make decisions under different performance levels and improve the accuracy of the project efficiency level affiliation calculation. Yin et al. [
13] proposed a fuzzy synthetic evaluation model based on the cloud model and AHP method. He argues that the decision information from experts is inevitably fuzzy with human thinking, and the cloud model can effectively handle this transformation between qualitative and quantitative. Zheng et al. [
15] proposed the cloud model generator degree of affiliation obtained can relax the function of accurately determining the degree of membership, and Ilbahar et al. [
16] constructed the expectation function of the normal membership degree distribution based on AHP method.
For the calculation of indicator weights, hierarchical analysis is widely used as the basic method. Jinru Wu et al. [
17,
18] obtained the results by comparing the relative indicators’ importance, but the results suffer from the problem of failing the consistency test, which makes the work of importance assessment rerun and increases the workload. At the same time, the weighting method driven by objective real-world data can reflect the pattern of things in the actual environment. However, Wang et al. [
19,
20] indicate susceptibility to data volatility; it is difficult to obtain accurate indicator importance distributions when the data are not sufficiently large. In general, subjective weights and objective weights can be combined to form a combined weighting to represent the importance of efficiency decision indicators. Hesam et al. [
21] suggested that the weights can be combined differently according to decision-maker preferences. Romulus et al. [
22] combined multiple subjective weighting results in an intuitively ambiguous environment to obtain the final importance ranking of efficiency factors. It is easy to see that the subjective weights mainly reflect the experience and thinking of the evaluation experts, while the objective weights reflect the value of the project’s own attributes, and they both have their own desirability. If we only use the weighting method, it may result in biased weighting results, so the proposed combination of weights can effectively solve this problem and is also recognized by scholars.
For the integration of the final efficiency results, fuzzy mathematics-based fuzzy integrated evaluation can apply the principle of fuzzy relational synthesis to deal with factors that are ill-defined and difficult to quantify. This can be used to deal with complex maldistributed evaluation problems in efficiency management. Wu et al. [
14,
23] argues that efficiency assessment is complex and fuzzy, and that fuzzy integrated evaluation can deal with problems associated with fuzzy, subjective, and uncertain judgments. Zhao et al. [
24] use the FSE approach to take advantage of deterministic results and rigorous systematicity; therefore, it is effective when applied to multiple forms of problems in uncertain environments. Wu et al. [
25] used fuzzy synthetic evaluation technique to determine river efficiency values and identify potential high-efficiency watersheds. Xu et al. [
26] used FSE to rate the green project efficiency in Singapore. Tao et al. [
13] used FSE to analyze the efficiency of distributed PV. It is worth noticing that in traditional FSE efficiency evaluation, the definition of efficiency levels regarding indicators is generally at a fixed value, but in practice, different efficiency level criteria may intersect. Zhou et al. [
27,
28] researched that ambiguity and randomness can cause perturbations to the decision outcome. Therefore, Wu et al. [
6] have taken advantage of the cloud model’s ability to effectively deal with information randomness and ambiguity; the subordination hierarchy is transformed into a cloud model form and then combined with FSE to improve decision-making accuracy, and the feasibility of this improved approach is also recognized. Then, Xiao et al. [
29] studied the cloud model and give advancements in improved decisions and more efficiency. The Duan [
30] discussion of the hydropower situation in China gives theoretical support to this article, and the study by Prasad et al. [
31] provides an introduction to the pumped storage cleanliness in detail and facilitates the cleanliness index to make the evaluation more comprehensive.
2.3. Findings of Literature Review
Through the analysis of the current status of relevant research, we found that: (1) the current development potential of pumped storage power plants is huge, and it is necessary to carry out research on efficiency assessment, although there are some studies on the factors influencing the development of pumped storage that show the perspective of the project itself, and there is a lack of research perspectives that consider the operational needs of the grid; (2) efficiency assessment decision frameworks and theories have been developed more maturely, but there are still improvements in information uncertainty, weighting synthesis, and integration rationality, and there is no complete set of decision frameworks that can be applied to the efficiency assessment of pumped storage power plants. In view of the above two points, the research work undertaken in this paper is of some academic and practical significance and can fill the corresponding gap.
By analyzing investment efficiency management of pumped storage power plants with current research, we find that there are currently several main issues that need to be addressed: (1) index systems and assessment frameworks for analyzing the investment efficiency of pumped storage power plants from a grid demand perspective are lacking; (2) project attributes are transformed into corresponding efficiency level affiliations, and the uncertainty in this process is difficult to characterize; (3) if a single weighting method is used to calculate the project’s efficiency indicators’ importance, it is likely to result in biased results; (4) ambiguity and distortion problems in the integration of efficiency results need to be highlighted..
In order to solve these problems, the targeted research carried out in this paper and the main work can be summarized as follows: (1) we analyzed the role and function of pumped storage power plants in each regional grid through literature combing and field research, based on regional grid power restructuring demand, safe and stable operation demand, as well as energy storage demand oriented to identified 22 grid-based efficiency factors, and constructive efficiency evaluation index system of pumped storage power plants containing 15 factors after we further summarized before using ISM to analyze the interrelationship between efficiency factors; (2) based on a cloud-based model transforming pumped storage efficiency evaluation indexes’ rank values into a cloud containing value, entropy, and hyper entropy, we describe the randomness and ambiguity of efficiency rank in reality; (3) we constructed a comprehensive weight calculation model with a combination of compatibility matrix and entropy method. The former is based on experts’ empirical judgement, reducing interference from little objective data, and it also has good performance at passing the consistency test. The latter is data driven and reduces the influence of subjective thinking in human decision making. Determine the final weights with minimal deviation of two values by game combination; (4) we used FSE to integrate the cloud affiliation and importance values of each efficiency index to complete qualitative and quantitative attribute combination to obtain the project affiliation values under different efficiency states to determine the final efficiency profile of the pumped storage plant.
Based on the above summary of the work of this paper, the innovations of the study can be summarized as follows: (1) perspective innovation, evaluating the pumped storage power plant investment efficiency from the regional grid demand perspective; (2) identifying many efficiency factors and obtaining a new index system through refinement; (3) considering information uncertainty, comprehensive weighting, and integration completeness, proposing a set of efficiency evaluation framework containing cloud model, combined weights, and FSE efficiency evaluation framework, which was successfully applied in the efficiency assessment work of pumped storage power plants. These approaches are reasonable throughout the coherence of the framework. Thus, the paper constructs a decision model which on the practical side provides decision support for investors and understands the investing efficiency of the construction of pumped storage power plants. On the theoretical side, it achieves a combination of multi-attribute decision methods, showing that for uncertainty and ambiguity problems in decision making, an appropriate combination of methods can accomplish an effective response, so it may provide some insight to relevant scholars.
The subsequent sections are organized as follows:
Section 2 identifies the efficiency of benefits and constructs the final benefit evaluation index system.
Section 3 introduces the methodologies to be used in the benefit evaluation process.
Section 4 examines the feasibility of the model constructed in this paper by applying it to a case study and makes some comments for benefit control.
Section 5 summarizes the research of this paper and provides an outlook on the subsequent research.
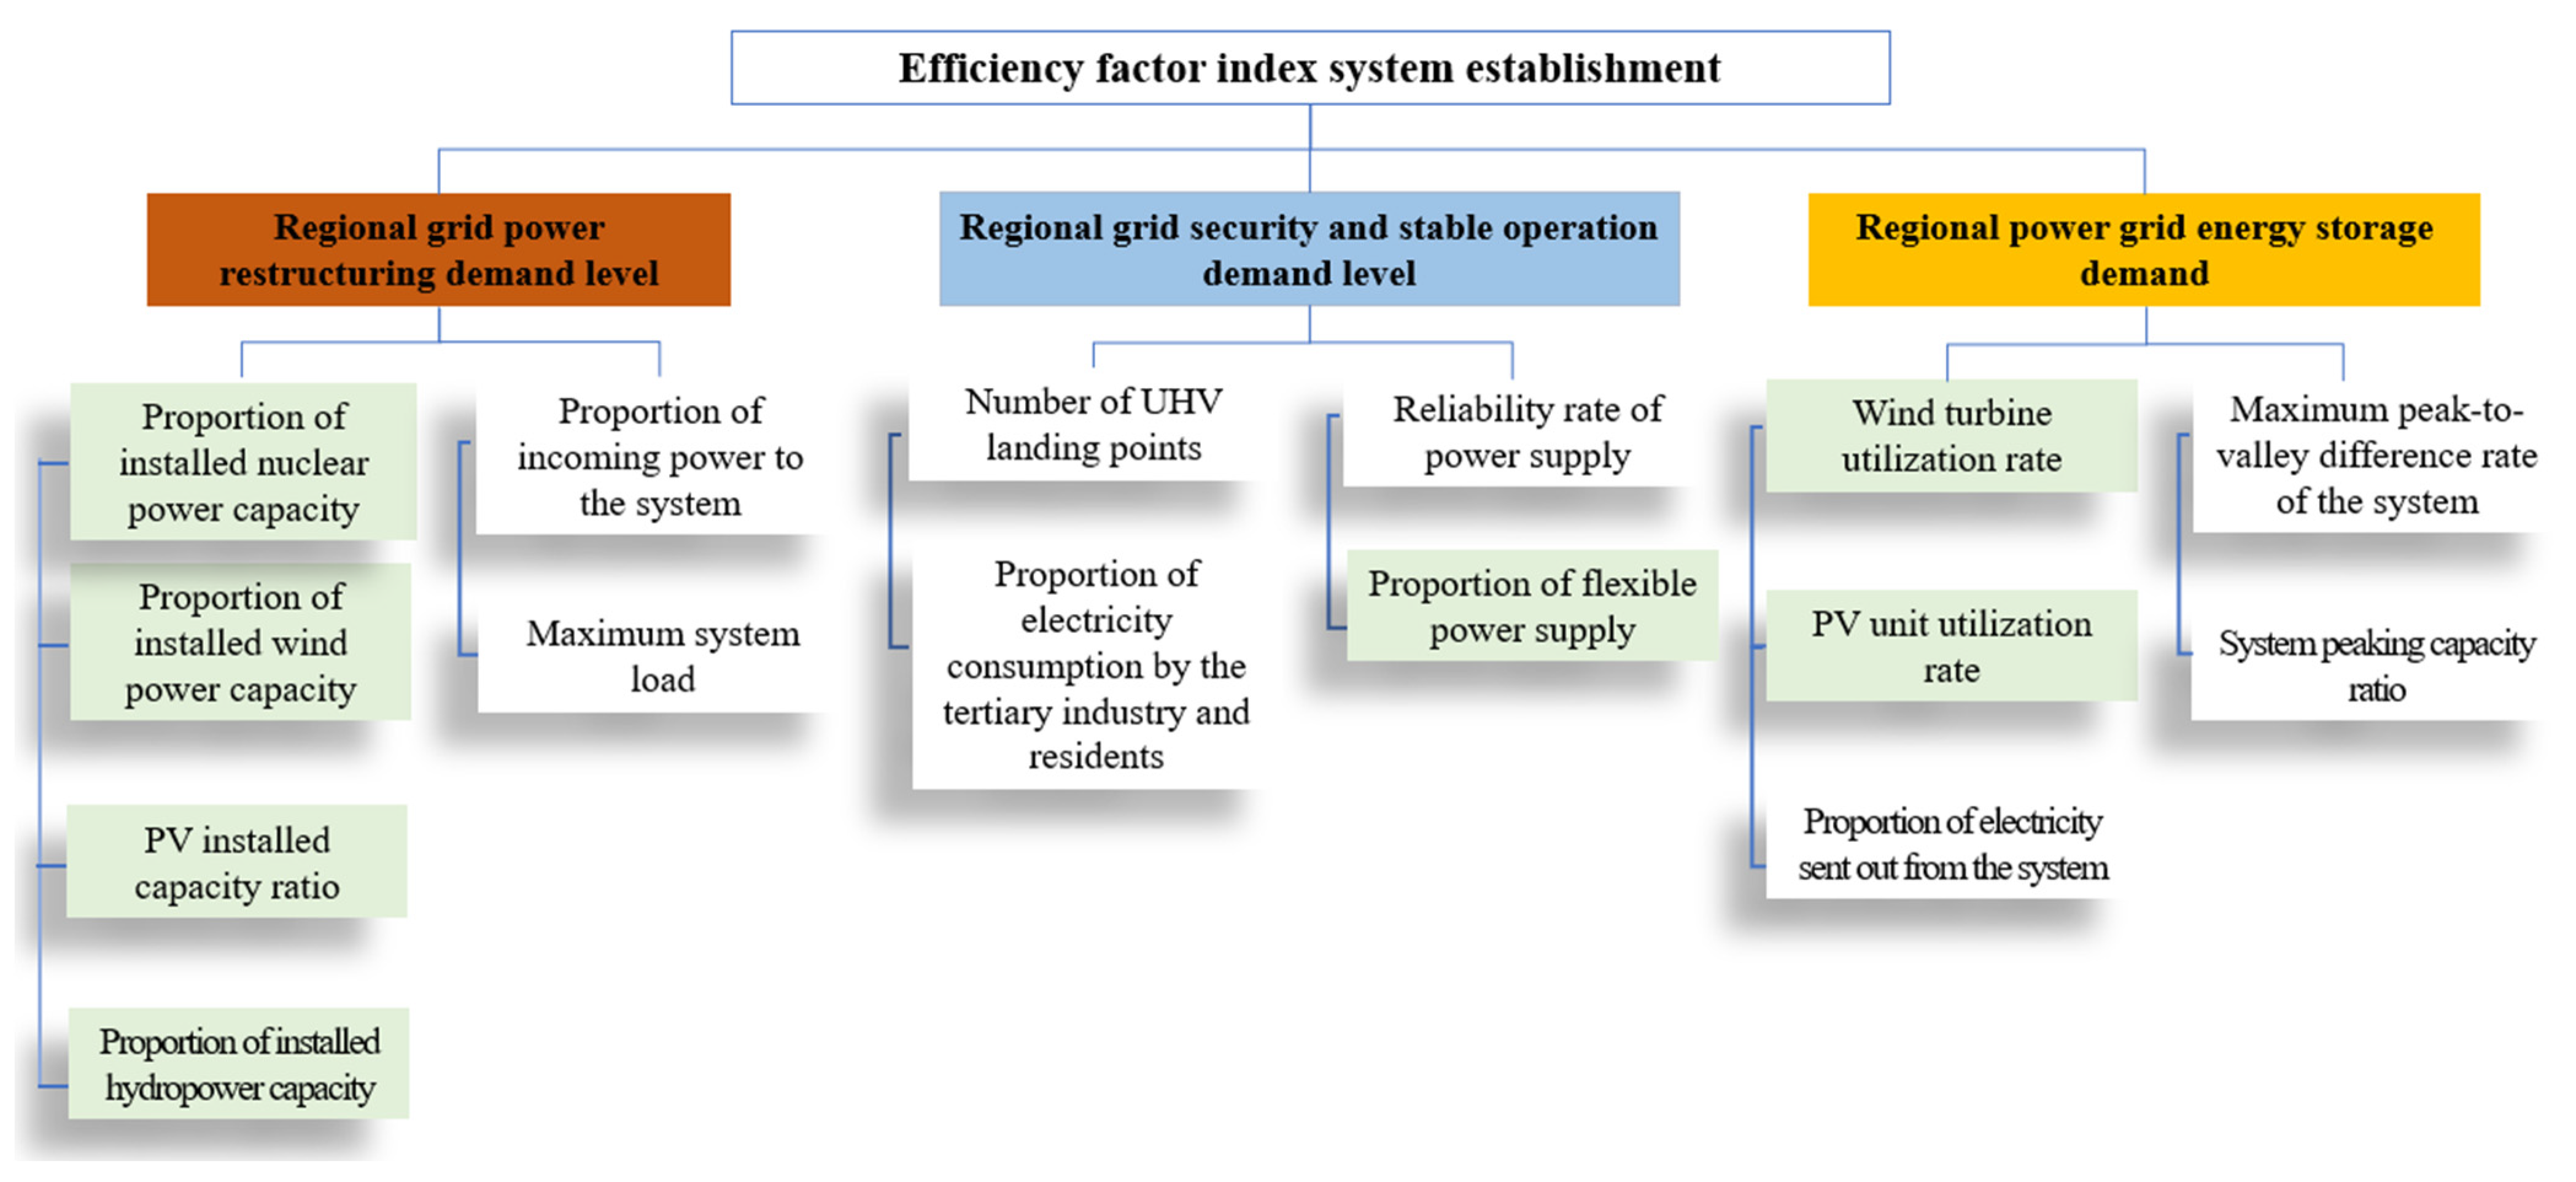
3. Efficiency Factor Identification and Index System Establishment
3.1. Identification of Efficiency Factors
The operational efficiency of the regional power grid directly determines the degree of pumped storage power plant functionality, which affects the uncertainty of pumped storage power plant revenue and thus leads to different investment benefits of pumped storage. Therefore, in order to reasonably analyze the investment efficiency of pumped storage power plants, in this paper, we selected three aspects as the entry point for the identification of investment risk factors, including the need for power supply structure adjustment of the power grid, the need for safe and stable operation of the regional power grid, and the need for energy storage in the regional power grid.
3.2. Power Restructuring Demand Level
- (1)
Proportion of installed nuclear power capacity (A1): It means the proportion of nuclear power installed capacity in the total installed capacity about the regional power grid, but nuclear power is subject to its own economic and technical safety constraints; its frequent participation in peak load regulation increases the maintenance costs of equipment. Otherwise, investment in pumped storage power plants can improve the efficiency of nuclear power. This way can avoid the cost increase of nuclear power units per unit during the bimodal hours and also can meet functional needs of the grid.
Therefore, the installed nuclear capacity in the regional grid enables the support function of pumped storage power plants to be used as a means of increasing the efficiency of the plant.
- (2)
Proportion of installed wind power capacity (A2): It means the proportion of wind power installed capacity in the total installed capacity of the regional power grid. Wind power generation has randomness and uncertainty; pumped storage power plants can play a positive effect on the maintenance of wind power. Therefore, investing in pumped storage will provide better efficiency.
- (3)
PV installed capacity ratio (A3): It means the proportion of PV installed capacity to the total installed capacity on the regional power grid. The power quality and instability of photovoltaic power generation are similar to wind power, and also have an impact on safe performance. Pumped storage power plants can not only guarantee the smooth output of photovoltaic power generation systems through peak and frequency regulation but can also improve the grid friendliness and power quality of photovoltaic power generation. Therefore, the increase in PV capacity can also guarantee pumped storage power station efficiency.
- (4)
Proportion of installed hydropower capacity (A4): It means the proportion of hydropower installed capacity to the total regional power grid installed capacity. Due to the influence of natural conditions, the generation of hydropower units varies considerably during the high and low water periods. The former uses abandoned water for peaking and the latter means reduced peaking capacity due to reduced operating capacity. On the one hand, pumped storage power plants can alleviate the peaking demand of hydropower during the abundant period, and on the other hand, they can reduce the output pressure of hydropower units during the dry period and lower the unit generation cost of the peaking cost in the system, thus improving the efficiency of hydropower unit operation.
- (5)
Proportion of installed cogeneration capacity (A5): It means the installed CHP units of the total installed capacity in the regional grid proportion. Insufficient peaking capacity of the system will appear when the heating demand is high. Because pumped storage power plants have a peaking effect, the effectiveness of building pumped storage power plants will be guaranteed.
- (6)
Proportion of incoming power to the system (A6): It means the proportion of incoming power in the regional power grid to the total power consumption. Due to the unbalanced development of natural resources and economy, the share of incoming power in the eastern region of the grid is also gradually increasing. Renewable energy sources do not provide enough peaking capacity for incoming power, and the power variation further increases the regulation capacity of the grid at the receiving end. The deployment of pumped storage power plants in the receiving grid can effectively improve the peaking pressure of the receiving grid. Therefore, this indicator can measure the benefits of pumped storage power plants.
3.3. Regional Grid Security and Stable Operation Demand Level
- (1)
Maximum system load (A7): The maximum load of the regional power grid is closely related to the level of regional economic and production development, and the maximum load needs to raise the peak output of the power system which will increase the reliance on accident reserve capacity. Pumped storage power plants have a good peak shaving effect, can reduce the system’s output pressure, and can effectively supplement the system’s reserve capacity. Therefore, pumped storage power plants can effectively perform their regulating function in regional power grids with high maximum loads and improve their functional performance.
- (2)
Number of UHV landing points (A8): At present, extra high voltage input can easily lead to regional grid operation facing the safety problems of insufficient frequency support capacity and large system power fluctuations after DC blocking. Now, pumped storage plants can make up the power difference caused by severe failures. Therefore, pumped storage units can give full play to their strategic function of safety and security in the regional grid.
- (3)
Proportion of electricity consumption by the tertiary industry and residents (A9): It means the proportion of electricity consumption of the tertiary industry with urban and rural residents in the regional power grid to the total electricity consumption of the society. The large difference in electricity consumption between different industries leads to spikes in the power grid, increasing the pressure on the safe and stable operation of the power grid. The increase of the proportion of electricity consumption by the tertiary industry or residents can effectively promote the full play of the function of pumped storage power plants and increase the investment efficiency.
- (4)
Reliability rate of power supply (A10): It is expressed in terms of the average annual outage time of customers and the accumulated hours of the year, which can characterize the reliability of the regional power grid. Pumped storage power plants have a black start function which enables the regional power grid to restore power supply capacity in the shortest possible time and can be used as emergency backup power. This improves the stability of regional power grid operation.
- (5)
Frequency crossing time (A11): Fluctuation of the grid frequency will affect the quality of electricity for users, the economic operation of equipment, and regional grid security. Pumped storage power plants are much better than thermal power units and gas turbines in terms of their ability to climb and peak, and their ability to quickly track load changes can help maintain the grid frequency. Therefore, considering the grid frequency crossing time can improve the efficiency of developing pumped storage power plants.
- (6)
Transmission fault rate (A12): It means the annual number ratio of transmission line failures to the 100 km length of transmission lines in the regional grid. The level of transmission failure rate will affect the investment efficiency of pumped storage power plants in improving the power quality of the regional power grid.
- (7)
Proportion of flexible power supply (A13): The proportion of the installed capacity of pumped storage, other energy storage and gas power units in the regional power grid to the total installed capacity. The flexible power supply can improve the output volatility of new energy power in the system and enhance the regulation ability of the regional power grid. Pumped storage is the main force of flexible power; if the regional grid has a high proportion of flexible power, it will to a certain extent limit the function of the new pumped storage power plant and reduce the investment efficiency.
3.4. Regional Grid Energy Storage Demand Level
- (1)
Annual system generation capacity (A14): Pumped storage power plants can store discarded power, which prevents low load operation or shutdown of the units during under load conditions, and allows the units to maintain normal processing conditions as much as possible, increasing their operating time.
- (2)
Annual power demand of the system (A15): For regional power grids where the power generation is greater than the power demand, the construction of pumped storage power plants can improve the power consumption capacity and ensure the power quality when the power is sent out. Therefore, the system power demand can also be a factor affecting the pumped storage power plant’s efficiency.
- (3)
Wind turbine utilization rate (A16): It means the ratio of wind turbines’ annual utilization hours to the number of calendar hours, which can characterize the abandonment of wind turbines in the regional grid. The construction of pumped storage power plants can not only improve the system’s peaking capacity, but also store power and largely reduce the wind power abandoned by wind farms.
- (4)
PV unit utilization rate (A17): It refers to the ratio of annual utilization hours of PV units to the number of calendar hours, which can characterize the abandonment of PV units. Photovoltaic power plant construction scale and regional load level mismatch and market consumption capacity is limited, so the region will appear as “abandoned light” phenomenon. The construction of pumped storage power plants can provide energy storage capacity for the regional power grid, cooperate with the power delivery and consumption of PV power plants, and promote the further development of PV installations.
- (5)
Nuclear power unit utilization rate (A18): It means the ratio of annual utilization hours of nuclear power units to calendar hours, which can characterize the utilization of nuclear power units. The pumped storage power plant can make the nuclear power units in the system change the pressure load operation to stable power operation. Therefore, the joint operation of nuclear units with pumped storage power plants can increase the operating hours of nuclear units, ensure the full function of pumped storage power plants, and reduce investment efficiency.
- (6)
Abandoned water power (A19): This indicator mainly includes the amount of peaking abandoned hydroelectricity and installed abandoned hydroelectricity. The former refers to water abandonment that cannot be stored during low load hours, while the latter refers to water abandonment due to power differentials. Pumped storage power plants can use the energy storage characteristics to absorb excess power in the system. When the power demand decreases, hydropower plants can store energy to defense abandon energy. For the existence of abandoned water power, the regional power grid has a positive effect.
- (7)
Proportion of electricity sent out from the system (A20): It means the proportion of electricity sent out in the regional power grid to the total power generation. At this stage, it is difficult for new energy to be used as an effective capacity of the power market, which will reduce the transmission quality of transmission lines. Pumped storage power plants use the function of energy storage to regulate and compensate for the new energy power on the regional grid. Therefore, the construction of pumped storage power plants can contribute to improving delivered power quality to increase investment efficiency.
- (8)
Maximum peak-to-valley difference rate of the system (A21): It means the maximum peak-to-valley power difference as a proportion of the maximum system load. The maximum peak-to-valley difference affects the difficulty of power system peaking and directly affects the peaking capacity. The pumped storage power plant can effectively regulate the dynamic balance between peak and trough of regional power grid load through electrical energy storage and discharge. Therefore, the increase or decrease of the maximum peak-to-valley difference of the regional power grid has a significant impact on the pumped storage power plant’s ability to fully perform its energy storage function and improve the power grid functionality.
- (9)
System peaking capacity ratio (A22): It means the ratio of all forms of operating units’ adjustable operating capacity in the regional grid to all units’ total rated capacity. Thermal power units involved in peaking work but have a minimum output requirement. The peak shaving feature of pumped storage can effectively improve the system peaking capacity ratio and enhance the peaking capacity of the regional grid. Therefore, the system peaking level capacity ratio will influence the pumped storage power plants’ investment efficiency.
3.5. Establishment of an Efficiency Evaluation Index System
The above factor analysis reveals that there are many factors that can influence the efficiency of the regional grid in pumped storage power plant investment risk, and the relationships between risk factors are intricate and complex, which together constitute a huge system of investment risk factors. In order to clarify the hierarchical relationships between the factors and condense the key factors as risk evaluation indexes, the above indexes are analyzed here based on the ISM method, as shown in Exhibit A. The final index system for evaluating the efficiency of pumped storage power plant investment in the regional grid is shown in
Figure 1.
4. Methodology for Investment Efficiency Evaluation
4.1. Information Representation—Cloud Model and AHP
AHP (Analytic Hierarchy Process) is proposed by Saaty [
32] It is a practical multi-program or multi-objective decision-making method proposed by American operations researcher Professor T. L. Saaty in the 1970s, which is a combination of a qualitative and quantitative decision analysis method. It is often applied to multi-objective, multi-criteria, multi-factor, multi-level unstructured complex decision problems, especially strategic decision problems, and has a very wide range of practicality. AHP hierarchical analysis is a multi-objective decision analysis method that combines qualitative and quantitative analysis methods. The main idea of this method is to decompose the complex problem into several levels and several factors, compare the importance degree between two indicators, establish a judgment matrix, and calculate the maximum eigenvalue of the judgment matrix and the corresponding eigenvector to get the weight of the importance degree of different solutions, so as to provide a basis for the selection of the best solution.
The cloud model was proposed by Deyi Li [
33], which could achieve a better conversion between qualitative concepts and quantitative values. There are three numerical characteristics in the cloud model: expectation
, entropy (
), and hyper entropy (
). They reflect the mathematical properties of the cloud in overall conceptual space and the relationship transformation.
The above-mentioned “expectation” refers to the expectation that the cloud drops are distributed in the domain space, which is the most representative point of the qualitative concept and is the most typical sample for quantifying this concept.
The entropy referred to above means that the concept of “entropy” was originally used as a state parameter to describe thermodynamics, and has since been introduced into statistical physics, information theory, complex systems, etc., to measure the degree of uncertainty. In the cloud model, entropy represents the measurable granularity of a qualitative concept; the higher the entropy, the more macroscopic the concept usually is, and it is also a measure of uncertainty of a qualitative concept, which is determined by the randomness and ambiguity of the concept. On the one hand, En is a measure of the randomness of a qualitative concept, reflecting the discrete degree of the cloud drops that can represent the qualitative concept; on the other hand, it is a measure of the either-or nature of a qualitative concept, reflecting the range of values of the cloud drops that can be accepted by the concept in the domain space. Using the same numerical feature to reflect randomness and ambiguity also necessarily reflects the correlation between them.
The super entropy surrogate above refers to: the uncertainty measure of entropy, i.e., the entropy of entropy, determined by both the randomness and the ambiguity of entropy. It reflects the cohesiveness of each value subordinated to the degree of this linguistic value, i.e., the cohesiveness of the cloud drops. The greater the super entropy, the greater the dispersion of the cloud, the greater the randomness of the affiliation, and the greater the thickness of the cloud.
Cloud theory is a new theory for the analysis of uncertain information. It consists of three parts: cloud models, uncertainty inference, and cloud transformations. Cloud theory combines qualitative analysis and quantitative computation. It can be used to deal with the uncertainty of properties that are a combination of randomness and ambiguity. Clouds in space consist of a series of cloud droplets, which look like clouds from a distance and meta-edges from a closer view. Clouds have three numerical characteristics: expectation, annoyance, and superdigit. The expected value is the central value of the concept in the domain of the argument, fully subordinated to the qualitative probability; the cloud droplet is a measure of the fuzziness of the qualitative concept; the larger its value, the larger the range of values accepted and the fuzzier the concept; the super rate reflects the degree of dispersion of the cloud droplet; its value is larger, subordinated to the greater the random dispersion.
In quantitative domains expressed in precise numerical terms in in which qualitative concepts exist located in the quantitative domain, while defining the qualitative concept of one random realization as , then there is a quantitative value if satisfies , where and the determinacy of for satisfies .
The basic operation of cloud model can be summarized as follows [
33]:
4.2. Calculation of Weights
AHP method is a subjective weight method which can reduce the judgment matrix consistency conditions and repeat the construction workload. The method transforms the matrix under the principle of the consistency test, ensuring the calculation is concise and adapted to practice. The basic idea of this method is to perform matrix operations on the elements
of the judgment matrix A to make them satisfy the consistency test rule. Assuming that the relevant experts make the relative importance, the matrix is based on the way in
Table 1.
The main calculation steps of the AHP method are shown as follows:
- (1)
Construct the judgment matrix , satisfying , .
- (2)
Transform matrix A to the compatibility matrix , where , and satisfies , and .
- (3)
Calculate the weights
where
.
Entropy is an objective weighting method which is based on the method of measuring information uncertainty in information theory, and entropy is the indicator used to measure information uncertainty. The higher the entropy value, the smaller the total amount of information contained, and the lower the impact on the evaluation result, the lower the weight of the corresponding indicator.
If there are
objects to be evaluated and
investment efficiency evaluation indicators in the process of comprehensive investment efficiency evaluation of pumped storage power plants in the regional grid, then the original investment efficiency assessment index data matrix
can be established
where
means the values of the indicator of the index
of the index
investment efficiency evaluation indicator of the
th object to be evaluated the first
of the object to be evaluated.
is the indicator value of the investment efficiency evaluation indicator.
The steps for determining the weight of each indicator using the entropy weighting method are as follows:
- (1)
Data standardization: In practice, the units of different pumped storage power plant investment efficiency evaluation indicators are inconsistent, so in order not to let the units of indicators have an impact on the final evaluation results, it is necessary to carry out the dimensionless processing of investment efficiency evaluation indicators, and the normalized sample of indicators is recorded as .
- (2)
Based on the normalized data matrix
to calculate the weight
from
indicator under
evaluation object:
- (3)
Calculate the entropy value, calculate the entropy value of the
entropy value of the evaluation indicator
.
If , then make thus making .
- (4)
Calculation of the coefficient of variation, calculation of the coefficient of variation of the
coefficient of variation of the evaluation indicator
.
- (5)
Calculate the weights, then the weight
of the
evaluation index can be obtained from the coefficient of variation of each evaluation index.
In the calculation of indicator weights, both objective weights entropy and subjective weights BWM are difficult to comprehensively consider all the information of the indicators. In order to make the final weights not only reflect the subjective but also show the objective nature of the information, the combined weighting method can effectively achieve a combination of subjective and objective weights.
It is possible to effectively avoid the bias of single weight computations on the assessment results by the combined weight method. Since the subjectivity and arbitrariness of the traditional combined weight method are considered, a more scientific weight vector can be achieved by introducing game theory and also calculating combined weights with the minimum deviation of weights as the constraint.
Assume that there are L methods to gain the index’s weight. The steps to calculate the combined weight based on game theory are shown as follows:
Step 1. The set of weights
is constructed and assembled linearly.
Step 2. Implement an optimization based on the minimum deviation strategy, and the optimization conditions of the model are satisfied with Equations (14) and (15).
Step 3. Normalize the
through Equation (16) to gain the optimal weight coefficient
, and the final combined weight can be determined through Equation (17).
4.3. Integration
The fuzzy comprehensive evaluation, which is based on fuzzy mathematics, is primarily applied to be quantified for factors with vague situations or ill-defined boundaries. The method transforms qualitative evaluation into liquid assessment, which is highly practical and has great advantages for solving problems that are difficult to quantify. The process of fuzzy comprehensive evaluation is classified in the following three main steps:
Step 1. Build the evaluation vectors at the first stage
.
Step 2. Figure out the second level assessment matrix
.
In which is the weight of each assessment standard inside each group.
Step 3. Overall assessment factor calculation.
In which, means the first level of the weight of the criterion.
In this paper we firstly utilize the methodological introduction above to construct a set of decision frameworks involving “information collection and processing calculation of index weights comprehensive result integration” for analyzing the investment efficiency of pumped storage power plants.
Firstly, we propose a cloud model to calculate the affiliation of indicator attributes in the corresponding performance classes; it can reduce the negative impact of random and fuzzy influence in the information transformation process. After expanding the embrittlement value range of different levels into the cloud model, it can be directly seen that the different levels are not absolutely independent from each other, which makes the decision more consistent with the realistic situation.
Secondly, considering that objective weights are easily influenced by data and difficult in representing experts’ experience, subjective weights are too subjective to reflect data values. Therefore, we propose a weight analysis method that combines objective as well as subjective weights. This method uses the compatibility matrix method and the entropy method to find the subjective and objective weights of the indicators, respectively. In order to realize the scientific integration of different weighting results, use the game combination weighting method to obtain the combination coefficients oriented by the minimum deviation weights, and then calculate the comprehensive weights of the indicators. The game combination weighting overcomes the traditional combination weights which includes arbitrariness brought by the artificially given coefficients; it can improve the scientific of the decision-making process and results.
Finally, the decision matrix and index weights are integrated. Comprehensive fuzzy evaluation is based on fuzzy mathematical theory, which can prevent fuzzy distortion of decision results from interfering with integration. By integrating the affiliation degree of each indicator in the corresponding level with the importance of the indicator, we can finally obtain the affiliation degree of each solution in the corresponding performance level, and determine the final decision result according to the principle of maximum affiliation.
5. Case Analysis
5.1. Background Information
In order to verify the validity of the model and method, we collected data from six regional grids, including North China, Northeast China, East China, Central China, Northwest China, and South China, which are based on the investment efficiency evaluation index system for pumped storage power plants constructed above. We used the data mainly from “China Electricity Industry Annual Development Report 2019” as well as relevant power enterprises and statistical yearbooks. After processing the basic data, the corresponding indicator data of six regional grids in 2018 are obtained as shown in
Table 2. The vertical axis of the table represents the brother indicators mentioned above in the article, and the horizontal axis represents the different regions of China. Data detail the construction of different indicators in different regions of China in 2018, laying the foundation for calculations and analysis in subsequent papers.
To determine investment efficiency attribution of pumped storage power plants in different regional grids, it is necessary to determine the efficiency status of investment efficiency assessment index. Based on the investment efficiency assessment index system established by this article, divide the efficiency level of the index into five levels by setting up an expert group. Based on the analysis of the characteristics of the index, the expert group divided the corresponding value interval for each evaluation level. Finally, classify each indicator of standard boundaries of pumped storage power plants’ investment efficiency evaluation as shown in
Table 3.
5.2. Benefits Assessment
Although the above gives different efficiency levels boundaries delineation of the evaluation indicators, it is important to note that the different efficiency levels are not clearly independent and random in real life, but the overall trend can be considered independent. To avoid the negative impact of this double ambiguity on decision accuracy, here we translate the interval values in the traditional constraints into the cloud model with expectation, entropy, and super entropy. With Equation A, we can obtain the normal cloud model eigenvalues of each evaluation index as shown in
Table 4.
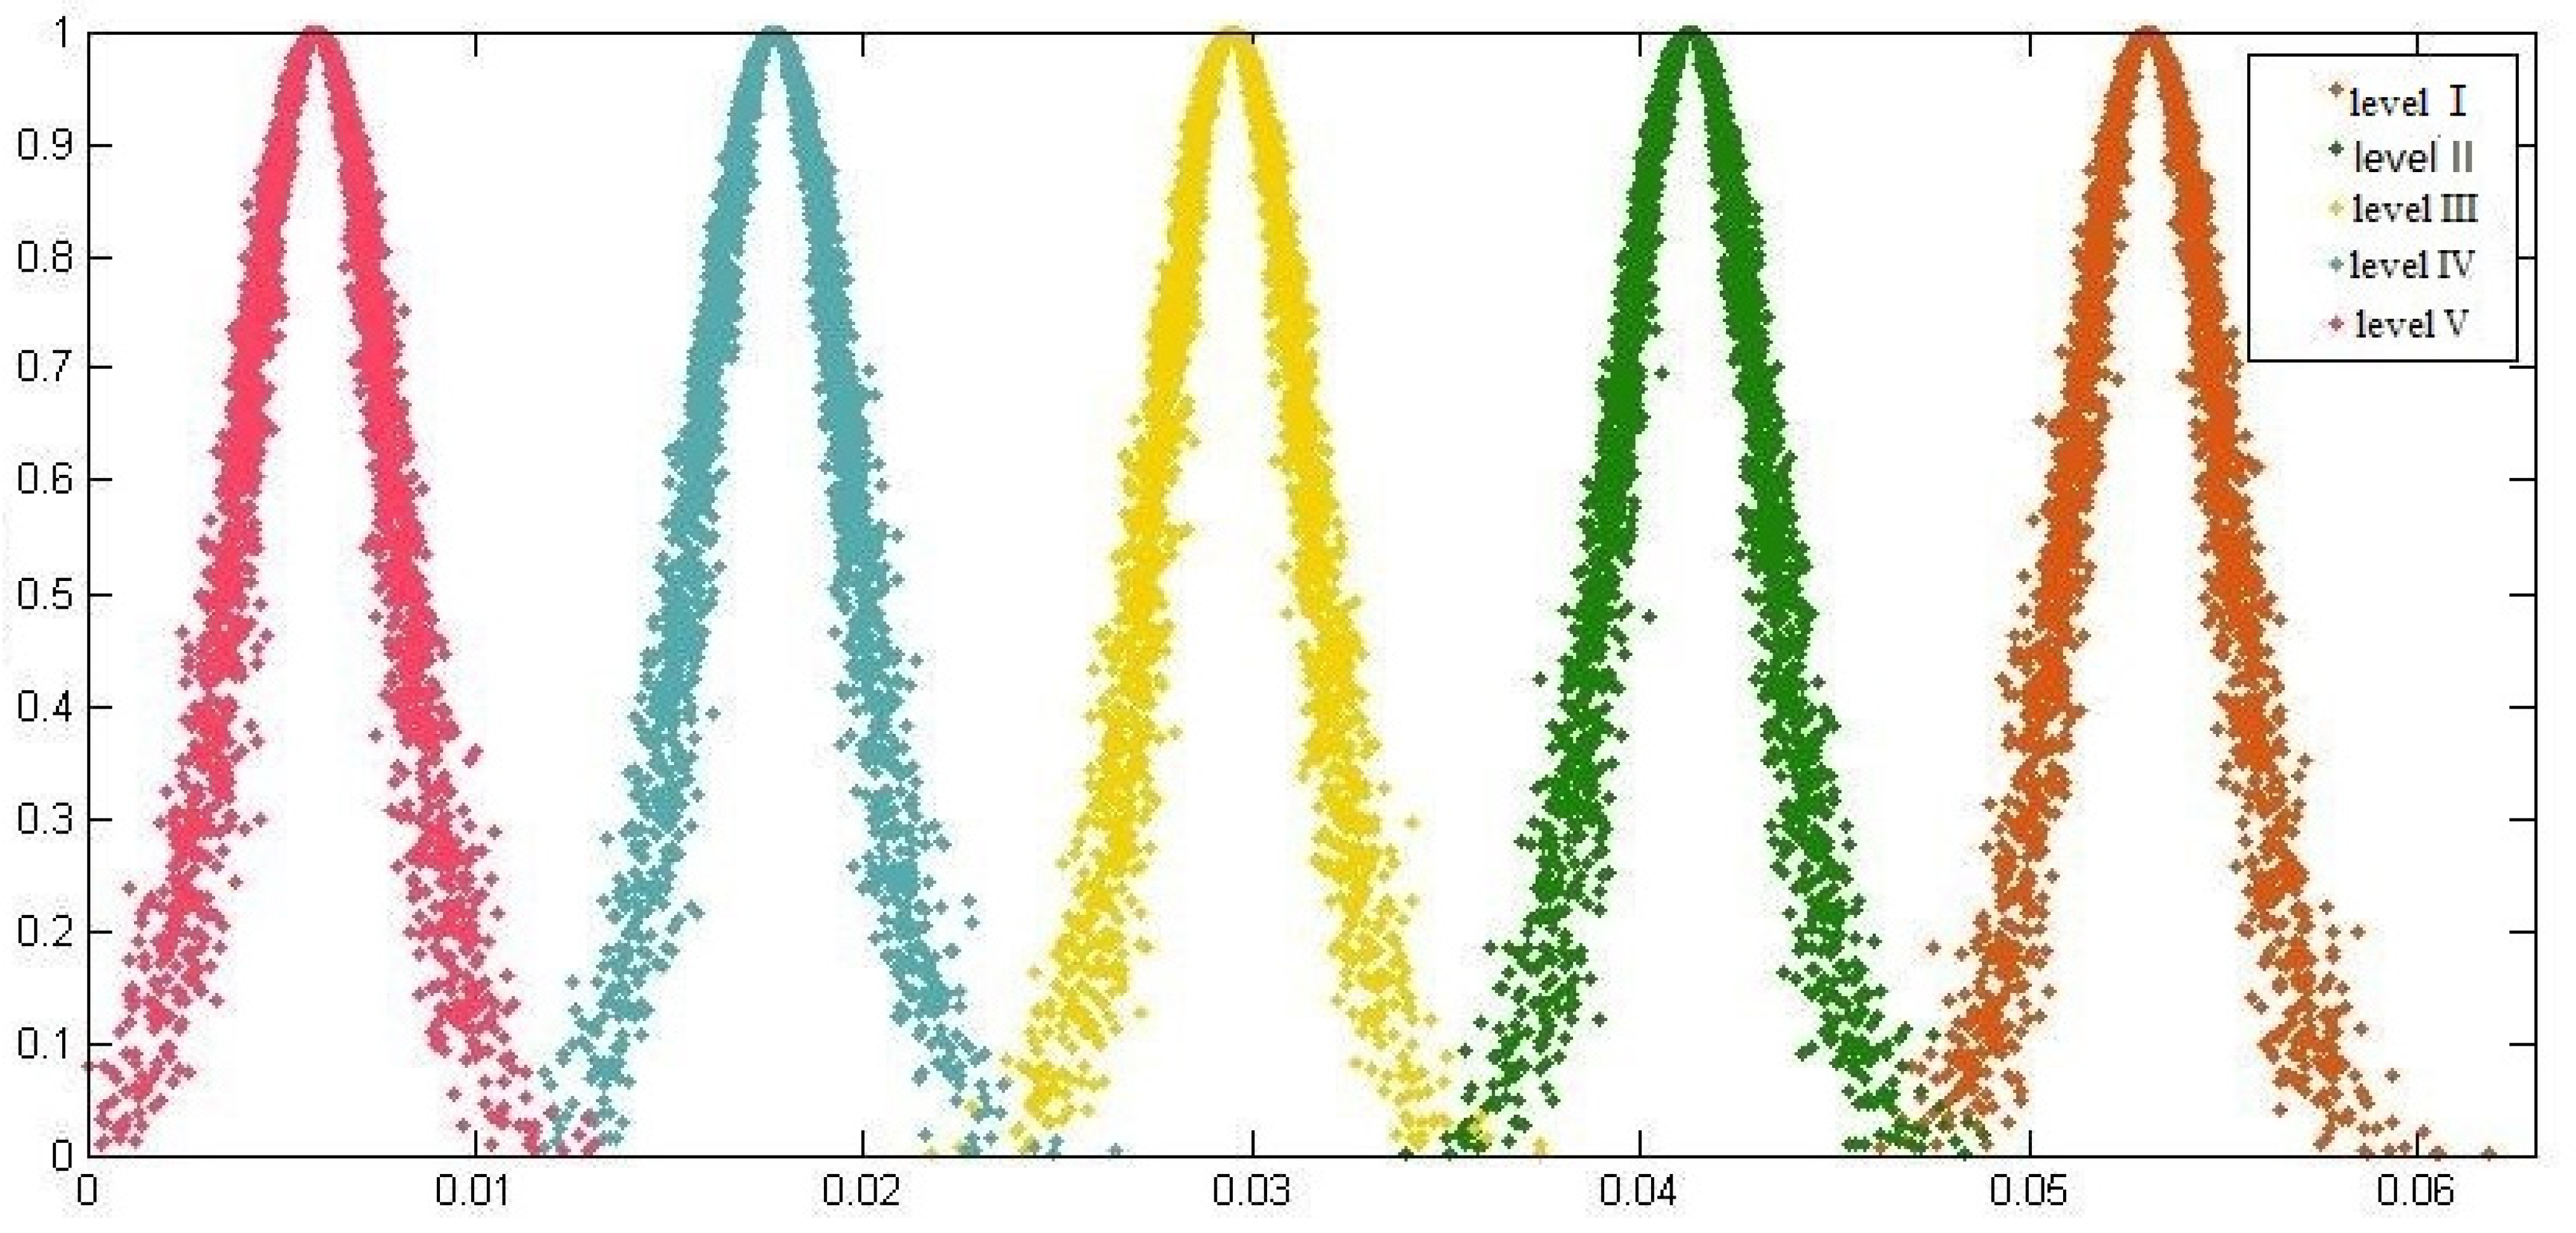
In order to see the relationship between the standard clouds of different levels of indicators more obviously, we give a viewable view of the risk level cloud model of X1 here and use MATLAB to obtain the standard cloud diagram as shown in
Figure 2 after setting the number of clouds drops N = 5000.
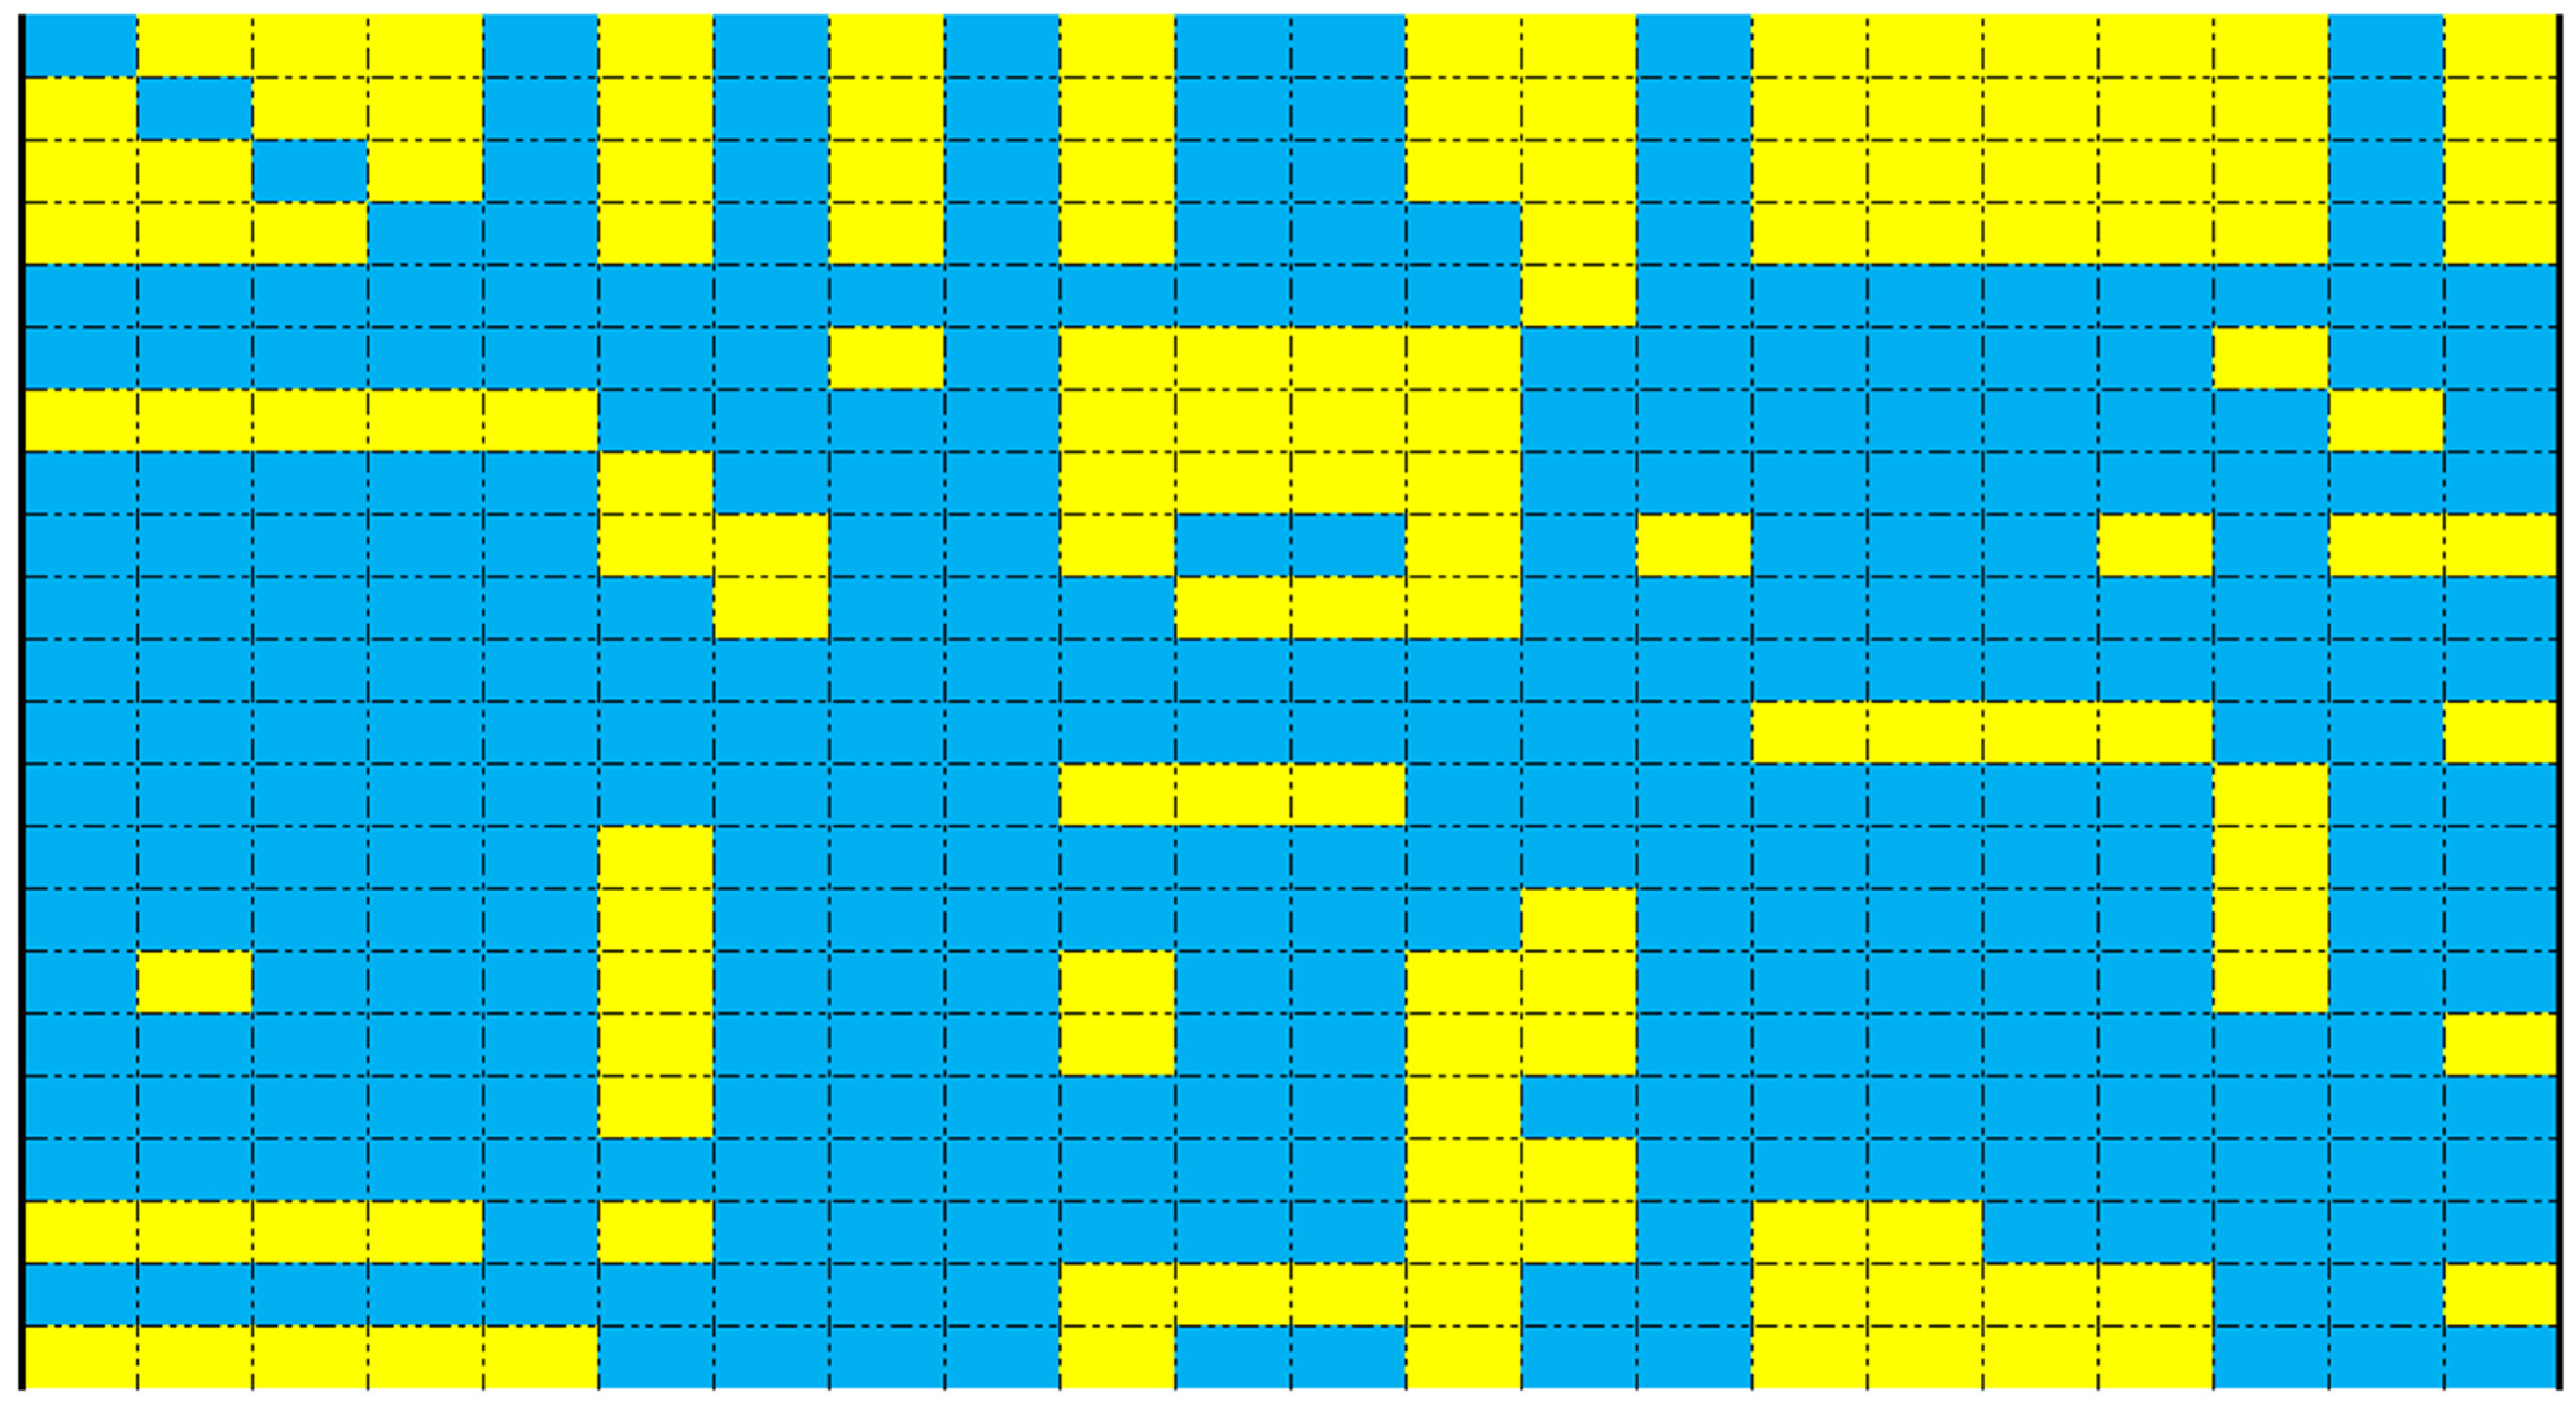
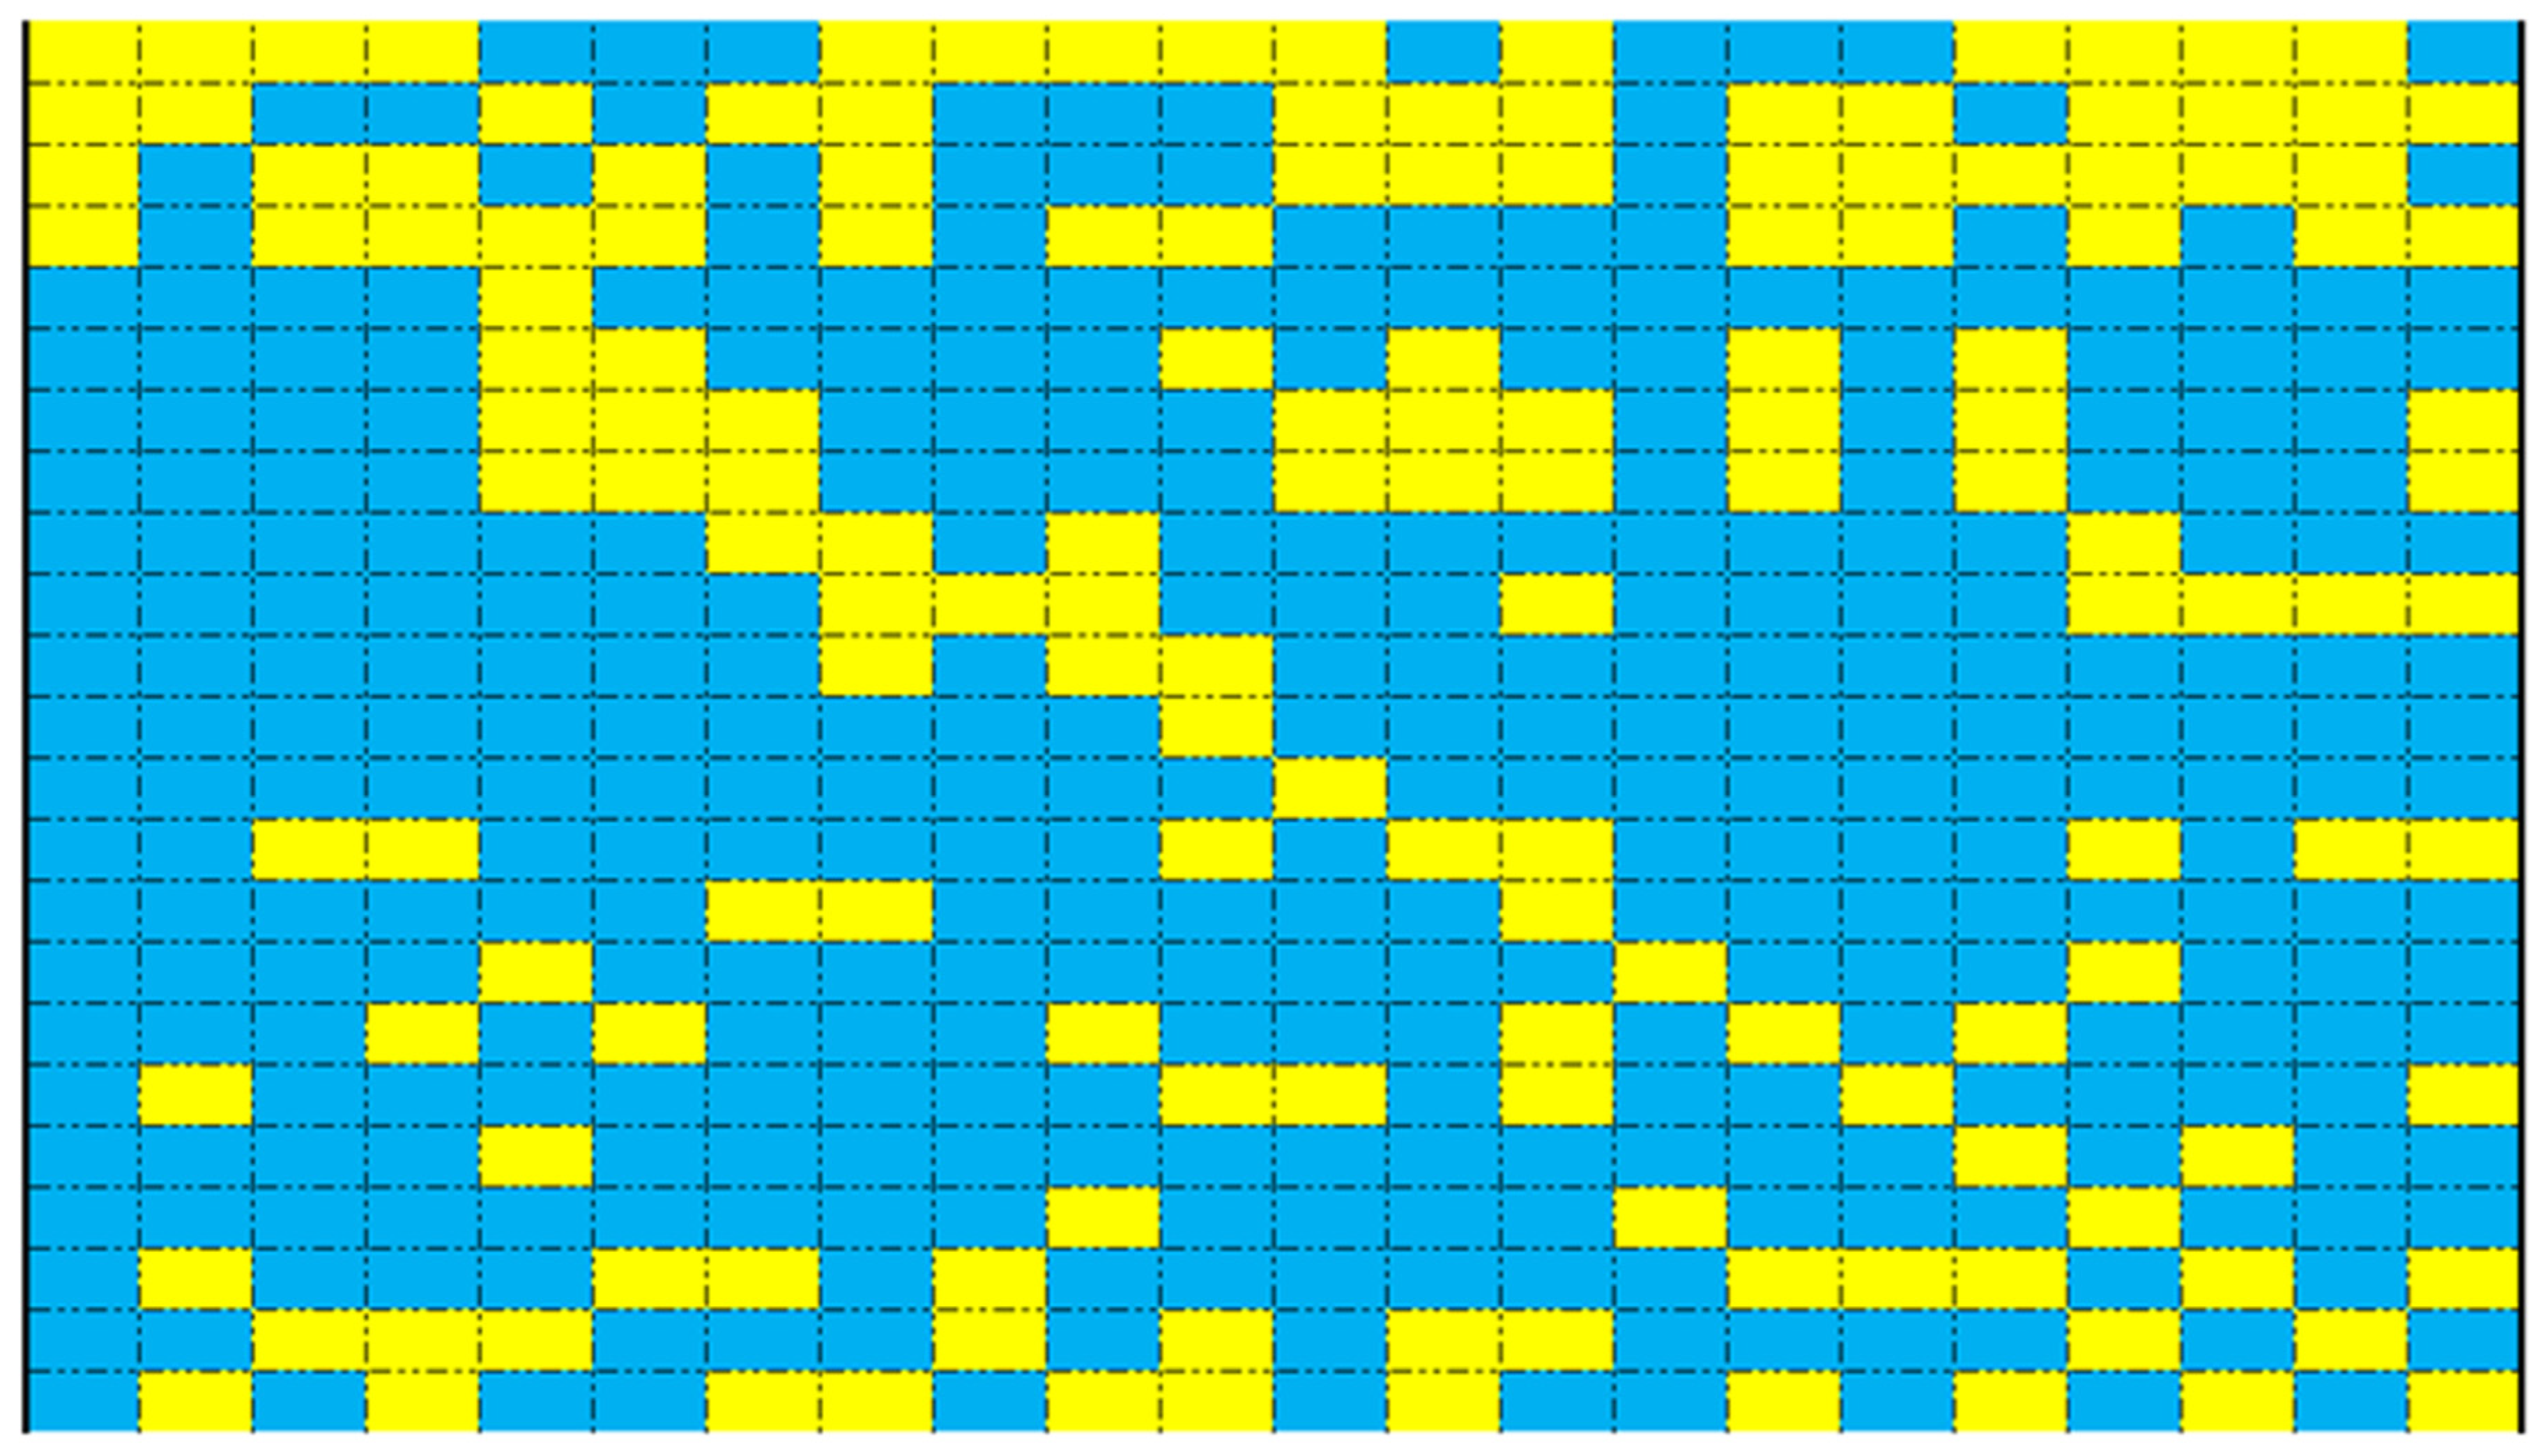
After obtaining the different levels of standard clouds for each pumped storage power plant’s investment efficiency assessment indicator, based on index decision information and cloud criteria, the cloud generator can calculate the similarity of each efficiency evaluation index for each regional power grid that corresponds to the normal cloud model’s different level. The similarity matrix obtained for Eastern China, for example, can be shown in
Figure A2 (see
Appendix A). The rest of the regions can be seen in
Table 5.
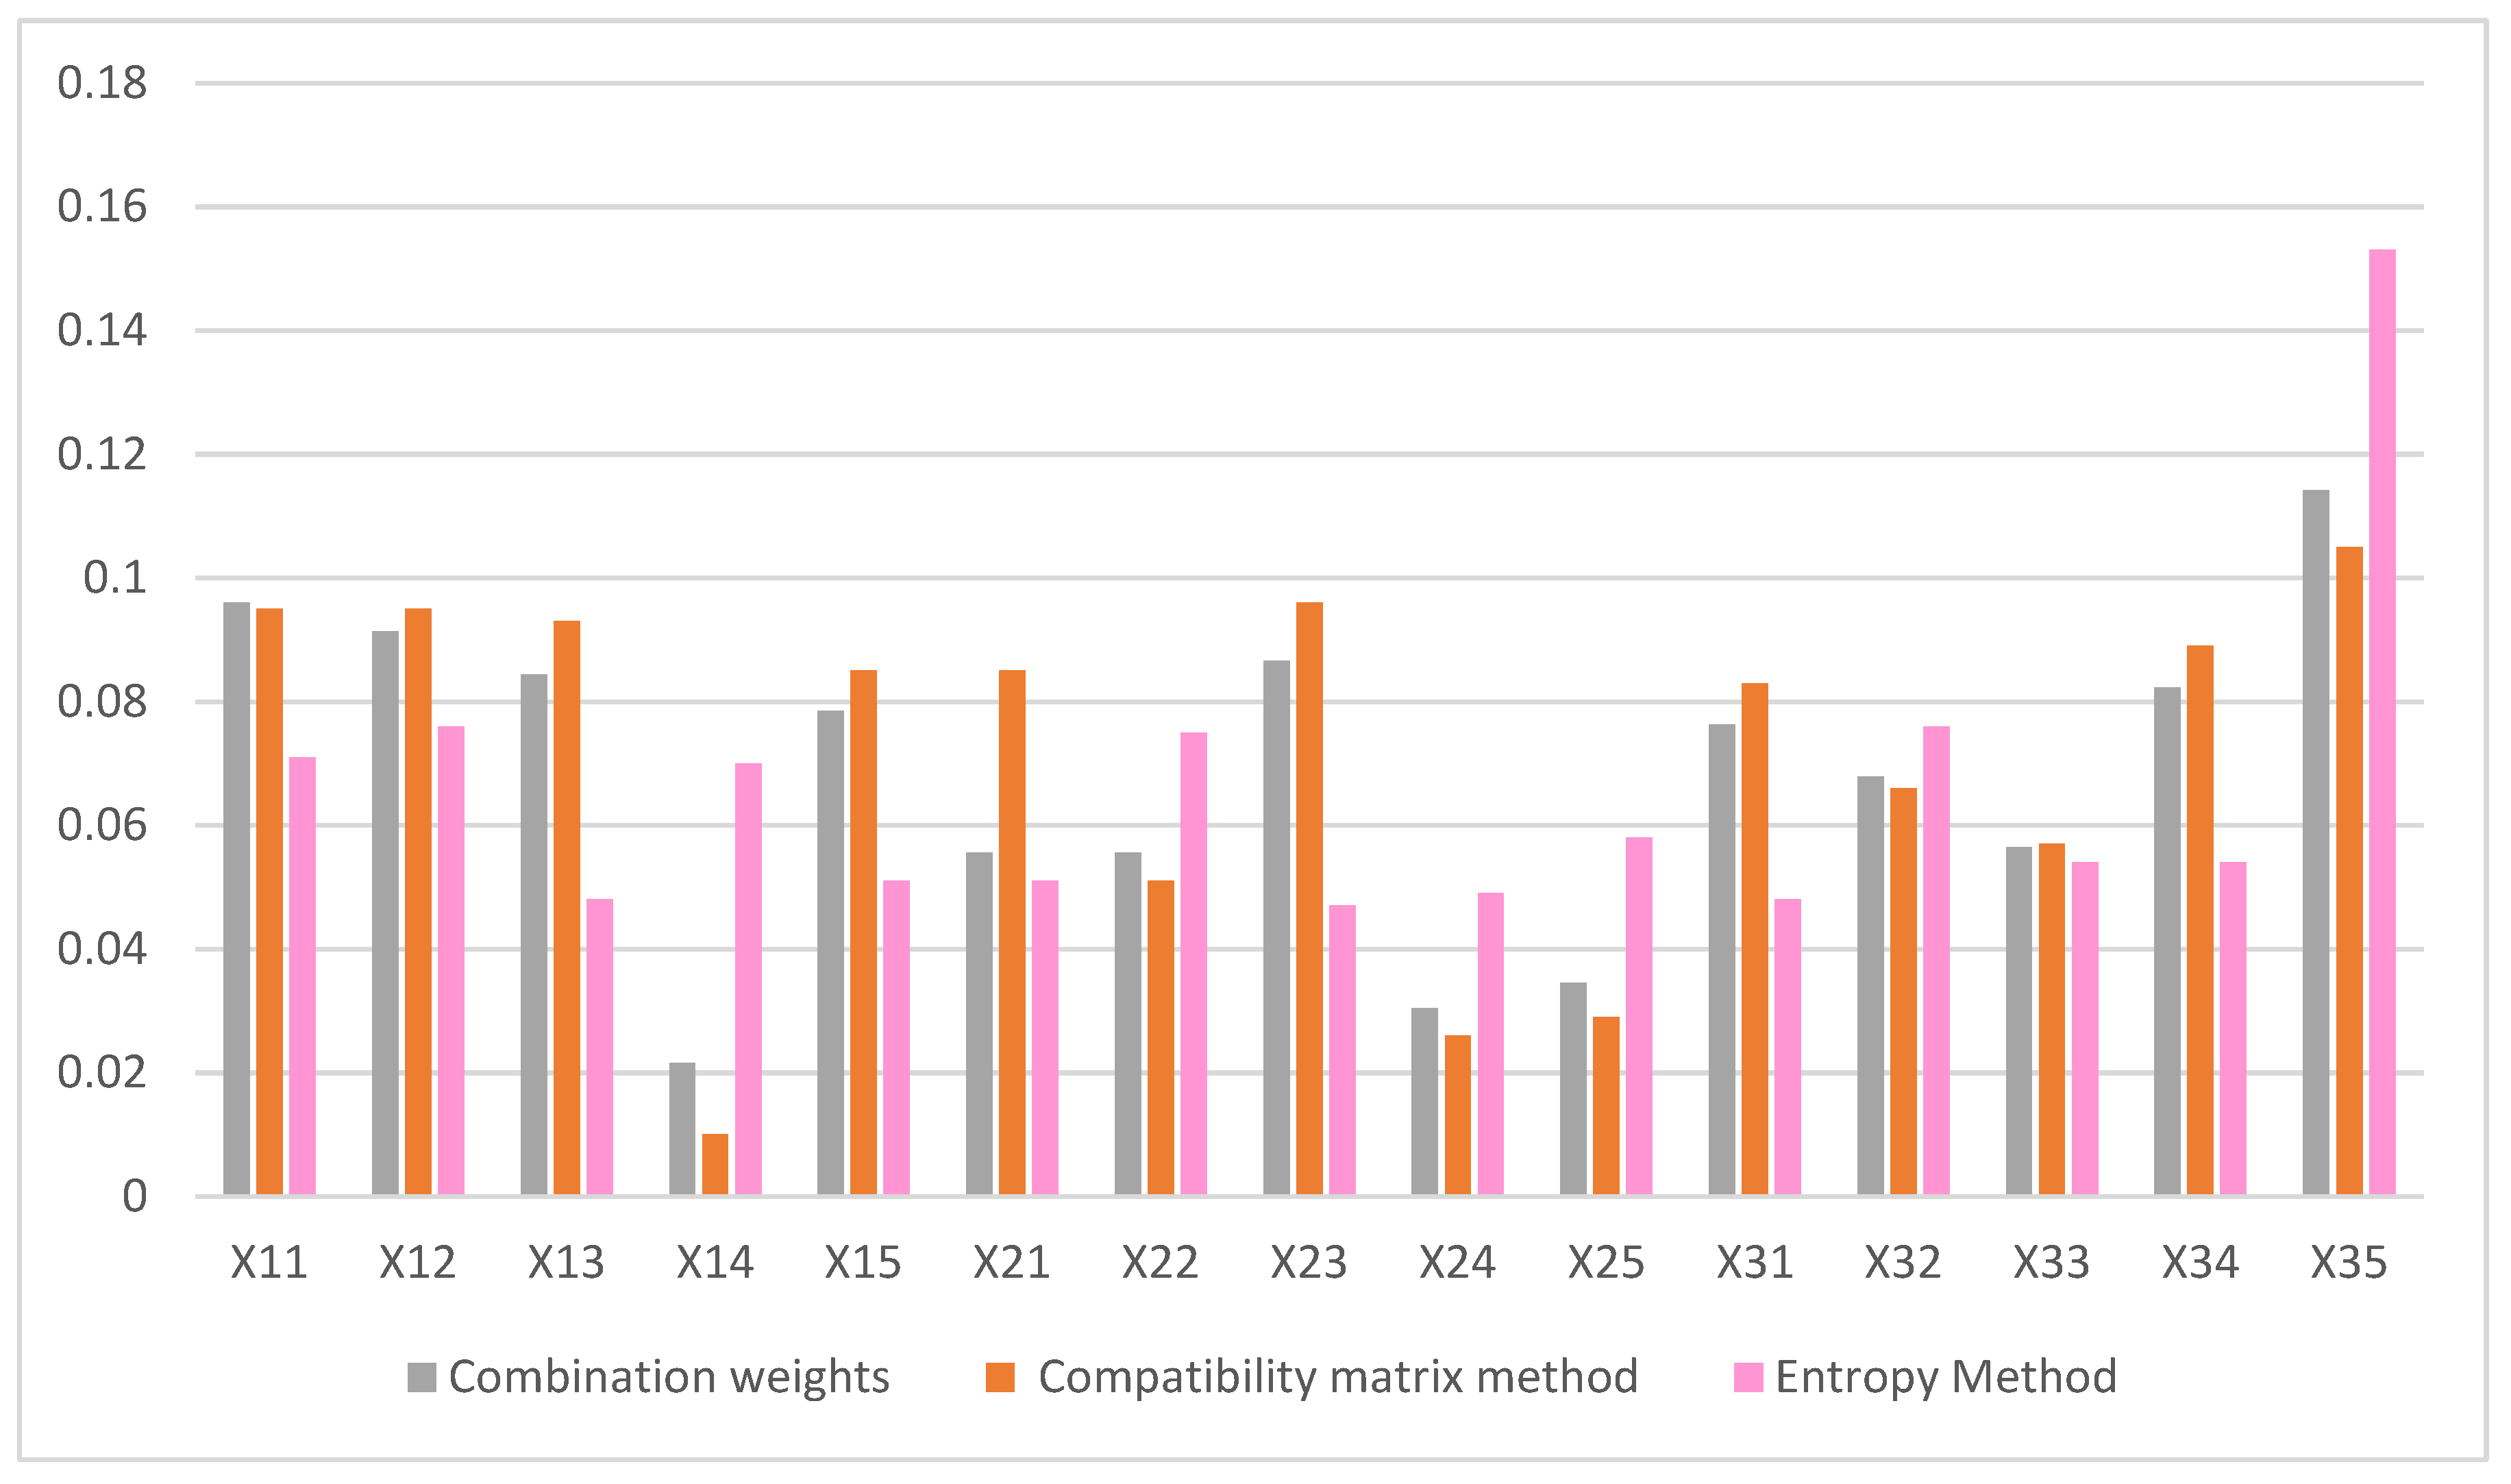
Firstly, we use the investment risk index in six regional grid pumped storage power plants data above, calculate the weights using the entropy weight method and compatibility matrix method, respectively, and combine the above two weights based on the game combination weight method. Among them, the combination coefficient is 0.2 for the entropy weight method and 0.8 for the compatibility matrix method to obtain the combination weights. The results of the various weights calculated are shown in
Figure A3.
Accordingly, in order to calculate the affiliation degree of pump storage investment efficiency in regional grids on different efficiency levels, the similarity matrix of index levels and index weights of each region can be integrated based on the principle of fuzzy synthesis, using formula A to perform a comprehensive calculation between the similarity matrix and weights.
Finally, the assessment results of pumped storage power plant investment efficiency in each regional grid can be obtained as shown in
Table 6. According to the principle of maximum affiliation, the rank with the highest affiliation value is the final assessment result of the pumped storage power plants’ investment efficiency.
As can be seen from
Table 6, max value for North China region is level 3 at about 0.22059. and the Northeast China region, East China region, Central China region, Northwest China region, and Southern China region are getting highest points at level 3, level 1, level 3, level 5, and level 5 at about 0.192539, 0.195622, 0.257912, 0.173761 and 0.21747, respectively. The investment efficiency of pumped storage power plants is not consistent across different regions, with Northwest and South regions being V (high efficiency), North, Northeast, and Central China regions being III, and East China region being I (low efficiency). Combined with the affiliation values, the investment efficiency of these five regions is ranked as “Southern China region > Northwest China region > Central China region > North China region > Northeast China region > East China region”.
According to the past conclusion, the South region of China has the best score in terms of investment efficiency results, while the East China region has the worst results in terms of investment efficiency scores for pumped storage power plants. As a result, the South region’s score on maximum system load (X21) is much higher than the other regions’ scores, and the weight of the indicator maximum system load (X21) is relatively large. This is a favorable condition for the outperformance of other regions. On the other hand, East China region not only scores lower in maximum system load (X21), but also scores less well in proportion to installed wind power capacity (X12), which has more weight. Therefore, it has the lowest score.
5.3. Investment and Development Advice
Planning for pumped storage power stations should be done considering the energy situation of each regional power grid, different development trends, and different characteristics regarding the supply and demand of electricity, and a timely analysis of changes in pumped storage power stations within each regional power grid should be completed. With further wind power and photovoltaic new energy sources’ large scale development of grid-connected power generation, the new functional pumped storage power plants’ positioning shape should be reasonably planned. In addition, nuclear power development scale of coastal provinces and cities continues to increase, and the scale of power delivery in the Western region and East central region continue to increase. On this basis, reasonable positioning of pumped storage power stations can be planned with full consideration of the economic and social development level, power supply structure, resource endowment and development of each region, and the functional pumped storage power stations’ positioning of each grid can be clearly defined, which will help to improve the level of pumped storage power station functions.
As the industrial structure of the regional power grids adjusts, the load characteristics change and the demand for interregional power exchange increases, so demand for pumped storage power stations in the regional power grids will also increase. Therefore, on the basis of the existing pumped storage power station selection, it is necessary to promote the next batch of pumped storage power station selection and planning work in the regional power grids as soon as possible, so as to increase the reserve of pumped storage power station planning sites in the regional power grids and ensure the construction of pumped storage power stations in an orderly manner. The need for diversification of pumped storage power station investment bodies will also increase, so it is vital to mobilize all parties to invest in the pumped storage power stations’ construction and promote pumped storage power station investment diversification to accelerate the pace of pumped storage power station construction. In order to promote a market-oriented development trend of pumped storage power stations, market bidding can be adopted for the pumped storage power station projects’ owner arrangement in some regional power grids; it can promote the investment of the pumped storage power station market and construct this market better.
6. Conclusions
In this paper, pumped storage power plants’ investment efficiency analysis is carried out at the operational demand level. Firstly, pumped storage power plants’ investment efficiency factors are sorted out from the perspective that the regional grid operational demand affects the function of pumped storage power plants, and is based on the explanatory structural model analysis of efficiency factors to obtain the investment efficiency evaluation index system. Secondly, subjective weights (compatibility matrix) and objective weights (entropy method and AHP method) for game combination are used to specify the importance of each efficiency indicator. The weights of the indicators X11–X35 are 0.047, 0.162, 0.134, 0.334, 0.102, 0.9134, 0.9500, 0.314, 0.898, 0.006, 0.230, 0.138, 0.146, 0.378, 0.389, respectively, where the highest value represents the indicator of maximum system load (X21), while the proportion of incoming power system (X15) comes second, which indicates that we should pay more attention to these two influencing factors in our future investments.
Then, in order to reduce the distortion of decision information in the qualitative and quantitative conversion process, use the cloud model to process indicators’ efficiency level to cope with the fuzziness and randomness. Integration of indicators’ cloud affiliation is performed in each efficiency criterion by using the fuzzy comprehensive evaluation method, and based on the principle of maximum affiliation, the investment efficiency level of the project is determined. Ranking the investment efficiency of each region by the determined level of project investment efficiency yields the results of Southern China region > Northwest China region > Central China region > North China region > Northeast China region > East China region. This means that the investment benefits of investing in pumped storage power plants may vary from region to region. From the results, Southern China region has the highest benefit and Northeast China region has the lowest benefit. Finally, we take some suggestions for the development of pumped storage power plants in regional grids and make an outlook for the future development of pumped storage power plants.
This paper provides a theoretical reference for clarifying the functional positioning of pumped storage power plants and making rational investment decisions, but it also has some shortcomings. On the one hand, this paper only evaluates the investment efficiency of pumped storage from the viewpoint of grid operation, and other perspectives are needed, such as sustainability and synergy, to generate universal investment decision results. On the other hand, the mathematical model constructed in this paper is derived from multi-attribute decision theory, which does not suggest that the decision model is fixed. In reality, it needs to be adjusted according to specific needs and preferences. Then, building pumped storage power plants has a long construction period, and this paper does not take into account the time cost of building pumped storage. Finally, there are many types of energy storage, and locations suitable for building pumped storage power plants may also be suitable for building other types of energy storage power plants, so that building pumped storage power plants may not be the best choice. However, it is worthwhile to consider investment decision making. As we seek to address these shortcomings in the future, they are a continuation of the problems we face today.


