Abstract
Accessibility to public hospital services is crucial for healthcare provision, particularly in regions characterized by high tourist presence, such as the Mediterranean islands. This study aims to assess the accessibility of public hospital services in Mallorca, considering access time, the geographic distribution of the resident population, and tourist accommodations. A GIS-based analysis using optimal routing algorithms and the Gini index was conducted to examine the equity in the distribution of regional and reference hospitals across four Health Sectors: Ponent, Migjorn, Tramuntana, and Llevant. The findings reveal that accessibility to regional hospitals is generally favorable, with average access times of 18, 16, 15, and 26 min, respectively, without surpassing 60 min. Accessibility to referral hospitals is comparatively lower, with 31,499 individuals located more than 1 h away. Moreover, 56% of the population is within 10 min from the referral hospital, and only 1.6% require more than 50 min to reach the hospital. Accessibility differs among Health Sectors, with Llevant experiencing the most significant impact. The hospital distribution in Mallorca is deemed to be adequate to serve residents, tourists, and the road network. Although limited in comparisons to other studies conducted in Spain, accessibility in Mallorca is fairly similar to Andalusia, Extremadura, and Catalonia. The study underscores the necessity for health infrastructure planning in order to account for the distribution of resident and tourist populations to ensure efficient and equitable services, particularly in Mediterranean island environments with a substantial tourist presence.
1. Introduction
The right to health is fundamental in contemporary societies, and, in this context, the access to health services and hospitals is a matter of social justice and requires adherence to the principles of equity. Public health facilities are the consequence of the development of policies that ensure a cohesive and democratic social environment [1]. Public administrations must ensure that hospitals are accessible to the entire population, especially the most vulnerable divisions of the population [2], since better access to hospital facilities means a better quality of life for people, especially for the most socially disadvantaged groups [3]. The spatial distribution of health facilities will be linked to the range of services offered and the specialization of each facility, thus conditioning its location on the territory [4,5]. The tasks of health planning seek to offer better accessibility, coverage, social protection, quality of care, and greater user satisfaction [6]. These are key objectives of governments and societies in health matters [7]. Health geography is one of the branches of the geographic discipline that analyzes the spatial distribution of population health indicators, as well as the spatial and social accessibility of health services [8].
According to the World Health Organization, universal health coverage requires health services that are equipped with an optimal combination of skills and knowledge, that are close to the community, and that are equitably distributed at the territorial level [9]. In recent decades, numerous authors have developed studies based on geospatial tools, integrated in to geographic information systems (GIS), to assess the spatial distribution and accessibility to hospital facilities, primary care services, or specialized care [10], either from a more theoretical or methodological point of view [1,11,12,13,14,15,16]; from the point of view of planning and land use [8,17,18]; under a more focused prism in the search for spatial inequality [2,3,4,5,6,19,20]; by qualitatively assessing accessibility and/or availability [5,7,15,21,22]; or by simply making a general analysis of the state of accessibility in a given territory. The latter study type usually involves the spatial framework and is used to apply certain techniques for analyzing social inequalities or accessibility.
On a European scale, accessibility to the nearest health infrastructure is relatively good, with an estimated 82.5% of the population of Europe living within 15 min of the nearest hospital [23], with better accessibility in the most densely populated urban areas. However, at the opposite extreme, up to 89 regions have less than half of the population within these first 15 min, highlighting rural areas in the east and southwest of the continent, but also the interior of Spain and Portugal. However, this is not the case of the Balearic Islands, since, according to Eurostat [23], between 85 and 95% of the population would be within 15 min of a hospital, as would other Spanish provinces such as Malaga, Alicante, Valencia, Tarragona, and the three provinces of the Basque Country, all of them behind Madrid and Barcelona, which have between 95 and 100% of the population in this 15 min isochrone.
The scientific literature shows that the analysis of the accessibility of health facilities has been carried out in several autonomous communities of Spain, such as Madrid [17,24], Catalonia [13,14,25], Extremadura [26,27], Andalusia [1,24] or Aragón [4]. However, in the Balearic Islands, the analysis has been limited to the city of Palma and using exclusively public transport [11].
The study of accessibility through GIS is not limited to health geography. One of the areas where it has been most developed is in transportation geography, with accessibility being understood as the ability of a place to be reached from other areas [28,29] and being determined by the spatial distribution of potential destinations [30]. Within accessibility, “physical accessibility” can be differentiated from “socioeconomic accessibility” [31], although, in practice, according to Díez Cornago and Escalona Orcao [4], it is usual to analyze physical geographic accessibility, which is closely related to distance, physical, temporal or economic, among others. In this study, temporal accessibility is taken into account, understanding time as the measure of travel cost from an origin to a destination and representing accessibility in isochrones [30,32].
This study presents a significant contribution to the domains of geography, transportation, and healthcare equity by examining the accessibility of healthcare services in regions characterized by substantial tourist presence. Taking into account both the resident population and tourist accommodations, the research broadens the scope of healthcare accessibility analysis and sheds light on the equitable distribution of healthcare services, providing a direction for subsequent health infrastructure planning initiatives.
A regional health planning-based accessibility model was employed in this investigation, yielding results particularly pertinent to Mediterranean islands such as Mallorca, where the tourism industry profoundly influences the planning of infrastructure and services. By comparing the accessibility of hospital services in Mallorca with other Spanish regions, including Andalusia, Extremadura, and Catalonia, the study offers valuable insights into regional disparities in healthcare accessibility, thereby informing future planning endeavors.
This paper aims to further explore this issue, analyzing the accessibility of public hospitals on the island of Mallorca, and evaluating their location in relation to the resident population on the island, as well as the potential population, obtained from the number of tourist vacancies in hotel accommodation and vacation rental housing.
2. Area of Study and Legislative Framework
This paper focuses on the island of Mallorca, the largest of the Balearic Islands, as the study area. The Balearic archipelago is located in the western Mediterranean basin and is a single-province autonomous community belonging to the Spanish State. Healthcare competence was transferred from the State Government to the Autonomous Communities by Law 14/1986. The Autonomous Community of the Balearic Islands is made up of four island administrative units corresponding to the islands of Mallorca, Menorca, Ibiza, and Formentera. Given the impossibility of evaluating accessibility by road to the autonomous reference hospital located on the largest island, Mallorca, from the other islands, this study focuses only on accessibility to the public hospitals on this island (Figure 1).
Figure 1.
Location of Mallorca in Europe.
In 1987, with the approval of Decree 34/1987 on health planning in the autonomous community of the Balearic Islands, the division of the autonomous health area was defined (Figure 2), creating the figure of the Basic Health Zone. This is mainly intended for primary care and family doctors. At a higher level, the union of Basic Health Zones leads to the creation of Health Sectors, which will have a purely operational and functional organization to streamline, rationalize, and bring healthcare as close as possible to the population, even in the hospital aspects, so that they functionally pivot around a basic or regional hospital that serves as an intermediate device between the primary care level and the regional hospital of reference [33], p. 2547. Finally, Health Areas are defined, which correspond to management, planning, and participation units. In this sense, the Health Areas are defined following the insular partition: Mallorca, Menorca, Eivissa–Formentera.
Figure 2.
Diagram of the health organization of the Balearic Islands according to Decree 34/1987 [34].
Mallorca is divided into 34 Basic Health Zones, which comprise Health Sectors: Manacor (where a regional hospital is located), Inca (where a regional hospital is located), and there are up to 4 Sectors in Palma. Since then, the Basic Zones and Sectors have been modified (Decree 122/2002; Law 5/2003; Decree 19/2004; Decree 12/2005; Decree 37/2006; Decree 59/2009; Decree 91/2010). However, it is Decree 59/2009 of September 18 which modifies the territorial health planning, where the new nomenclature of the Health Sectors and the Health Area of Mallorca is included, and from which the current nomenclatures and the ones used in this work are adopted: Health Sector of Llevant, Health Sector of Tramuntana, Health Sector of Ponent, and Health Sector of Migjorn.
The current regulation is Decree 16/2015, of 10 April, on the territorial health planning of the autonomous community of the Balearic Islands where the current territorial planning is definitively established and from which this study is carried out (Figure 3).
Figure 3.
Delimitation of the Health Sectors with their respective reference hospitals and the road network. Source: own elaboration based on CAIB [35] and CNIG [36].
The distribution of the population by Health Sectors is not equitable, as it corresponds to the distribution of the population in Mallorca (Table 1). It can be seen that more than half of the inhabitants are included in the Ponent Sector, followed by the Migjorn Sector, both of which account for 70% of the population of Mallorca, 581,951 inhabitants, including the city of Palma, the capital, and the main population center of the island with 419,366 inhabitants.
Table 1.
Health Sectors, Basic Health Zones, population and tourist sites. Source: own elaboration based on CAIB [35] and CNIG [36].
For its part, Mallorca has 399,619 tourist places regulated by the Conselleria de Turisme [35] which are mainly distributed along the coast, with the exception of the northeastern slope where the Serra de Tramuntana is located; its orography has not allowed for urban and tourist development, as has occurred along the rest of the coast (Figure 4).
Figure 4.
(a) Inhabitants per population center. (b) Tourist vacancies per population center and isolated establishments more than 250 m from a population center. Source: own elaboration based on CAIB [35] and CNIG [36].
3. Data Sources and Methodology
In this study, first of all, a cross-sectional analysis of the road accessibility from the population and tourist centers to the reference public hospital of the island of Mallorca, the Hospital de Son Espases, has been developed. Accessibility by private vehicle is evaluated through the road network, since it is the mode of transport most used by the population (54% of trips by residents in Mallorca are made by private transport, while tourists use private vehicles in 28%) [37]. The accessibility indicator used is the time of access by private vehicle, offering, in that way, a quantitative analysis.
Secondly, the accessibility of the population centers to the regional hospitals is analyzed, based on the definition of the Health Sectors. These are determined by the Decree of territorial health planning of the Balearic Islands (Decree 16/2015). In this way, the state of communications between the population centers and their respective health and commercial headwaters, in which the hospitals are located, is evaluated; thus, it is also possible to obtain the first image of the communications in each subregion (area of regional influence).
Finally, a study is made of the level of equity by calculating the Gini index in hospital distribution in relation to the distribution of the resident population, the tourist population, and the aggregate population (resident and tourist) in order to evaluate the social sustainability of public health services. Its disaggregated analysis allows for a better understanding of the distribution of equity [38,39] and inequalities. There are several references in the field of transport geography applying this method [32,39,40,41,42,43], using the formula of Rodrigue et al. [34]. The application of this approach in the evaluation of equity in the location of healthcare facilities is not significant and is limited to few works [2].
The methodology used follows patterns of other cross-sectional works [1,4,11,25,26,27] in which the transport network is defined, and, secondly, tools for calculating origin–destination matrices are developed using geographic information systems. These obtain the status of the accessibility to health services in different case study areas and legislative contexts, which are generally not taken into account to decide the offer node for each demand node.
3.1. Transportation Network
The Transport Network available from the National Center for Geographic Information (CNIG) is used [36]. This network structures the roads into 7 categories: “Road”, “Urban”, “Bicycle lane”, “Conventional road”, “Highway”, and “Motorway”. From these, only urban sections, conventional roads, highways, and motorways are selected, and a different speed value is given to each road typology, with some exceptions (Table 2 and Figure 5).
Table 2.
Types of roads and associated speed. Source: own elaboration based on Ayuntamiento de Palma. [44], CNIG [36], Consell de Mallorca [45], DGT [46].
Figure 5.
Ideal maximum speeds established for each road. Source: own elaboration based on Ayuntamiento de Palma [44], CNIG [36], Consell de Mallorca [45], and DGT [44].
The speeds assigned to each section correspond to the speed established by the competent public institutions. It is considered a free network without added impediments derived from traffic lights, pedestrian crossings, stops, intersections, or other elements that could hinder traffic, so that the analysis presented provides an ideal accessibility.
The average speed in urban stretches has been limited to 30 km/h, as established by the Consell de Mallorca [47] in accordance with the Dirección General de Tráfico [46] and in line with the European objectives of the 2030 Agenda. In the municipality of Palma, a speed of 30 km/h is established [44] as this is regulated in a very high percentage of streets.
As for conventional roads, the average speed established is 80 km/h. Although the General Traffic Regulations [46] establish the maximum speed for passenger cars as 90 km/h, it is considered appropriate to reduce this value to 80 km/h as it is more in line with the limitations of the island road network [4].
In relation to highways/motorways, the maximum speed established by the Dirección General de Tráfico is used [46], since it is set at 120 km/h.
Finally, there are three roads that must be treated differently: the Ma-10, the Serra de Tramuntana road that links Pollença and Andratx from east to west; the Ma-15, the Manacor road, which links Palma with this municipality (from the Nou Llevant area to the Manacor industrial estate); and the Ma-20, the Vía de Cintura (ring road) that goes around the more compact city of Palma. Firstly, on the Serra de Tramuntana road, the Ma-10 has been set at 60 km/h, unlike the rest of the conventional roads. For its part, the Ma-15, in its widened section, is limited to 100 km/h. In addition, finally, the Vía de Cintura Ma-20 has been limited to 80 km/h since February 2021 [45].
In order to obtain more realistic speeds, weighting parameters have been used according to the characteristics of each section, considering the slope, obtained from a Digital Elevation Model with pixels of 25 × 25 m [36], traffic circles, and average daily traffic (ADT) [47] (Figure 6a) as well as a generalized reduction in all roads, considering that it is not possible to complete the entirety of each section at the maximum allowed speed.
Figure 6.
(a) DMI by type of road. (b) Average slope classification of each stretch. Source: own elaboration based on CNIG [36] and Consell de Mallorca [47].
Table 3.
Weighting of speed as a function of slope.
Then, the AADT of each road is weighted, as shown in Table 4.
Table 4.
Weighting of speed as a function of the AADT.
For their part, traffic circles will represent a reduction in speed to 30% of the maximum speed. Finally, the speed of all sections of the road network is also reduced by 10%, obtaining the speed of each section by the application of the following Equation (1):
where s = road section; Sc = slope coefficient; AADTc = annual average daily traffic coefficient; Rc = roundabout coefficient.
Speed reduction coefficients = Maximum speeds × Sc × AADTc × Rc × 0.9
3.2. Demand and Supply Nodes
The demand nodes from which the displacements to the hospitals are calculated are the population centers of Mallorca from the “Populations V.1” file of the CNIG Download Center [36]. The location and population of the traditional and tourist nuclei are included. Since the population entities are presented as polygons, for simplification purposes they have been transformed into centroid points.
In addition, hotel establishments and vacation rental housing with their respective vacancies are included [35] in order to include the potential tourist population. These establishments have been grouped by each population center, with the exception of those located more than 250 linear meters from the nearest town, which are considered as entities without a population center and are included individually as demand nodes, together with the population center nodes.
The supply nodes correspond to the public hospitals: The Hospital Universitari de Son Espases (Palma), which is the reference hospital of the Autonomous Community of the Balearic Islands; the Hospital de Son Llàtzer (Palma); the Hospital Comarcal d’Inca (Inca); and the Hospital Comarcal de Manacor (Manacor). The data have been downloaded from the open data portal (Open Data) of the Autonomous Community of the Balearic Islands [35].
3.3. Applied Methods
The Network Analyst network analysis tools of ArcGis Pro© software version 3.0.2 were used, and the method is described below.
Once the transport network and the location of the demand and supply nodes have been created, a temporal cost matrix (origin–destination cost matrix) is calculated. This matrix provides the temporal/spatial distance between the demand nodes (populations) and the supply nodes (hospitals) through the optimal least cost route.
This operation is applied to each of the Health Sectors with the corresponding county hospital, and in the Health Area with the Son Espases Hospital. As a result, the time it takes for each population entity to reach the corresponding hospital is obtained.
Subsequently, the Kriging interpolation method (2) is applied, based on the access times from each population entity to the corresponding hospital in order to obtain a map of isochrones or service areas of each hospital in units of time [48]. The cells of the interpolation grid are 25 × 25 m.
where Z(Si) corresponds to the access time at location i, λi is the weight assigned to i based on its spatial location, S0 is the prediction location, and N is the number of measured values.
The calculation of the Gini index is made considering the access time from each population to the corresponding hospital. It is an indicator initially designed to evaluate inequality in the income distribution of a country’s citizens, but it can also be used to evaluate other inequalities, specifically in the field of transport [34,39,41,42]. This index ranges from 0 when there is a perfect distribution—and, in this case, if all populations had the same access time—to 1 when there is a totally unequal distribution, where a single population concentrates all accessibility [34,42]. The Gini index is calculated with the following Equation (3):
where X corresponds to the proportion of nuclei, and Y to the access time from each nuclei to the corresponding hospital, while N equals the number of elements in the series.
This index is complemented by the Lorenz curve, which represents the equity of the cumulative distribution of access time values. This curve is compared to the perfect equity line, in which each element has the same contribution to the total sum of the variable’s values and the Gini index is equal to 0. Thus, the Gini index is defined graphically as the space contained between the Lorenz curve and the line of perfect equity [34].
As a recap of the followed methods, Figure 7 shows the workflow of the study. Therefore, first of all, all input data have been prepared and adapted to our needs, such as aggregating demand nodes and supply nodes, as well as classifying slope values and AADT. Secondly, a preprocessing step has been developed, where the network speed has been corrected and an origin–destination cost matrix was reckoned using the demand and supply nodes previously prepared. Finally, results have been calculated using the access time matrix obtained from the o–d cost matrix. Using this matrix, a Kriging interpolation was applied to obtain an isochrones map, and also the Gini index and Lorenz curves were calculated in order to analyze equity in the access to public hospitals.
Figure 7.
Workflow structure followed in the methodology.
4. Results and Discussion
4.1. Temporary Accessibility in the Health Area
The result of calculating the access time from each population entity and isolated tourist establishments to the Son Espases University Hospital, the reference hospital, and the regional health center configures a time cost matrix.
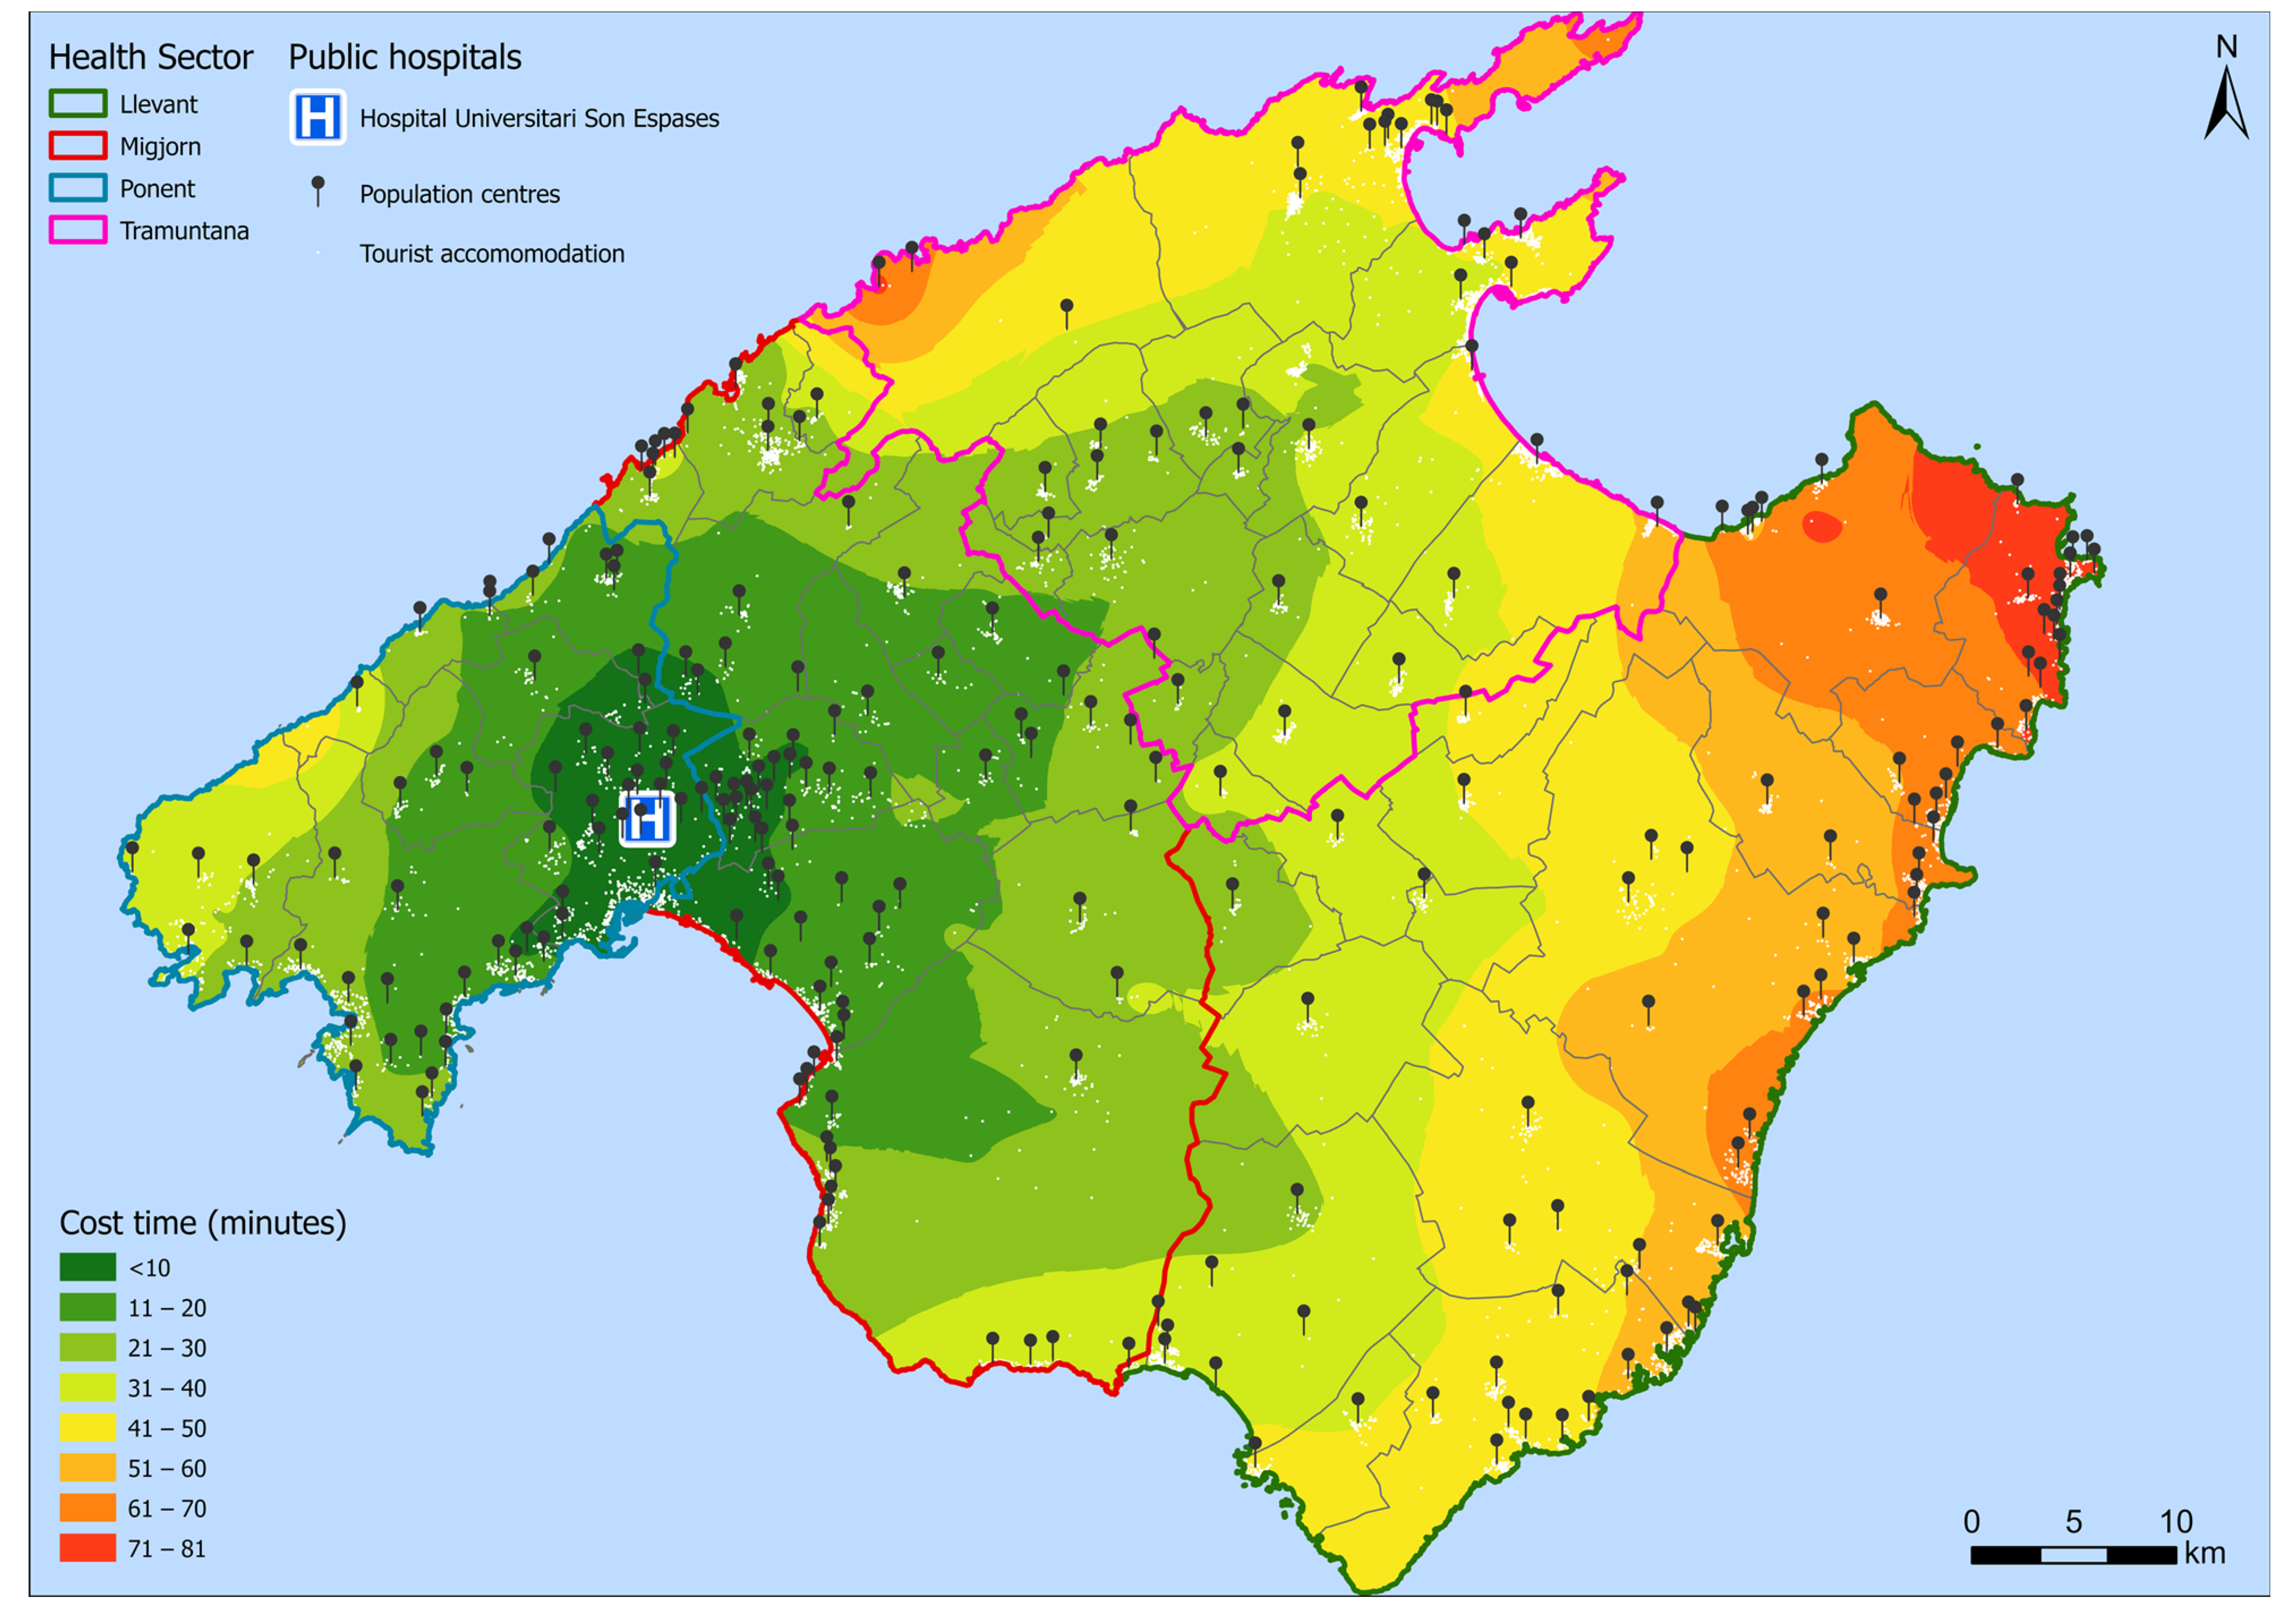
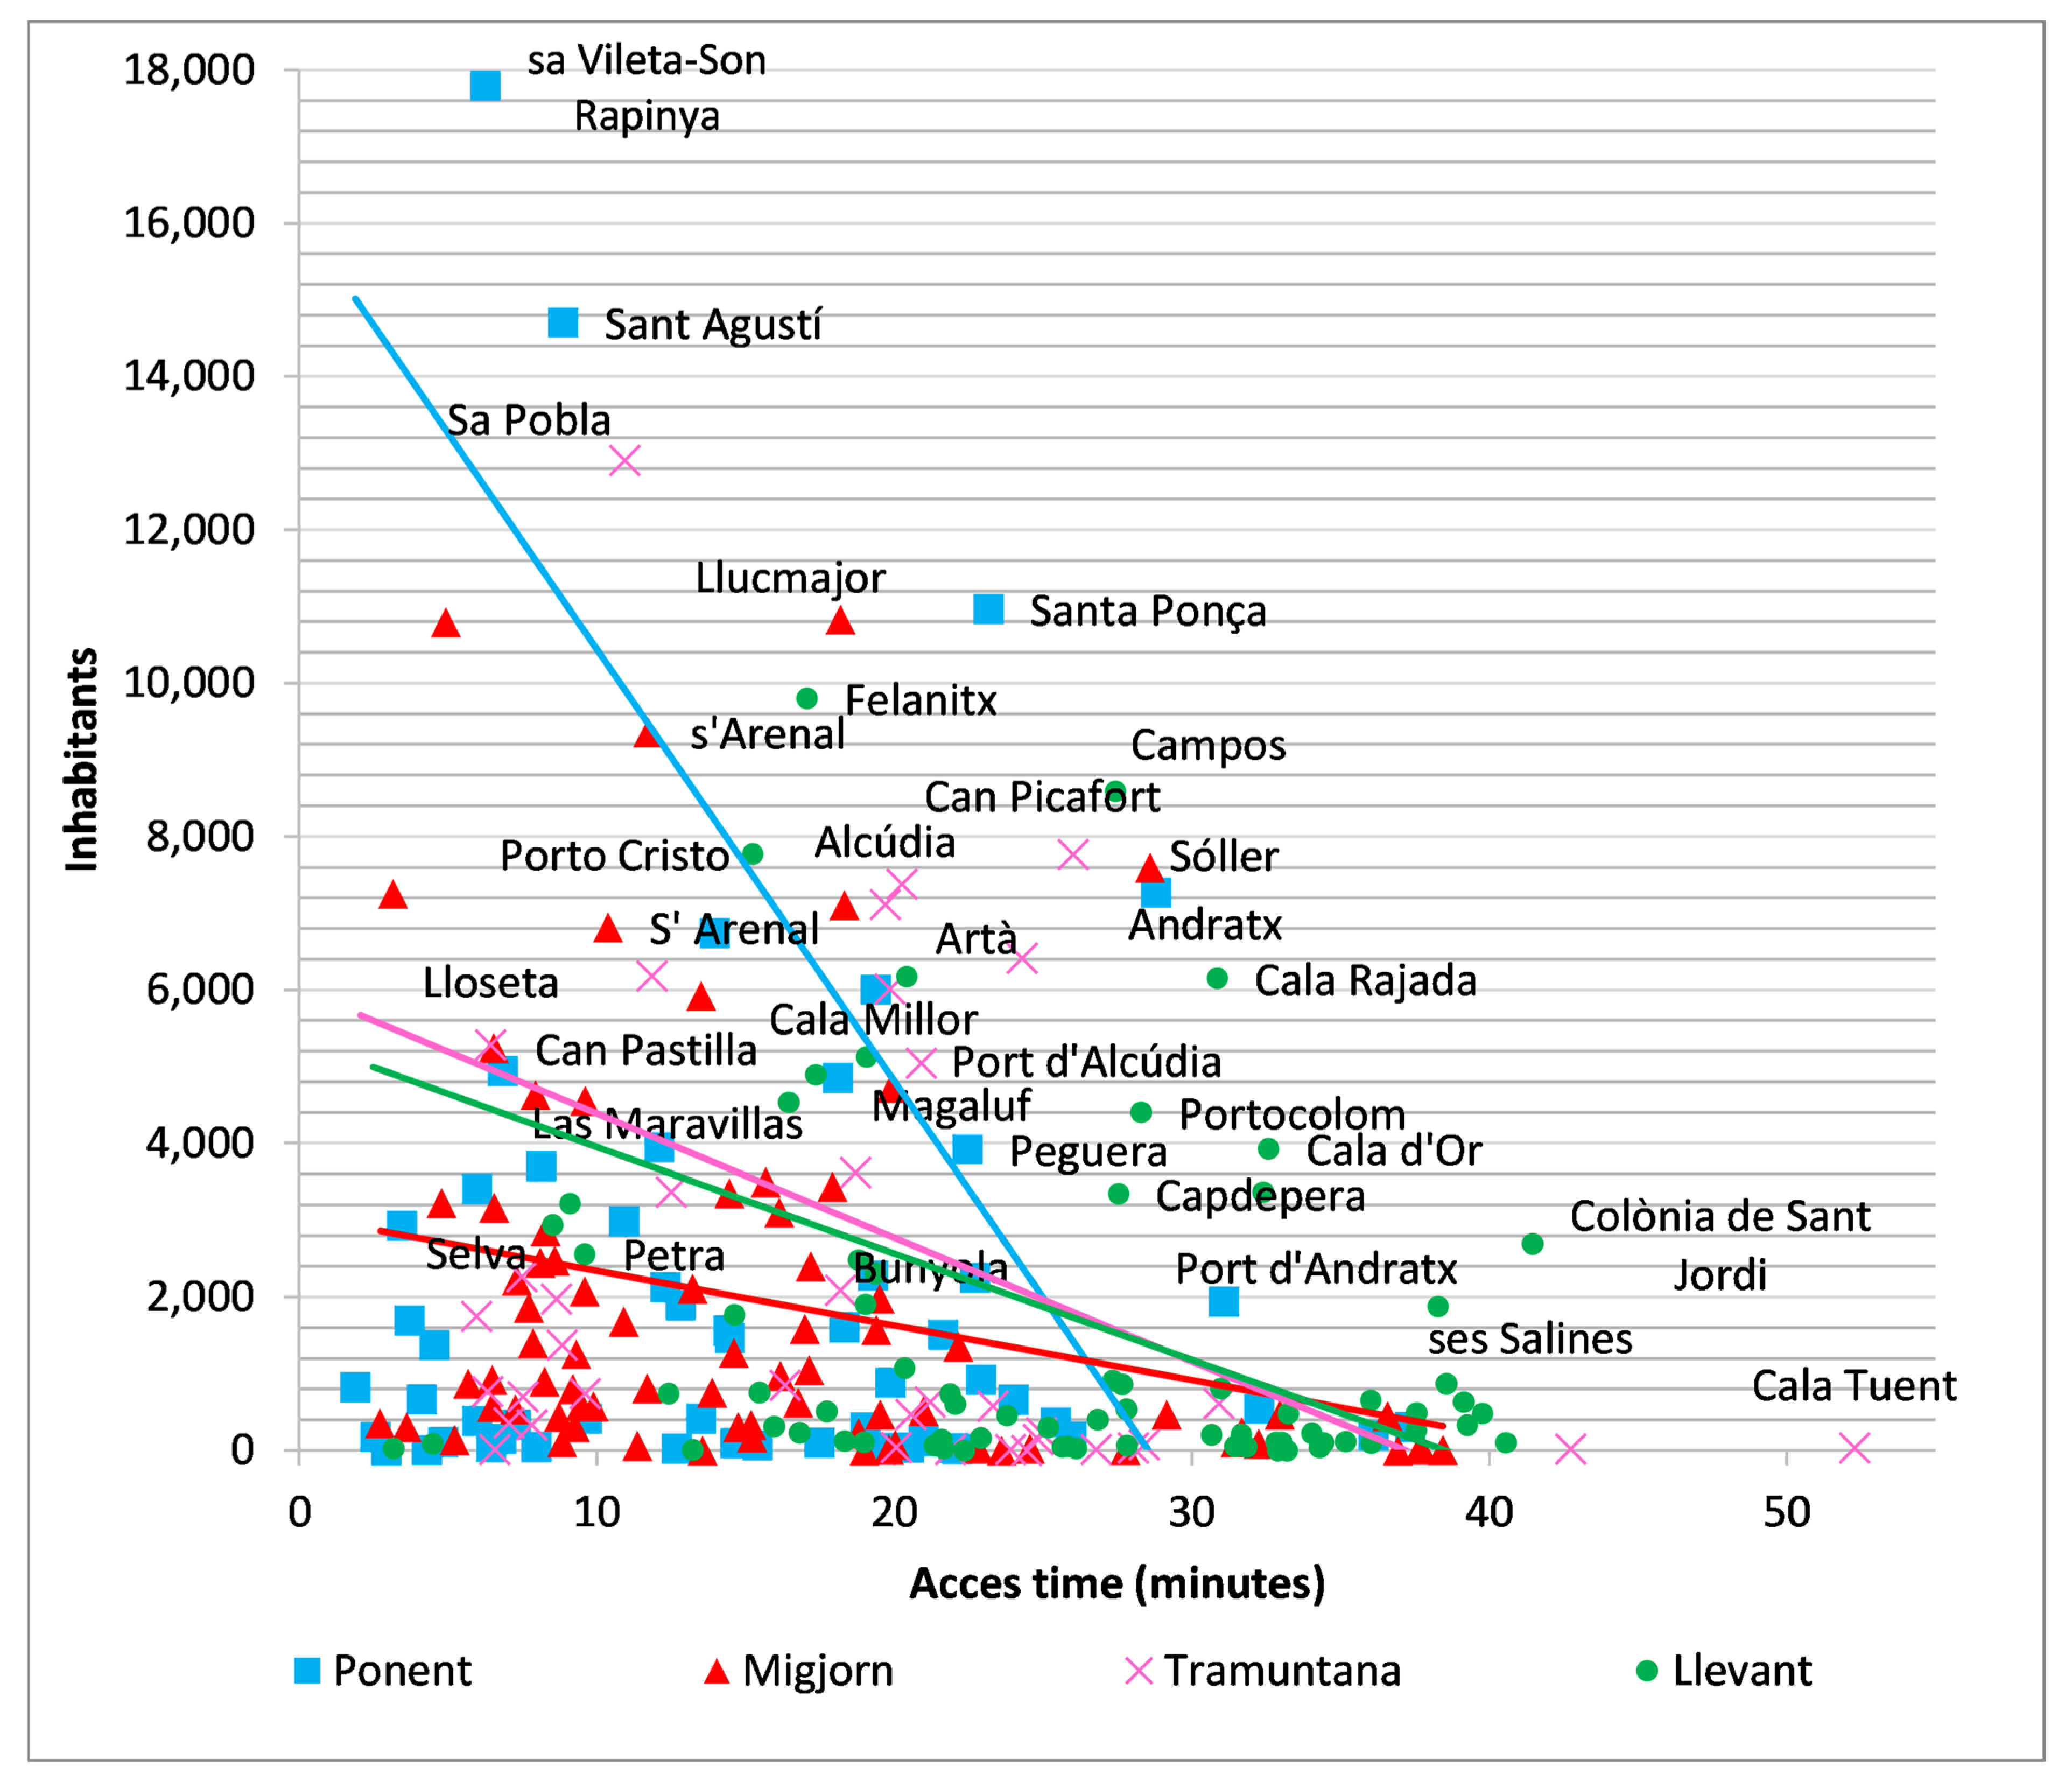
Figure 8 shows the access time of each population entity to the reference hospital (Son Espases). It is observed that the greatest accessibility is for the Ponent and Migjorn Sectors, with values that mostly do not exceed 30 min, with the exception of the most distant areas that occasionally reach 48 min. The Tramuntana Sector is further away, with trips reaching up to 52 min. Finally, the Llevant Sector is the furthest from the university hospital of Son Espases, although the travel time does not exceed 1 h and a half.
Figure 8.
Temporal accessibility map to Son Espases hospital (Mallorca).
It is observed that the values of accessibility in minutes to the reference hospital divide the island into eight areas of 10 min intervals. A close spatial–temporal relationship is evident, which reproduces the radial arterial system of the main road network and high-capacity roads.
Accessibility is almost less than 30 min in the Sectors of Ponent and Migjorn, with some exceptions in the most peripheral nuclei, while, in Tramuntana, accessibility is distributed between 21 and 50 min. Finally, in the Llevant Sector, only a few nuclei are under 30 min, with the nuclei of the eastern coast standing out as the farthest locations from the reference hospital, which are around 1 h or more away. This distribution is justified if it is considered in relation to the resident population, an essential aspect, since the objective of health facilities is to provide services to people.
Table 5 shows the proportion of the resident population, the tourist population, and the sum of both included within each isochrone. It can be seen how the location of the Son Espases University Hospital, despite being located significantly to the west with respect to the geometric center of the island, is less than 10 min from 48.9% of the resident population, and can be reached by 76.4% of the population in less than 30 min, which means about 640,000 people. At the other extreme, 3.8% of the population, just over 31,000 inhabitants, is more than 60 min away from the reference hospital.
Table 5.
Inhabitants, tourist places, and potential population in each isochrone of the Health Area of Mallorca.
In terms of tourist accommodation, the distribution of accessibility changes substantially, with only 5% of tourist accommodations being within 10 min of the hospital, and 42% of the tourist accommodations being in the 30 min isochronous zone. At the other end of the scale, the areas located more than 60 min from the hospital account for almost 71,000 bed places, representing 17.7% of tourist accommodations, and 48% of the tourist bed places are located over 40 min away.
Finally, the potential population shows an intermediate distribution between the two previous ones, since the 10 min isochrone includes 34.7% of the population, and in the first 30 min it reaches 65.3%. After 60 min, the relative weight of the potential population is 8.3%.
4.2. Accessibility by Health Sectors
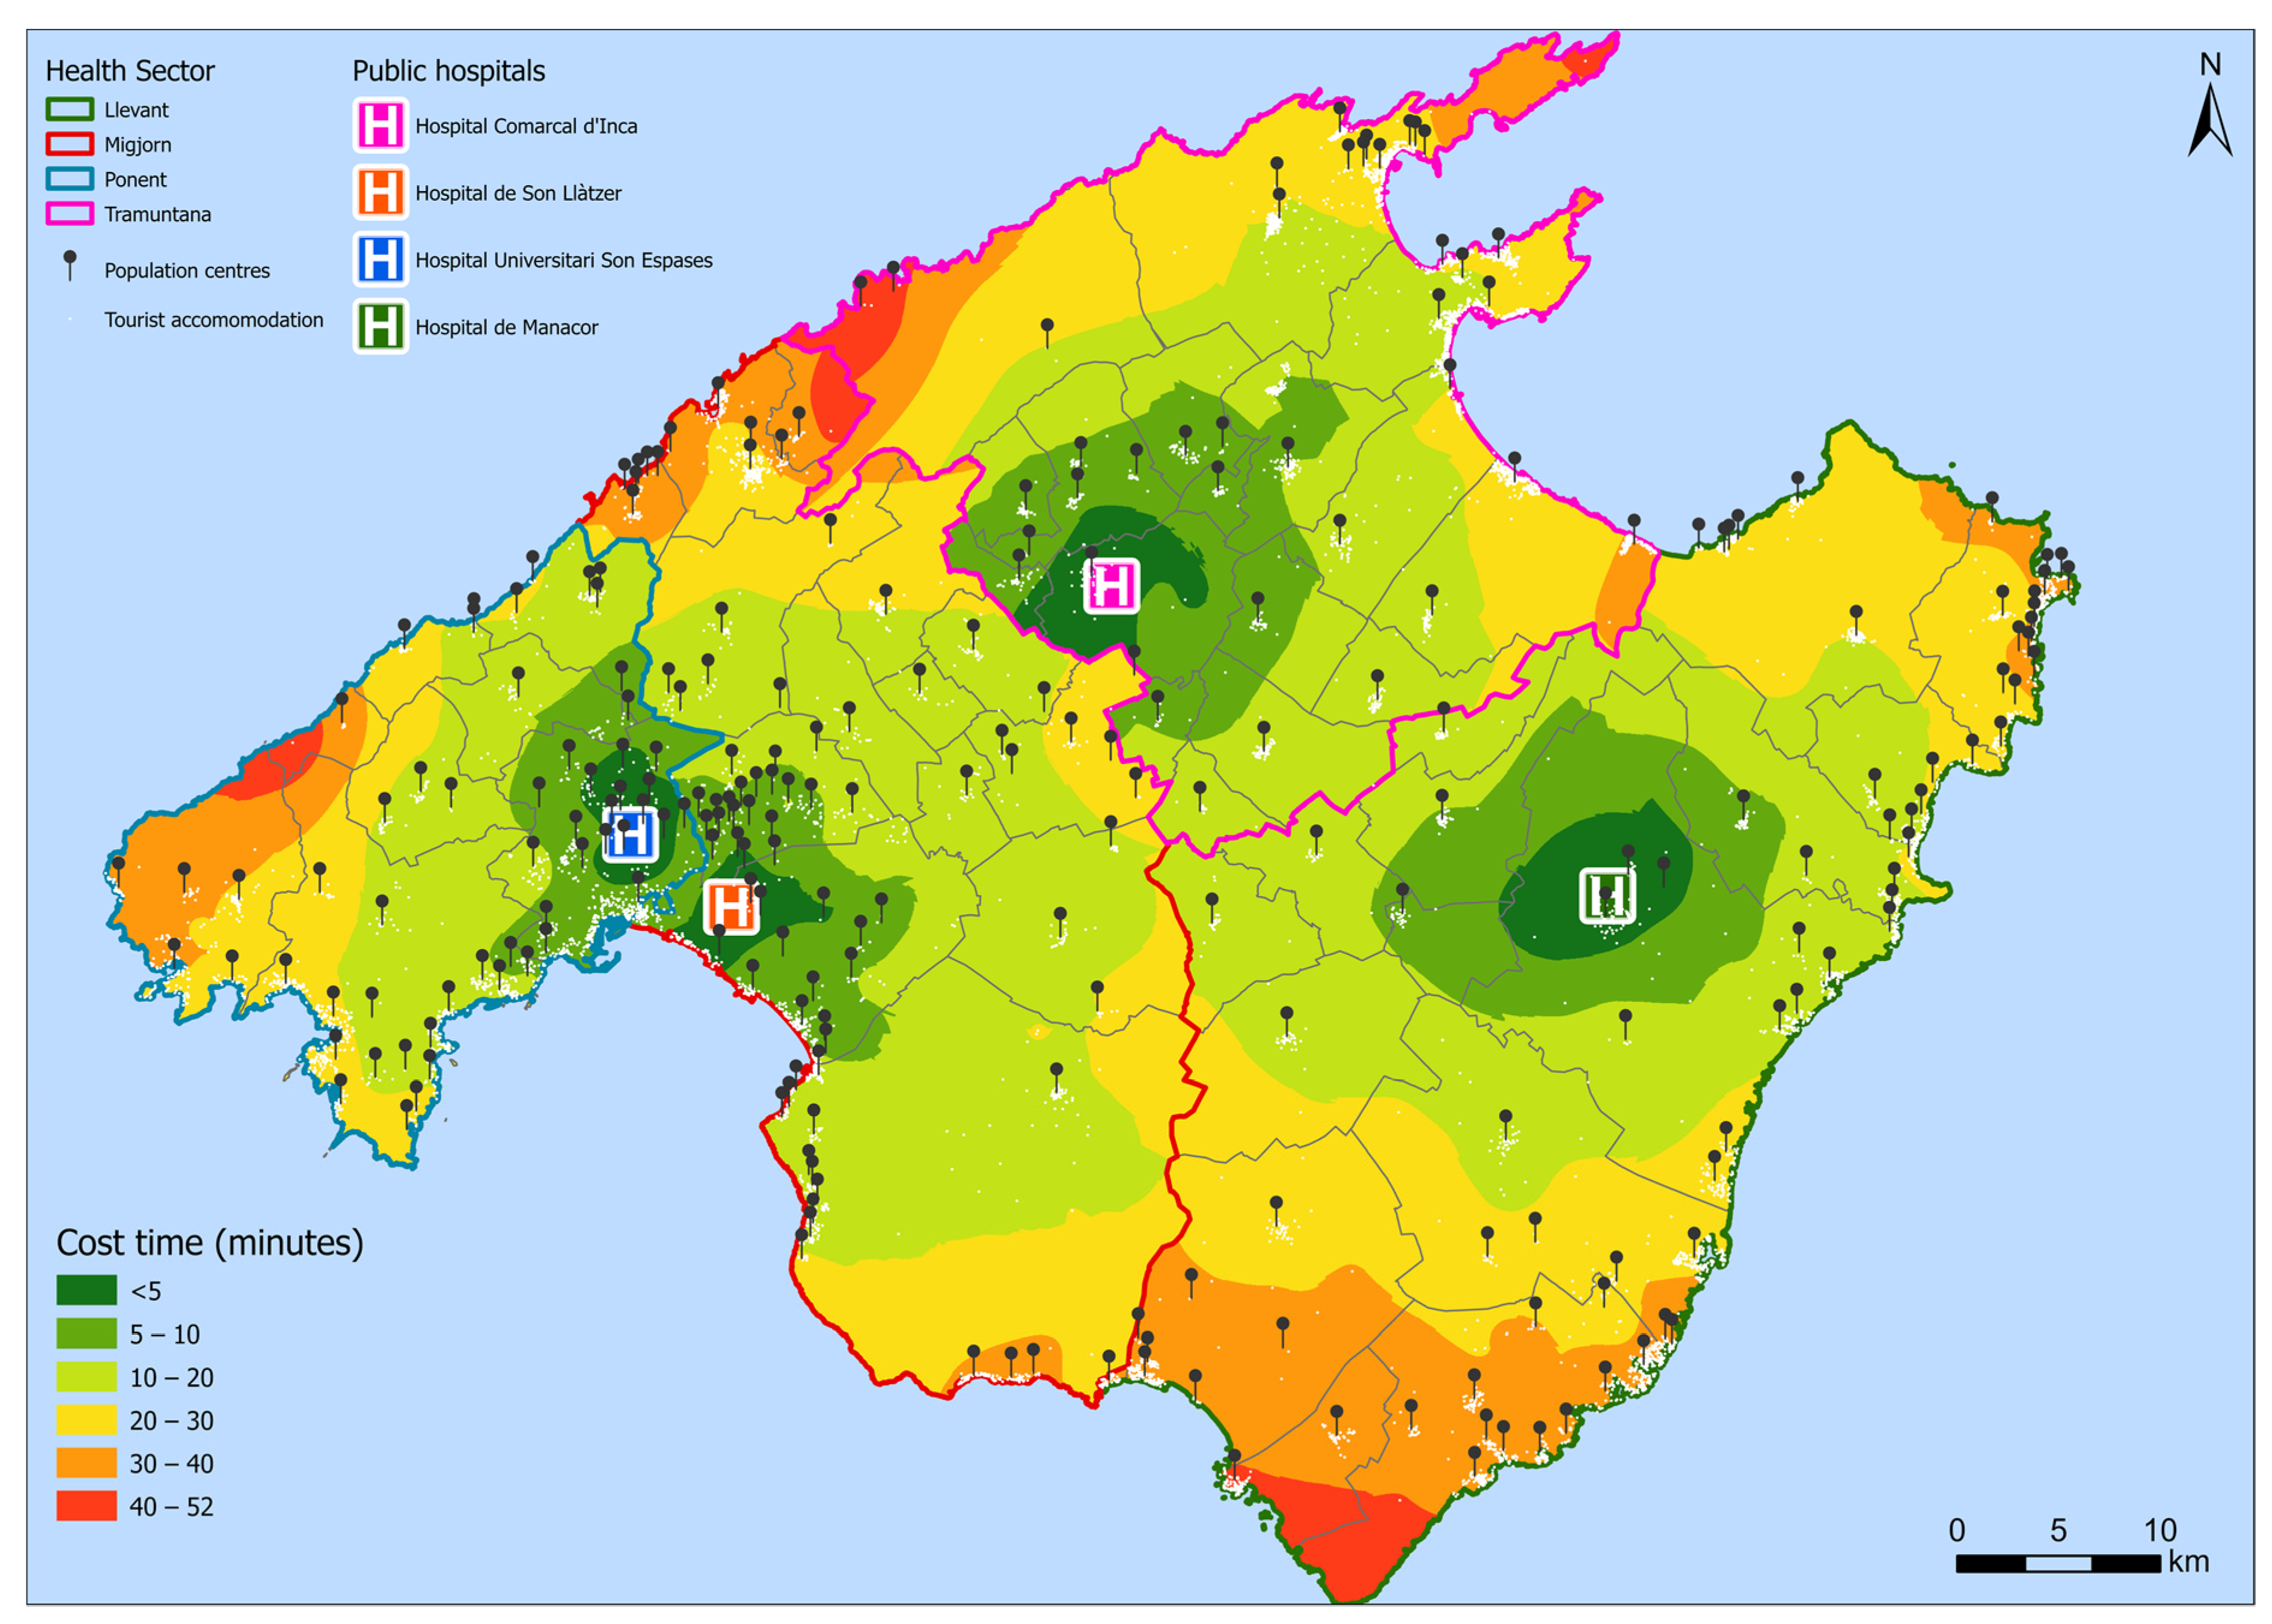
The results of the time cost matrix for each of the island’s Health Sectors can be seen in Figure 9. In this case, the distribution of accessibility is notoriously better than in the case of the Health Area; however, the patterns observed previously in the more peripheral nuclei are maintained. Thus, in the Ponent Sector, with Son Espases, accessibility is less than 12 min for the main nuclei of the municipality of Palma and its peri-urban area, while this time increases to 31–40 min in the northwest coastal strip in the nuclei of Estellencs, Sant Elm, and S’Arracó. In the intermediate strip, there is a considerable number of towns with an access time ranging between 11 and 20 min.
Figure 9.
Interpolation of access time from each population centre to the county hospital by Health Sectors.
In terms of accessibility by relative population (Table 6), accessibility is very good, since 84.2% of the population of the Ponent Sector is less than 10 min away, and 99.3% of the inhabitants are below the 30 min isochrone. However, these values are altered by the use of the centroids of each population center, since more than 310,000 people live in the center of Palma and account for 72% of the population, and this area is just 7 min away.
Table 6.
Inhabitants, tourist places, and potential population in each isochrone of the Ponent Health Sector.
On the other hand, the tourist weight of the Ponent Sector is relatively low, with 92,750 vacancies, which does not alter, roughly speaking, the accessibility of the potential tourist population. These vacancies are distributed mainly in the isochrones between 11 and 30 min, since 96% of them are in this range.
Next, the Migjorn Sector, despite covering a very large area, generally has an access time of less than 20 min, bringing together a notable group of nuclei of the peri-urban area of Palma that are under 10 min. As far as the extremes are concerned, there are two regions with an accessibility of between 31 and 40 min, which is explained by the Euclidean distance from the hospital, Son Llàtzer, in this case, but also due to the orography in the north of the island, where the nuclei of Sóller, Fornalutx, or Deià are located, which makes the road network difficult, with considerable slopes in some cases. On the other hand, the peripheral location of the southern nuclei, far from the main guiding nuclei of the area, has led to the underdevelopment of the road network, resulting in poorer accessibility.
In the Migjorn Health Sector, the distribution of the population by time intervals (Table 7), again, is not proportional to the spatial distribution of these intervals, since the relative weight of the inhabitants between the isochrones of 6–10 and 11–20 stands out, totaling 77.8% of the population, while the next band with more relative weight is the population that is less than 5 min away and that gathers 14.5% of the population of the Sector, totaling 92.3% in the first 20 min. Next, the 30 min isochrone includes 6.7%, and, anecdotally, 1% of the population has a longer travel time than 30 min, including those in towns such as Deià or Fornalutx on the northern slope of the Serra de Tramuntana. In terms of tourist vacancies, 52% are concentrated in the 6–10 min isochrone, specifically in the nucleus of Las Maravillas, with 24,265 tourist vacancies, which together with S’Arenal (10,081 vacancies just over 11 min away) make up the tourist destination of Playa de Palma. Additionally, this extends to other nuclei adjacent to those mentioned, thus forming the main destination of the island. Subsequently, the number of places decreases as the access time increases, until it reaches the isochronous 40–45 min zone, where there are only six tourist places. Thus, in terms of potential population, 10.3% of the population, mostly residents, is less than 5 min from the hospital, while in the first 20 min from the hospital, 91.5% of the potential population is reached. At the other extreme, 1.9% of this population is more than 30 min away.
Table 7.
Inhabitants, tourist places, and potential population in each isochrone of the Migjorn Health Sector.
Thirdly, the Tramuntana Sector has some peculiar isochrones, while the region itself also has a population distribution different from the rest. The area of influence of the Hospital d’Inca has, roughly speaking, a first isochrone of 5 min that includes the nucleus of Inca. Then, in the transition between 6 and 7 min, there are up to four more nuclei, some of them with a relatively important regional weight such as Lloseta, or to a lesser extent Búger. Next, the isochrone of 11 to 20 min includes another eight nuclei slightly further away from the city of Inca, among which are Sa Pobla or Muro. Next, there is a relative vacuum of nuclei until the most peripheral ones appear with respect to the capital of the foothills of the island, which are found within the 21–30 min isochrone, and which are characterized by either being coastal nuclei (to the northwest) or nuclei with an important rural and inland component. In addition, the Sector includes the nucleus located in the “heart” of the Serra de Tramunatana, Escorca, as well as the two coastal nuclei of this municipality: la Calobra and Cala Tuent, which together make up 51 inhabitants and 111 tourist places, and which, because of the sinuosity of its road network and its peripheral location in the mountainous area of the island, are 42 and 52 min away, respectively, from the regional hospital of Inca. Finally, it is also worth mentioning Son Serra de Marina, which is located at the eastern end of the region, and has a population of 613 resident inhabitants and 939 tourist places.
If we compare the percentage of the population in each time interval (Table 8), we can see the importance of the town of Inca, with a little more than 30,000 inhabitants, as the head of the region, since this town accounts for 26% of the population of the Sector, which represents 26.2% of the population living within 5 min from the hospital. Next, the Sector comprising the isochronous 6–10 min covers 13.2% of the population, including the nuclei of the surroundings of Inca as mentioned above. Next, the isochrone with the greatest relative weight is the 11–20 min isochrone, with 35.7% of the population being situated there, mainly due to the population weight of the towns of Sa Pobla (10.9%) and Muro (5.2%), or coastal enclaves such as Alcúdia (6%) and its beach (5.1%) in the northeast. Next, and below 30 min, 24.4% of the population is concentrated in urbanized areas, mainly coastal, in the municipality of Pollença (Pollença—6.2%; Port de Pollença—5.4%, as the two main ones) in the extreme northeast, as well as other coastal towns such as the port of Alcúdia (4.7%) or Ca’n Picafort (6.6%) in the center of the bay, developed from the tourist growth of the area. Thus, the tourist places show a great concentration in the isochrones between 11 and 30 min, encompassing 92.3% of the tourist places in the Sector, and emphasizing the area that includes the localities located between 21 and 30 min, where 62.2% of the places are located in coastal nuclei such as Platja de Muro, Port d’Alcúdia, Port de Pollença, or Ca’n Picafort, where, besides hotels, there is a great selection of houses for vacation rentals too. Thus, the potential population presents an increasing distribution as one moves away from the hospital of Inca until they reach the 30 min isochrone where 99.1% of the population is located. While in the first 5 min 14.8% are included, followed by 9.3% in the first 10 min, and 33.1% between 11 and 20 min, the main relative weight of the potential population is between 21 and 30 min with 41.9% weight.
Table 8.
Inhabitants, tourist places, and potential population in each isochrone of the Tramuntana Health Sector.
Finally, the Llevant Sector (Table 9) is the one that occupies the largest area, while at the same time it is the one with the most dispersed population centers in the territory, both inland and along the southwest coast of the island. In terms of accessibility, the Manacor Hospital shows an area of influence that in the first 5 min only covers the nucleus of Manacor itself, as well as two small population entities, Son Mas and Son Talent. Then, the isochrone of 6–10 min covers three nuclei, all of them inland and relatively close to the main nucleus. However, these first two areas of influence, unlike the previous Sectors, only reach 27.7% of the population. Thus, the greatest relative weight is found in the isochrone that includes the nuclei located between 11 and 20 min, with 32.4%, since this service area includes, in addition to several considerable inland nuclei such as Felanitx (7.3%) or Porreres (3.6%), a large number of coastal nuclei such as Portocristo (8.8%) or Cala Millor (3.8%). It also includes up to nine other nuclei that do not present large volumes of population, since they generally do not exceed 1%, although with some exceptions, but which together represent a high relative weight. Among these nuclei are Sa Coma, S’Illot, Cala Anguila or s’Estany de’n Mas, distributed among the municipalities of Manacor, Sant Llorenç, and Son Servera, and among which are some of the important tourist developments on the island. In the following interval, between 21 and 30 min, and with 21.7% of the population, there are, once again, a large number of coastal towns in the east, such as Cala Bona, Colònia de Sant Pere, Canyamel, Cales de Mallorca. There are also coastal towns in the southwest, such as Portocolom (3.2%), as well as other inland nuclei such as Campos, which houses 6.4% of the regional population, and also Felanitx (7.3%) in the south, and Artà (4.6%) and Capdepera (2.5%) in the east. Thus, it is so that in the isochrone between 21 and 30 min, 21.7% of the population is found. In the isochrone of 31 to 40 min, 16.2% of the population is included, and it is characterized by including the coastal nuclei of the municipality of Capdepera in the eastern end of the island, as well as a strip to the south where nuclei such as Santanyí (2.5%) or Cala d’Or (2.9%) are located. Finally, this is the Sector with the largest number of people more than 40 min away from the regional hospital, with 2790 people representing 2.1% of the Sector and being concentrated in Colònia de Sant Jordi to the west of the southern end of the island.
Table 9.
Inhabitants, tourist places, and potential population in each isochrone of the Llevant Health Sector.
Next, if tourist sites are added, accessibility worsens, since in the first 10 min only 8.8% of the tourist sites are found, and it is not until reaching the 30 min mark that 60% of the sites are exceeded. This is due to the fact that 86.9% of the vacancies are located in the aforementioned coastal nuclei, which are between 11 and 40 min away. As far as the potential population is concerned, this trend of predominance of the intervals between 11 and 40 min is maintained, where 78.8% of the potential population is covered, and, in the first 10 min, barely 18% of the potential population is reached. At the other extreme, up to 27.7% of the potential population is more than 30 min away from the county hospital, and 3.2% is more than 50 min away.
4.3. Equity in Accessibility
As already mentioned, the Gini index and the Lorenz curve are two of the most widely used statistical techniques to evaluate equity or inequality in accessibility. In the present study, both are applied to the access time from each nucleus to the corresponding hospital, and this is carried out at both Sector and Health Area levels.
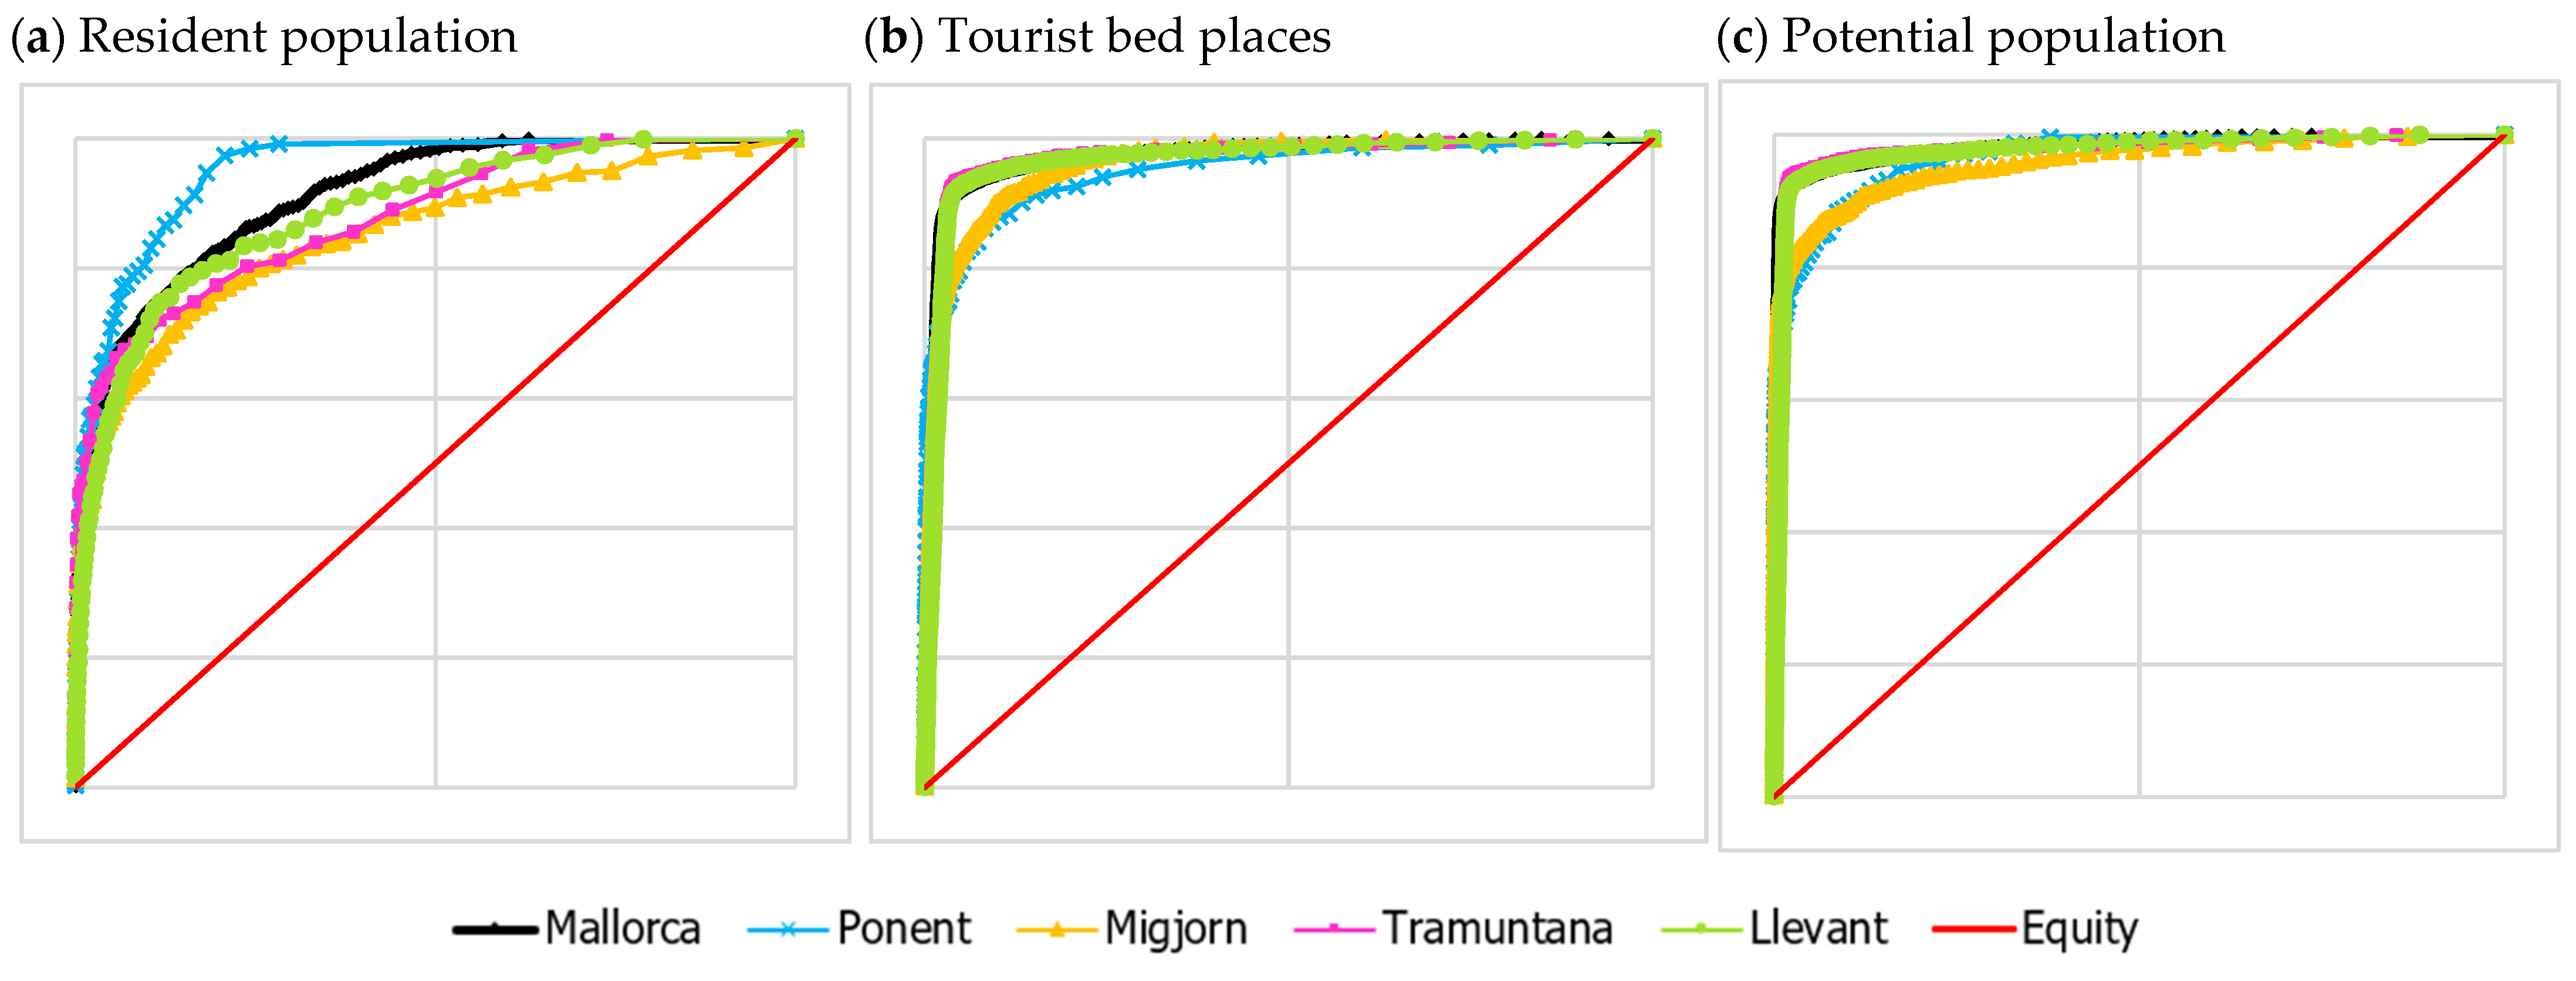
Figure 10 shows the Lorenz curves for each of the Sectors, together with the curve for the Health Area of Mallorca, and the line of perfect equity. In addition, Table 3 shows the results of the calculation of the Gini index for each of the territorial units analyzed.
Figure 10.
Lorenz curves of accessibility to public hospitals in Mallorca, representing normalized accumulated access time on Y axis and (a) normalized accumulated resident population on X axis, (b) normalized accumulated tourist bed places on X axis, and (c) normalized accumulated potential population on X axis.
As can be seen in Figure 10 and Table 10, the degree of equity in the distribution of accessibility is quite similar, generally tending towards a very unequal distribution. However, there are notable differences between the resident population, tourists, and the aggregate of tourists and residents.
Table 10.
Gini index for the Area of Mallorca and Health Sectors.
First, the resident population shows the least inequality, with the exception of the Ponent Sector (Gini = 0.9). This is due to a relatively dispersed distribution throughout the space covered by each Sector, with varying population figures among these nuclei, but always depending on the county seat, which is where the hospital is located and which concentrates a greater amount of the population; this causes this tendency to inequity, since a large amount of the population benefits from better accessibility. This is not the case in the Ponent Sector, as the nucleus of Palma concentrates a vast majority of the population in a short access time, which generates a positive inequity. In the case of the Health Area of Mallorca (Gini = 0.83), the high demographic weight of Palma and its surroundings together with the proximity to the reference hospital are the causes of this greater inequity with respect to the other Sectors with the exception of Ponent.
On the other hand, the distribution of tourist vacancies has an eminently coastal component, as we have already seen, which means an increase in travel time from the origin to the destination hospital, an effect that is exacerbated in the Tramuntana and Llevant Sectors, where the highest Gini values are found, 0.94 in both cases. This wide dispersion of tourist vacancies along the coast generates a greater effect of inequality in accessibility than in the previous case of the concentration of residents around the hospital, since, in this case, the main nuclei or groups of nuclei with the highest concentration of tourist vacancies are located at a similar distance from the hospital. On the other hand, in the Ponent and Migjorn Sectors, the proximity of tourist vacancies to hospitals is maintained, which generates Gini indices of 0.9 and 0.93, respectively.
In terms of the potential population, the Ponent and Migjorn Sectors show the lowest inequality due to the large number of towns in the metropolitan area of Palma with a high potential population, which are close to the corresponding county hospitals; even so, the values of the Gini index are very close to the total inequality (Ponent = 0.94 and Migjorn = 0.91). On the other hand, the Tramuntana and Llevant Sectors include the most rural areas of the island, for which the main centers of the county capitals barely exceed 30,000 inhabitants, since, in these two Sectors, inequality is higher (Tramuntana = 0.96 and Llevant = 0.95) due to the importance of the development of the coastal centers, concentrating a large amount of the potential population within a similar distance nucleus. Finally, the Gini index for the island of Mallorca is 0.96, the highest of the five records, since, in this case, the entire weight of the metropolitan area of Palma where more than half of the potential population of the island is located, and where there is good accessibility to the Son Espases hospital, causes this high concentration of accessibility in a large social majority.
Thus, it is understood that inequality is a positive characteristic in social accessibility to health centers, since a social majority benefits from better accessibility to these facilities. The location of the Son Espases Hospital in Palma aims to offer the closest possible service to the greatest possible volume of population. In this case, the inequality in accessibility is understood as a positive factor, skewed by the greater demographic weight, since the lowest access times are concentrated in a few densely populated nuclei, while the highest access times correspond to more nuclei but are of low demographic weight or contain isolated tourist establishments.
5. Discussion
The use of public hospital facilities, despite offering universal coverage, is generally more limited to residents, since tourists are almost exclusively limited to the use of emergency services. Based on this hypothesis, hospital facilities should be planned based on the demand of the resident population and their territorial distribution, trying to encourage better social sustainability, while also being able to offer services to visitors. In addition, the locations of tourist facilities tend to seek, in certain cases, isolation from urban agglomerations, which forces them to move to peripheral areas that are sometimes difficult to access. For this reason, it is considered that the hospital supply should try to be close to the main population centers, such as the county capitals, in the case of the island of Mallorca.
Figure 11 shows the dispersion diagram of the population centers, with their respective resident population, and the access time to the regional hospital. It can be seen how the demographic weight of the city of Palma and its metropolitan area (sa Vileta-Son Rapinya, Sant Agustí or Andratx) forces a greater concentration of the population into a lower time cost area. Next, the Tramuntana and Llevant Sectors show quite similar regression lines in which the concentration of nuclei around the county capitals and their population influence can be seen (Sa Pobla in Tramuntana and Artà or Portocolom in Llevant). While, in last place, the Migjorn Sector is the one that presents a line with a greater horizontal tendency because this Sector does not develop around its own head, but it does it around the metropolitan area of Palma (Llucmajor, s’Arenal or Sóller) and the population nuclei that have been incorporated into the dynamics of this area. As a result, there are a large number of nuclei with low demographic weight that favor this horizontal trend of the regression line. These three types of regression lines are consistent with the results of the Gini index for the resident population, since the first stratum with better accessibility for a greater number of people is the Ponent Sector (Gini = 0.9), followed by the two Sectors governed by a medium-sized county seat (Gini Tramuntana = 0.76 and Gini Llevant = 0.78). Finally, the Migjorn Sector is the one with the worst accessibility due to the territorial distribution of its population in nuclei with similar demographic weights and low spatial concentration (Gini = 0.71).
Figure 11.
Scatter plot of the resident population by population centers and access time to the regional hospital. The nucleolus of Palma (310,788 inhabitants at 7.17 min), Inca (30,892 inhabitants at 2 min), and Manacor (28,247 inhabitants at 2.5 min) are not represented due to their high population values, although they are considered in the calculation of the regression lines.
Therefore, based on the accessibility results obtained from the present study, it is shown that the Health Area of Mallorca and its corresponding Health Sectors have a good distribution according to the resident population, tourist places, and the existing road network. However, these results should also be compared with other study areas in order to try to identify the main advantages of each health organization system.
Andalusia is one of the autonomous communities where a similar analysis has been carried out, obtaining as a result that 86% of the Andalusian population in 2003 was within the 30 min isochronous distance from one of the 37 public hospitals in the autonomous community [24], without considering health planning. On the other hand, accessibility to high resolution hospitals has also been analyzed, these being a type of hospital similar to the regional hospitals on the island of Mallorca. In this case, despite having a delimitation of municipalities for each hospital, without covering the entire territory, 95% of the population within these facilities is less than 30 min away from them [1], thus there is improved accessibility compared to the previous case. These results, if assimilated to the Health Sectors, show that in the case of Mallorca, 99% of the population is within the 30 min threshold in the Sectors of Ponent, Migjorn, and Tramuntana, while in Llevant the value drops to 81%; this is the only Sector with worse accessibility than the hospitals of Andalusia.
On the other hand, in Extremadura, despite its high rural component, 99% of the population is less than 30 min away from a Health Center (limited to a Basic Health Zone) or a local clinic, while accessibility to hospitals in less than 30 min covers 90% of the population [27]; however, in the case of the Health Area of Mallorca, this percentage drops to 76%.
Finally, the accessibility of Mallorca is compared with the autonomous community of Catalonia for the year 2003, where the isochronous 30 min in the different Health Regions for acute hospitals, comparable to the Health Area, varies from 75% in Alt Pirineu and Vall d’Aran to practically, or even, 100% in Camp de Tarragona, Girona, and Barcelona [14].
Other studies at the state level, such as in the case of Teruel [4] or Fuenlabrada [17], do not permit comparison since they work at the level of Basic Health Zones.
At the international level, it is difficult to relate the different cases studied in the existing scientific literature, due to the great disparity in health planning between the different countries. Even so, a case similar to that of Mallorca is found in Nottinghamshire in the United Kingdom, where 94.4% of the 833,400 inhabitants of the region are within 15 min of at least one of the 8 selected hospitals [25], while in the case of Mallorca only the Ponent Sector is able to cover 84.2% of the population in the first 15 min according to the health planning and the distribution of 4 hospitals. Another insular case, although not comparable in regard to demographic size, is New Zealand, where it is estimated that the average travel time to the nearest hospital of any kind is 17.9 min, while 167,295 people are more than 1 h away from any of these facilities [49]. In the case study of Mallorca, the average access time to the regional hospital is 18 min in the Ponent Sector, 16 min in the Migjorn Sector, 15 min in the Tramuntana Sector, and up to 26 min in the Llevant Sector, with the latter being the one with the longest access time. However, in no case is the travel time to the regional hospital more than 60 min, except for in the case of the reference hospital where 31,499 people are more than 1 h away. Another case with much higher demographic volumes is Sichuan, China, with a population of more than 80.7 million inhabitants, where 39.4% of the population is less than 30 min from the nearest hospital [5].
However, it should be kept in mind that the studies presented below use maximum speeds or ideal approximations, which implies a comparative bias between access times. A possible improvement in this way would be to use time reliability analysis [50,51], but it would need precise and field-obtained data about travel time throughout the island.
As we have tried to explain, the starting data of the study show a certain simplification. This was required in order to carry out the analysis in a more agile and plausible way, since the objective is to know the accessibility in broad terms for each of the Health Sectors and the Health Area, without going into the level of detail of the urban or municipal scale; therefore, the results emanating from this study are considered valid within this regional and subregional scale.
Another bias accepted in the work has been the one referring to the transport network, where again it has been the scale of analysis that conditions the starting data. It is already known how difficult it is to work in the field of geographic information systems at an academic level, and to obtain a transport network faithful to reality, which includes directions, maximum speed, average speed, average daily intensity, etc., and thus this makes it almost impossible to generate a high-quality road network from open and/or free data. In the same way, the maximum speeds have been established in a generalized way based on the CNIG road typologies, with the exception of the roads already mentioned above, and have been weighted following criteria established by a group of experts at the Interdisciplinary Observatory of Mobility of the University of the Balearic Islands, as well by making use of the availability of open data.
6. Conclusions
This study contributes both practically and theoretically to the fields of geography, transportation, and healthcare equity by analyzing healthcare accessibility in tourist-heavy regions. By considering resident populations and tourist accommodations, it expands the understanding of healthcare accessibility and highlights the importance of equitable service distribution, informing future health infrastructure planning. The regional health planning-based accessibility model used is particularly relevant to Mediterranean islands such as Mallorca, where tourism significantly impacts infrastructure planning. Comparing Mallorca’s hospital accessibility to other Spanish regions provides valuable insights into regional disparities, guiding future planning efforts.
The analysis of temporary accessibility to the public hospital of reference at a regional level, the Son Espases university hospital, shows more than acceptable values for its location. The concentration of the population in Palma and around its metropolitan area means that this location in the west of the island has a generally good accessibility, which includes up to 61.7% of the population located within the first 60 min from the hospital, while only 3.8% of the inhabitants of the island are more than 40 min away, and in no case is the distance 82 min (1 h and 22 min). Regarding the different Health Sectors, accessibility is very variable between them, and we can conclude that in the cases of the Ponent, Migjorn, and Tramuntana Sectors, accessibility is good, since more than two thirds of the population is less than 20 min away from their corresponding hospital. On the other hand, the Llevant Sector is the one that shows the worst accessibility, due to the large territory it covers and the distribution of the population in several relatively large nuclei apart from the county seat, which is Manacor. In terms of the potential population, there is a certain synchrony between residents and tourist places by time intervals in the Sectors of the metropolitan area, since this has grown from the coast towards the interior, and it is on this coast that the tourist offer is mainly concentrated. Meanwhile, in the Sectors that have their headwaters and respective hospitals located in the interior, the location of tourist vacancies on the coast causes an increase in the potential population farther away from the health facilities.
Due to the large area covered by the Llevant Sector and the large number of coastal towns in the east of Mallorca, together with the comparatively worse accessibility that has been detected in the Migjorn Sector, it is considered that one of the ways to improve accessibility to public hospital facilities is the possibility of building another regional hospital in the south of Mallorca to serve the southernmost and most distant populations to their respective regional hospitals at the level of Health Sectors. However, this new facility would force a reorganization of the Health Sectors through the creation of a new Sector. The location of this new hospital center and the reorganization of the county health entities is considered as a way to develop the present work, and this line is open for future research on the framework of the improvement of the accessibility and supply of public health services.
As a final conclusion, it is considered that the proposed methodology, together with the results, represents a useful tool that is available to the managing agents of territorial planning at urban and regional levels, and both at health and road levels. As a result, they are able to include the accessibility factor in the planning of both facilities and infrastructure, being health, educational or of any kind, in order to improve the quality of the Welfare State. The analysis including regional health planning is a great advancement as it does not consider that everyone can go to every hospital; however, depending on where someone lives, a hospital is assigned according to the legislation. From a scientific view, this paper introduces a method to assess a speed-corrected accessibility network using just data from open sources, which implies a wide application not only in accessibility to hospitals but in any accessibility analysis using a road network. Additionally, in a scientific and practical way, it could be a first approach to inspire further studies with the aim of improving the accessibility times reckoned in this study.
For future studies, it is proposed to introduce accessibility measures considering time reliability, and to incorporate the public transport network to also evaluate accessibility to public hospitals by bus, train and/or subway. In addition, it would be interesting to use the portals as demand nodes, which would offer results that are more faithful to the urban reality, although the availability of population data at this scale of analysis should be evaluated.
Author Contributions
Conceptualization, A.M., J.M.S.-P. and M.R.-P.; Methodology, A.M., J.M.S.-P. and M.R.-P.; Software, A.M.; Validation, A.M.; Formal analysis, A.M.; Investigation, A.M. and A.C.F.; Resources, A.M.; Data curation, A.M.; Writing—original draft, A.M.; Writing—review & editing, A.M., J.M.S.-P., A.C.F. and M.R.-P.; Visualization, A.M.; Supervision, J.M.S.-P. and M.R.-P.; Funding acquisition, J.M.S.-P. and M.R.-P. All authors have read and agreed to the published version of the manuscript.
Funding
The development of the project was supported by the program ‘SOIB RECERCA I INNOVACIÓ PLAN DE RECUPERACIÓN, TRANSFORMACIÓN Y RESILIENCIA (GOBIERNO DE ESPAÑA)-GOIB-NEXT GENERATION EU 2022 (E-07-2022-0377083). Cofounded by Margarita Salas fellowship to [A.C.F.]. The Margarita Salas fellowship is part of the Recovery, Transformation and Resilience Plan-Funded by the European Union-NextGenerationEU (Ministry of Universities). However, the views and opinions expressed are solely those of the authors and do not necessarily reflect those of the European Union or the European Commission. Neither the European Union nor the European Commission are responsible for them.; and sponsored by the Comunitat Autonòma de les Illes Balears through the Direcció General de Política Universitària i Recerca, with funds from the Tourist Stay Tax Law (PRD2018/52–ITS 2017-006).
Informed Consent Statement
Not applicable.
Acknowledgments
We would like to thank the reviewers of the article for their corrections and suggestions.
Conflicts of Interest
The authors declare no conflict of interest.
References
- Díaz, V.R. Medición de la accesibilidad geográfica de la población a los hospitales de alta resolución de Andalucía mediante herramientas SIG basadas en el análisis de redes. Geofocus 2011, 265–292. [Google Scholar]
- Cheng, L.; Yang, M.; De Vos, J.; Witlox, F. Examining geographical accessibility to multi-tier hospital care services for the elderly: A focus on spatial equity. J. Transp. Health 2020, 19, 11. [Google Scholar] [CrossRef]
- Zhao, P.; Li, S.; Liu, D. Unequable spatial accessibility to hospitals in developing megacities: New evidence from Beijing. Health Place 2020, 65, 102406. [Google Scholar] [CrossRef] [PubMed]
- Cornago, C.D.; Orcao, A.E. Accesibilidad geográfica de la población rural a los servicios básicos de salud: Estudio en la provincia de Teruel. Ager. Rev. Estud. Sobre Despoblación y Desarro. Rural 2003, 111–149. [Google Scholar]
- Pan, J.; Liu, H.; Wang, X.; Xie, H.; Delamater, P.L. Assessing the spatial accessibility of hospital care in Sichuan Province, China. Geospat. Health 2015, 10, 261–270. [Google Scholar] [CrossRef]
- Flores-Sandí, G. Accessibility management and the right to health. Acta Med. Costarric. 2012, 54, 181–188. [Google Scholar]
- McGrail, M.R.; Humphreys, J.S. Measuring spatial accessibility to primary health care services: Utilising dynamic catchment sizes. Appl. Geogr. 2014, 54, 182–188. [Google Scholar] [CrossRef]
- Gurrutxaga, M. Geography of health: Applications in territorial and urban planning. Estud. Geográficos 2019, 80, 2–18. [Google Scholar] [CrossRef]
- WHO. Universal Health Coverage, WHO News. 2021. Available online: https://www.who.int/es/news-room/fact-sheets/detail/universal-health-coverage-(uhc)%0Ahttps://dialnet.unirioja.es/servlet/articulo?codigo=7384375&orden=0&info=link%0Ahttps://dialnet.unirioja.es/servlet/extart?codigo=7384375%0Ahttps://www.notariado.org/por (accessed on 10 May 2023).
- Martínez Bascuñán, M.; Rojas Quezada, C. Geographically weighted regression for modeling accessibility to the hospital network in the metropolitan area of Concepción. Rev. Geográfica Valparaíso 2015, 28–39. [Google Scholar]
- Feliu de la Peña, J.F.; Ruiz, M.; Seguí-Pons, J.M. Accessibility to health facilities by public transport. A comparative analysis in the city of Palma. In Proceedings of the XVII Congreso Nacional de Tecnologías de Información Geográfica, Malaga, Spain, 29 June–1 July 2016; pp. 99–108. [Google Scholar]
- Fuenzalida Diaz, M. Design of optimal location schemes for hospitals of the Viña del Mar-Quillota health service (Chile) discriminating according to socio-economic status. Geofocus 2011, 409–430. [Google Scholar]
- Prat, E. Study on the accessibility of public health centers in Catalonia. In Proceedings of the XIII Congreso Nacional Tecnolgica la Informacion Geográfica, Malaga, Spain, 15–19 September 2008; pp. 1–15. [Google Scholar]
- Prat, E.; Pesquer, L.; Olivet, M.; Aloy, J.; Fuste, J.; Pons, X. Methodology for the analysis of accessibility to health resources: The case of Catalonia. Geofocus 2009, 250–269. [Google Scholar]
- Luo, W.; Wang, F. Measures of spatial accessibility to health care in a GIS environment: Synthesis and a case study in the Chicago region. Environ. Plan. B Plan. Des. 2003, 30, 865–884. [Google Scholar] [CrossRef]
- Wang, J.; Du, F.; Huang, J.; Liu, Y. Access to hospitals: Potential vs. observed. Cities 2020, 100. [Google Scholar] [CrossRef]
- Basoa Rivas, G.; Otero Puime, A. Geographic accessibility to health centers and urban planning in Fuenlabrada (Madrid). Rev. Hig. Publica 1994, 68, 503–511. [Google Scholar]
- Sánchez-Torres, D.A. Accessibility to health services: Theoretical debate on determinants and implications for public health policy. Rev. Med. Inst. Mex. Seguro Soc. 2017, 55, 82–89. [Google Scholar]
- Escobar, D.A.; Holguín, J.M.; Zuluaga, J.D. Accessibility of ambulance centers and hospitals providing emergency services and its relationship with spatial inequity. Case study Manizales–Colombia. Espacios 2016, 37, 1–13. [Google Scholar]
- Liu, Y.; Gu, H.; Shi, Y. Spatial Accessibility Analysis of Medical Facilities Based on Public Transportation Networks. Int. J. Environ. Res. Public Health 2022, 19, 16224. [Google Scholar] [CrossRef]
- Dewulf, B.; Neutens, T.; De Weerdt, Y.; Van de Weghe, N. Accessibility to primary health care in Belgium: An evaluation of policies awarding financial assistance in shortage areas. BMC Fam. Pract. 2013, 14, 122. [Google Scholar] [CrossRef]
- Agbenyo, F.; Marshall Nunbogu, A.; Dongzagla, A. Accessibility mapping of health facilities in rural Ghana. J. Transp. Health 2017, 6, 73–83. [Google Scholar] [CrossRef]
- Eurostat. Health Statistics at Regional Level. 2022. Available online: https://ec.europa.eu/eurostat/statisticsexplained/ (accessed on 10 May 2023).
- López Lara, E.; Garrido Cumberera, M. Análisis de la accesibilidad hospitalaria por carretera en andalucía mediante Sistemas de Información Geográfica. In Servicios y Transportes en el Desarrollo Territorial de España; Universidad de Sevilla: Sevilla, Spain, 2003; pp. 407–418. [Google Scholar]
- Olivet, M.; Aloy, J.; Prat, E.; Pons, X. Oferta de servicios de salud y accesibilidad geográfica. Med. Clin. 2008, 131, 16–22. [Google Scholar] [CrossRef]
- Nieto Masot, A.; Engelmo Moriche, Á.; Cárdenas Alonso, G. La Distribución Territorial de Recursos Sanitarios y Socio-Sanitarios Públicos para Población Mayor en Extremadura. Rev. Estud. Andaluces 2019, 37, 141–160. [Google Scholar] [CrossRef]
- Nieto Masot, A.; Cárdenas Alonso, G. Accesibilidad de las zonas rurales a recursos educativos y sanitarios de Extremadura Partnerships and territorial distribution of public services and equipment View project. In Los Servicios: Dinámicas, Infraestructuras y Cohesión Territorial; Gutiérrez Gallego, J.A., Nieto Masot, A., Jaraíz Cabanillas, F.J., Ruiz Labrador, E.E., Antón Burgos, F.J., Eds.; Asociación de Geógrafos Españoles: Madrid, Spain, 2013; pp. 571–586. [Google Scholar]
- Seguí-Pons, J.M.; Martínez Reynés, M.R. Geografía de los Transportes; Universitat de les Illes Balears: Palma, Spain, 2004. [Google Scholar]
- Miller, E.J. Accessibility: Measurement and application in transportation planning. Transp. Rev. 2018, 38, 551–555. [Google Scholar] [CrossRef]
- Handy, S.L.; Niemeier, D.A. Measuring accessibility: An exploration of issues and alternatives. Environ. Plan. A 1997, 29, 1175–1194. [Google Scholar] [CrossRef]
- Joseph, A.E.; Phillips, D.R. Accessibility and Utilization: Geographical Perspectives on Health Care Delivery; Harper & R.: New York, NY, USA, 1984. [Google Scholar]
- Chestnut, J.; Boschmann, E.E. Exploring the Utility of Gini Coefficients as a Measure of Temporal Variation in Public Transit Travel Time. Pap. Appl. Geogr. 2022, 8, 112–123. [Google Scholar] [CrossRef]
- BOCAIB no. 71, Decreto 34/1987, de día 21 de Mayo, de Ordenación Sanitaria de la Comunidad Autónoma de las Islas Baleares; Comunidad Autónoma de las Islas Baleares: Palma, Spain, 1987.
- Rodrigue, J.-P.; Comtois, C.; Slack, B. The Geography of Transport Systems; Routledge: London, UK, 2019. [Google Scholar] [CrossRef]
- CAIB, GOIB Open Data Catalog. 2022. Available online: https://catalegdades.caib.cat/ (accessed on 25 May 2021).
- CNIG, CNIG (IGN) Download Center. 2022. Available online: http://centrodedescargas.cnig.es/CentroDescargas/index.jsp (accessed on 25 May 2021).
- Conselleria de Territori Energia i Mobilitat. Pla Director Sectorial de Mobilitat de les Illes Balears; Director Sectorial de Mobilitat de les Illes Balears: Palma, Spain, 2018. [Google Scholar]
- Ricciardi, A.M.; Xia, J.C.; Currie, G. Exploring public transport equity between separate disadvantaged cohorts: A case study in Perth, Australia. J. Transp. Geogr. 2015, 43, 111–122. [Google Scholar] [CrossRef]
- Delbosc, A.; Currie, G. Using Lorenz curves to assess public transport equity. J. Transp. Geogr. 2011, 19, 1252–1259. [Google Scholar] [CrossRef]
- Bandegani, M.; Akbarzadeh, M. Evaluation of horizontal equity under a distance-based transit fare structure. J. Public Transp. 2016, 19, 161–172. [Google Scholar] [CrossRef]
- Melakhsou, A.; Bhouri, N. Bus regularity evaluation using the gini index and the lorenz curve: A case study of New Delhi Bus network. In Proceedings of the VEHITS 2019-Proceedings of the 5th International Conference on Vehicle Technology and Intelligent Transport Systems, Heraklion, Greece, 3–5 May 2019; pp. 569–577. [Google Scholar] [CrossRef]
- Ruiz, M.; Seguí-Pons, J.M.; Mateu, J.; Martínez Reynés, M.R. Assessing the equity of public transport service: The case of Palma de Mallorca. Estud. Geogr. 2016, 77, 619–646. [Google Scholar] [CrossRef]
- Ruiz, M.; Segui-Pons, J.M.; Mateu-LLadó, J. Improving Bus Service Levels and social equity through bus frequency modelling. J. Transp. Geogr. 2017, 58, 220–233. [Google Scholar] [CrossRef]
- Palma City Council, Ordenanza Municipal de Circulación de Palma. 2020. Available online: https://www.palma.cat/portal/PALMA/RecursosWeb/DOCUMENTOS/1/14_5816_9.pdf (accessed on 10 May 2023).
- Consell de Mallorca, Reducció de la Velocitat a 80 Quilòmetres per Hora a Tota la via de Cintura de Palma. 1 February 2021. Available online: https://web.conselldemallorca.cat/documents/774813/882786/20201211_campanya+velocitat+80km.pdf/67fd3e35-286e-2195-abb3-a8f4cbe1acc3?t=1607688544880 (accessed on 25 May 2021).
- Dirección General de Tráfico. Reglamento General de Circulación de España; Ministerio de la Presidencia: Madrid, Spain, 2020. [Google Scholar]
- Consell de Mallorca. Carreteres-Departament de Mobilitat i Infraestructures; Consell de Mallorca: Palma, Spain, 2021. [Google Scholar]
- Escobar, D.A.; Holguín, J.M.; Zuluaga, D. Accesibilidad de los centros de ambulancias y hospitales prestadores del servicio de urgencias y su relación con la inequidad espacial. Caso de estudio Manizales-Colombia. Espacios 2016, 37, 20–33. [Google Scholar]
- Brabyn, L.; Skelly, C. Modeling population access to New Zealand public hospitals. Int. J. Health Geogr. 2002, 1, 3. [Google Scholar] [CrossRef] [PubMed]
- Liu, J.; He, M.; Schonfeld, P.M.; Kato, H.; Li, A. Measures of accessibility incorporating time reliability for an urban rail transit network: A case study in Wuhan, China. Transp. Res. Part A Policy Pract. 2022, 165, 471–489. [Google Scholar] [CrossRef]
- Bimpou, K.; Ferguson, N.S. Dynamic accessibility: Incorporating day-to-day travel time reliability into accessibility measurement. J. Transp. Geogr. 2020, 89, 102892. [Google Scholar] [CrossRef]
Disclaimer/Publisher’s Note: The statements, opinions and data contained in all publications are solely those of the individual author(s) and contributor(s) and not of MDPI and/or the editor(s). MDPI and/or the editor(s) disclaim responsibility for any injury to people or property resulting from any ideas, methods, instructions or products referred to in the content. |
© 2023 by the authors. Licensee MDPI, Basel, Switzerland. This article is an open access article distributed under the terms and conditions of the Creative Commons Attribution (CC BY) license (https://creativecommons.org/licenses/by/4.0/).