Abstract
Photovoltaic (PV) array, as the key component of large-scale PV power stations, is prone to frequent failure that directly affects the efficiency of PV power stations. Therefore, accurate classification of the operating state of PV arrays is the basis for fault location. Thus, a novel classification method for PV array operating state was designed based on nonparametric estimation and a 3σ method. The actual data analysis proves the hypothesis that performance ratio (PR) distribution characteristics of PV arrays can characterize the operating state of PV arrays. The modeling curve of the PV array with an excellent performance has only one peak and the peak value is large, while the distribution curve of the PV array with a poor performance has a small peak. In this paper, the distribution characteristics of PV arrays are modeled, the peak value is used to classify the operating state of PV arrays, and finally the effectiveness of the proposed method is compared. Overall, this paper makes a valuable contribution by proposing a novel method for accurately classifying the operating state of PV arrays. The proposed method can help improve the efficiency and fault diagnosis of PV power stations.
1. Introduction
As a vital renewable energy power generation technology, PV power generation has become one of the most promising and competitive forms of energy in many countries and regions [1,2,3,4]. With the continuous advance in PV power generation technology, the installed capacity is increasing, and it also promotes the rapid development and application of the intelligent operation technology of PV power stations. PV array is a crucial component of large-scale PV power stations. Its frequent faults affect the power generation efficiency and even threaten the safety of PV power stations. Moreover, the performance of PV arrays directly affect the performance of the whole PV power station. Thus, it is necessary to master the real-time performance status of PV arrays in time for the safe, efficient and intelligent operation of PV power stations [5,6].
At present, many scholars have studied PV performance evaluation. For example, Sultan proposed the concept of a PV power generation efficiency difference coefficient, and evaluated the performance of PV module cooling technology by calculating the effect of a PV cooler on PV power generation efficiency gain, neutrality or loss, which greatly reduced the performance test cost of PV coolers [7]. Kwon proposed a performance evaluation method of PV power stations through a meteorological monitoring system. The detection data of the output energy was obtained by visiting 10 PV stations with a radius of 8 km according to the installation location of meteorological stations; the correlation and generating capacity of the stations were then evaluated based on the distance [8]. The performance ratio (PR) of PV power stations can reflect their comprehensive operating states. In terms of fault detection and performance evaluation, some scholars have evaluated the power station performance by using PR. For example, Roy analyzed and evaluated the performance of the two PV systems constituting the largest PV roof in the Middle East by using the monthly variation in meteorological data, PR, capacity factors and the total efficiency index of the power station [9]. Bentouba used PR to evaluate the operating performance of a 20 MW PV power station in hot climate conditions [10]. However, at present most of the research into the application of PR sticks to simple calculations of performance, and focuses on an evaluation of the performance of the PV system. However, there has been little research into the evaluation of the PV array level. The excellent arrays obtained by state hierarchy provide a certain guidance for the improvements of subsequent arrays. Faults can be found by studying the inefficient array performance characteristics. Therefore, the operating state classification of PV arrays is of great significance to the operating state and future planning of PV power stations.
In recent years, some researchers have proposed methods of analyzing the state of PV arrays. Commonly used analysis methods include dynamic analysis methods and steady-state analysis methods; Khan simplified the analyzed system by using similarity transformations and analyzed the physical behaviors of the study objects using the optimal homotopy analysis method [11,12]. The on-line detection of the real-time operating state of arrays can help locate faults in time, so it is quite significant. Liu proposed a kind of PV array fault diagnosis method based on a variable prediction model and I–V curve. In the method, five-dimensional effective characteristic variables were extracted from the measured key points of the measured I–V curve as the input of the fault model, and the fault type of PV arrays was then identified by using the normalized characteristic variables as the input of the prediction model [13]. Lu proposed a type of PV array fault diagnosis method based on a convolutional neural network and electrical timing diagram. The input characteristic variables of this method only required the current and voltage of PV arrays, and fault features were automatically extracted from the electrical timing diagram based on a convolutional neural network [14]. Li performed fault diagnosis on PV arrays under different working conditions based on the complete I–V curve and machine learning algorithm, and concluded that the use of the complete I–V curve could more effectively extract the information features than the use of the I–V curve alone [15]. For the real-time status of PV arrays, the available parameters only include the current and voltage of PV arrays. In practical engineering, various uncontrollable factors will result in the uncertainty of PV power generation [16,17,18], and the volatility of data causes the characteristics of different faults of PV arrays to be easily confused [19]. Scholars at home and abroad often turn to non-parametric estimation methods to deal with the above problems. Kernel density estimation (KDE), as a type of non-parametric estimation, has been extensively applied in power generation prediction [20,21,22,23]. KDE can effectively deal with the uncertainty of the array output and provide a new direction for PV array performance evaluation. In this context, with array PR as the evaluation indicator, a statistical analysis method based on real-time arrays was proposed in this paper to evaluate the state of PV arrays. Both electrical parameters and environmental factors were taken into account in the method. Furthermore, its indicators were easy to understand, and it can quickly locate arrays in different operating states.
In summary, to solve the problem of the real-time state classification and partition of PV arrays, a state classification method based on non-parameter estimation and the 3σ method was proposed in this paper. The main sections of this paper are described as follows: Section 1 introduces the data sources, calculates the PR of the PV array, and analyzes its uncertainty at different time scales. Section 2 describes the PV array performance and correlation distribution. In Section 3, the non-parametric estimation method is introduced, and the uncertainty model of the PV array is established. In Section 4, the 3σ method is applied to classify the operating states of the PV arrays, and the state partition method is expounded. In Section 5, the proposed evaluation method is verified from the perspectives of KDE, power, current, and voltage. The Section 6 provides the conclusion to this paper. The main contribution of the paper is the discovery that the distribution characteristics of PR can accurately characterize the operating state of PV arrays. Based on these observations, the authors propose a novel method for dividing the operating state of PV arrays. This is a significant contribution that can aid in the successful implementation and maintenance of large-scale PV power stations.
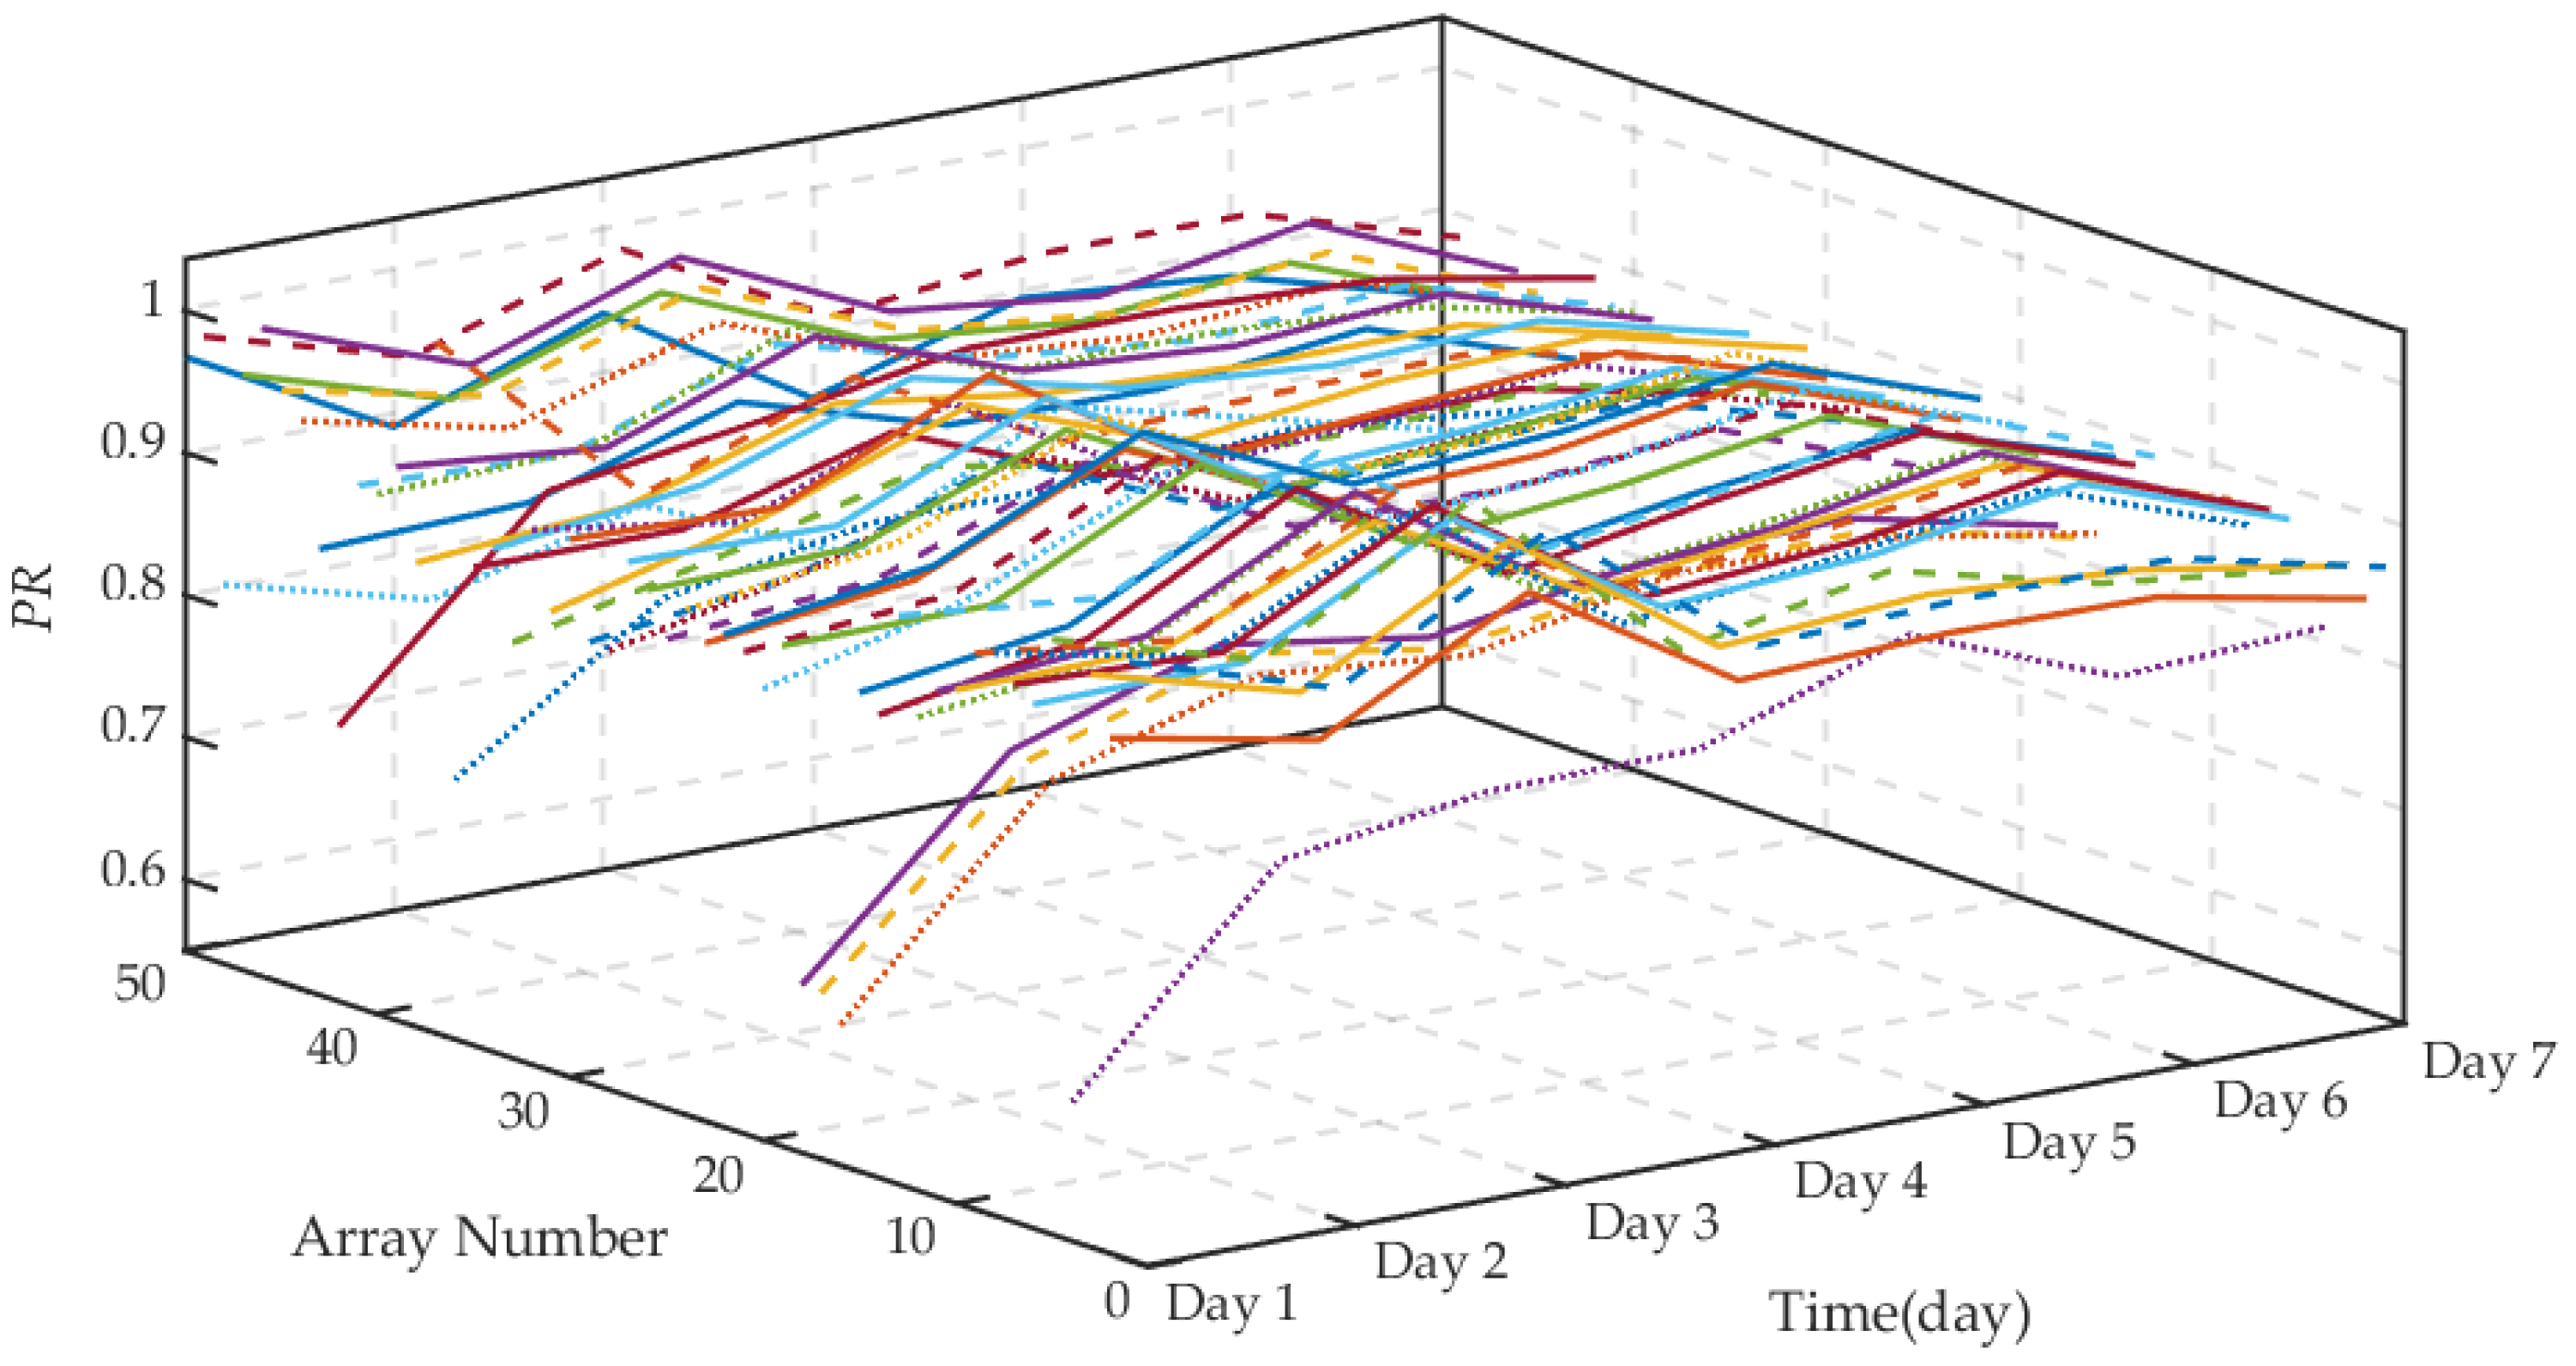
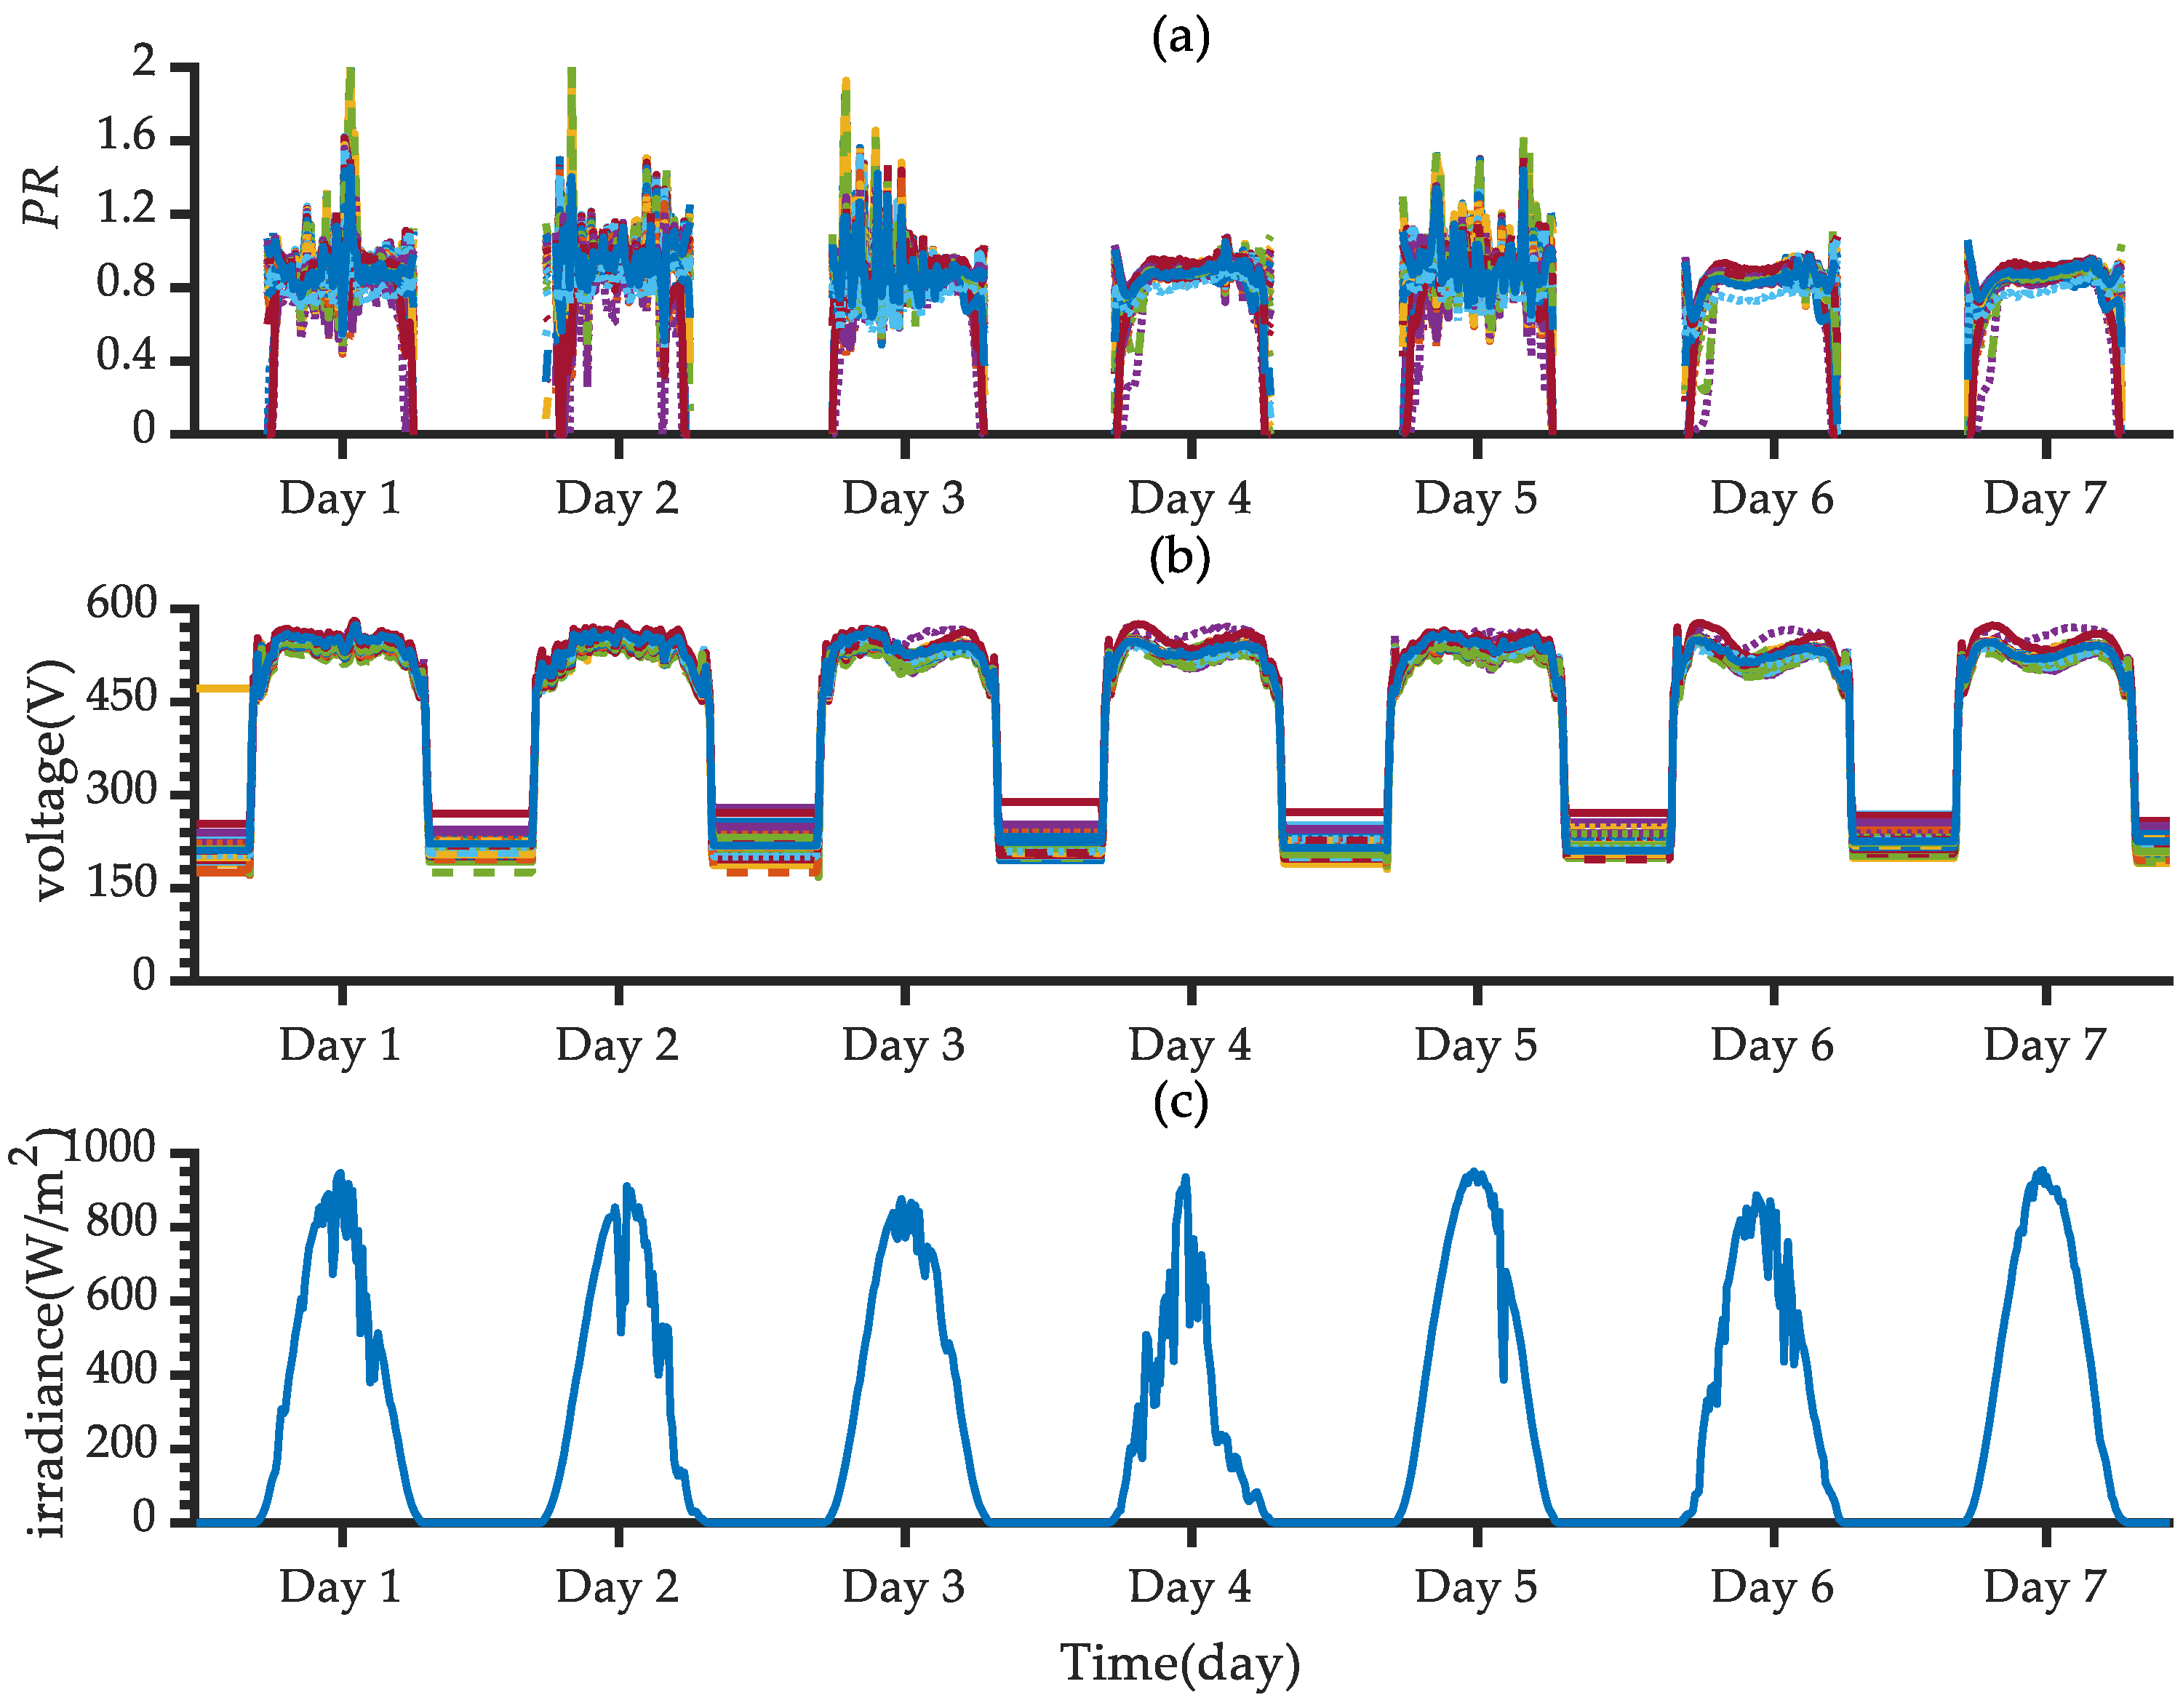
2. Descriptions of the PV Array Performance
The research data for this paper were from a large-scale ground PV power station in China. It contained a total of 553 arrays and 74 centralized inverters. Furthermore, its PV systems collected data for every 10 min, which mainly included the current, voltage, and power data of the arrays, as well as the meteorological data (such as the irradiance, wind speed, humidity, and temperature of the PV power station) collected by meteorological stations.
As one key index of PV system evaluation quality, PR refers to the ratio of the actual and theoretical power generation of PV power stations. It reflects the loss of the whole PV system, including the loss caused by dust, snow, aging, system shutdown, and equipment failure, and it can comprehensively reflect the operating state of the PV power station. Array PR is defined as the ratio of actual and theoretical power generation of the PV array within a period of time, and it can be expressed as follows:
where and denote the actual power generation and theoretical power generation of PV arrays, respectively.
Considering that it was difficult to observe the PR distribution due to a large number of PV arrays, 50 arrays of the PV power station over seven consecutive days in August were selected for calculation, with the results shown in Figure 1 (different colored lines represent different PV arrays). As can be seen from it, the PR of some arrays presented similar changes within the same time period, and the same array had greater changes within different time periods, indicating that the PR could reflect the performance of the PV arrays to a certain extent. In order to identify the outliers and skewness of the PR more directly, the daily PR box plot of the array was drawn, as shown in Figure 2. The PR had a larger range within the first three days, and there were many abnormal fluctuation points. For the data for the seventh day, the outliers were concentrated on the side of smaller values, and presented left-skewed distribution, reflecting that the PR of the PV array had a certain regularity and strong fluctuation.
Figure 1.
Daily PR distribution of the array over seven consecutive days.
Figure 2.
Daily PR box plot of the array over seven consecutive days.
To study the factors influencing the daily PR fluctuation of the PV arrays, the real-time PR of the array was calculated and the correlation between the PR and multiple factors was analyzed. Moreover, the Pearson correlation coefficient between the array PR and many factors (irradiance, wind speed, humidity, ambient temperature, voltage, current, and power) was calculated [24]. Table 1 shows the maximum, minimum and average values of the Pearson correlation coefficient between the array PR and many factors (irradiance, wind speed, humidity, ambient temperature, voltage, current, and power). Based on the analysis, it was found that the array PR had weak correlation with wind speed and humidity; in the environmental factors, the array PR had the strongest correlation with irradiance; in the array output, the PR had the strongest correlation with voltage.
Table 1.
Correlation distribution of array PR and individual factors.
Figure 3 shows the distribution of the array PR, voltage, and irradiance over seven consecutive days in August (different colored lines in each subgraph represent different PV arrays). As it reveals, the irradiance and array PR presented greater fluctuations, while the voltage was relatively stable. Due to the uncertainty in the weather conditions, there were stronger fluctuations in the irradiation. Combining with the definition of the array PR and the correlation analysis between them, the irradiation fluctuation was the main factor causing the fluctuation in the array PR.
Figure 3.
Distribution of array (a) PR, (b) voltage and (c) irradiance over 7 consecutive days in August.
To sum up, the index PR could reflect the operating state of PV arrays to a certain extent, but it presented clear fluctuation characteristics under the influence of many comprehensive factors, which limited its application in the state classification and fault diagnosis of PV arrays. The key to its further application was to characterize and quantify the distribution characteristics of PV arrays.
3. Non-Parametric Probability Density Modeling of the PV Array PR and the Analysis of Fitting Results
In this section, the basic principle of the non-parameter estimation method was introduced; probabilistic modeling was conducted on the PV array PR; the evaluation indexes of the PV array operating state were extracted.
3.1. Uncertainty Modeling Method of the PV Array PR
Unlike in the case of some common probability distributions, it is difficult to fit the distribution characteristics of sample data with a certain distribution in many practical cases; parameter density estimation has a low fitting degree with the real sample distribution, especially when the data present bimodal or multi-modal distribution. In contrast to parameter density estimation, KDE, as a kind of non-parameter estimation, does not rely on prior knowledge and focuses on the characteristics of the data themselves to fit the distribution. It has a good fitting effect for samples with bimodal and multi-modal distributions [25]. For a given set of data ,,,… taken from an unknown continuous distribution , the KDE expression at any point is then as follows [26]:
where represents the kernel function. The common kernel function mainly includes a rectangular kernel function, an Epanechnikov kernel function, and a Gaussian kernel function. As a density function, needs to make the kernel function satisfy the definition of the density function, namely:
Waveform synthesis will occur between adjacent peaks of the kernel density curve when there is a greater number of sample points. Considering the usability of waveform synthesis calculation, the Gaussian kernel function was used in this paper, with the expression as follows:
The modeling process of the kernel density estimation is relatively simple and can be summarized in four steps [27]:
- Select a suitable kernel function and set the width (or bandwidth) parameter.
- Choose the data samples that will be used for modeling.
- For each data sample point, calculate its contribution function based on the kernel function and width parameter.
- Sum the contribution functions of all data sample points to obtain the final probability density estimation function.
Taking the real-time PR data of 50 arrays in August as the samples, the optimal window width of 1.06, and of the number of sampling time points, we established the PV array PR uncertainty model as shown in Figure 4 (different colored lines represent different PV arrays).
Figure 4.
Kernel density distribution curve of array PR.
3.2. Distribution Characteristics Analysis of the PV Array PR
Most of the array kernel density curves show unimodal distribution, with the difference being that the probability density peaks of different arrays are quite different, and that some array kernel density curves show bimodal distribution. By observing the distribution of probability density curves, we can classify them into four types, namely, normal, bimodal, big peak, and small peak. The daily generating capacity of the four types of arrays over seven consecutive days was calculated, with the results shown in Table 2. The array with the least generating capacity was the array with the minimum peak. The array with the bimodal distribution also had poor generating capacity, while the array with the bimodal distribution also had a smaller peak; that is, the array with a small peak had poor power-generating performance. In contrast, normal arrays and the arrays with the maximum peak had a good power-generating performance. The real-time PR of the arrays over seven consecutive days under the four types of curves was compared. As can be seen in Figure 5c, the arrays with the largest peak value had the most stable PR, namely, they had small fluctuations, and the fewest outliers. Furthermore, normal arrays had the second most stable PR. The arrays with the smallest peak value and the arrays of bimodal distribution stability had poor stability. Additionally, most of the arrays with the smallest peak value had the smallest PR among the four types of arrays at that moment. In summary, the arrays with the largest peak had excellent power generation and stable performance.
Table 2.
Daily power generation over 7 consecutive days.

Figure 5.
(a) Comparison of power generation (b) Comparison of probability density curves (c) Comparison of PR.
4. The Method Proposed for Analyzing PV Array Operating State
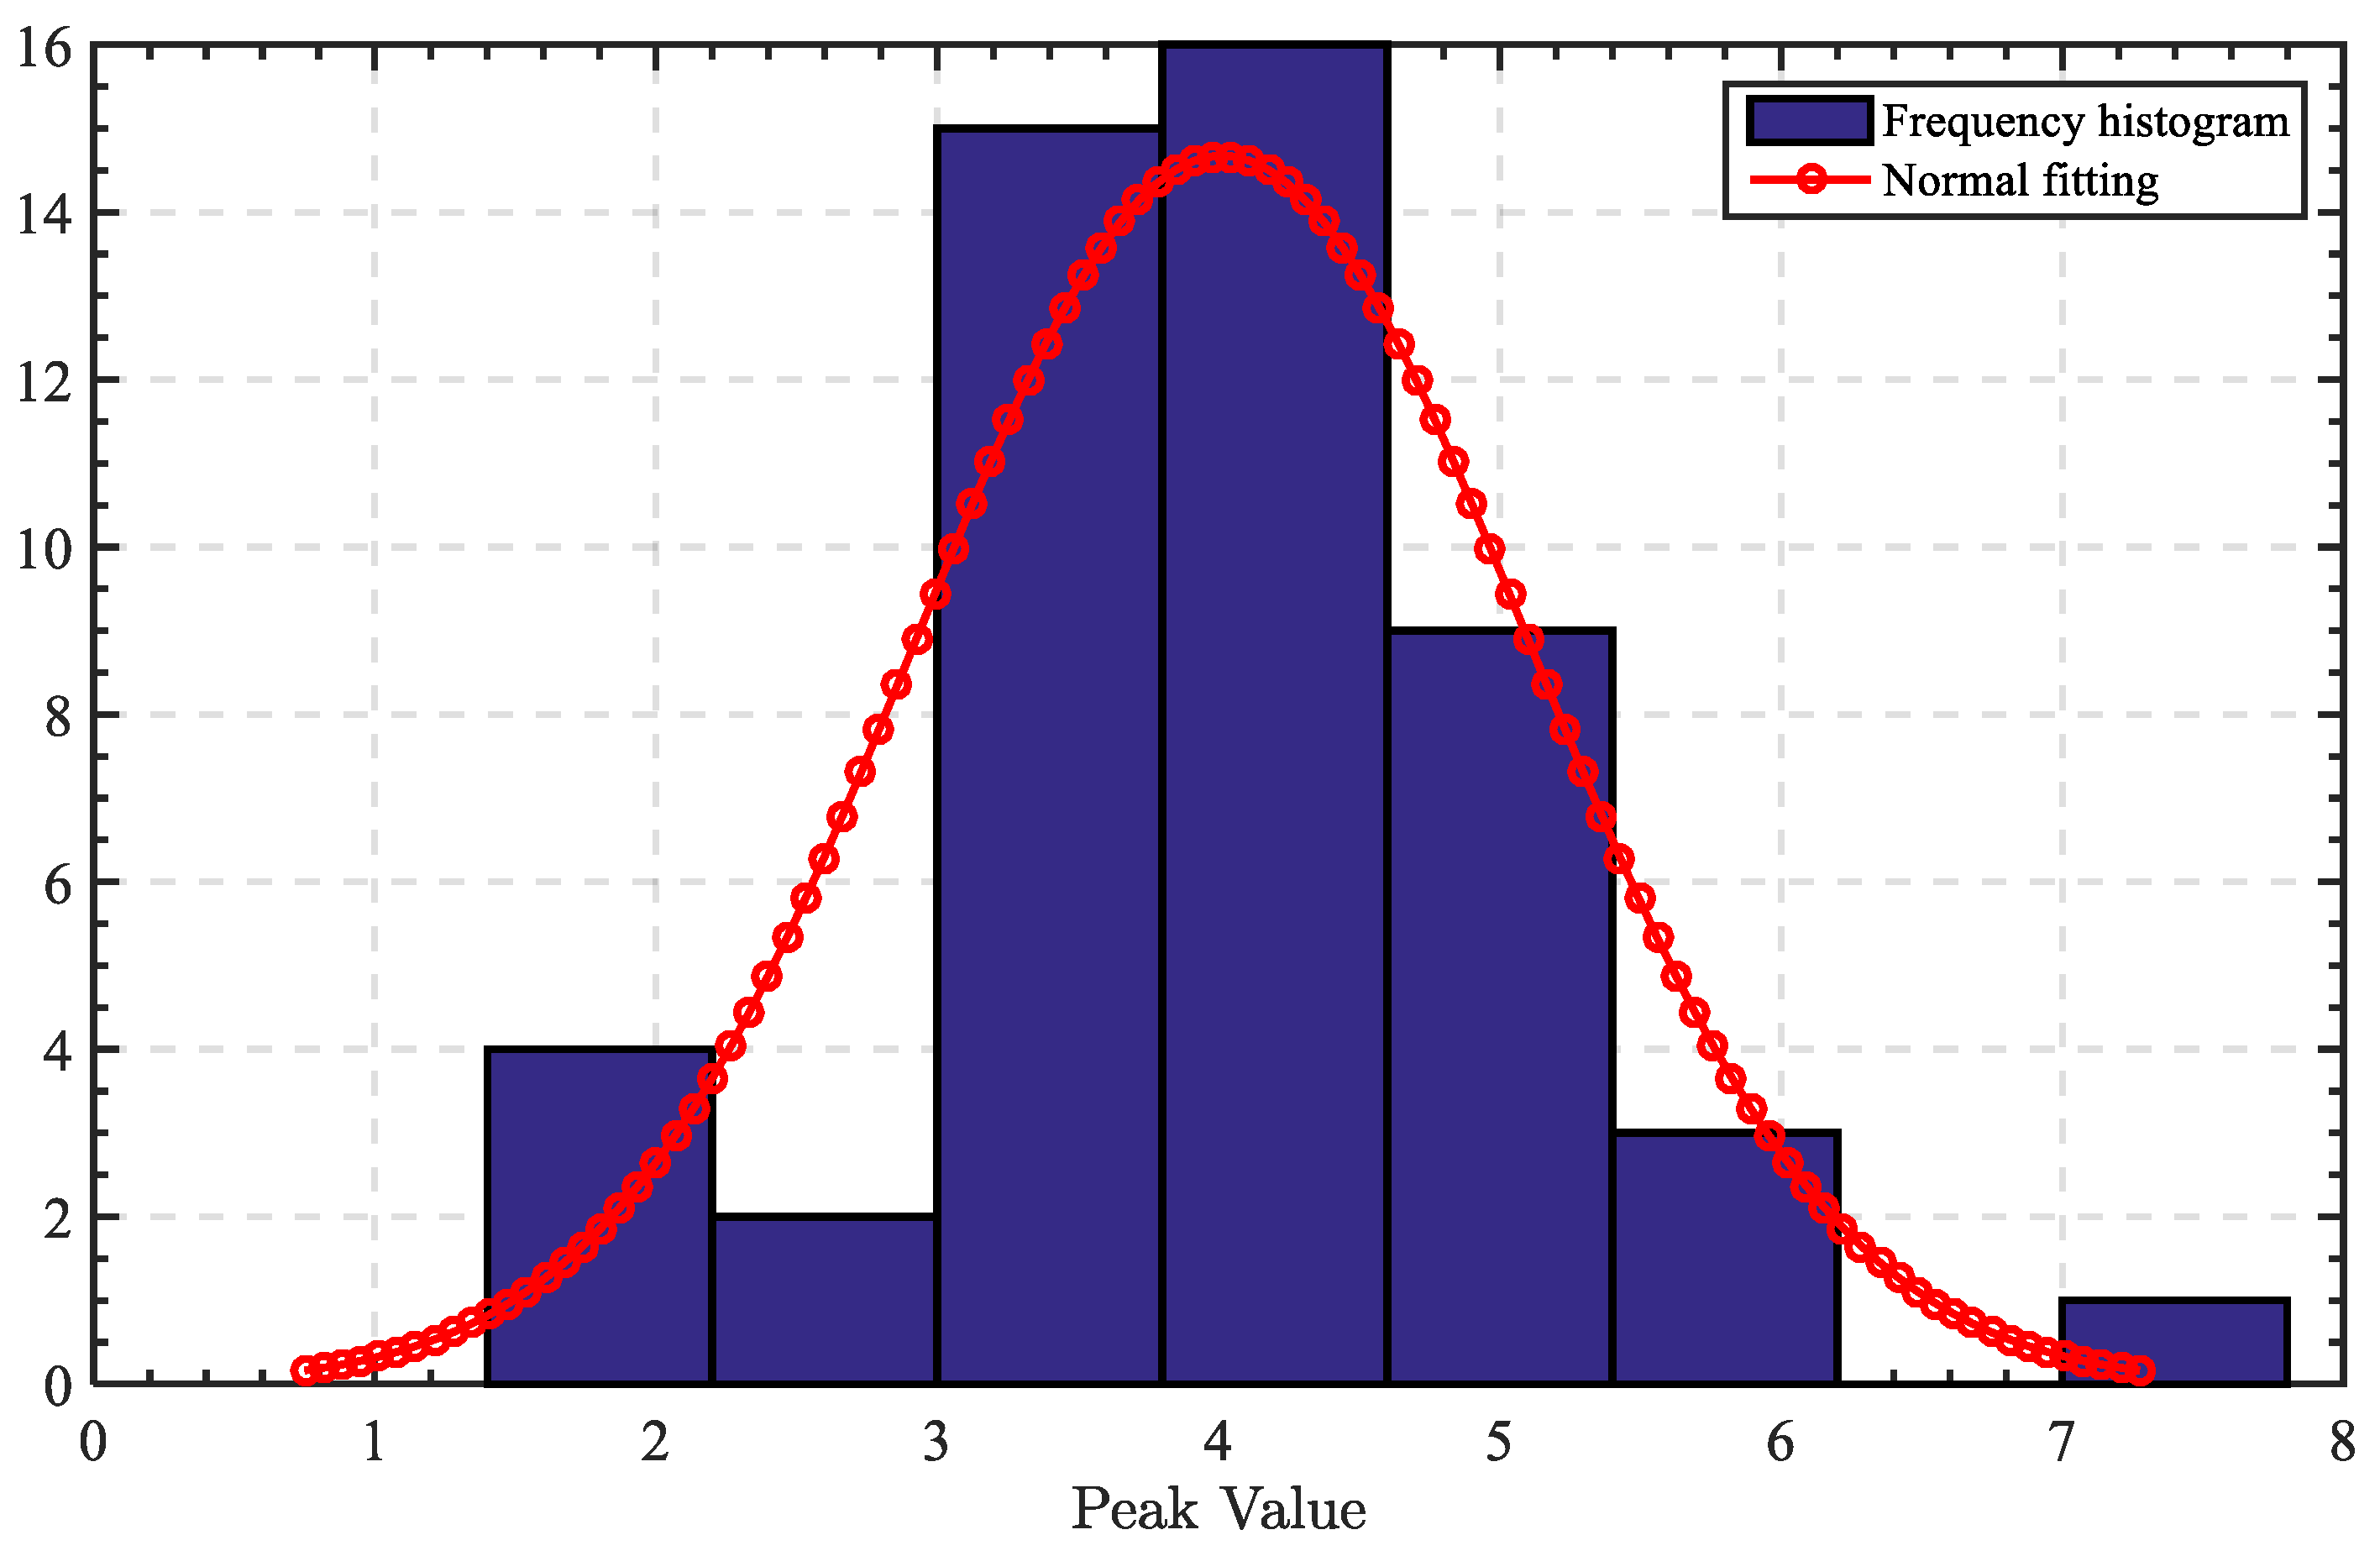
4.1. Principle of the 3σ Method and the Determination of the State Classification Threshold
Non-parametric probability density modeling was conducted for all arrays of a power station. A histogram was drawn for the peak value of the obtained distribution curve and the distribution function was fitted (as shown in Figure 6). The peak value presented an approximately normal distribution. The absolute value of the residual corresponding to the th peak was calculated, and the standard deviation estimate . Four levels were defined, and they are respectively marked as excellent, normal, inefficient, and problem array. Where, is denoted as excellent array; is denoted as normal array; is denoted as inefficient array, and is denoted as problem array.
Figure 6.
PR Peak distribution.
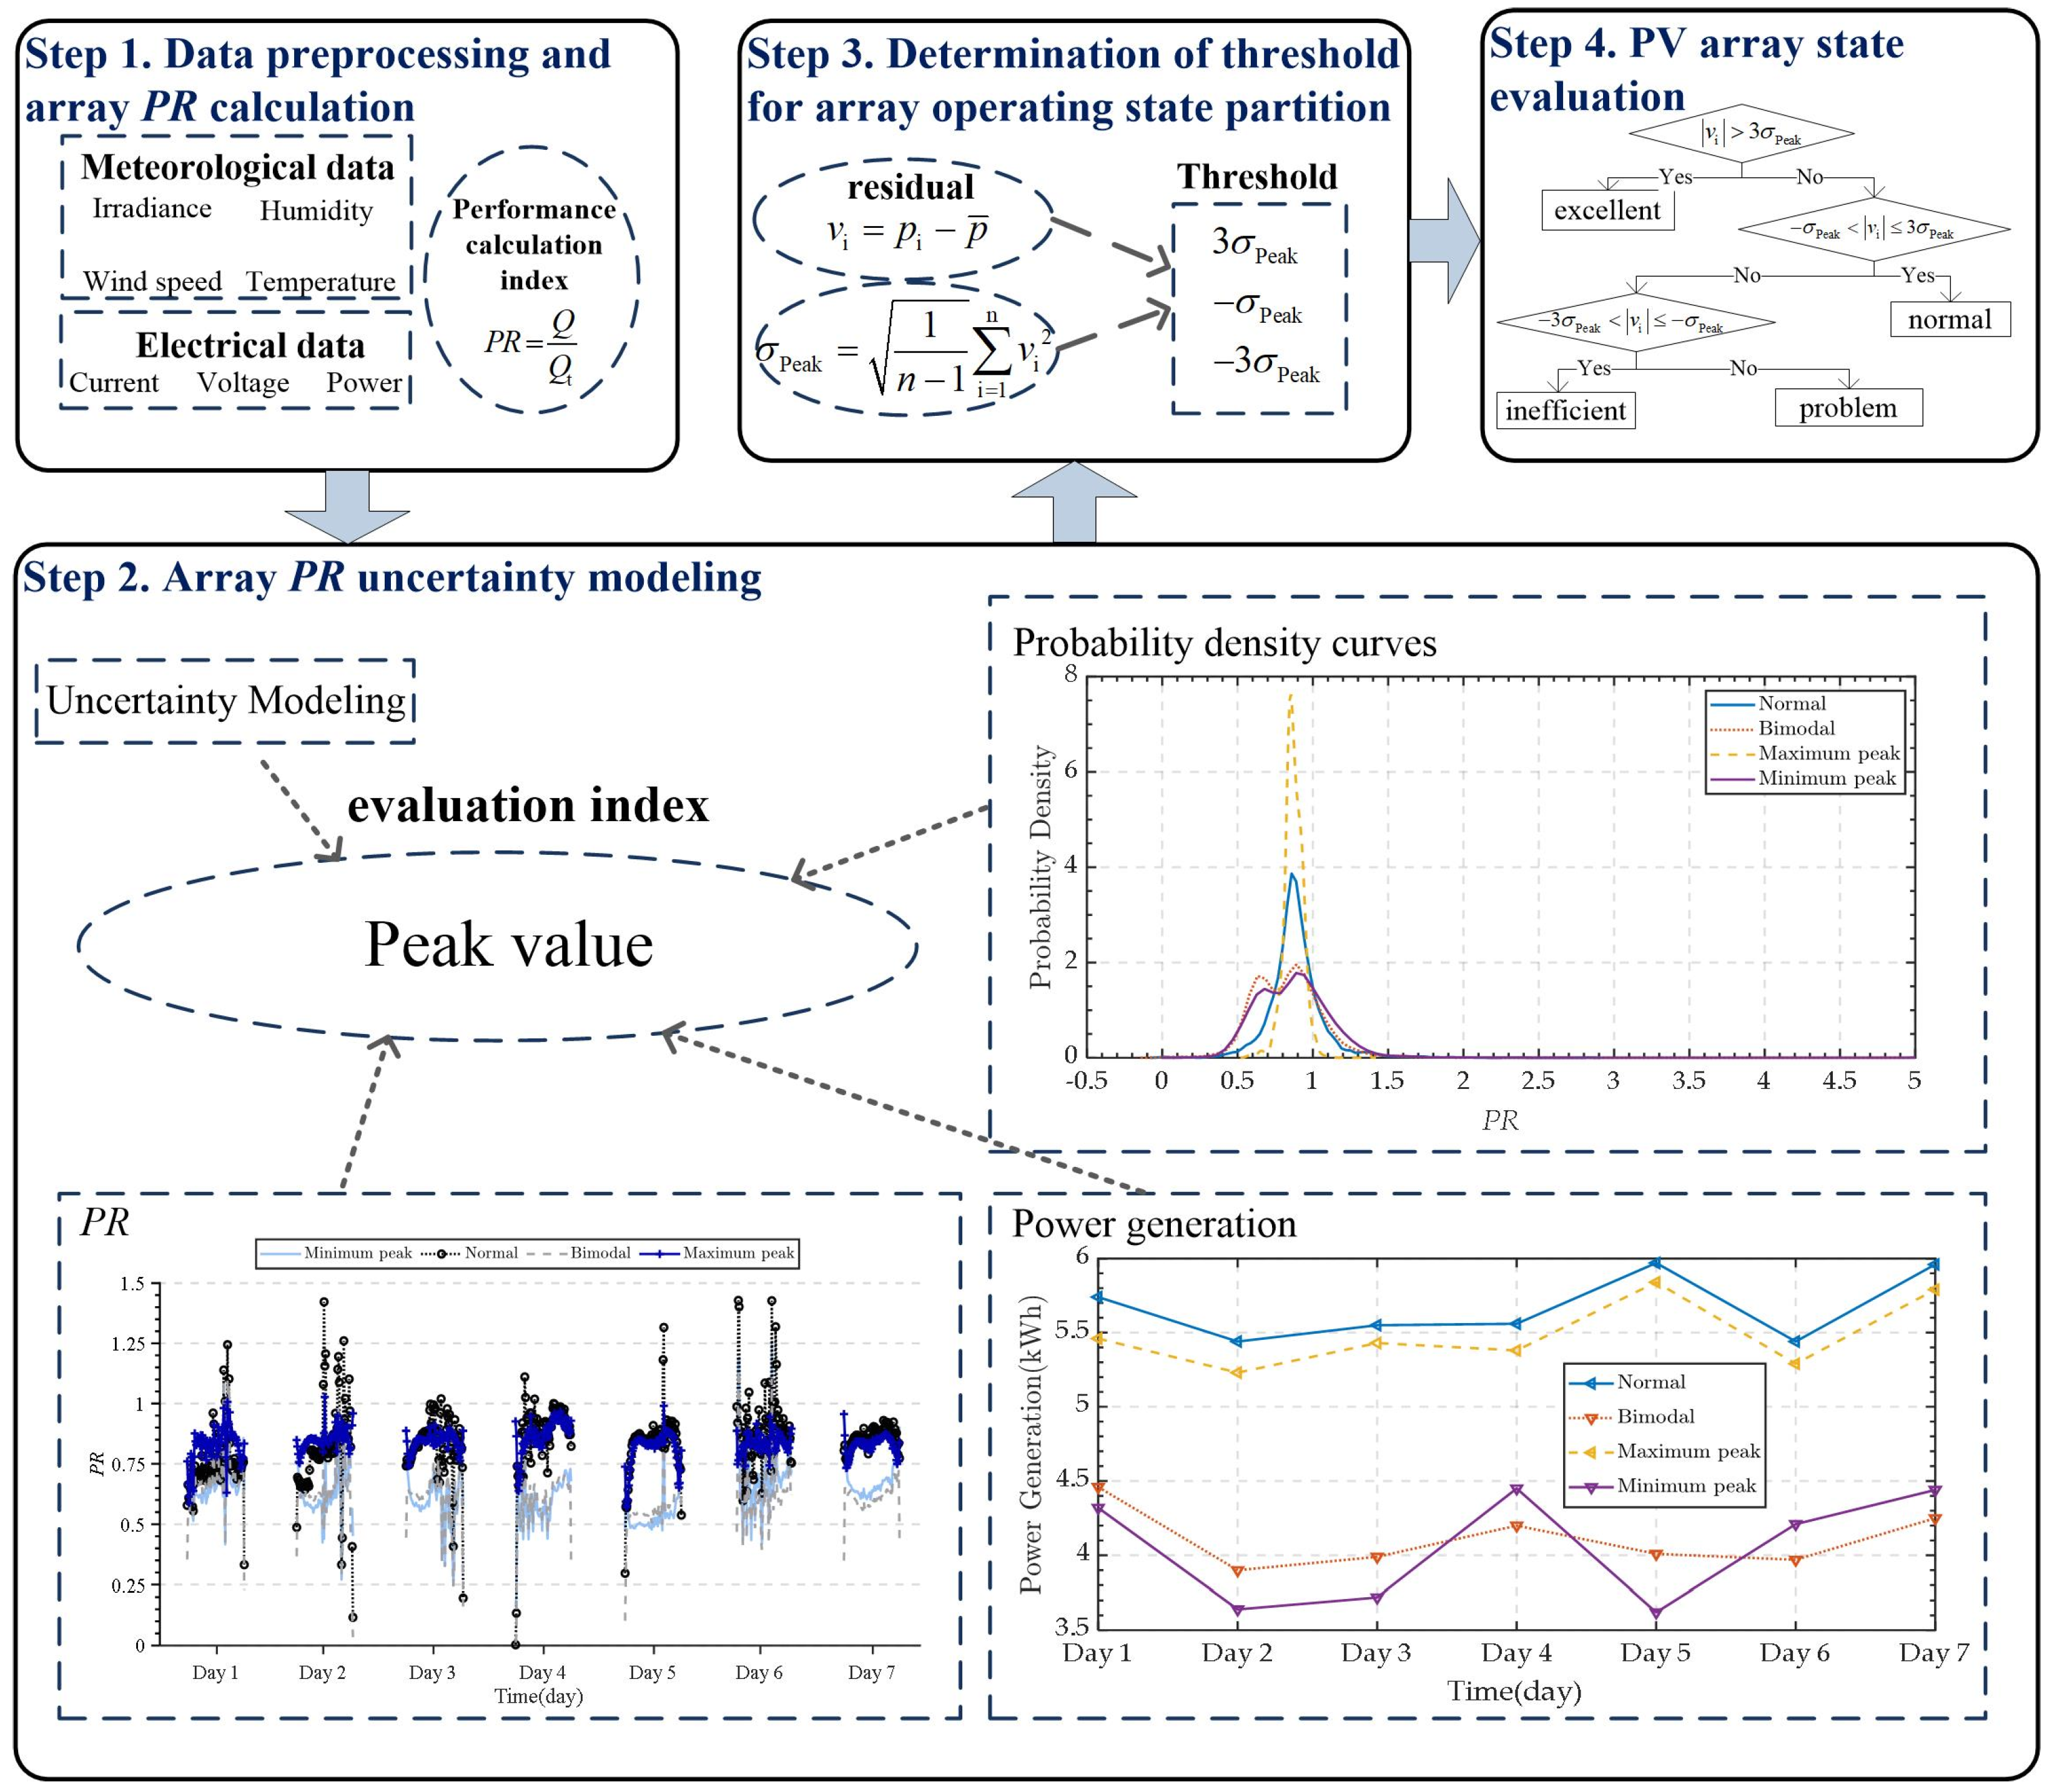
4.2. The Proposed Method
Based on the uncertainty theory of the PV array level performance calculation method, the PV array state analysis method shown in Figure 7 was proposed here. It included four steps, of which Steps 1–3 were the training process, and Step 4 was the PV array state classification process:
Figure 7.
Steps of the PV array state analysis method.
- Data preprocessing and array PR calculation: First, we cleaned the collected historical data of the PV arrays, deleted unreasonable data and low irradiance data, and then calculated the array PR.
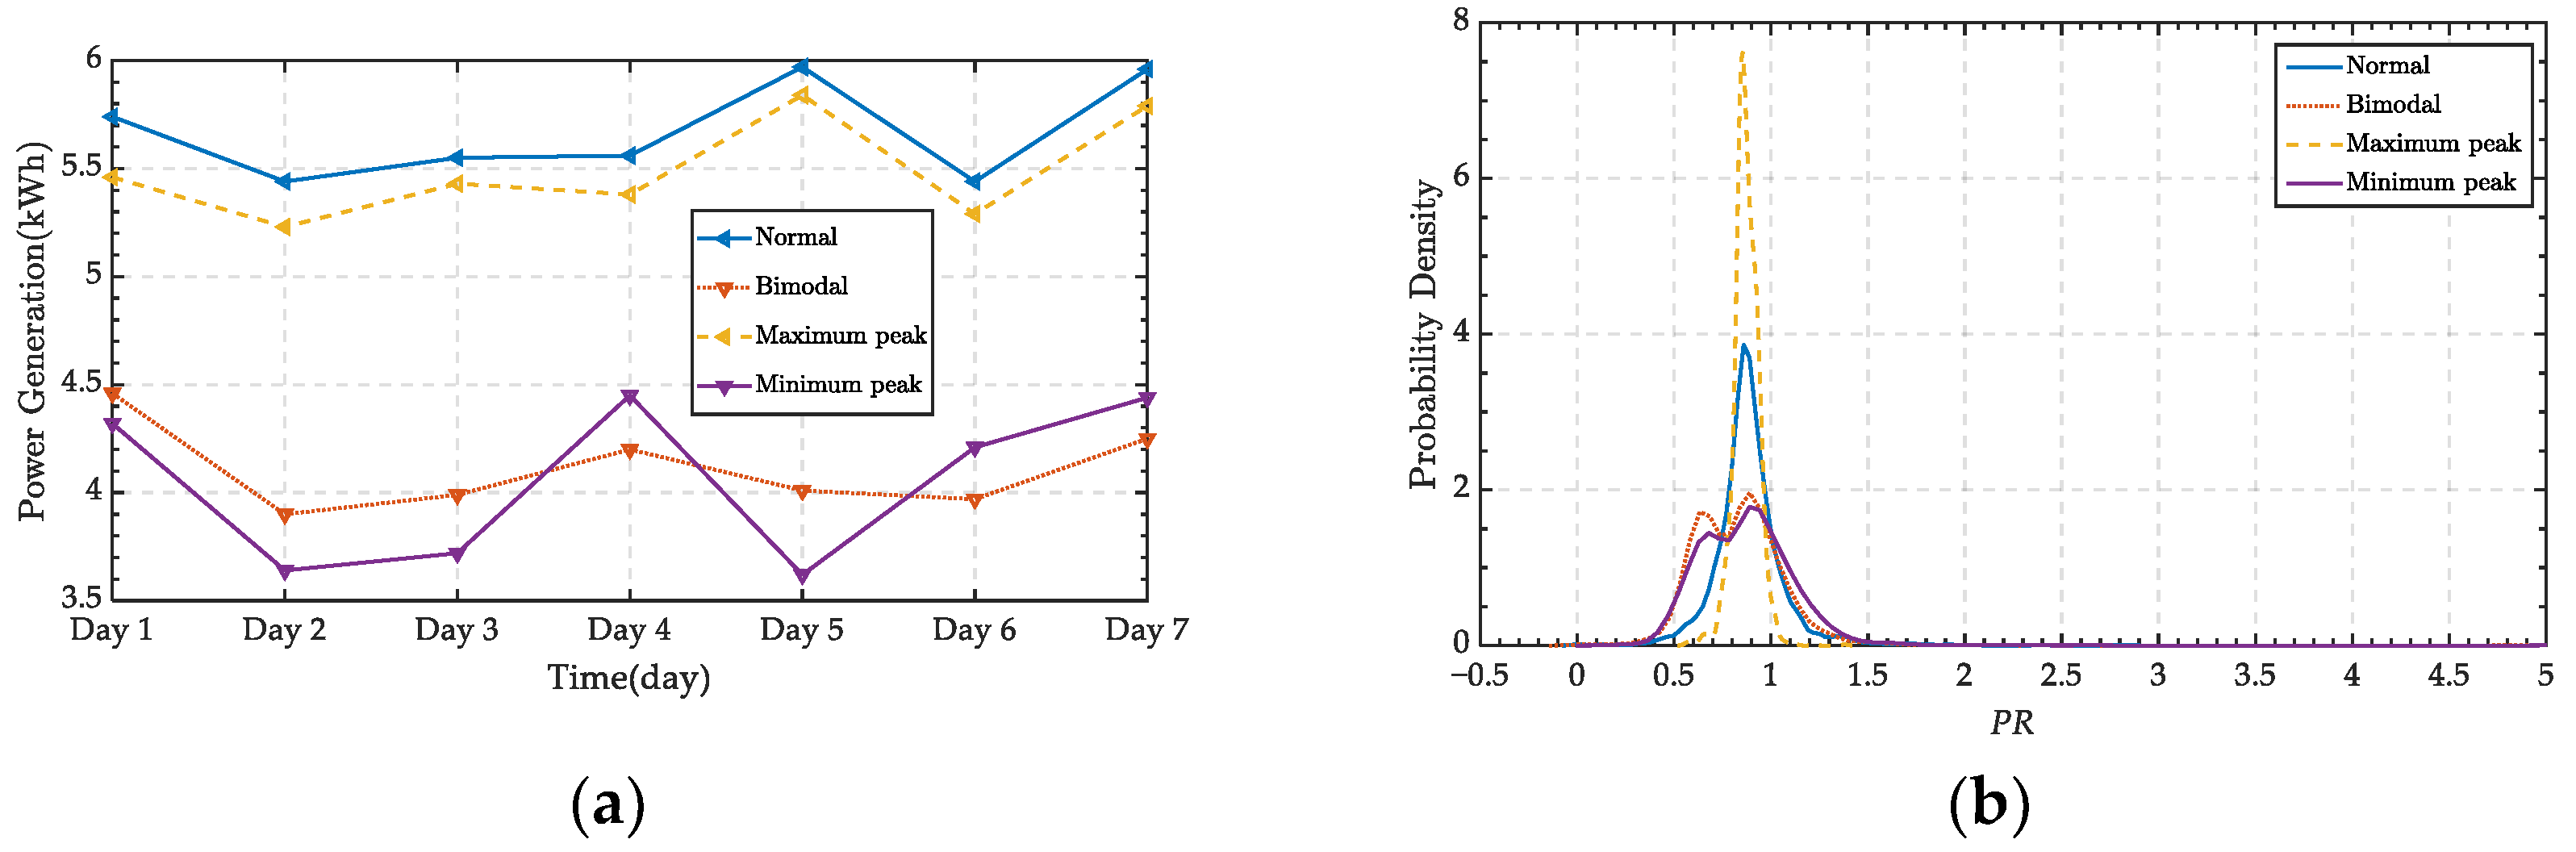
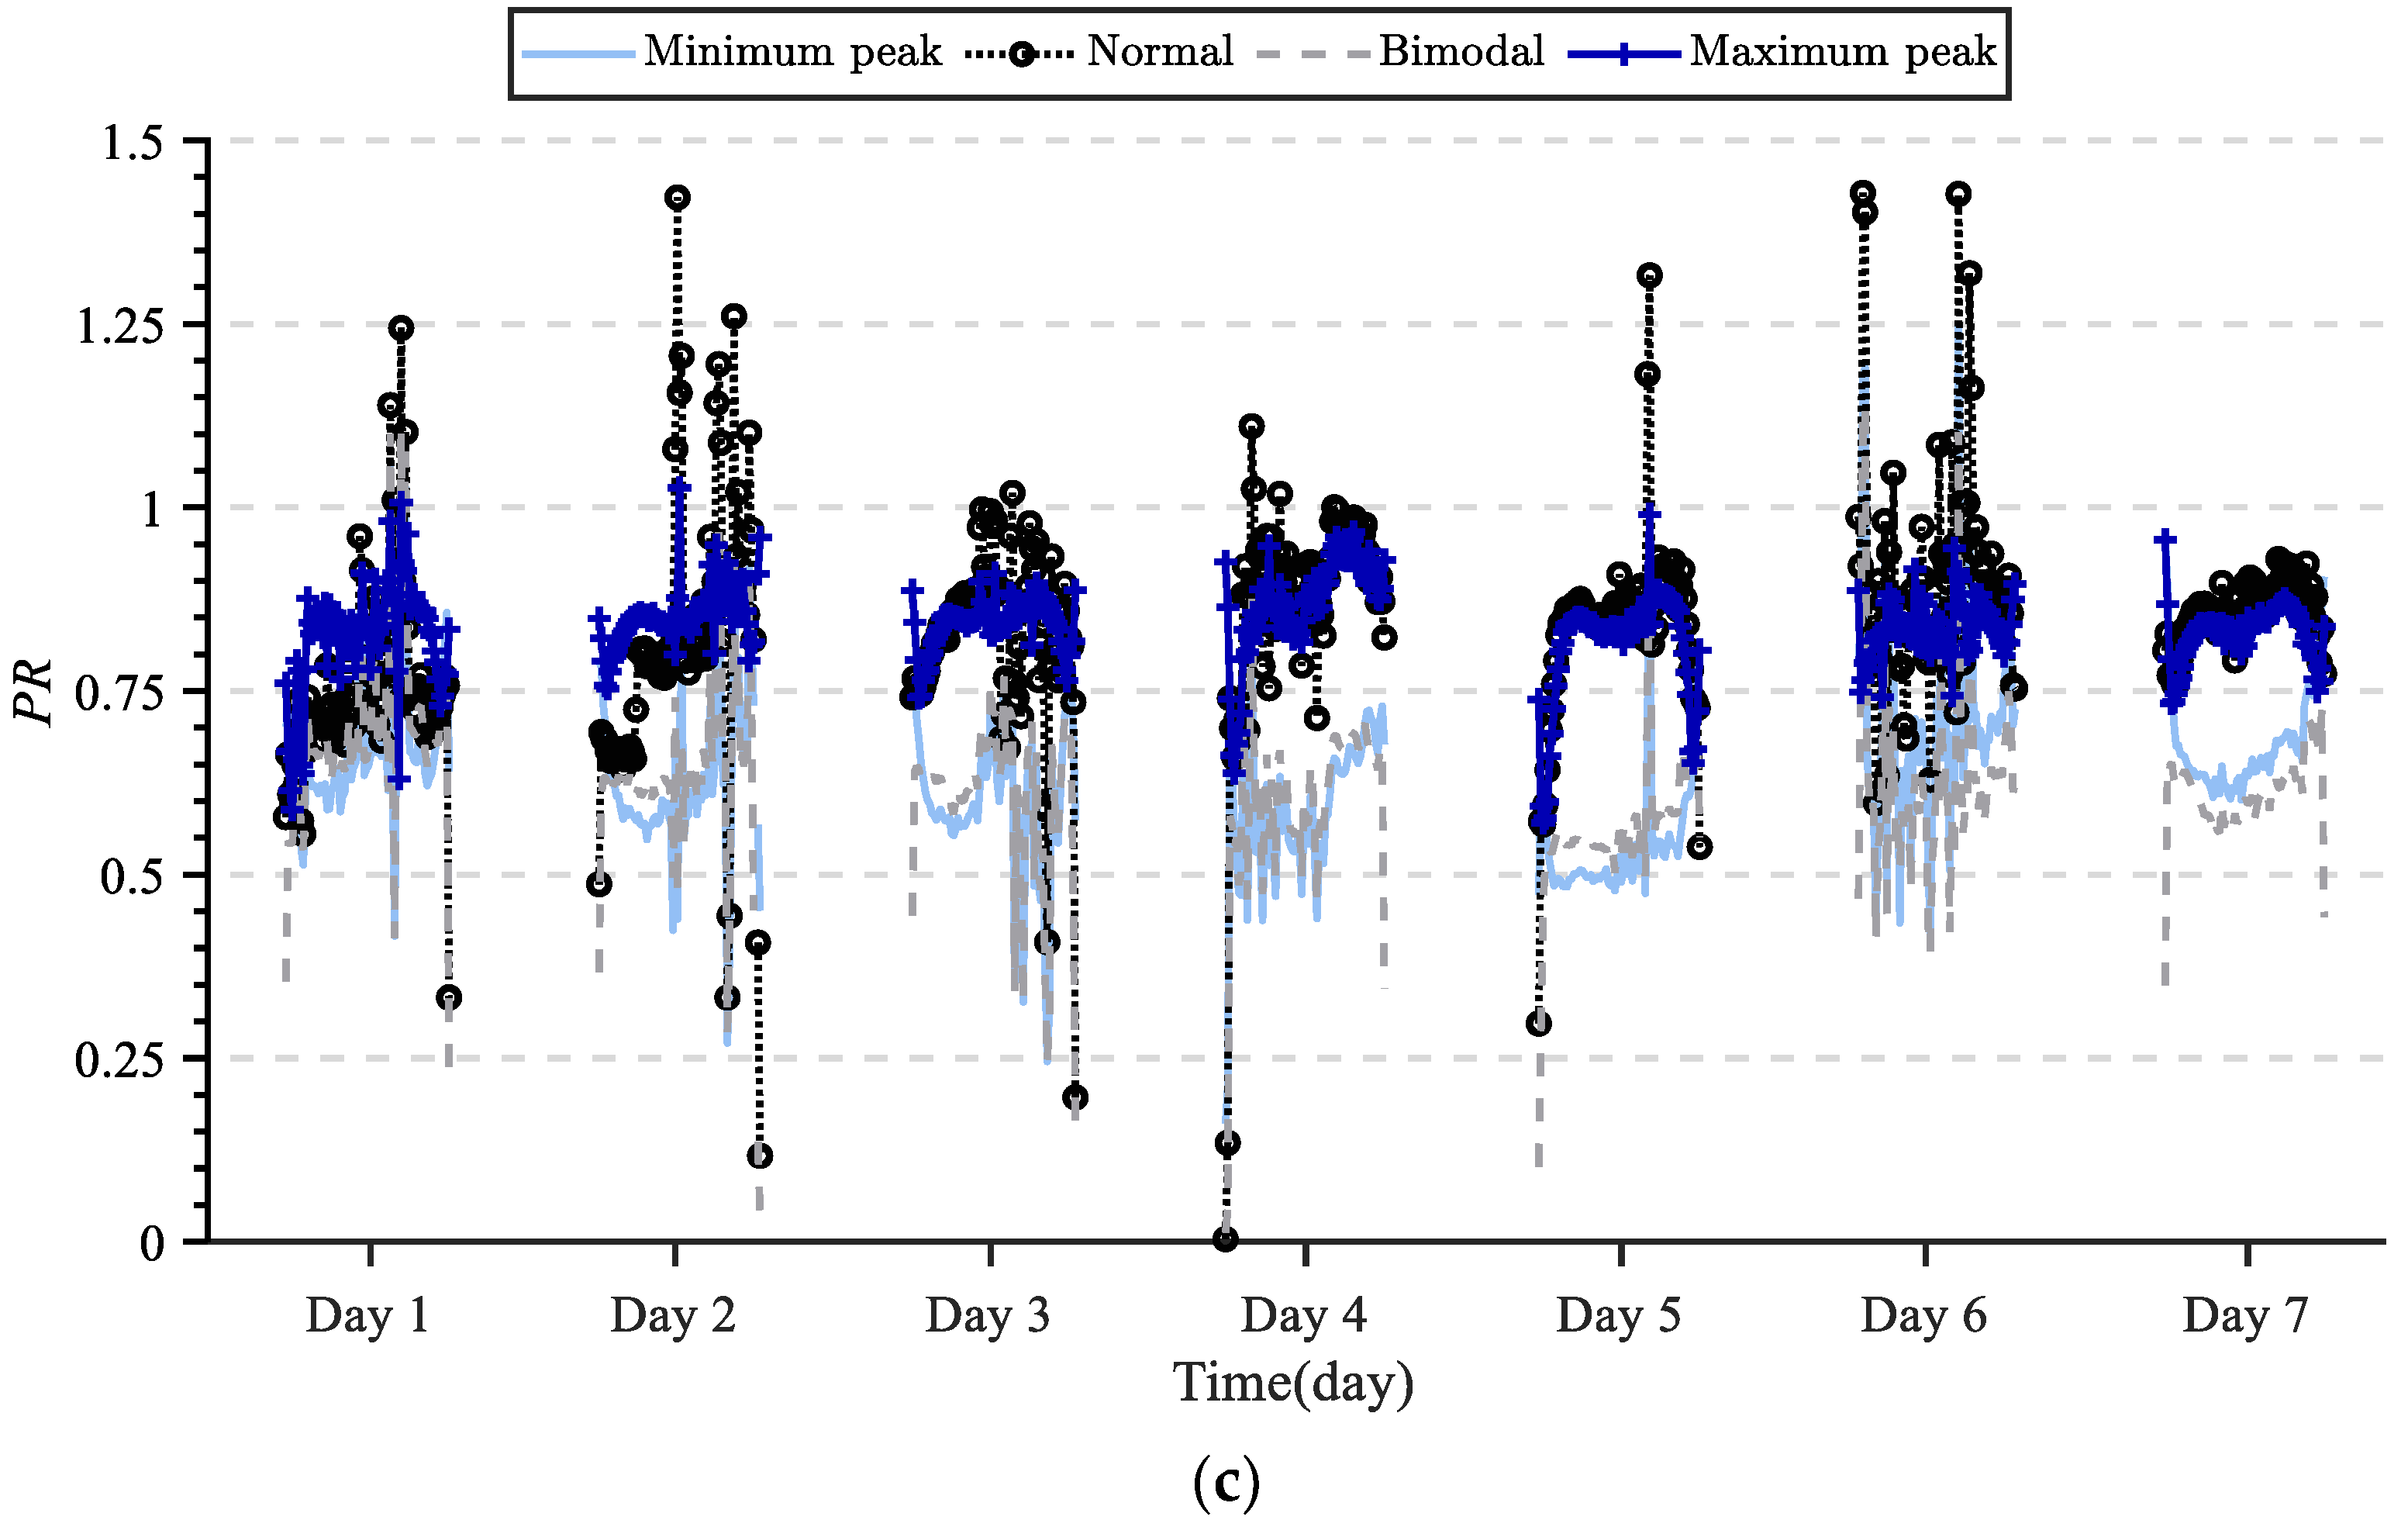
- Array PR uncertainty modeling: The probability model of arrays was established by using the non-parametric KDE method. After analysis, it was found that the peak density of the array kernel with large cumulative power generation was large. Thus, the evaluation index of the state division was determined as the peak value of probability density curves.
- Determination of threshold for array operating state partition: The 3σ method was used to classify the peak value of the probability density curve into four grades (i.e., excellent, normal, inefficient, and problematic), and determine the threshold of different states.
- PV array state evaluation: We calculated the peak value of the PV array according to the fixed time window, compared it with the threshold and finally determined the operating state of the PV array.
5. Algorithm Performance Analysis
To verify the effectiveness of the array evaluation method proposed in this paper, 50 arrays from the whole station were selected for analysis.
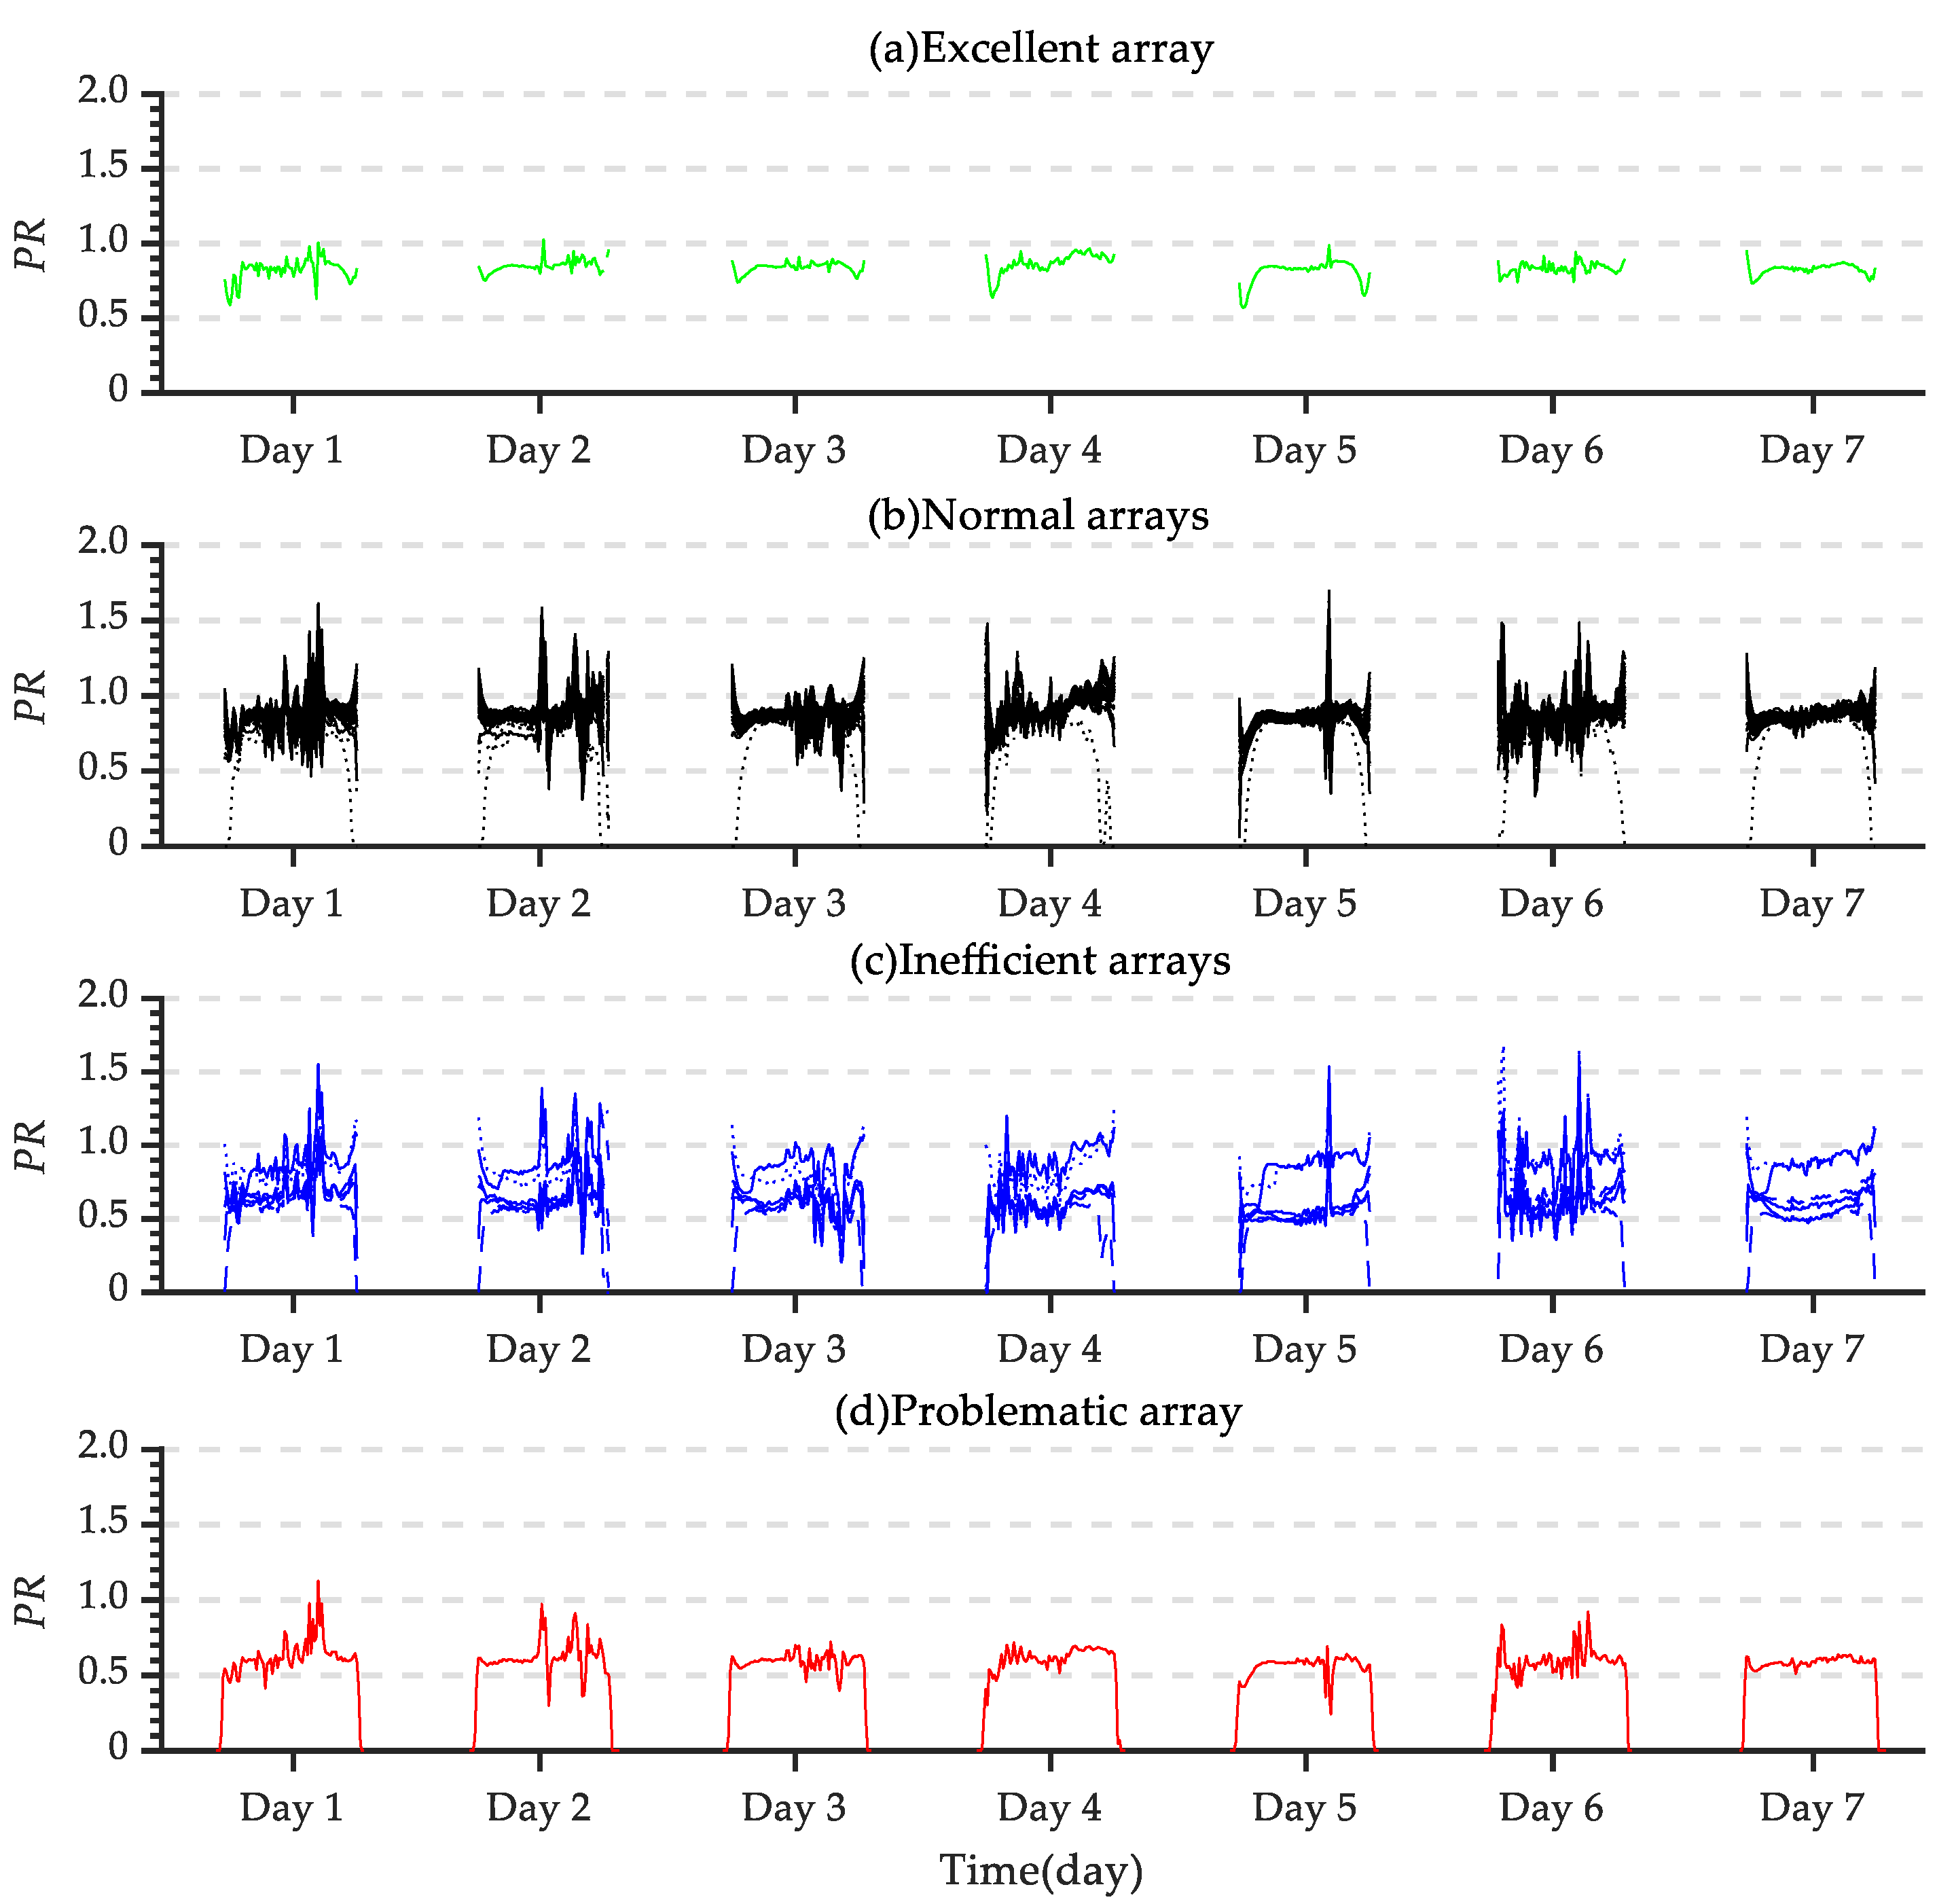
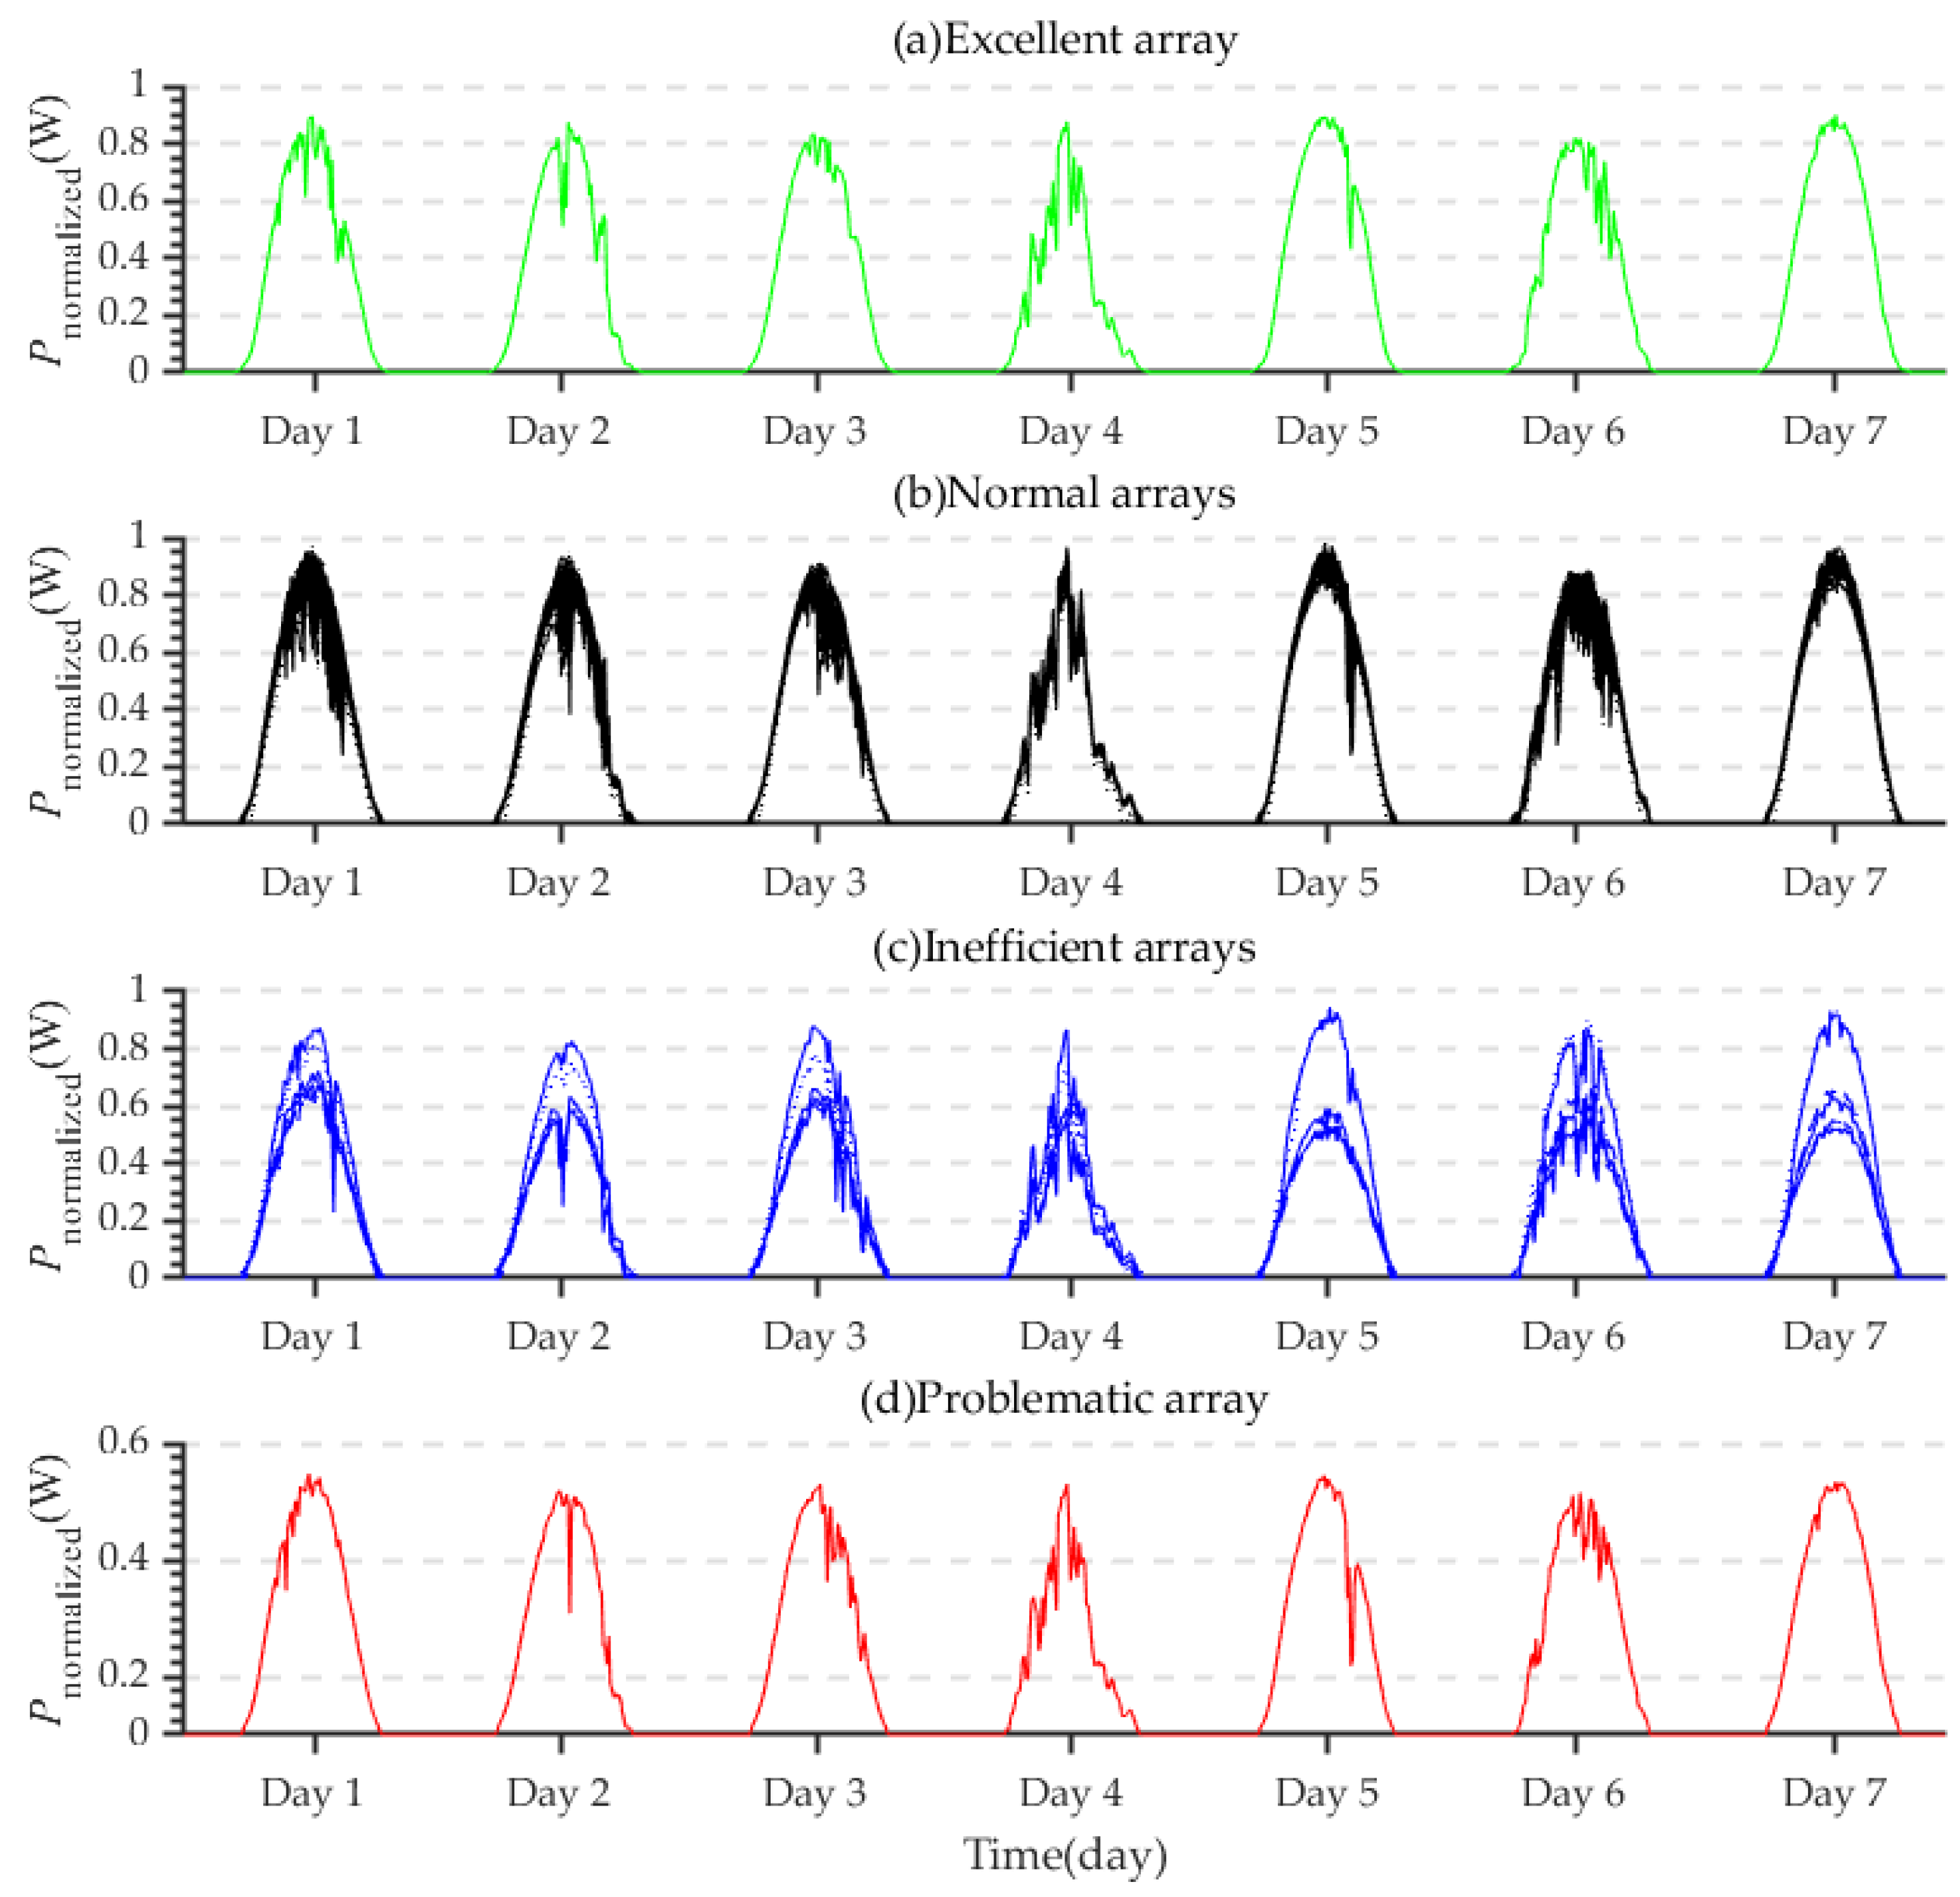
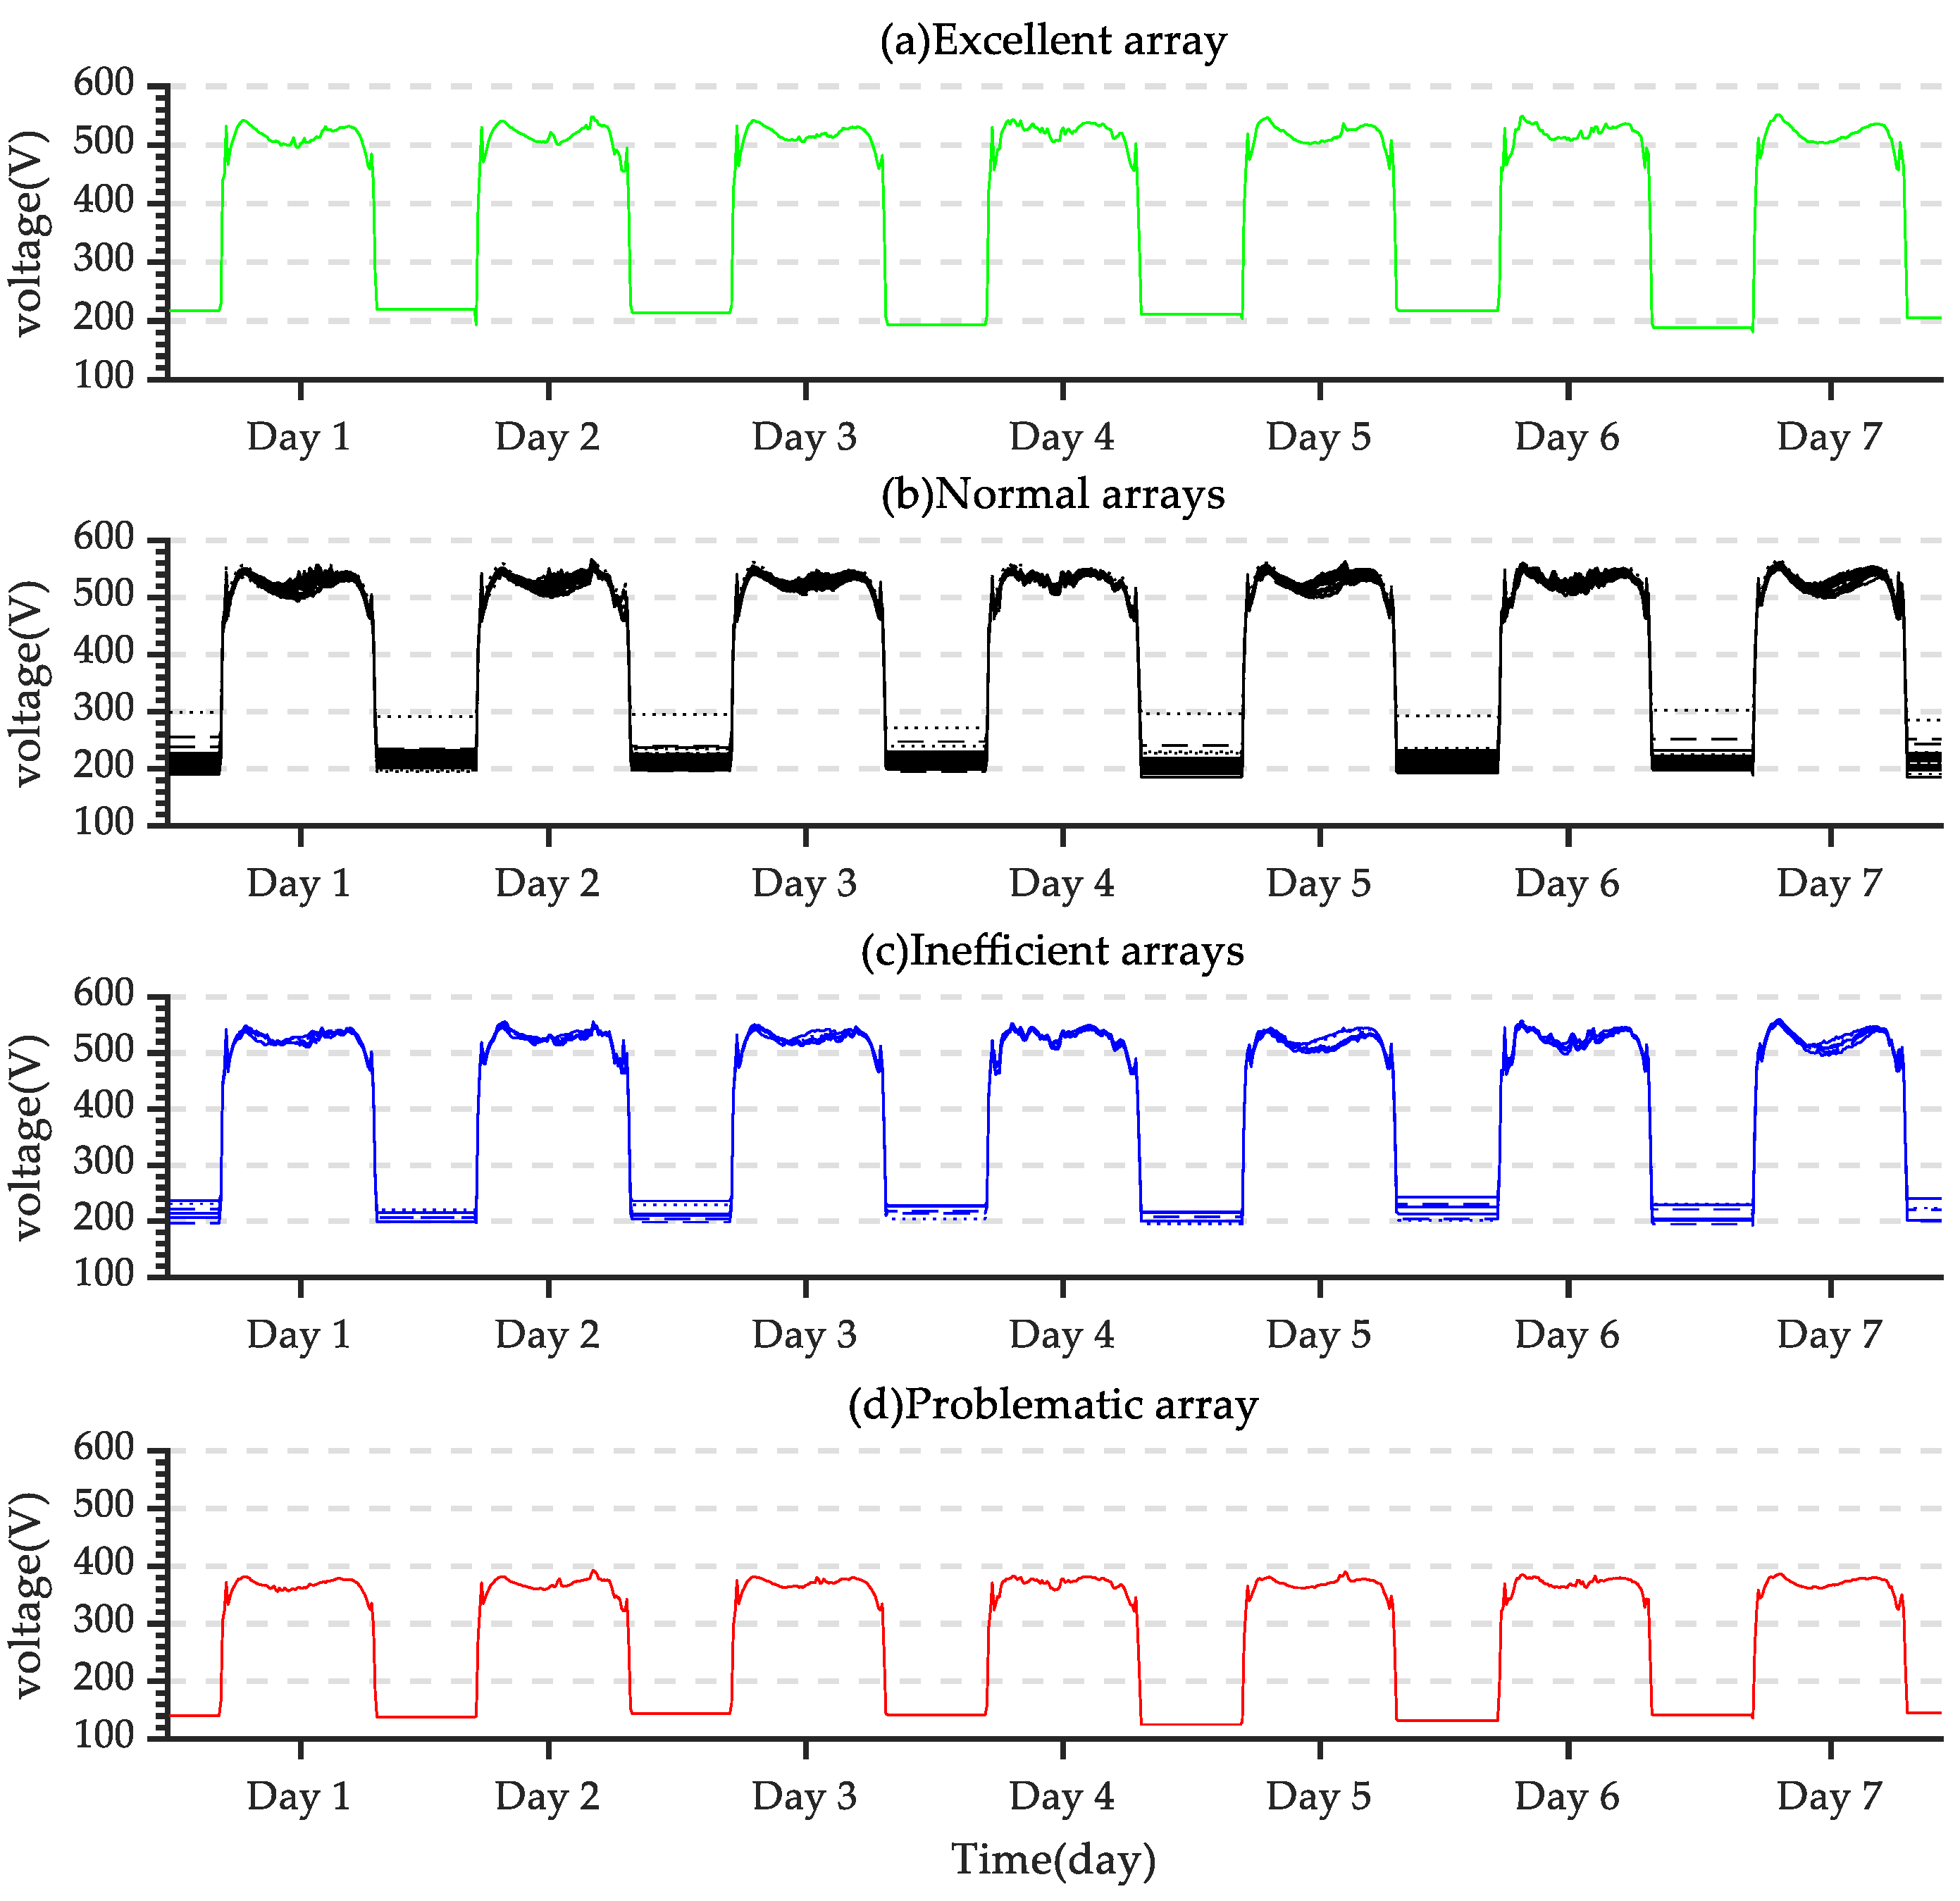
5.1. Analysis of PR by Different Division and Their Electrical Characteristics
This section first analyzes the arrays under four states from the perspective of arrays that comprehensively reflect the array performance, with the results shown in Figure 8. The PR of the excellent arrays was at a higher level, presented the most stable distribution, and had the fewest outliers. The PR of the normal arrays presented a relatively concentrated distribution, without clear stratification, indicating that the arrays in this state had a similar array performance. The PR of the inefficient arrays appeared to have obvious stratification, some of which was lower than the normal level; furthermore, some arrays appeared to have large abnormal fluctuations, and had many outliers. The PR of the problematic array fluctuated around 0.5 (being smaller), indicating that the problematic arrays had a poor PR performance.
Figure 8.
Comparison of PR (a) Excellent array (b) Normal arrays (c) Inefficient arrays (d) Problematic array.
This section analyzes the arrays in four states from the perspective of power. Each array has a different installed capacity in practical engineering; therefore, it is not meaningful to compare the actual generated power. The generated power can be unified under the same reference frame by the normalization method, and its expression is as follows:
where is the actual generated power of the array, and is the installed capacity of the array. Figure 9 shows the distribution of array under four operating states. The of the excellent array was in the middle and upper level of the normal arrays, while the of the normal array was clustered within a certain range without obvious stratification. However, it had more fluctuations than the excellent arrays. The of the inefficient arrays and the problematic arrays was not only significantly reduced, but also greatly fluctuated.
Figure 9.
Comparison of (a) Excellent array (b) Normal arrays (c) Inefficient arrays (d) Problematic array.
This section analyzes the arrays under four states from the perspective of current. The array current was normalized, with the expression as follows:
Distribution of under four operating states was similar to the distribution, so its analysis is not mentioned here.
This section analyzes the arrays under four states from the perspective of voltage, and the structure is shown in Figure 10. The voltage distribution of the arrays under excellent, normal, and inefficient states was similar, and there was no obvious decrease or any other abnormal condition. The voltage of the problematic arrays was lower than that of the arrays in other states. Therefore, the fault of the problematic arrays was a voltage fault.
Figure 10.
Voltage comparison (a) Excellent array (b) Normal arrays (c) Inefficient arrays (d) Problematic array.
In summary, the study found that abnormal fluctuations PR increase and overall PR values decrease as the grade of the PV arrays drops. Furthermore, comparing PV arrays of different grades, the study found that the power and current of the array decreased with a decreasing grade. Comparing voltage distributions also revealed that the voltage of problematic arrays was significantly lower than those of other grades. These findings suggest that the proposed method based on PR distribution characteristics can effectively classify the operating state of PV arrays and aid in improving their efficiency and fault diagnosis.
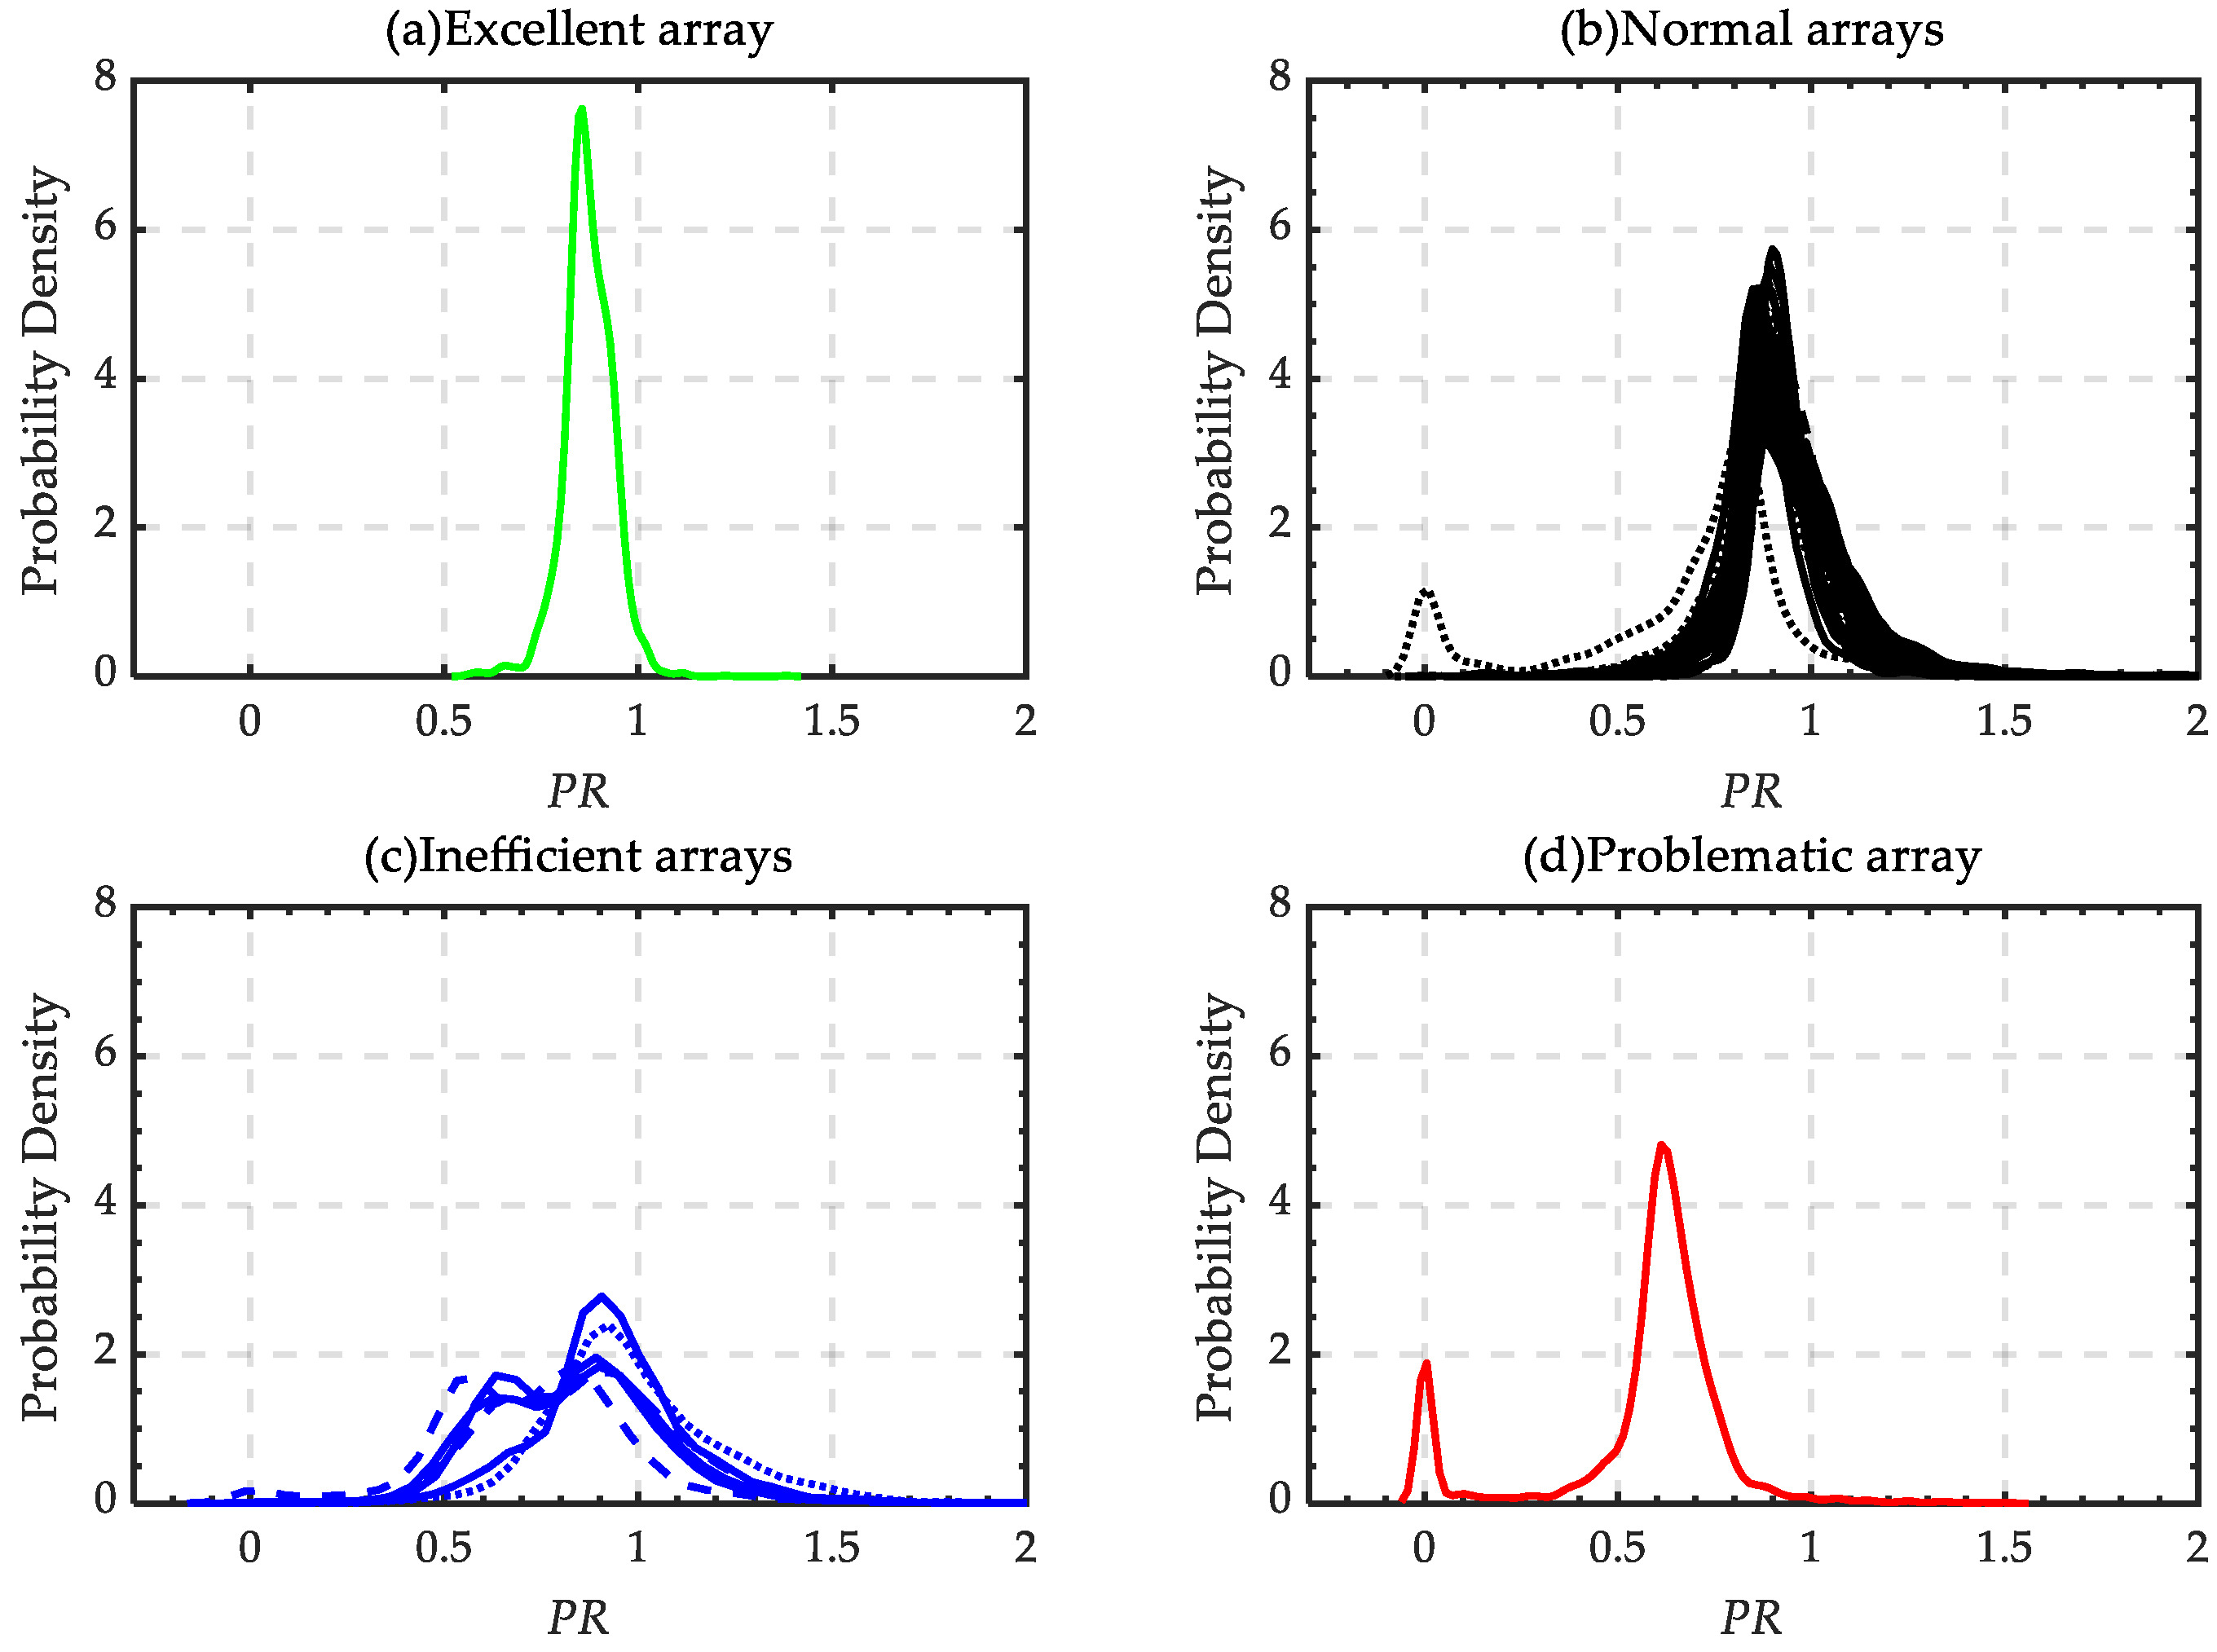
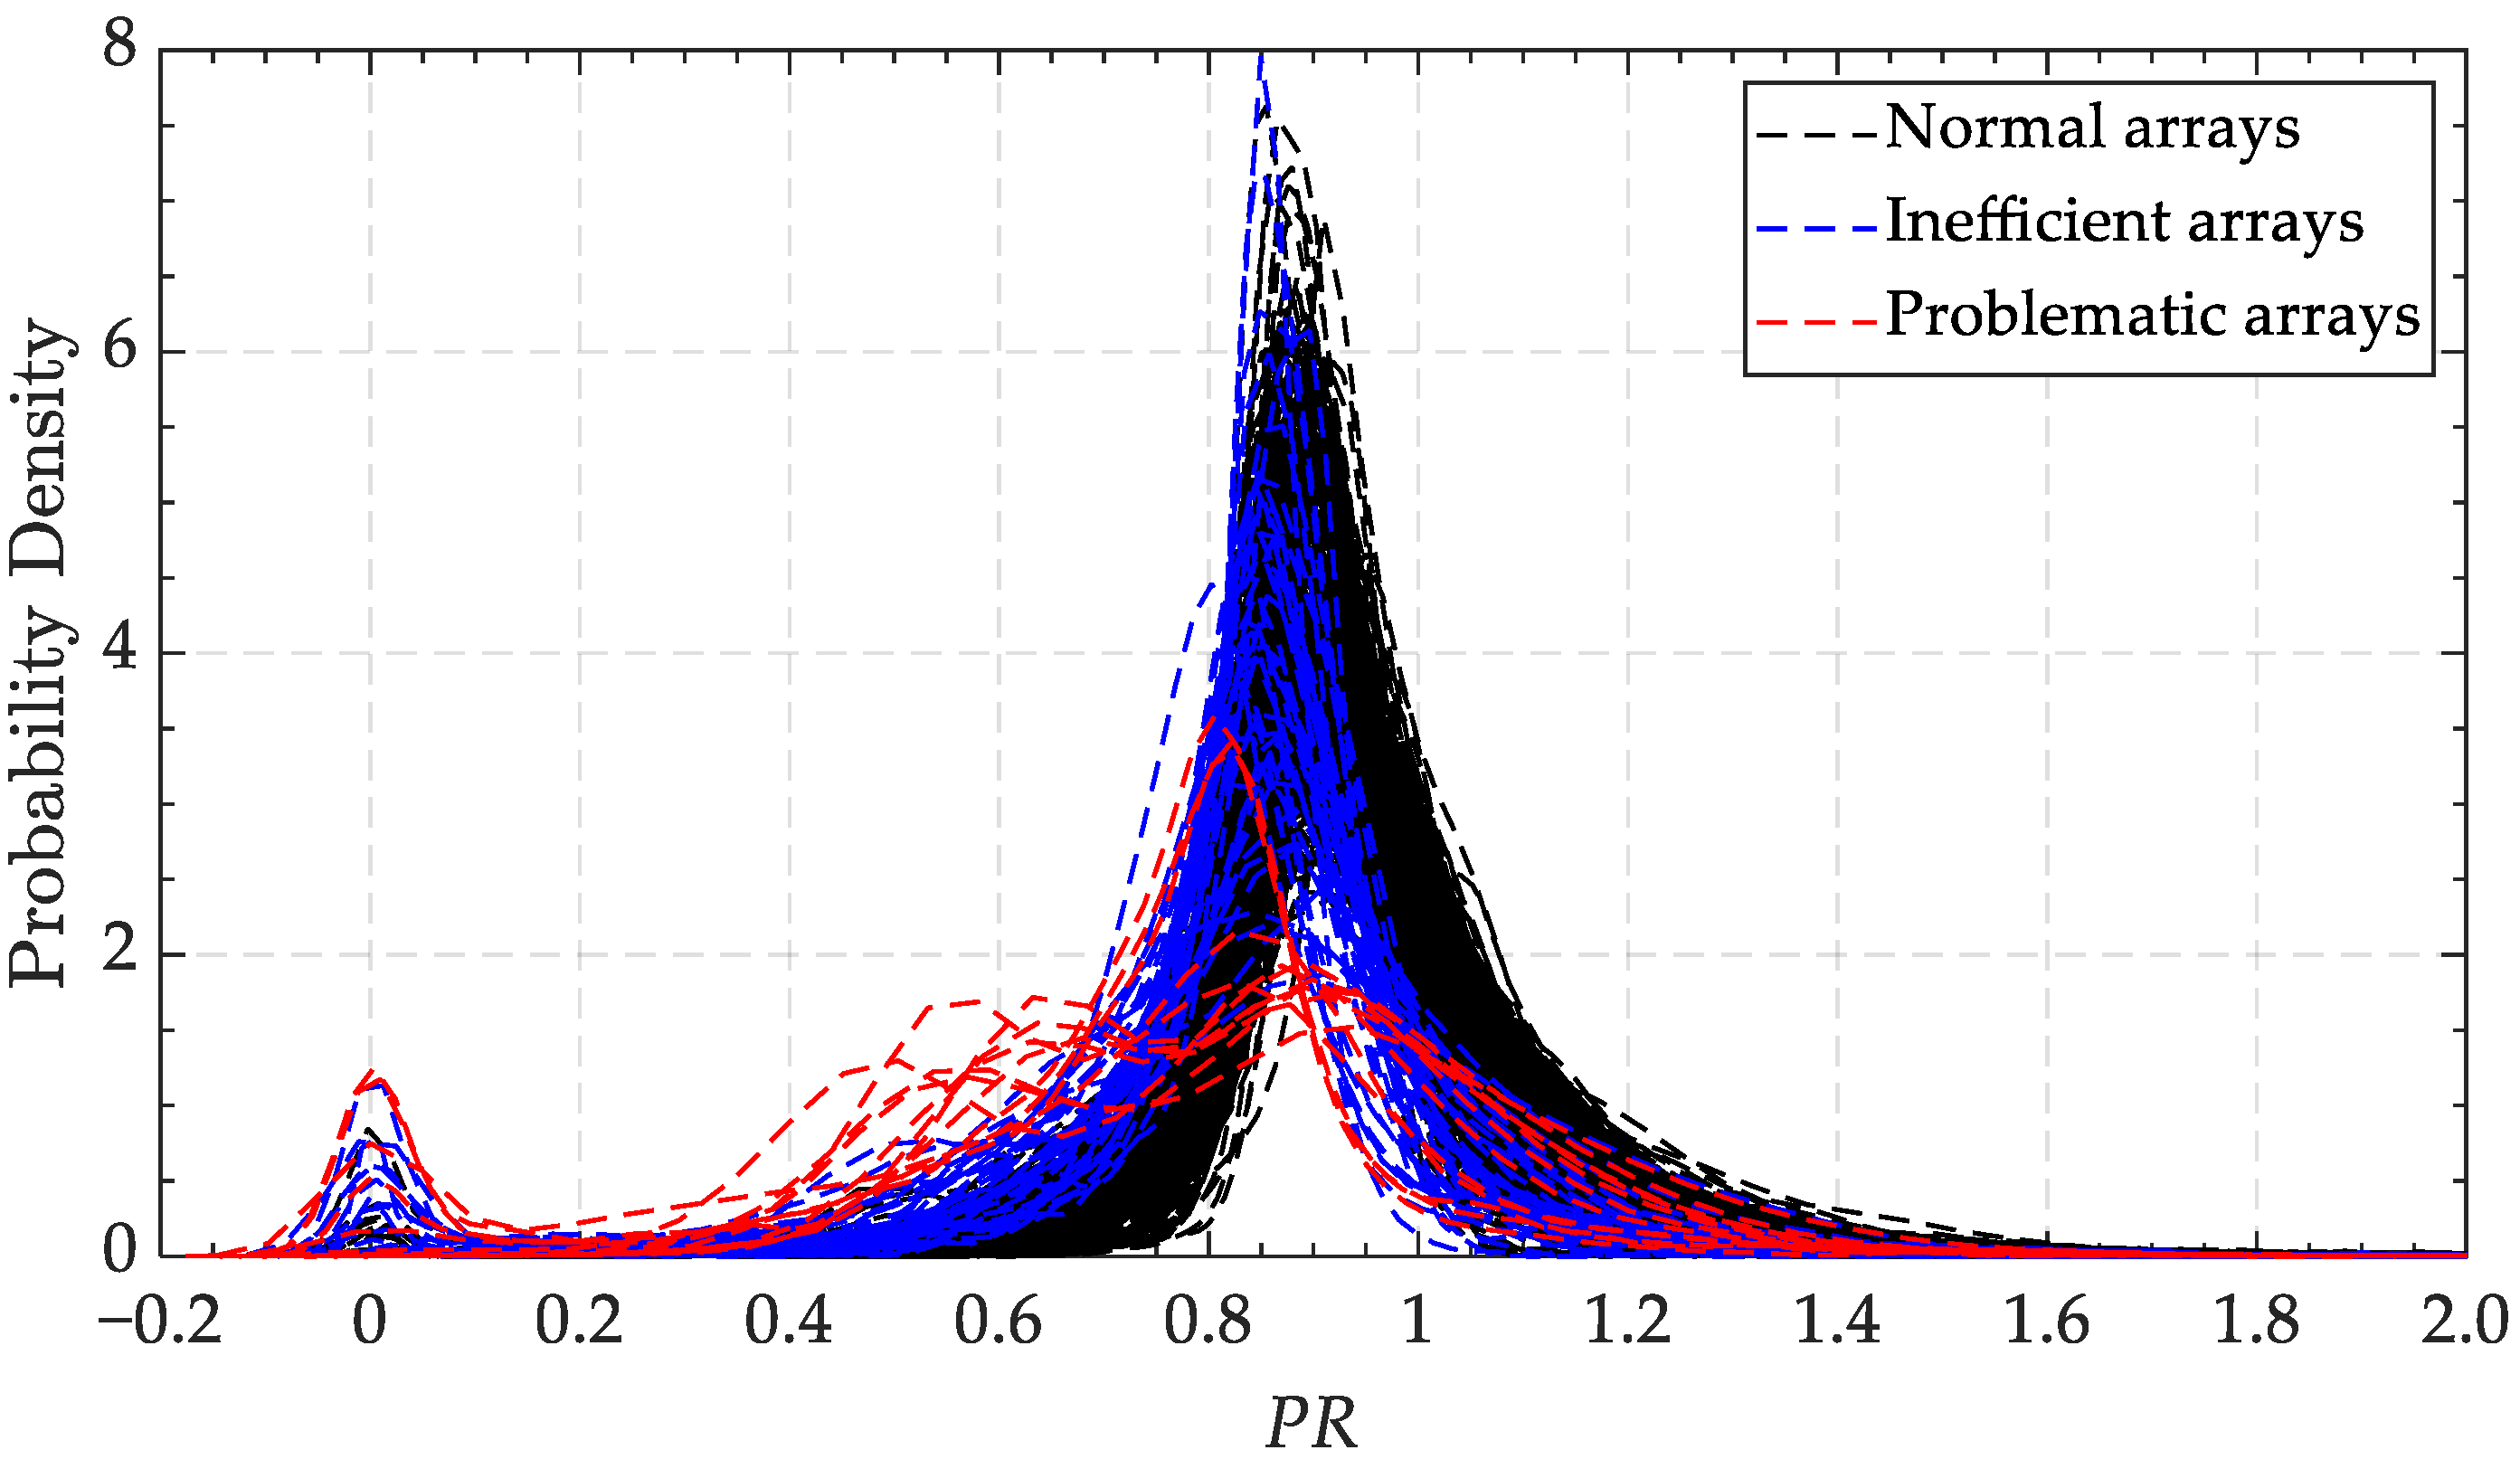
5.2. Analysis of PR Distribution Characteristics under Different Operating States
To analyze the PR distribution of arrays in different states, the kernel probability density curves of arrays (classified into excellent, normal, inefficient, and problematic ones) were analyzed respectively, with the results shown in Figure 11. As can be seen from it, the peak values of the array kernel density curves under different states varied greatly. To be specific, the PR concentration degree of excellent arrays was the highest, while the PR concentration degree of normal and inefficient arrays decreased successively, and the bimodal distribution increased; the problematic arrays presented obvious bimodal distribution. Table 3 shows the PR quartile sites and standard deviations in the arrays under different operating states. Q1, Q2, Q3 and Q3–Q1 represent the lower, median, upper quartile and standard deviation, respectively. To some extent, Q3–Q1 reflects the PR concentration degree of the arrays. The smaller the value is, the higher the concentration degree is. can reflect the fluctuation degree of the arrays. The smaller the value is, the smaller the fluctuation degree is. As can be seen from the table, for the arrays with the largest peak value, the PR had high concentration and high stability, followed by the normal arrays. As can be seen from the lower quartile Q1, the inefficient arrays had smaller values, and their PR had a poor concentration and stability; the problematic arrays were characterized by very small values of each quartile and larger fluctuations. According to the previous analysis in Section 3.2, the arrays with double peaks and small peaks had a poor performance, which verified the effectiveness of partitioning from the perspective of probability density curve distribution.
Figure 11.
Comparison of kernel probability density curves (a) Excellent array (b) Normal array (c) Inefficient array (d) Problematic array.
Table 3.
PR quartile sites and standard deviations of the arrays under different operating states.
To further demonstrate the effectiveness of the proposed method, the monthly cumulative power generation of all PV arrays was sorted, and the 3σ method was then used to divide the operating state. The probability density curves of the arrays at different grades are shown in Figure 12. The kernel density curves of the low power generation arrays show bimodal distributions, but the kernel density curves of the inefficient and normal arrays are similar; that is, the state cannot be reasonably divided by simply sorting the power generation. In addition, the proposed method is more effective than the traditional method.
Figure 12.
Comparison of kernel probability density curves in different power generation.
In summary, this section analyzes the PR distribution characteristics of different grades of arrays from three aspects: probability density curve distribution, quartile and standard deviation. The array with the largest peak is in an excellent operating state. The probability density curves of the inefficient array show bimodal distributions, the PR volatility is large, and the performance is unstable. Each quartile of the problem array is small, and the PR performance is the worst and the operating state is the worst. At the same time, it also compared with other algorithms to illustrate the effectiveness of the paper method.
6. Conclusions
In this paper, a PV array operating state evaluation method based on non-parametric KDE and the 3σ method is proposed. The distribution characteristics of the PV arrays are studied by calculating the arrays, and the uncertainty model of the PV array is established. The operating states of the PV arrays are divided based on the 3σ method. The main innovations include: using the non-parametric estimation method to solve the problem of difficult recognition of the operating state caused by the uncertainty of the PV output, and using 3σ to divide the array state based on the distribution characteristics of the data themselves, which overcomes the subjective bias of state classification. The conclusions of the paper are summarized as follows: the distribution characteristics of the PV arrays are explained; the array distribution characteristics of different operating states are different; the peak value can be used to characterize the performance status of PV arrays: the PR distribution of the PV array with poor performance is scattered, its stability is poor, and the peak value is small; the excellent array PR is stable, with large power generation and a large peak. The method of classifying the operating state according to the power generation sort, and the comparison of the electrical parameters and PR distribution characteristics of different arrays show the effectiveness of the method. Therefore, the peak index of the distribution curve of the PV array is constructed to evaluate the operating states of the PV arrays. Furthermore, a classification method based on non-parametric estimation modeling and the 3σ method is proposed.
The main contribution of this paper is to discover the distribution characteristics of the array PR that can characterize the operating state of the PV array, and based on this, a method for dividing the operating state of the PV array is proposed. The method in this paper solves the problem that existing evaluation methods of the PV array operating state are complicated and difficult to apply in practical engineering. Moreover, it can reflect the comprehensive operating state of PV arrays, and can be used in the intelligent operation and maintenance of PV power stations to classify the state of PV arrays. One limitation of the proposed method is that it focuses solely on the operating state of PV arrays, and does not consider fault type judgments. Another limitation is data loss, which can lead to algorithmic failures. The research team will address these limitations in future research.
Author Contributions
Conceptualization, investigation and resources, Q.T.; methodology, validation and writing—original draft preparation, D.L.; supervision, X.R.; project administration, H.W.; formal analysis, Q.W.; data curation, L.Z.; software, J.L.; funding acquisition and writing—review and editing, H.Z. All authors have read and agreed to the published version of the manuscript.
Funding
This research was funded by the Science and Technology Project of China Huaneng Group Co., Ltd., grant number HNKJ21-HF03.
Institutional Review Board Statement
Not applicable.
Informed Consent Statement
Not applicable.
Data Availability Statement
The data are not publicly available due to privacy.
Acknowledgments
The authors would like to acknowledge the financial support from the Science and Technology Project of China Huaneng Group Co., Ltd. (No:HNKJ21-HF03, Research on the data-driven-based intelligent evaluation and predictive operation and maintenance technology of a photovoltaic power station).
Conflicts of Interest
The authors declare no conflict of interest.
Nomenclature
PV, photovoltaic; PR, performance ratio of PV arrays; KDE, kernel density estimation; , actual power generation of PV arrays; , actual power generation of PV arrays; , probability density function; , kernel function; , Gaussian kernel function; , number of sampling time points; , standard deviation of the sample; , i = 1,2,3,…, 553, peak of No. i PV array; , mean value of all peaks; , residual between ith peak and the mean value of all peaks; , standard deviation estimate; , actual generated power of PV array; , installed capacity of the array; , normalized generated power; , current of PV array; , current of PV array; , normalized current of PV array.
References
- Dzikuć, M.; Piwowar, A.; Dzikuć, M. The importance and potential of photovoltaics in the context of low-carbon development in Poland. Energy Storage Sav. 2022, 1, 162–165. [Google Scholar] [CrossRef]
- Maka, A.O.M.; Salem, S.; Mehmood, M. Solar photovoltaic (PV) applications in Libya: Challenges, potential, opportunities and future perspectives. Clean. Eng. Technol. 2021, 5, 100267. [Google Scholar] [CrossRef]
- Pal, P.; Mukherjee, V.; Kumar, P.; Makhatha, M.E. Pre-feasibility analysis and performance assessment of solar photovoltaic (PV) modules for the application of renewable power generation. Mater. Today Proc. 2021, 39, 1813–1819. [Google Scholar] [CrossRef]
- Kabir, E.; Kumar, P.; Kumar, S.; Adelodun, A.A.; Kim, K.-H. Solar energy: Potential and future prospects. Renew. Sustain. Energy Rev. 2018, 82, 894–900. [Google Scholar] [CrossRef]
- Adhya, D.; Chatterjee, S.; Chakraborty, A.K. Performance assessment of selective machine learning techniques for improved PV array fault diagnosis. Sustain. Energy Grids Netw. 2022, 29, 100582. [Google Scholar] [CrossRef]
- Aljafari, B.; Devakirubakaran, S.; Bharatiraja, C.; Kumar, P.; Babu, T.S. Power enhanced solar PV array configuration based on calcudoku puzzle pattern for partial shaded PV system. Heliyon 2023, 9, e16041. [Google Scholar] [CrossRef]
- Sultan, S.M.; Tso, C.P.; Ervina Efzan, M.N. A new method for reducing the performance evaluation cost of the photovoltaic module cooling techniques using the photovoltaic efficiency difference factor. Case Stud. Therm. Eng. 2020, 21, 100682. [Google Scholar] [CrossRef]
- Kwon, O.; Lee, K. Suggestion of PV System Performance Assessment Method using Meteorological Monitoring System and Performance Evaluation Model. In Proceedings of the IEEE 46th Photovoltaic Specialists Conference (PVSC), Chicago, IL, USA, 16–21 June 2019; pp. 1264–1269. [Google Scholar]
- Roy, H.A.; Alremeithi, A.; Atyani, M.; Farina, M.; Alnuaimi, A. Field Performance Evaluation of the Largest Rooftop PV Project in the Middle East. In Proceedings of the 2021 IEEE 48th Photovoltaic Specialists Conference (PVSC), Fort Lauderdale, FL, USA, 20–25 June 2021; pp. 0468–0471. [Google Scholar]
- Bentouba, S.; Bourouis, M.; Zioui, N.; Pirashanthan, A.; Velauthapillai, D. Performance assessment of a 20 MW photovoltaic power plant in a hot climate using real data and simulation tools. Energy Rep. 2021, 7, 7297–7314. [Google Scholar] [CrossRef]
- Khan, N.S.; Shah, D.; Sohail, A.; Kumam, P.; Thounthong, P.; Muhammad, T. Mechanical aspects of Maxwell nanofluid in dynamic system with irreversible analysis. ZAMM—J. Appl. Math. Mech. 2021, 101, e202000212. [Google Scholar] [CrossRef]
- Khan, N.S.; Usman, A.H.; Sohail, A.; Hussanan, A.; Shah, Q.; Ullah, N.; Kumam, P.; Thounthong, P.; Humphries, U.W. A Framework for the Magnetic Dipole Effect on the Thixotropic Nanofluid Flow Past a Continuous Curved Stretched Surface. Crystals 2021, 11, 645. [Google Scholar] [CrossRef]
- Liu, Y.; Ding, K.; Zhang, J.; Lin, Y.; Yang, Z.; Chen, X.; Li, Y.; Chen, X. Intelligent fault diagnosis of photovoltaic array based on variable predictive models and I–V curves. Sol. Energy 2022, 237, 340–351. [Google Scholar] [CrossRef]
- Lu, X.; Lin, P.; Cheng, S.; Lin, Y.; Chen, Z.; Wu, L.; Zheng, Q. Fault diagnosis for photovoltaic array based on convolutional neural network and electrical time series graph. Energy Convers. Manag. 2019, 196, 950–965. [Google Scholar] [CrossRef]
- Li, B.; Delpha, C.; Migan-Dubois, A.; Diallo, D. Fault diagnosis of photovoltaic panels using full I–V characteristics and machine learning techniques. Energy Convers. Manag. 2021, 248, 114785. [Google Scholar] [CrossRef]
- Zhang, F.; Wu, M.; Hou, X.; Han, C.; Wang, X.; Liu, Z. The analysis of parameter uncertainty on performance and reliability of photovoltaic cells. J. Power Sources 2021, 507, 230265. [Google Scholar] [CrossRef]
- Zou, B.; Peng, J.; Yin, R.; Li, H.; Li, S.; Yan, J.; Yang, H. Capacity configuration of distributed photovoltaic and battery system for office buildings considering uncertainties. Appl. Energy 2022, 319, 119243. [Google Scholar] [CrossRef]
- Xu, T.; Ren, Y.; Guo, L.; Wang, X.; Liang, L.; Wu, Y. Multi-objective robust optimization of active distribution networks considering uncertainties of photovoltaic. Int. J. Electr. Power Energy Syst. 2021, 133, 107197. [Google Scholar] [CrossRef]
- Liu, Y.; Ding, K.; Zhang, J.; Li, Y.; Yang, Z.; Zheng, W.; Chen, X. Fault diagnosis approach for photovoltaic array based on the stacked auto-encoder and clustering with I-V curves. Energy Convers. Manag. 2021, 245, 114603. [Google Scholar] [CrossRef]
- Zhang, K.; Yu, X.; Liu, S.; Dong, X.; Li, D.; Zang, H.; Xu, R. Wind power interval prediction based on hybrid semi-cloud model and nonparametric kernel density estimation. Energy Rep. 2022, 8, 1068–1078. [Google Scholar] [CrossRef]
- Pan, C.; Tan, J.; Feng, D. Prediction intervals estimation of solar generation based on gated recurrent unit and kernel density estimation. Neurocomputing 2021, 453, 552–562. [Google Scholar] [CrossRef]
- Li, D.; Yu, X.; Liu, S.; Dong, X.; Zang, H.; Xu, R. Wind power prediction based on PSO-Kalman. Energy Rep. 2022, 8, 958–968. [Google Scholar] [CrossRef]
- Bai, M.; Chen, Y.; Zhao, X.; Liu, J.; Yu, D. Deep attention ConvLSTM-based adaptive fusion of clear-sky physical prior knowledge and multivariable historical information for probabilistic prediction of photovoltaic power. Expert Syst. Appl. 2022, 202, 117335. [Google Scholar] [CrossRef]
- Edelmann, D.; Móri, T.F.; Székely, G.J. On relationships between the Pearson and the distance correlation coefficients. Stat. Probab. Lett. 2021, 169, 108960. [Google Scholar] [CrossRef]
- He, H.; Pan, J.; Lu, N.; Chen, B.; Jiao, R. Short-term load probabilistic forecasting based on quantile regression convolutional neural network and Epanechnikov kernel density estimation. Energy Rep. 2020, 6, 1550–1556. [Google Scholar] [CrossRef]
- Pan, J.; He, W.; Shi, Y.; Zhu, H. Uncertainty analysis based on non-parametric statistical modeling method for photovoltaic array output and its application in fault diagnosis. Sol. Energy 2021, 225, 831–841. [Google Scholar] [CrossRef]
- Pan, J.; Zou, Z.; Sun, S.; Su, Y.; Zhu, H. Research on output distribution modeling of photovoltaic modules based on kernel density estimation method and its application in anomaly identification. Sol. Energy 2022, 235, 1–11. [Google Scholar] [CrossRef]
Disclaimer/Publisher’s Note: The statements, opinions and data contained in all publications are solely those of the individual author(s) and contributor(s) and not of MDPI and/or the editor(s). MDPI and/or the editor(s) disclaim responsibility for any injury to people or property resulting from any ideas, methods, instructions or products referred to in the content. |
© 2023 by the authors. Licensee MDPI, Basel, Switzerland. This article is an open access article distributed under the terms and conditions of the Creative Commons Attribution (CC BY) license (https://creativecommons.org/licenses/by/4.0/).