Abstract
Solid waste management is one of the most important environmental issues worldwide, particularly in MENA countries. The present study was carried out in the city of Algiers, the capital city of Algeria. This urban area is marked by an increase in waste flow combined with a demographic surge. In order to investigate waste production and its drivers, we used both multiple regression and correlation analyses to test this dependence. Geospatial analysis was performed using principal component analysis integrated with GIS in order to look at the spatial distribution of waste management and potential drivers of waste production. The results indicate that household waste management is influenced by drivers related to the size of the settlement and the characteristics of waste management companies (p ≤ 0.05). The findings also show that none of the sociodemographic variables were found to significantly influence waste production. However, the spatial distribution is influenced by the geographic and sociodemographic characteristics of Algeria at all territorial levels. Algiers is still a landfill-based city in the MENA region, where mixed waste collection prevails in all districts. This study reinforces the importance of expanding source-separated waste collection schemes in order to increase the household waste diversion from landfills and, more importantly, shows how modern tools such as GIS, principal component analysis, and spatial analysis urban planning are useful for monitoring household waste, in line with circular economy principles.
1. Introduction
The world is experiencing an environmental crisis, marked by excessive production of waste, in particular household waste fed by consumerism and the effects of urbanization [1,2,3]. The most optimistic prediction says that 70% of humans will live in cities by the year 2050 [4]. However, 0.9 billion people lack access to regular waste collection services in urban areas worldwide, particularly in low- and middle-income countries [5]. The expansion of sanitation and waste management infrastructures in urban areas is crucial to achieving sustainable development goals by 2030. Furthermore, the model of a smart city (SC) goes beyond an urban space where information and communication technologies (ICT) are applied [6]. In fact, the aim of a smart city is to improve the performance and the quality of urban services (energy, transportation, and other infrastructures), intending to reduce costs, resource energy consumption, and wastage. Smart city environments evolve to improve the quality of life of citizens and the operational efficiency of complex urban systems [7].
Solid waste management (SWM) is one of the major challenges faced by smart cities (and cities, in general), especially due to population growth and urbanization [8]. The world’s annual waste generation is actually 2.01 billion tons and 0.74 kg/person per day (33% of that is not managed in an environmentally safe manner) and is expected to increase to 3.40 billion tons in 2050 [9]. High-income countries generate about 34% of the world’s waste, while the total quantity generated in low-income countries is expected to increase more than three times by 2050. The Middle East and North Africa region produces 6% of the world’s waste. In addition, given the fastest growth of cities in the MENA regions, it is expected that by 2050, total waste generation is expected to increase twice (or thrice) [10]. Consequently, there is an urgent need for more efficient solid waste management in cities. SWM is also a major concern for national (and municipal) governments in order to preserve natural resources and the environment and protect human health. The emerging smart technologies already used in waste management, such as robot recyclers, internet of things (IoT), self-driving trucks, and waste level sensors, can further optimize the collection and treatment operations in the largest cities around the globe [11].
Generally, waste characterization and generation are among the most important factors to consider when selecting the most appropriate collection and treatment methods and also the final disposal [12]. This is especially the case in countries in the process of urbanization experiencing increasing population and lifestyle changes under the impact of massive migration from rural to urban zones, which leads to a considerable increase in urban waste generation.
Solid waste and household waste prediction can be conducted at different temporal (e.g., week, month, or year) or geographic (e.g., municipal, regional, national) levels. Country-level studies use previously collected data on the total annual waste amount, waste types, or socioeconomic data, which they often make available to international associations [13]. The applicability of such projections is highly dependent on model assumptions and the quality of data acquired [14]. Solid waste clustering enables discovering differences and similarities among analyzed regions or countries with respect to waste management. Moreover, they also allow for determining the relationships between clusters and demographic, socioeconomic, and waste generation characteristics. However, these inherent structures are difficult to observe in the original datasets because of the multidimensional nature of data [15].
Countries of MENA regions are still reliant on landfills as the main disposal route for household waste, but efforts are made to estimate source-separation collection schemes and recycling practices [16].
Algeria is the largest nation in Africa and the Arab world by area [17]. Its population of 44 million has a heterogeneous density (high population in the north and low in the arid regions), resulting in a high difference in waste generation between urbanized cities and the other regions. The waste management sector in Algeria is insufficiently regulated [18]. Daily and annual waste production can be estimated from the average rate of waste produced per person per day. In fact, an Algerian produces an average of 0.81 kg of household waste per day. This production continues to increase, exceeding 8.5 million tons in 2021 [16]. Algeria is marked by a significant increase in waste flows combined with a demographic surge and a saturation of urban waste management infrastructures [19]. In this context, several uncontrolled dumps have appeared on the Algerian territory, generating direct negative impacts on the environment through the creation of pollution, posing major risks to human health [20]. Hence, the Algerian government is constantly looking to adopt technological solutions in an attempt to treat household waste. These different solutions must protect people and communities, minimize negative impacts on the environment, and allow for efficient and less expensive treatment of waste [21,22].
Studies investigating urbanization, sustainable development, and, more specifically, waste management in North Africa (especially in Algeria, and even more precisely in Algiers) are scarce, incomplete, or even lacking [23,24]. The few existing studies are old and provide very few insights [25,26]. In the current context, studies addressing these themes could be of considerable importance [27].
Although several tools have been implemented for the planning and development of Algiers, the capital city of Algeria, none have been successful. This clearly reflects the failure of urban planning in the capital, which highlights the different management problems encountered by the city [28].
The aim of this study is to investigate and identify the elements and generating factors of the excessive production of household waste at the wilaya of Algiers, through a statistical and geospatial approach, as well as the management practices and their approaches to adopt a better strategy for the optimization of waste management. We hypothesize, according to our knowledge of the study area, that the increase in household waste is linked not only to population growth, but also to other factors such as education, standard of living, urban structure, recycling infrastructure, collection system, and economic and social development. This study will attempt to verify the aforementioned hypothesis, filling in a gap in the existing literature concerning the management of household waste in the study area.
2. Materials and Methods
2.1. Case Study Area
The present study was carried out in the city of Algiers, which is the political, administrative, and economic capital of the country. It is the seat of all central, political, and social institutions, major economic and financial establishments, major decision-making centers, and diplomatic representations.
The “wilaya” (administrative division) of Algiers is located in the north at the following coordinates: 36°46′34″ N, 3°03′36″ E. It occupies a geostrategic position. It spans more than 808.89 km2 and is limited by the Mediterranean Sea to the north, the wilayas of Blida in the south, Tipaza in the west, and Boumerdès in the east.
According to the 2008 RGPH, the population of Algiers is about 2,987,160 inhabitants. In 2021, the population was estimated at 3.4 million inhabitants [29]. The population density amounts to ~4450 inhabitants/km2. The wilaya of Algiers is made up of thirteen daïras (administrative districts), each comprising several “communes” (municipalities), for a total of fifty-seven communes.
The study area consists of the 57 communes composing the wilaya of Algier (see Figure 1).
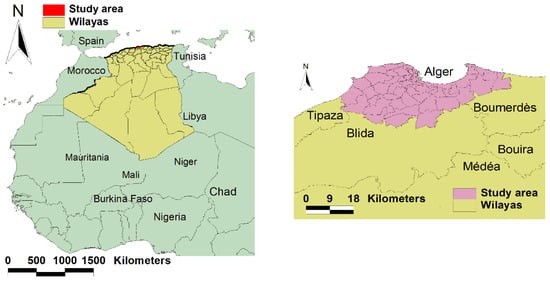
Figure 1.
Location of the case study. The images present the location in an international context (left) and in detail (right).
2.2. Data
The data used in this research come from many sources, including the two companies responsible for waste management in Algiers. Data were collected from the technical department of their general management. The two companies are EPIC EXTRANET, situated in Bab Ezzouar-Algiers, and responsible for 31 communes, and EPIC NETCOM, situated in Mohamed Nail-Algiers, and responsible for 26 communes.
Figure 2 displays the companies responsible for waste management in each commune within the area analyzed in the study.
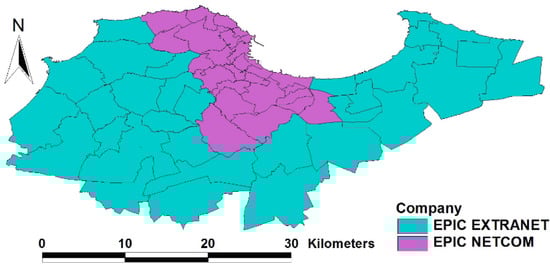
Figure 2.
Spatial distribution of companies responsible for waste management across the study area.
Other data were acquired from the National Office of Statistics (ONS) situated in Ruisseau, Algiers, and the National Waste Agency (AND) situated in Hamma, Algiers.
2.3. Variables
Some of the variables used in this work are similar to those used in studies addressing municipal waste management issues in other countries [30,31,32]. However, some variables, such as the role of the environmental awareness group (EAG), availability of facilities and infrastructure (FI), and budget availability (BA), used in other studies, were excluded either because they were only present in one company, or were obsolete. Consequently, the selected variables were:
- Area (A): total area of the municipality.
- Population (P): total number of inhabitants in the municipality.
- Share of people with at least a college degree (C): number of individuals with medium or higher education.
- Share of active population (AP): part of the population engaged in work or studies.
- Number of garbage bins (G): Total number of garbage bins owned by the concerned company.
- Collection routes (R): predefined waste collection points.
- Number of staff in waste management companies (S): human resources available at the company.
- Company managing waste collection (CO): Extranet or Netcom.
Data provided by waste operators and the aforementioned variables were further processed using spatial analysis and GIS techniques. The scale of analysis, i.e., district level, reveals the local variations in household waste generation within urban administrative borders. The microlevel spatial analysis of such variables has benefits for decision makers, such as adapting urban waste management policies and infrastructure demands. Big data and machine learning could further predict waste generation flow at the microlevel, including building-level data [33]. Reliable historical waste-related data lead to better future predictions of household waste at the district or urban levels, improving the planning of waste management infrastructure by adopting feasible circular economy targets [34,35]. On the other hand, the pro-environmental behavior of residents could be used as an additional variable to examine waste generation patterns at the city level [36].
2.4. Quantitative Analyses
The quantitative analyses were based on statistical approaches used to look at the variables influencing the production of waste, especially the total amount of waste. Geostatistical analyses were also used in order to look at the spatial distribution of the production of waste and its potential drivers. For this purpose, multiple regression analyses were used to look at the possible drivers influencing the total amount of waste, using two models: a full model, looking at the simultaneous influence of all drivers, and a restricted model, obtained from the previous one using backward elimination, containing all drivers with a simultaneous statistically significant influence on the total amount of waste.
The variables included in these models were derived from the data obtained from the statistical office or based on the row data. The new variables were the average production of waste and the number of collection routes, obtained by averaging in each case the values for the eight months included in the row data. Education level was synthesized in only one index that presents the share of those with at least a college degree among all people. Another driver, the employment structure, was presented by the activity rate in the studied area.
The geospatial methods were based on a modified version, “principal component analysis integrated with GIS”, a method developed for the identification of “hotspots” that are at the core of intervention policies [37]. This method has been also used in other studies due to its ability to compare the empirical dimension of the factors with the three dimensions [38]. Essentially, the method consists of (1) running a principal component analysis to identify the key variables that can be used to underline the spatial differentiation between different administrative units through differences between their values across the analyzed space, (2) creating an index using the percentage of variation explained by each variable as its weight, and (3) mapping the distribution of the index. The difference from previous applications of the method was that instead of looking at the initial eigenvalues and using a threshold value of 1.00 for the total variance explained, resulting in identifying only two principal components, we considered the extraction sums of squared loadings and used a threshold of 5% for the percentage of variance, identifying four principal components.
3. Results
In order to investigate waste production and its drivers, we used two types of analyses, i.e., multiple regression and correlation analyses to test the dependence, and principal component analysis integrated with GIS to look at the spatial distribution.
3.1. Results of Multiple Regression and Correlation Analyses
Multiple regression analysis used two models, a full model and a prediction model, obtained from the full model through backward elimination. Both models were significant overall (p < 0.0001). The overall coefficient of correlation, showing the percentage of variation explained by the model, was 0.892 for the full model and 0.888 for the prediction model. The influence of analyzed drivers is presented in Table 1.

Table 1.
Results of multiple regression analysis looking at the dependence of waste production (amount) on socioeconomic and territorial drivers: A—area, P—population, C—share of people with at least a college degree, AP—share of active population, G—number of garbage bins, R—collection routes, S—no. of staff in waste management companies, and CO—company managing waste collection. The table presents two models, a “full model”, including all drivers, and a “prediction model”, including only those significantly influencing waste production when considered simultaneously. Bold values indicate variables significant at p ≤ 0.05.
The results of correlation analysis are presented in Table 2. The table displays all possible correlations between variables describing waste management and potential drivers, analyzing those significant (p ≤ 0.05) and those marginally significant (p ≤ 0.1). For the latest, it is expected that more data would turn them into significant correlations.
Table 2.
Correlation between the variables describing waste management and potential drivers: W—amount of waste, A—area, P—population, C—share of people with at least a college degree, AP—share of active population, G—number of garbage bins, R—collection routes, and S—no. of staff in waste management companies. For each correlation, the table displays the coefficient of determination r and its corresponding p-value below. Bold values indicate correlations significant at p ≤ 0.05, and italic values correlations significant at p ≤ 0.1.
3.2. Results of Geospatial Analyses
The results of geospatial analysis are based on a principal component analysis, used to look at the territorial variables describing waste management and potential drivers of waste production. The results of the analysis are displayed in Table 3 and Table 4. Table 3 shows the principal components and the percentage of variation explained by each; out of these, we considered the extraction sums of squared loadings and used a threshold of 5% for the percentage of variance to identify the principal components with a significant influence on the territorial distribution. Table 4 serves for identifying them with the variable most correlated to each one, as indicated by the highest value of the coefficient of determination.
Table 3.
Results of the principal component analysis showing the principal components explaining the territorial differences of communes with respect to waste management and potential drivers.
Table 4.
Results of the principal component analysis identifying the four principal components explaining over 5% of the variance (column “Extraction Sums of Squared Loadings” in Table 3) with the corresponding variables. The correspondence is indicated by the highest value of the coefficient of determination in each column (1–4), underlined using a Bold font.
The results presented in Table 3 indicate that the first four components, accounting altogether for over 90% of the total variation (in terms of the extraction sums of squared loadings), and identified in Table 4 with the amount of waste, share of people with at least a college degree, number of garbage bins, and area of the commune, can be used to analyze the territorial differences across the study area. This was achieved by mapping the spatial distribution of each variable (see Figure 3, Figure 4, Figure 5 and Figure 6) and building an aggregated index weighting each variable based on the percentage of total variance explained (column “Extraction Sums of Squared Loadings” in Table 3) and mapping its spatial distribution (see Figure 7).
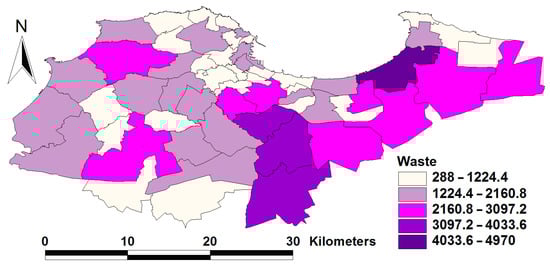
Figure 3.
Spatial distribution of the production of waste across the study area. The distribution is based on creating five equal intervals based on the amount of waste generated in each unit (in metric tons).
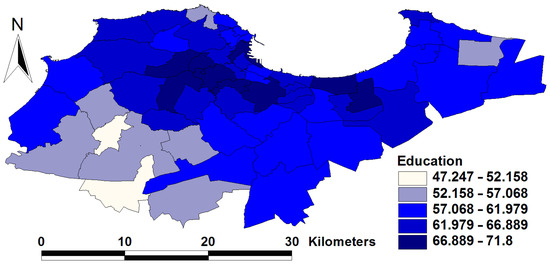
Figure 4.
Spatial distribution of the share of people with at least a college degree across the study area. The distribution is based on creating five equal intervals based on the share of people with at least a college degree from the total population.
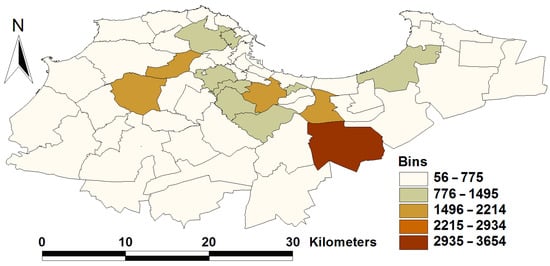
Figure 5.
Spatial distribution of the number of garbage bins across the study area. The distribution is based on creating five equal intervals.
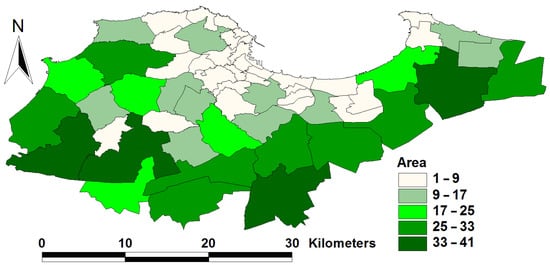
Figure 6.
Spatial distribution of the total commune area across the study area. The distribution is based on creating five equal intervals for the total area of communes, in km2.
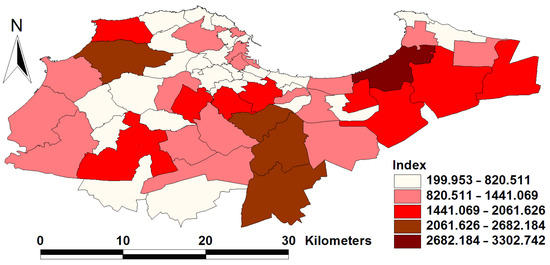
Figure 7.
Spatial distribution of the aggregated index across the study area. The distribution is based on creating five equal intervals for aggregated index, built using the four principal components explaining over 90% of the total variation (in terms of the extraction sums of squared loadings—Table 3) weighted by the percentage of variation explained (Table 3).
4. Discussion
The results of multiple regression analysis indicate that waste management is influenced by drivers related to the size of the settlement, specifically area (p = 0.0006) and population (p = 0.0028). Waste management is also influenced by the characteristics of WM companies, represented by the number of collection routes (p < 0.0001) and number of employees (p = 0.0026). None of the sociodemographic variables such as the level of education (people with at least college level, active population) or employment rate were found to significantly influence the production of waste. Similar to other studies, population and size of urban area are found to be key drivers in the waste generation rates [30,34].
The spatial distributions are influenced by the geographic and sociodemographic characteristics of Algeria, and the influence is seen at all territorial levels: wilayas within the country, communes within the wilayas. The size of communes increases from north to south (see Figure 5), because in Algeria, the north corresponds to the Mediterranean shore, which offers, due to its climate, better living conditions and is more populated. The south corresponds to the desert areas and is less populated. As a result, the size balances the communes in terms of population (see Figure 3), i.e., communes are larger in less populous areas. The same geographical settings affect the spatial distribution of education; the north concentrates large cities with strong universities, while the southern areas offer fewer educational opportunities.
This paper reveals the importance of urban district-level variation in terms of waste production, waste bin coverage, and sociodemographic features, as in other studies [31]. At the microlevel, house size, districts, and employment category were found key drivers in waste generation for the Accra region of Ghana [32] and family size in Robe town, Ethiopia [39].
Therefore, other factors could be further examined in future research such as household/family size. The employment category seems not to play a significant role in explaining waste production in Algiers city. Furthermore, spatial analysis using GIS tools provides better monitoring alternatives of waste indicators to improve the collection efficiency. This is important to prevent illegal disposal activities in emerging cities [40].
Compared to other African countries, Algeria is better covered by basic public utilities in both urban and rural regions [5,41]. The population of Algiers city and wilaya is connected to waste collection services, but a traditional waste management system based on mixed waste collection and landfill of waste prevails in the capital city. The household waste collected by two main waste operators (NETCOM and EXTRANET) is disposed of in two different conventional landfill sites (CET HAMICI and CET of Corso). However, the issue of uncontrolled household waste disposal practices is not solved, contributing to environmental pollution [42]. The illegal dumping of household waste remains a significant environmental threat in African cities [39].
The urban waste generation rate is estimated to be at 0.8 kg.inhab.day-1 compared to 0.6 kg.inhab.day-1 in rural areas at the country level, while the recycling rate is around 7%, composting 1%, and the rest of municipal waste flow is disposed of in sanitary landfills or dumpsites [43]. The waste generation rate varies among regions of Algeria with significant disparities between north and south regions, but the highest waste generation rate is around 0.95 kg.inhab.day-1 in Algiers [20]. Across estimation of household waste generated by Algiers city is around 500,000 tons per semester, approximately 1 million tons per year [44]. Therefore, this study provides a better picture of household waste flows using spatial analysis at the district level. Such spatial analyses at this scale are needed by decision makers aiming to improve the current waste management practices. However, experimental analyses based on field data regarding urban waste generation rates on a per capita basis and municipal waste composition in different districts of Algiers city and wilaya are required to provide a comprehensive baseline of household waste characterization for the study area and model future predictions of waste flows. The frequency of waste collection schemes is a daily regime and in some periods of the year the regime is twice a day (e.g., summer season for coastal communes and the two days of the “Aid el Adha” celebration). During the month of “Ramadan”, the waste collection regime becomes nightly. These religious events could significantly increase the urban waste generation rates, putting additional pressure on waste collection schemes [45]. This issue could also be investigated in Algiers city, in comparison with other urban centers of the country.
There are no source-separation collection schemes, but some recyclable waste is recovered from residual waste at the sorting station located near the CET landfill site. Additionally, the informal sector collects some dry recyclable waste (plastics and metals) for recycling purposes. The informal sector plays a critical role in African cities in recovering recyclable waste from dumpsites associated with the underdevelopment of municipal waste management infrastructure [46]. Most private economic agents involved in waste recovery and recycling operations are found in Algiers and Boumerdes according to the National Waste Agency [47]. Metals and scraps of iron are often recovered at the source, and these fractions are less prone to landfilling compared to the organic waste fraction [21].
NETCOM introduced seven separate collection sites for paper/cardboard, glass, organic waste, and bread [48]. Besides waste collection operations, the transportation of household waste seems to have a high ecological footprint, and landfills are not equipped with biogas installations in Algiers [42]. The rate of recycling household waste is unknown, and computation of waste statistics at the city level should be compulsory. At the country level, the latest estimation of the recycling rate was around 9.83% in 2020 [47]. There are no composting facilities in Algiers despite the fact that most residual bins contain organic waste (54.4%), followed by plastics (16.5%) and paper/cardboard (13.4%) [48]. This is in line with the last household waste characterization from April 2018 to March 2019, where the organic fraction represented 63%, followed by plastics (15.2%) [49]. However, this characterization did not include Algiers. Therefore, such studies need to be further developed in the capital city and related wilayas. Preliminary findings suggest that composting facilities fed by source separation of organic waste should be a future investment priority besides material recycling facilities combined with separate collection schemes extended to all districts in the study area. Composting practices are limited across MENA countries despite the high share of organic waste in household waste flows [15].
The recovery of recyclable waste is very low because sorting stations receive mixed household waste instead of clean source-separated recyclable wastes (paper/cardboard, glass, plastic, and metals/aluminum cans). Without proper waste management infrastructure separating clean organic wastes from dry recyclable waste, the target of recycling and composting more than 50% of household and similar waste by 2035, set by the Waste Management Strategy in Algeria [50], will be an impossible target to fulfill based on the current situation in Algeria. In fact, the African Circular Economy Alliance argues the key role of organic waste and plastic packaging diversion from landfills having as members Cote d’Ivoire, Ghana, Nigeria, Rwanda, and South Africa [51]. A similar alliance could be initiated in the MENA region, where Algeria could be part of it or adhere to the existing ACEA to stimulate transition towards a sustainable waste management system by 2035 through international cooperation, exchanging of know-how, and adopting best practices in the region.
5. Conclusions
This study reveals that GIS and spatial statistics at the district level are useful tools for the assessment and monitoring of household waste flow in large urban areas such as North African capital cities. However, this approach depends on the availability and quality of waste statistics provided by waste operators. The results of multiple regression analysis indicate that waste management is influenced by drivers related to the size of the settlement, i.e., area (p = 0.0006) and population (p = 0.0028), and characteristics of the waste management companies, i.e., number of collection routes (p < 0.0001), and number of employees (p = 0.0026). Sociodemographic variables such as the level of education and the employment rate were found to have no significant influence on the production of waste. Algiers is still a landfill-based city in the MENA region, where mixed waste collection prevails in all districts. The expansion of source-separated waste collection schemes is compulsory at least for organic waste and dry recyclables (plastic, metal, paper cardboard, and glass) that must be further treated in composting and sorting facilities to increase the household waste diversion from landfills in line with circular economy principles.
From a methodological perspective, our study proved that a combination of multiple regression analysis and principal component analysis is efficient to describe and understand waste production; the first method is useful in detecting the relevant drivers of waste production and the second in contextualizing them spatially. However, the reliability of our methodology depends at large on the availability of waste statistics provided by waste operators, which can constitute an important challenge in North Africa. Future studies can use more relevant variables to start with, if data are available. In this regard, data on more socioeconomic variables could enhance the results of future studies.
Author Contributions
Conceptualization, A.-I.P., H.A.A. and C.F.; methodology, A.-I.P.; software, M.A. (Mostefa Ababsa); validation, A.-I.P., A.B.-B. and M.H.; formal analysis, A.-I.P.; investigation, F.K.K.; resources, A.B.-B. and H.A.A.; data curation, M.A. (Mostefa Ababsa), F.-C.M. and C.F.; writing—original draft preparation, A.-I.P., F.-C.M. and H.A.A.; writing—review and editing, F.K.K., A.-I.P., F.-C.M., M.H., M.A. (Marc Azab) and H.A.A.; visualization, A.-I.P. supervision, A.B.-B., A.-I.P., F.-C.M. and C.F.; project administration, A.B.-B.; funding acquisition, M.H., M.A. (Marc Azab) and H.A.A. All authors have read and agreed to the published version of the manuscript.
Funding
This study was supported by the DGRSDT and the MESRS.
Institutional Review Board Statement
Not applicable.
Informed Consent Statement
Not applicable.
Data Availability Statement
The data presented in this study are collected within a research project and can be made available on request from the corresponding author.
Acknowledgments
Many thanks are addressed to the technical services of both EXTRANET and NETCOM societies for sharing their database. Many thanks are also addressed to the general directions of the Algerian National Office of Statistics (ONS) and the Algerian National Waste Agency (AND) for providing the data used in this study. Considerable appreciation is addressed to the DGRSDT (Directorate-General of Scientific Research and Technological Development of Algeria) and the MESRS (Ministry of Higher Education and Scientific Research of Algeria) for their valuable support.
Conflicts of Interest
The authors declare no conflict of interest.
References
- Yoada, R.M.; Chirawurah, D.; Adongo, P.B. Domestic Waste Disposal Practice and Perceptions of Private Sector Waste Management in Urban Accra. BMC Public Health 2014, 14, 697. [Google Scholar] [CrossRef] [PubMed]
- Ferronato, N.; Torretta, V. Waste Mismanagement in Developing Countries: A Review of Global Issues. Int. J. Environ. Res. Public Health 2019, 16, 1060. [Google Scholar] [CrossRef] [PubMed]
- Valceanu, D.-G.; Suditu, B.; Petrisor, A.-I. Romanian Technological Risk Objectives (SEVESO). Effects on Land Use and Territorial Planning. Carpathian J. Earth Environ. Sci. 2015, 10, 203–209. [Google Scholar]
- Ritchie, H.; Roser, M. Urbanization. Our World in Data 2018. Available online: https://ourworldindata.org/urbanization (accessed on 4 February 2022).
- Mihai, F.-C. One Global Map but Different Worlds: Worldwide Survey of Human Access to Basic Utilities. Hum. Ecol. 2017, 45, 425–429. [Google Scholar] [CrossRef]
- Yeh, H. The Effects of Successful ICT-Based Smart City Services: From Citizens’ Perspectives. Gov. Inf. Q. 2017, 34, 556–565. [Google Scholar] [CrossRef]
- Voordijk, H.; Dorrestijn, S. Smart City Technologies and Figures of Technical Mediation. Urban Res. Pract. 2021, 14, 1–26. [Google Scholar] [CrossRef]
- Gutberlet, J. Waste in the City: Challenges and Opportunities for Urban Agglomerations. In Urban Agglomeration; InTech: London, UK, 2018. [Google Scholar]
- Wowrzeczka, B. City of Waste—Importance of Scale. Sustainability 2021, 13, 3909. [Google Scholar] [CrossRef]
- Kaza, S.; Lisa, Y.; Bhada-Tata, P.; Van Woerden, F. What a Waste 2.0: A Global Snapshot of Solid Waste Management to 2050; World Bank: Washington, DC, USA, 2018; Available online: https://openknowledge.worldbank.org/handle/10986/30317 (accessed on 5 February 2022).
- Kumar, S.; Smith, S.R.; Fowler, G.; Velis, C.; Kumar, S.J.; Arya, S.; Rena; Kumar, R.; Cheeseman, C. Challenges and Opportunities Associated with Waste Management in India. R. Soc. Open Sci. 2017, 4, 160764. [Google Scholar] [CrossRef]
- Phuong, N.; Yabar, H.; Mizunoya, T. Characterization and Analysis of Household Solid Waste Composition to Identify the Optimal Waste Management Method: A Case Study in Hanoi City, Vietnam. Earth 2021, 2, 1046–1058. [Google Scholar] [CrossRef]
- Dunkel, J.; Dominguez, D.; Borzdynski, Ó.G.; Sánchez, Á. Solid Waste Analysis Using Open-Access Socio-Economic Data. Sustainability 2022, 14, 1233. [Google Scholar] [CrossRef]
- Cubillos, M.; Wulff, J.N.; Wøhlk, S. A Multilevel Bayesian Framework for Predicting Municipal Waste Generation Rates. Waste Manag. 2021, 127, 90–100. [Google Scholar] [CrossRef] [PubMed]
- National Research Council. Prudent Practices in the Laboratory: Handling and Management of Chemical Hazards, Updated Version; National Academies Press: Washington, DC, USA, 2011; p. 360. [Google Scholar]
- Hemidat, S.; Achouri, O.; Fels, L.E.; Elagroudy, S.; Hafidi, M.; Chaouki, B.; Ahmed, M.; Hodgkinson, I.; Guo, J. Solid Waste Management in the Context of a Circular Economy in the MENA Region. Sustainability 2022, 14, 480. [Google Scholar] [CrossRef]
- Worldmeter 2015. Available online: https://www.worldometers.info/population/largest-cities-in-the-world/ (accessed on 2 February 2022).
- Stambouli, A.B. Algerian Renewable Energy Assessment: The Challenge of Sustainability. Energy Policy 2011, 39, 4507–4519. [Google Scholar] [CrossRef]
- Mohamed, K.; Amina, M.-S.; Mouaz, M.B.E.; Zihad, B.; Wafa, R. The Impact of the Coronavirus Pandemic on the Household Waste Flow during the Containment Period. Environ. Anal. Health Toxicol. 2021, 36, e2021011. [Google Scholar] [CrossRef]
- Abdelkader, O.; Ahmadouche, B. The Problem of Municipal Solid Waste Management in Algeria. J. New Econ. 2021, 12, 118–131. [Google Scholar]
- Okkacha, Y.; Abderrahmane, Y.; Hassiba, B. Municipal Waste Management in the Algerian High Plateaus. Energy Procedia 2014, 50, 662–669. [Google Scholar] [CrossRef]
- Kouloughli, S.; Kanfoud, S. Municipal Solid Waste Management in Constantine, Algeria. J. Geosci. Environ. Prot. 2017, 05, 85–93. [Google Scholar] [CrossRef]
- Guerzou, M.; Aouissi, H.A.; Guerzou, A.; Burlakovs, J.; Doumandji, S.; Krauklis, A.E. From the Beehives: Identification and Comparison of Physicochemical Properties of Algerian Honey. Resources 2021, 10, 94. [Google Scholar] [CrossRef]
- Aouissi, H.A.; Petrişor, A.-I.; Ababsa, M.; Boştenaru-Dan, M.; Tourki, M.; Bouslama, Z. Influence of Land Use on Avian Diversity in North African Urban Environments. Land 2021, 10, 434. [Google Scholar] [CrossRef]
- Bouanini, S. Assessing the Management of Municipal Solid Waste for Well-Being Fulfillment in Algeria; University of Eloued: El Oued, Algeria, 2012. [Google Scholar]
- Youcef, K.; SWEEP-Net; Lazhari, G. Country Report on the Solid Waste Management in Algeria, The Regional Solid Waste Exchange of Information and Expertise Network in Mashreq and Maghreb Countries SWEEP-Net. 2010. Available online: https://www.scirp.org/(S(351jmbntvnsjt1aadkposzje))/reference/ReferencesPapers.aspx?ReferenceID=1642804 (accessed on 7 January 2022).
- Louafi, O. The Phenomenon of Mobility, a Development Challenge for the City of Algiers. J. Contemp. Urban Aff. 2019, 3, 144–155. [Google Scholar] [CrossRef][Green Version]
- Baouni, T. Le Transport Dans Les Stratégies de La Planification Urbaine de l’agglomération d’Alger. Insaniyat Rev. Algérienne D’anthropologie et de Sci. Soc. 2009, 44–45, 75–95. [Google Scholar] [CrossRef]
- World Population Review. Available online: https://worldpopulationreview.com/countries/algeria-population (accessed on 15 February 2022).
- Pathak, D.R.; Mainali, B.; Abuel-Naga, H.; Angove, M.; Kong, I. Quantification and characterization of the municipal solid waste for sustainable waste management in newly formed municipalities of Nepal. Waste Manag. Res. 2020, 38, 1007–1018. [Google Scholar] [CrossRef] [PubMed]
- Aryampa, S.; Maheshwari, B.; Sabiiti, E.; Bateganya, N.L.; Bukenya, B. Status of Waste Management in the East Afri-can Cities: Understanding the Drivers of Waste Generation, Collection and Disposal and Their Impacts on Kampala City’s Sustainability. Sustainability 2019, 11, 5523. [Google Scholar] [CrossRef]
- Chapman-Wardy, C.; Asiedu, L.; Doku-Amponsah, K.; Mettle, F.O. Modeling the Amount of Waste Generated by Households in the Greater Accra Region Using Artificial Neural Networks. J. Environ. Public Health 2021, 2021, 8622105. [Google Scholar] [CrossRef]
- Kontokosta, C.E.; Hong, B.; Johnson, N.E.; Starobin, D. Using machine learning and small area estimation to predict building-level municipal solid waste generation in cities. Comput. Environ. Urban Syst. 2018, 70, 151–162. Available online: https://www.sciencedirect.com/science/article/pii/S0198971517305859 (accessed on 2 February 2022). [CrossRef]
- Smejkalová, V.; Šomplák, R.; Nevrlý, V.; Burcin, B.; Kučera, T. Trend forecasting for waste generation with structural break. J. Clean. Prod. 2020, 266, 121814. [Google Scholar] [CrossRef]
- Meza, J.K.S.; Yepes, D.O.; Rodrigo-Ilarri, J.; Cassiraga, E. Predictive analysis of urban waste generation for the city of Bogotá, Colombia, through the implementation of decision trees-based machine learning, support vector machines and artificial neural networks. Heliyon 2019, 5, e02810. [Google Scholar] [CrossRef]
- Sukholthaman, P.; Chanvarasuth, P.; Sharp, A. Analysis of waste generation variables and people’s attitudes towards waste management system: A case of Bangkok, Thailand. J. Mater. Cycles Waste Manag. 2017, 19, 645–656. [Google Scholar] [CrossRef]
- Petrişor, A.-I.; Ianoş, I.; Iurea, D.; Văidianu, M.-N. Applications of Principal Component Analysis Integrated with GIS. Procedia Environ. Sci. 2012, 14, 247–256. [Google Scholar] [CrossRef]
- Stoica, I.-V.; Tulla, A.F.; Zamfir, D.; Petrișor, A.-I. Exploring the Urban Strength of Small Towns in Romania. Soc. Indic. Res. 2020, 152, 843–875. [Google Scholar] [CrossRef]
- Erasu, D.; Feye, T.; Kiros, A.; Balew, A. Municipal solid waste generation and disposal in Robe town, Ethio-pia. J. Air Waste Manag. Assoc. 2018, 68, 1391–1397. Available online: https://www.tandfonline.com/doi/full/10.1080/10962247.2018.1467351 (accessed on 15 February 2022). [CrossRef] [PubMed]
- Nadeem, K.; Shahzad, S.; Hassan, A.; Usman Younus, M.; Asad Ali Gillani, S.; Farhan, K. Municipal solid waste generation and its compositional assessment for efficient and sustainable infrastructure planning in an inter-mediate city of Pakistan. Environ. Technol. 2022; (just-accepted). [Google Scholar] [CrossRef] [PubMed]
- Leveau, C.M.; Aouissi, H.A.; Kebaili, F.K. Spatial diffusion of COVID-19 in Algeria during the third wave. GeoJournal 2022, 1–6. [Google Scholar] [CrossRef] [PubMed]
- Akrour, S.; Moore, J.; Grimes, S. Assessment of the Ecological Footprint Associated with Consumer Goods and Waste Management Activities of South Mediterranean Cities: Case of Algiers and Tipaza. Environ. Sustain. Indic. 2021, 12, 100154. [Google Scholar] [CrossRef]
- SweepNet. Report on the Solid Waste Management in ALGERIA. 2014. Available online: https://www.retech-germany.net/fileadmin/retech/05_mediathek/laenderinformationen/Algerien_RA_ANG_WEB_0_Laenderprofile_sweep_net.pdf (accessed on 9 February 2022).
- Algerian Press Service 2019. Alger: Plus de 500,000 t de Déchets Ménagers Collectés Durant Le 1er Semestre 2019. Available online: https://www.aps.dz/regions/91733-alger-plus-de-500-000-t-de-dechets-menagers-collectes-durant-le-1er-semestre-2019 (accessed on 25 February 2022).
- Abdulredha, M.; Abdulridha, A.; Shubbar, A.A.; Alkhaddar, R.; Kot, P.; Jordan, D. Estimating municipal solid waste generation from service processions during the Ashura religious event. In IOP Conference Series: Materials Science and Engineering; IOP Publishing: Bristol, UK, 2020; Volume 671, p. 012075. Available online: https://iopscience.iop.org/article/10.1088/1757-899X/671/1/012075/ (accessed on 9 February 2022).
- Ernstson, H.; Lawhon, M.; Makina, A.; Millington, N.; Stokes, K.; Swyngedouw, E. Turning Livelihood to Rubbish? The Politics of Value and Valuation in South Africa’s Urban Waste Sector. In African Cities and Collaborative Futures; Manchester University Press: Manchester, UK, 2021; p. 96. [Google Scholar]
- National Waste Agency. Algeria Waste Management Status in Algeria; Deutsche Gesellschaft für Internationale Zusammenarbeit (GIZ) GmbH: Frankfurt, Germany, 2020. [Google Scholar]
- Le Tri Sélectif. Available online: https://netcom.dz/tri.html (accessed on 9 February 2022).
- National Waste Agency. Algeria Caractérisation Des Déchets Ménagers et Assimilés. 2018. Available online: https://and.dz/caracterisation-dechets-menagers-assimiles-algerie-printemps-2018/ (accessed on 9 February 2022).
- Ghennam, N. Waste Recycling Business in Algeria—Opportunities and Challenges for SME. Al-Riyada Bus. Econ. J. 2020, 6, 10–22. [Google Scholar]
- ACEA. Five Big Bets for the Circular Economy in Africa. 2021. Available online: https://www.weforum.org/reports/five-big-bets-for-the-circular-economy-in-africa-african-circular-economy-alliance (accessed on 9 February 2022).
Publisher’s Note: MDPI stays neutral with regard to jurisdictional claims in published maps and institutional affiliations. |
© 2022 by the authors. Licensee MDPI, Basel, Switzerland. This article is an open access article distributed under the terms and conditions of the Creative Commons Attribution (CC BY) license (https://creativecommons.org/licenses/by/4.0/).