1. Introduction
The quality of mathematical education received by students may depend on the effectiveness of their teachers. Student achievement in mathematics often depends on the experience of teachers and their professional development as well as on their empowerment with knowledge and skills. As such, much emphasis has been placed on improving teaching quality in order to increase students’ academic achievement [
1]. The standards for school mathematics designed and implemented by the Ministry of Education (MoE) in the United Arab Emirates have begun to meet the local context and comply with international practices [
2]. The standards for mathematics have been established to identify recent trends in their construction in order to achieve the best global practices while maintaining national values, heritage, and identity [
3]. There are other different curriculum standards in the UAE in addition to the standards set by the MoE, such as the British, Indian, Australian, IB, French, German, and Philippine curricula. However, most schools in the UAE schools adopt one of three types of curricula: the US Common Core, MoE, or British curriculum. These curricular approaches seem to have similar content and goals in equipping students with the knowledge and skills to succeed in colleges and in the knowledge economy. In fact, the metrics at both the national and global levels point to a high-performance learning system and identify ways to improve these systems [
4].
In order to identify high-performing education systems, international assessments, particularly Trends in International Mathematics Study (TIMSS), have been used to provide potential guidance for decision-making [
5]. The United Arab Emirates participated in the TIMSS for the first time in 2007, joining 67 other countries. The TIMSS study was conducted under the auspices of the International Association for the Assessment of Educational Achievement (IEA) in order to provide a global comparative assessment; it was designed to contribute to the process of improving teaching and learning in mathematics for students through evidence-based results. In addition, the TIMSS aims to inform educational policy and highlight similarities and differences among countries to allow participating countries to share experiences regarding the quantity and quality of student learning [
6]. In this context, the UAE seeks economic development such as exists in developed countries, a transition to a knowledge-based economy, and a citizenry well-educated in mathematics such as will be necessary for the economic well-being of the nation [
7]. Beyond the classroom, understanding basic mathematical concepts can facilitate a productive personal life that includes healthy habits and the use of effective problem-solving skills [
8]. By learning about the impact that the study of mathematics might have on the development of both individuals and the state, the UAE regards focusing on achievement and skills as national priorities for mathematics literacy, and has included TIMSS on the national agenda of the United Arab Emirates [
9].
TIMSS was first administered in 1995 by the IEA and has continued to be administered every four years. In 2015, the UAE participated in TIMSS for the third time. Both private and public schools participated in 2007, 2011, and 2015 TIMSS cycles. The Emirate of Abu Dhabi began participating as a benchmark in 2011. TIMSS is helpful in assessing curriculum models together with teaching and the school environment, all of which may affect student performance. The curriculum is concerned with the precise knowledge, skills that students learn and achieve, and what they think about learning these materials [
6]. Teachers may play a significant role in the student performance in TIMSS. However, the way mathematics teachers think of and about the TIMSS framework of conceptualizing teaching practices has not been investigated. How mathematics teachers perceive TIMSS may influence the classroom activities thy engage in to align their teaching-learning with the focal areas of mathematics in the TIMSS. Currently, there is limited evidence of studies on mathematics teachers’ perception of TIMSS-related practices either in general or in the context of the UAE in particular. In this context, this study aimed to investigate mathematics teachers’ perceptions of TIMSS-related teaching and learning practices. In particular, this study intends to find answers to questions about the perceptions of mathematics teachers regarding TIMSS-related practices and compare those perceptions using the demographic variables of gender, school type, teaching experience, and educational qualifications.
1.1. Problem Statement
To understand why Grade 8 students in Abu Dhabi performed below the average, the current study aimed to examine mathematics teachers’ perceptions of TIMSS and related practices in Abu Dhabi emirate schools.
Teachers’ perceptions are essential because the way in which teachers perceive their world influences their instructional practice [
10]. Perceptions about mathematics as well as about mathematics teaching and learning might define both how teachers interact with students in the classroom and how they perceive and develop students’ skills [
11]. Furthermore, the way teachers approach the content, the methodological choices they make, and the assessment practices they use may be affected by the choices they make in the course of their instruction [
12]. In other words, the assumption is that “teachers’ perceptions influence how they interact with students in the classroom, thus affecting the quality of their instruction and, in turn, students’ learning outcomes” [
13].
The teacher plays a crucial role in the educational process. The teacher is the one who sees and can clearly identify the strengths and weaknesses of each student in mathematics. For example, teacher perceptions can influence the way students answer questions related to mathematics, how students respond when presented with a variety of problem-solving strategies, how students react to challenging tasks, especially for more capable students, and how the teacher adapts their teaching methods to engage students’ interest and meet their needs, all of which can help students appreciate the value of learning mathematics. Therefore, we decided to study mathematics teachers’ perceptions towards TIMSS and related practices in Abu Dhabi schools.
1.2. Purpose of the Study and Research Questions
The purpose and overall goal of this study was to examine mathematics teachers’ perceptions of trends in international mathematics and science study (TIMSS)-related practices in Abu Dhabi emirate schools. The following research questions were formulated in light of the research objectives:
What are mathematics teachers’ perceptions of TIMSS in Abu Dhabi Emirate schools?
Is there a statistically significant difference between male and female mathematics teachers with respect to their perceptions of TIMSS in Abu Dhabi Emirate schools?
Is there a statistically significant difference between public and private school mathematics teachers’ perceptions of TIMSS in Abu Dhabi Emirate schools?
Is there a statistically significant difference between mathematics teachers’ perceptions of TIMSS with respect to their years of experience?
Is there a statistically significant difference between mathematics teachers’ perceptions of TIMSS with respect to differences in their qualifications?
1.3. Significance of the Study
Math teacher perception results in Abu Dhabi could help policymakers better integrate test content into the curriculum, conduct practice test sessions prior to test administration dates, and modify the curriculum to incorporate content included in international student assessments. Sample questions could be added to the curriculum to familiarize students with the types of questions asked in TIMSS. The present study’s findings may provide insights and identify areas for training teachers before international tests and provide them with released items in order to achieve better education results.
School improvement consistently shows the valuable role of international tests and benchmarking in driving education reform. Such results enable educational authorities to modify and consider curriculum content changes and to adapt cognitive skill domain outcomes. In addition, there is a need to systematically evaluate the performance of Abu Dhabi students in TIMSS assessment over several years, as we have begun to carry out in this study, which will help educational officials to invest in human and education resources and improve accountability. Education policymakers in the UAE need to evaluate the national mathematics curriculum across all grades by bringing it into alignment with international standards requirements. This can regarded as a step towards developing a new competence-based curriculum. It is envisaged that the clear presentation of these results will serve as motivation to improve education in the UAE. Furthermore, it is envisioned that the Abu Dhabi education authorities and leaders will continue to assess student performance, systematically analyze and discuss results and related activities, and design and test remedial interventions. Finally, we hope that this study’s findings will help suggest solutions and proposals to improve Abu Dhabi students’ performance in mathematics.
2. Review of Related Work
As the country moves towards becoming an international economic leader, the country’s vision is to ensure that its citizens receive a quality education that will enable them to effectively participate in the global economy [
14]. Recently, the Abu Dhabi Education Council (ADEC) has been changed to the Department of Education and Knowledge (ADEK), which handles all educational decisions in the Emirate of Abu Dhabi by managing, guiding, adopting, and implementing the relevant initiatives and strategies related to education. The council operates in 231 public, 205 private, and 13 charter schools in the Abu Dhabi Emirate, which have a workforce including both nationals and expatriates [
15]. However, while private schools offer international curricula, public schools use a centralized system and follow the Abu Dhabi School Model that was introduced in 2010. Even though the schools teach Arabic and English, TIMSS subjects are mainly taught in English. The teachers in the schools are expected to provide effective instruction and follow-up services to all children as they learn new concepts in mathematics and science. The teachers are expected to support the individual learning needs of their students as they progress through the grades and use various skills in their classwork [
14]. Consequently, there are specialist teachers for the mathematics and science subjects. These teachers enable students to explore mathematics concepts in their early years allowing them to gradually apply these concepts and gain mastery of the subjects [
16].
The United Arab Emirates (UAE) first participated in TIMSS in 2011, enabling ADEK to gain valuable information about the strengths and weaknesses inherent in the country’s curriculum. In addition, the assessments provided useful information in reviewing ADEK’s assessment program, the External Measurement of Student Achievement (EMSA). By comparing the results of the TIMSS and EMSA in the first year of assessment, ADEK was able to gauge the strengths and weaknesses of EMSA. Subsequently, the differences in results have enabled ADEK to modify EMSA using TIMSS as a benchmark. TIMSS is expected to continue to have a significant impact on educational policies in Abu Dhabi. The students who participated in TIMSS in 2015 were the first to be taught under the Abu Dhabi School Model, and a comparison of their results with those of 2011 demonstrated that the educational reforms undertaken by ADEK were useful in enabling students to perform better in TIMSS. According to [
17], UAE students have improved in mathematics and science, although they continue to perform below the expected international TIMSS levels. In 2015, approximately 18,000 eighth-graders from across public and private schools in the UAE participated in TIMSS assessments. Grade 8 students in cycle two in the UAE schools performed very well in mathematics and science compared to their GCC neighboring countries [
18]. They scored 465 and 477 in mathematics and science, respectively, which is an improvement from previous years [
19]. This shows that the country has achieved intermediate scores in its TIMSS performance.
The UAE’s Vision 2021 placed a significant focus on the high performance of students in TIMSS assessments, as students in both the 4th and 8th grades were expected to place among the top fifteen countries in the world [
9]. The assessment tests have enabled the UAE government to generate comparisons that it can use to measure student skills in these two areas as well as a means of identifying the indicators of enhanced student performance. Consequently, the government has put in place strategies to develop individual goals for every school that participates in future cycles of TIMSS.
According to Anderson [
20], there are major differences in the way teachers are trained between the UAE and other Gulf Cooperation Council countries. However, these differences do not affect how the different genders have performed in TIMSS. International evidence demonstrates that girls perform better than boys in the humanities and literacy [
21]. Nevertheless, Cimpian et al. [
22] state that gender differences and gaps have been reduced in science and mathematics, and in certain instances males perform better than females when they enter secondary school. The increasing improvement in performance by females in Abu Dhabi and in the other GCC countries might be a result of enhanced government efforts to create policy reforms that support girls’ success in the classroom [
18]. In 2007, Dubai participated in TIMSS as a benchmarking community; the assessment results showed that girls in the region performed slightly better than boys on the 8th-grade TIMSS assessment, by an average of 12 points [
23]. Studies carried out in many nations show that girls perform better than boys on standardized tests in primary and secondary school, and that they have better educational experiences than their male counterparts [
24]. They found that while boys are more likely to drop out of school, they tend to remain in school for longer periods or at the same level in countries where there are vocational and technical secondary opportunities. Consequently, even though there is gender parity in the schools of the Abu Dhabi Emirates and other emirates [
25], the global improvement in science and mathematics as measured by TIMSS assessment has not yet been realized because of the culture of the region. This means that boys ultimately have better employment and income opportunities than girls in the long term, regardless of their performance on TIMSS assessments [
24].
Among these issues of boys’ and girls’ educational quality and performance, mathematics teachers remain at the core of practice. When teachers are proficient in their subject matter, there is a stronger possibility of high student performance. This is because such teachers are able to effectively teach their grade 8 students the necessary mathematics concepts and theories required for success on TIMSS assessment. A high level of subject matter knowledge, clear instruction, and ability to teach a high-quality curriculum enable teachers to impart more knowledge to their students [
26]. A study on schools in Abu Dhabi shows that many teachers lack the requisite skills to effectively teach their curricula. Chu et al. [
26] stress that teacher quality is significant in enhancing student achievement. Less than 3% of teachers in the country possess a Master’s degree, which would enable them to provide a high-quality learning experience to their students; 90% have a bachelor’s degree, while 8% have no degree. Teachers lacking a degree fall below the minimum requirements needed to provide a high-quality curriculum to students. In addition, only 13% of teachers are proficient in English, and a mere 29% have a modest knowledge of the language, which is critical in enabling them to teach their 8th-grade mathematics students and lead them to success on their assessments [
26].
Hanushek [
27] thus states that students improve by as much as three times when they are taught by high-quality teachers. Several studies have additionally attempted to identify the actual teacher credentials that demonstrate effective teacher quality and its effect on student achievement [
28,
29]. Teachers are required to invest more time and effort into making their subjects more interesting to students; consequently, Bietenbeck [
30] states that active teaching strategies are likely to produce a positive learning effect on students. In addition, while the manner in which the teacher addresses the subject topics may not be directly related to student performance, it is related to overall academic performance. Teachers must therefore properly focus on engaging students and sharing resources and ideas with other teachers in order to ensure students’ success. On the other hand, the impact of teachers on student performance has been investigated in relation to variables such as gender, teaching experience, type of schools (public vs. private), and qualifications. For example, Kartal [
31] suggested that gender might have an influence on student achievement. Burroughs et al. [
32] further suggested that various initiatives should be undertaken to include female teacher perceptions and how their perceptions might influence student performance in TIMSS.
Furthermore, other researchers have considered variables related to the schools themselves. For example, Cordero [
33] pointed out that efforts put into supporting 8th-grade students in public and private schools should be promoted in order to ensure better performance. Bdeir [
34] further supported this by pointing out that more effective measures should be put in place to support students’ performance in public schools, particularly in mathematics. Students, whether in public or private schools, need to be provided with the essentials in order to achieve their potential [
35]. Other studies, such as Alarabi and Wardat [
36] and Abdelfattah and Lam [
37] have shown that a teacher’s experience is likely to come into play in determining an 8th-grade student’s performance. This is particularly important in those experienced teachers are more likely to use different and effective teaching strategies to teach mathematics to students. Contrary to Burroughs et al. [
32] and Abdelfattah and Lam [
37], Alharbi et al. [
38] found that students’ readiness for mathematics exams is not necessarily affected by their teacher’s experience. Others have argued that teaching experience is likely to allow teachers to understand their students better [
39] which can aid in the selection of teaching strategies that are congruent with student learning strategies [
40].
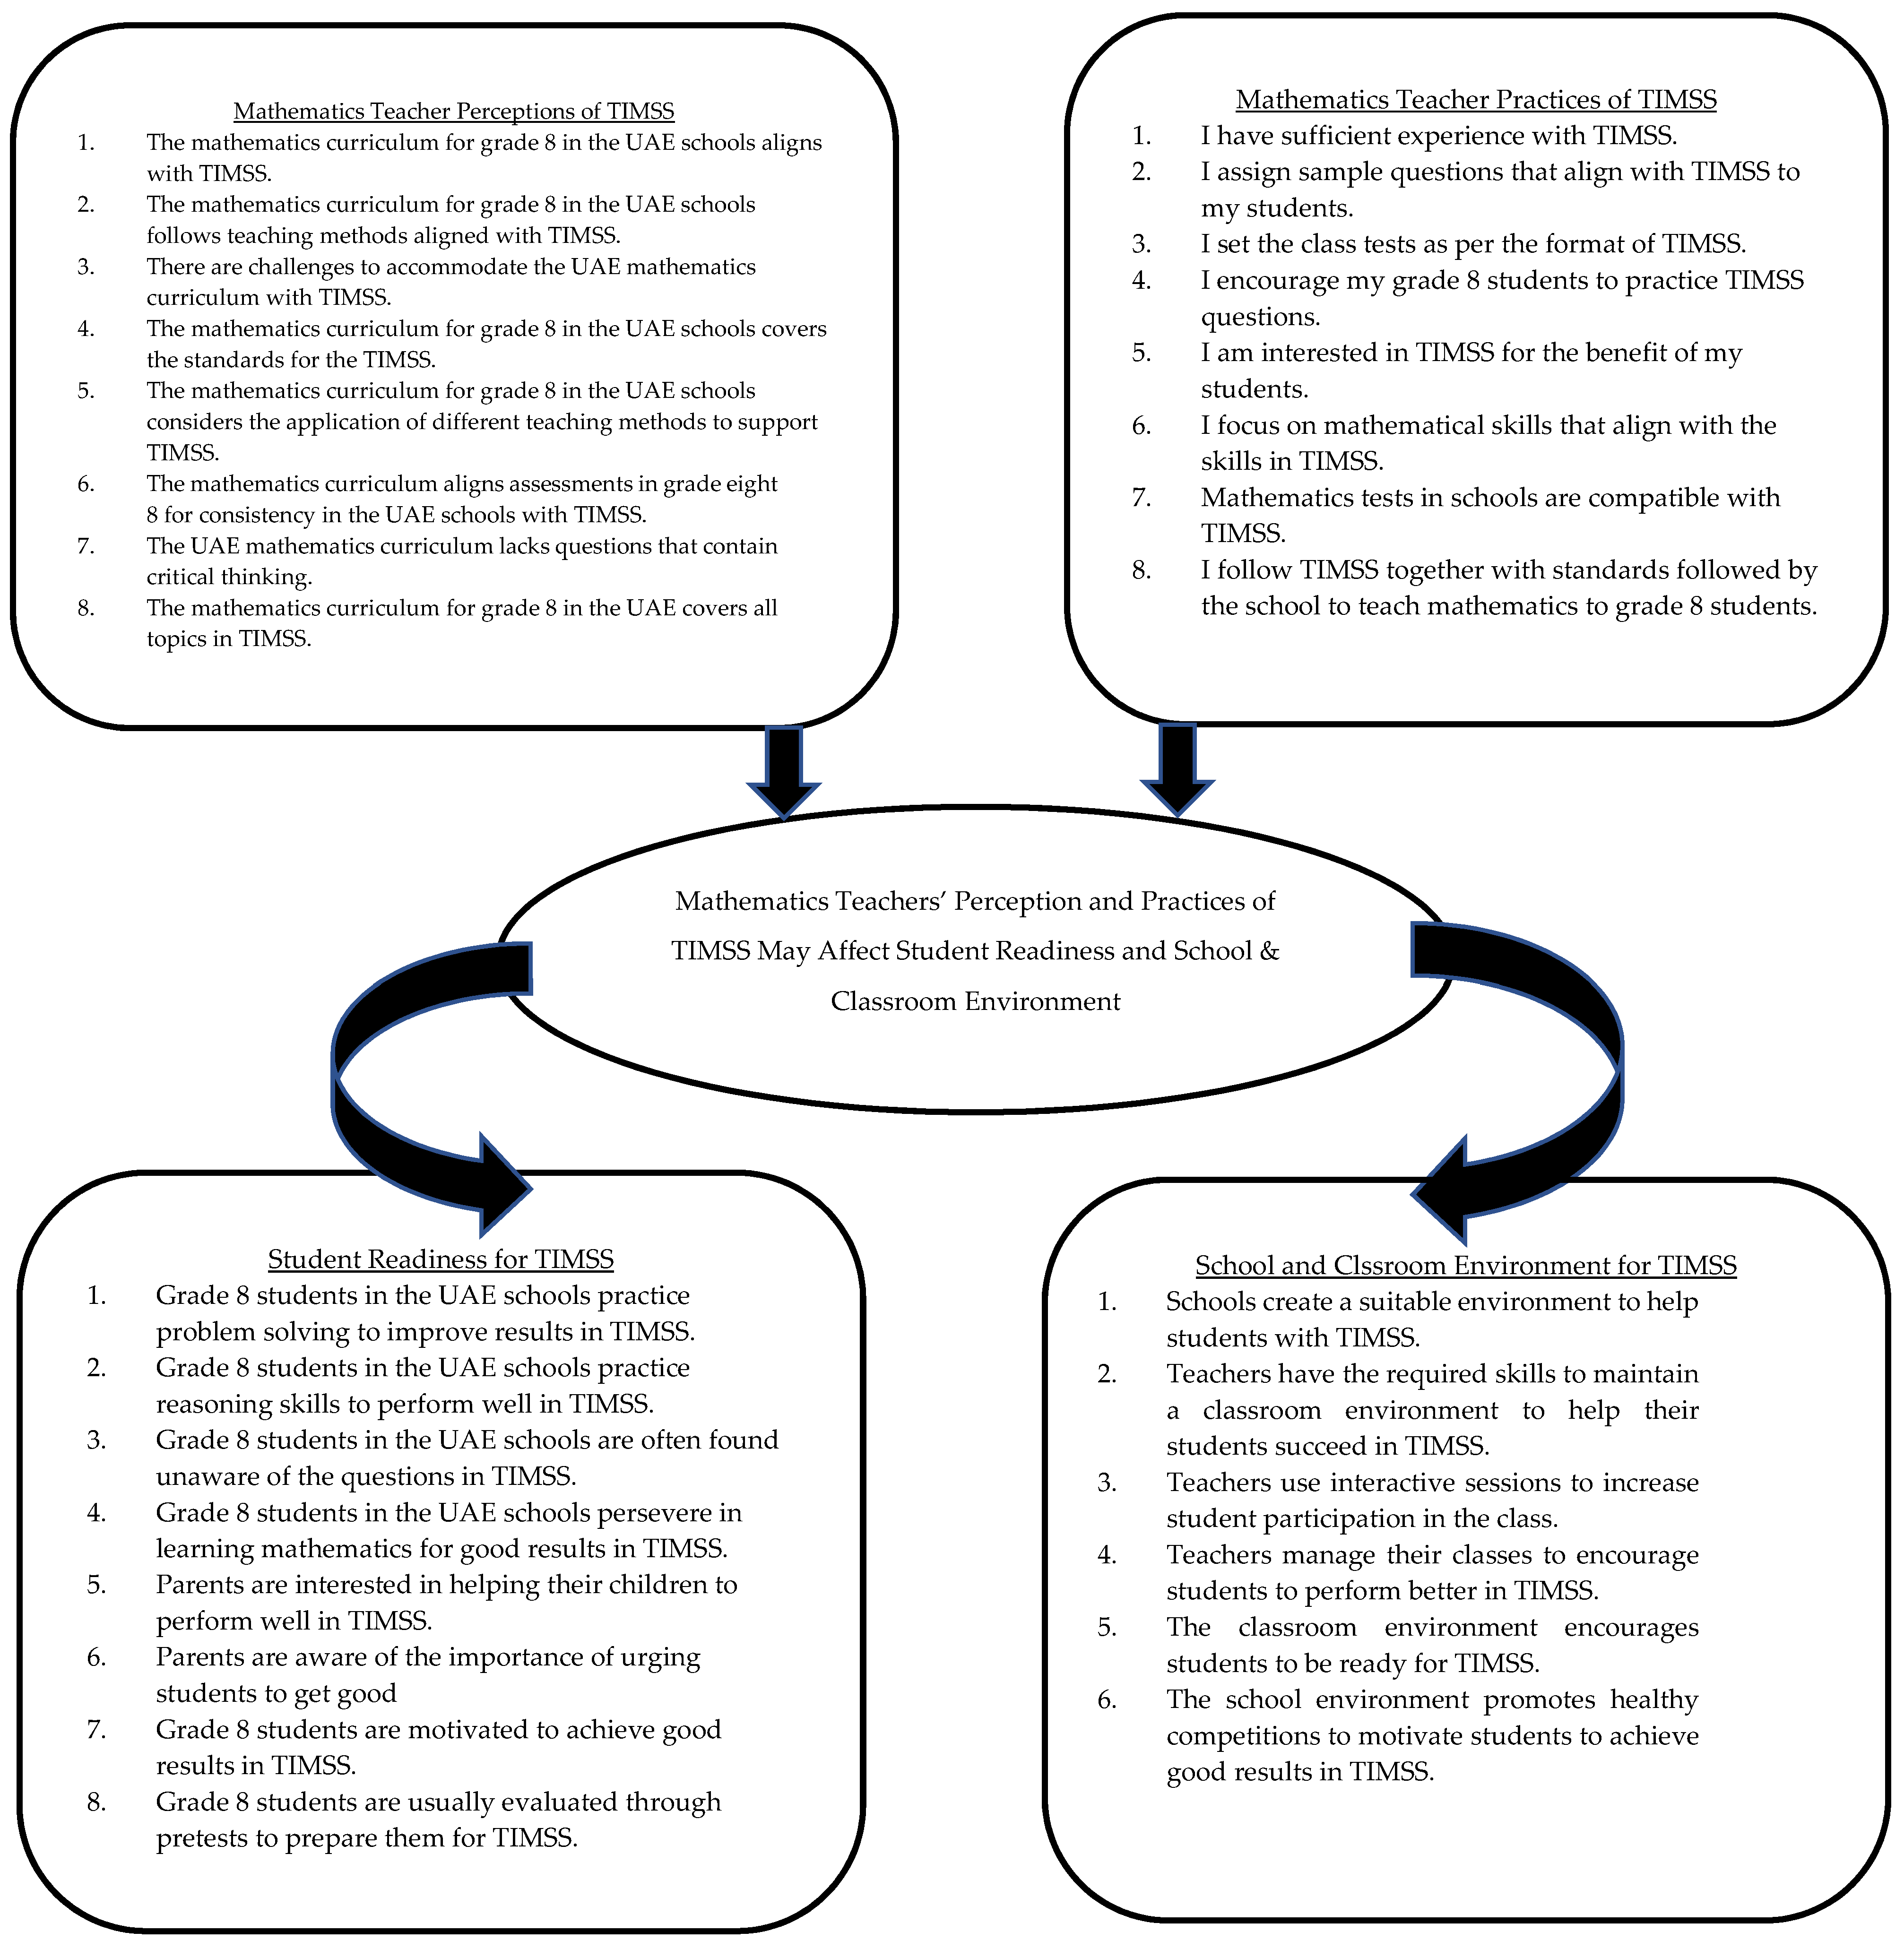
Conceptual Framework
This study was designed to investigate four aspects of mathematics teachers’ perception and self-reported practices related to TIMSS in Abu Dhabi. These four aspects were mathematics teachers’ perceptions of TIMSS, mathematics teachers’ practices for TIMSS, student readiness for TIMSS, and school and classroom environment for TIMSS; the items associated with these four aspects are presented in a conceptual framework in
Figure 1.
The conceptual framework provided in
Figure 1 shows the interrelationships between the four aspects considered in this study. Mathematics teachers’ perceptions of TIMSS emphasize the kind of perceptions that Abu Dhabi mathematics teachers have formed based on their knowledge and experience while teaching mathematics. This construct included eight items collected from the literature that, while not directly related to TIMSS, were related to teacher perceptions of the mathematics curriculum, challenges associated with implementing the mathematics curriculum, mathematics teaching, mathematics learning, and assessment practices in relation to TIMSS. The second aspect in this study was associated with mathematics teachers’ experiences, practices, interests, skills, alignments, and teaching and learning standards with respect to items included in TIMSS. The third aspect in this study was associated with mathematics teachers’ perceptions of student readiness for TIMSS, which includes items associated with students’ problem-solving practice, mathematical reasoning, awareness of test items, motivation and orientation of learning mathematics with respect to TIMSS, parents’ interests and awareness of TIMSS, and use of tests and pretests to prepare students for TIMSS. The fourth aspects in this study was related to the school and classroom environment for TIMSS, which included variables associated with efforts create a suitable environment with interactive classroom sessions, encouragement for students to perform better in TIMSS, and attempts to prepare students for TIMSS through classroom practice.
4. Results
The means of four domains were calculated to interpret the overall perceptions of mathematics teachers concerning their practices, instruction, classroom environment, and student readiness on TIMSS in Abu Dhabi Emirate schools (
Table 2).
The teachers; perceptions of TIMSS have the highest mean of 3.17 and the lowest standard deviation of 0.42, meaning that respondents’ perception about TIMSS were the strongest and had the least variability. In contrast, teachers’ perceptions about “Readiness of Students for TIMSS” have the lowest mean of 2.72, with an SD of 0.43. Teachers’ perceptions about “School and Classroom Environment” have the highest standard deviation of 0.59, which means that responses had high variability or dispersion from the mean. We can say that teachers’ perceptions of TIMSS were the most consistent or uniform based on this item’s highest mean value and lowest standard deviation.
To examine whether mathematics teachers in Abu Dhabi Emirate schools have positive or negative perceptions of TIMSS, a one-sample
t-test was conducted for each dimension and related items, as illustrated in
Table 3,
Table 4,
Table 5 and
Table 6.
Figure 2,
Figure 3,
Figure 4 and
Figure 5 show the distribution of average item scores for each dimension.
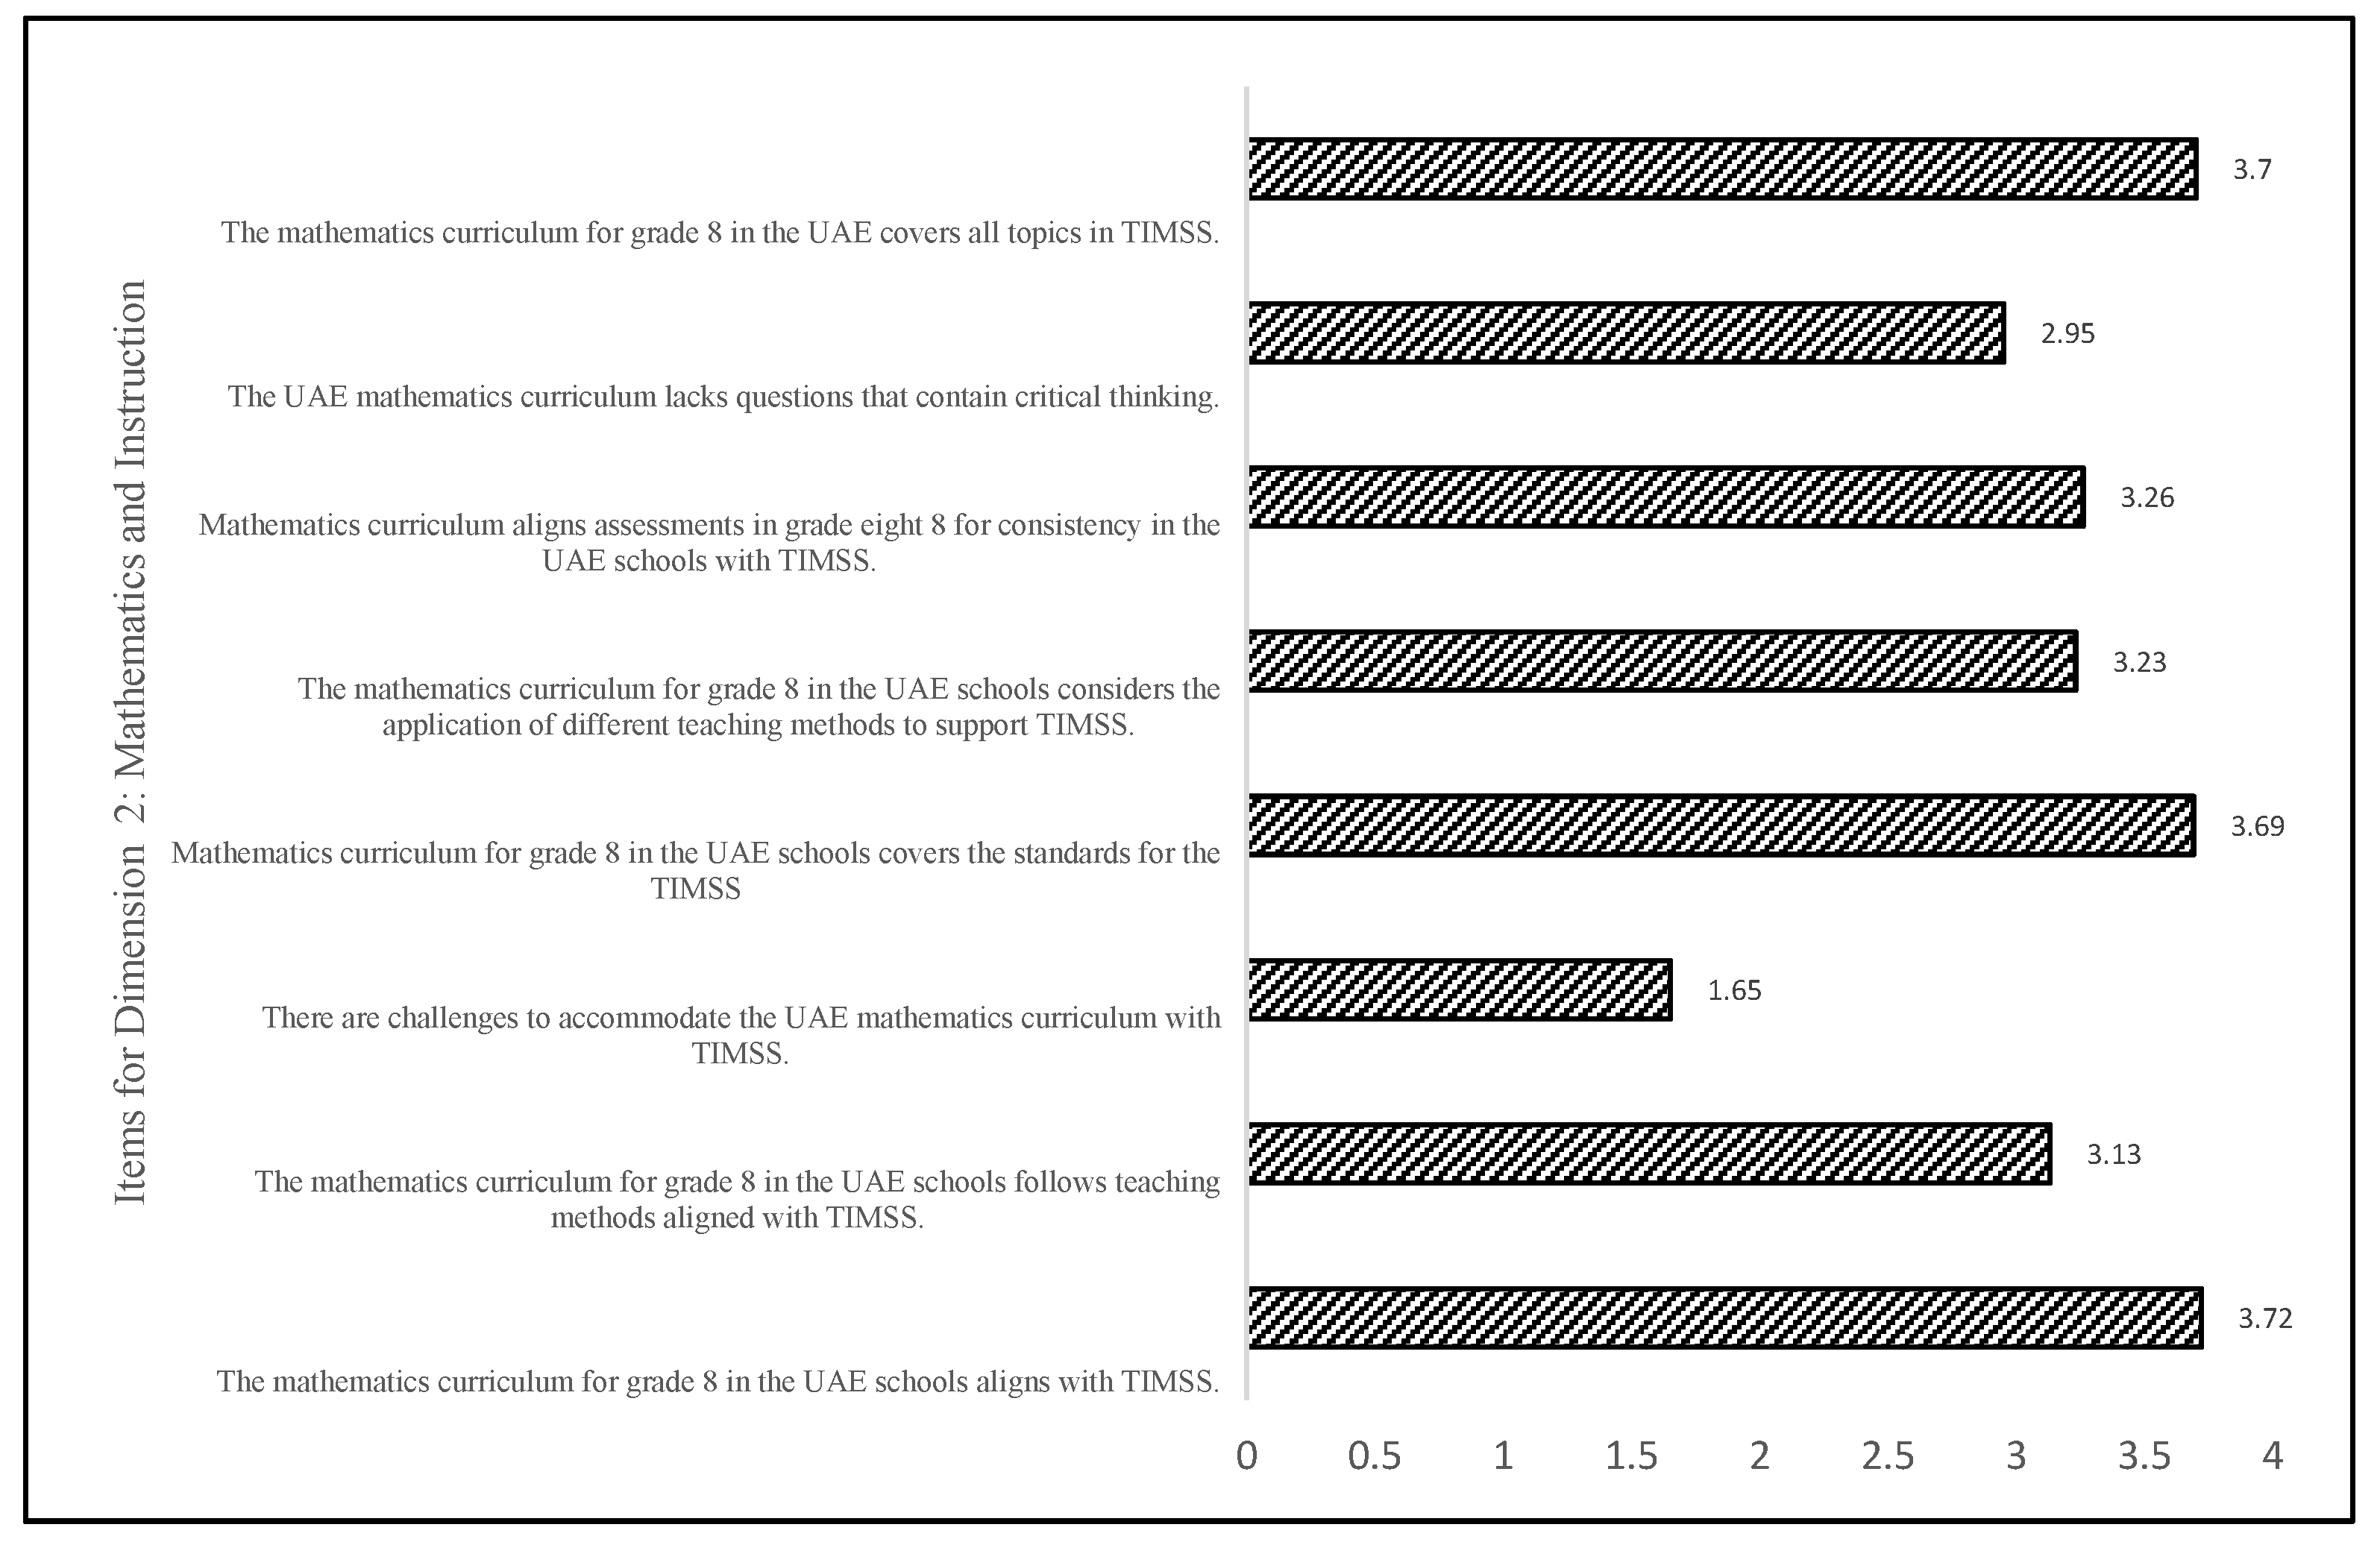
4.1. Mathematics Teachers’ Perceptions of TIMSS
A One-Sample
t-test was conducted to examine teachers’ perceptions of TIMSS (
Table 3).
The one-sample
t-test above (
Table 3) shows that the mathematics curriculum for grade 8 in the UAE schools aligns with TIMSS (Mean = 3.72, SD = 0.788,
p < 0.05). This means that teachers believed that the mathematics curriculum for grade 8 in the UAE positively aligns with the TIMSS. Similarly, they had a significantly positive perception towards whether the mathematics curriculum for grade 8 in the UAE school covers the standards for TIMSS (Mean = 3.69, SD = 0.830, and
p < 0.05). This means that the mathematics curriculum for grade 8 introduces, explains, and implements the TIMSS standards. Additionally, the mathematics curriculum for grade 8 in the UAE schools positively considers the application of different teaching methods to support TIMSS (Mean = 3.23, SD = 1.162 and
p < 0.05). However, the participants expressed negative perceptions on the challenges faced in accommodating the UAE mathematics curriculum in the TIMSS context (Mean = 1.65, SD = 0.753, and
p < 0.05). Their perceptions were neutral toward the UAE mathematics curriculum, which is lacking in questions that require critical thinking (
p > 0.05). Overall, teachers had positive perceptions towards TIMSS (Mean = 3.17, SD = 0.42 and
p < 0.05) (
Table 3,
Figure 2).
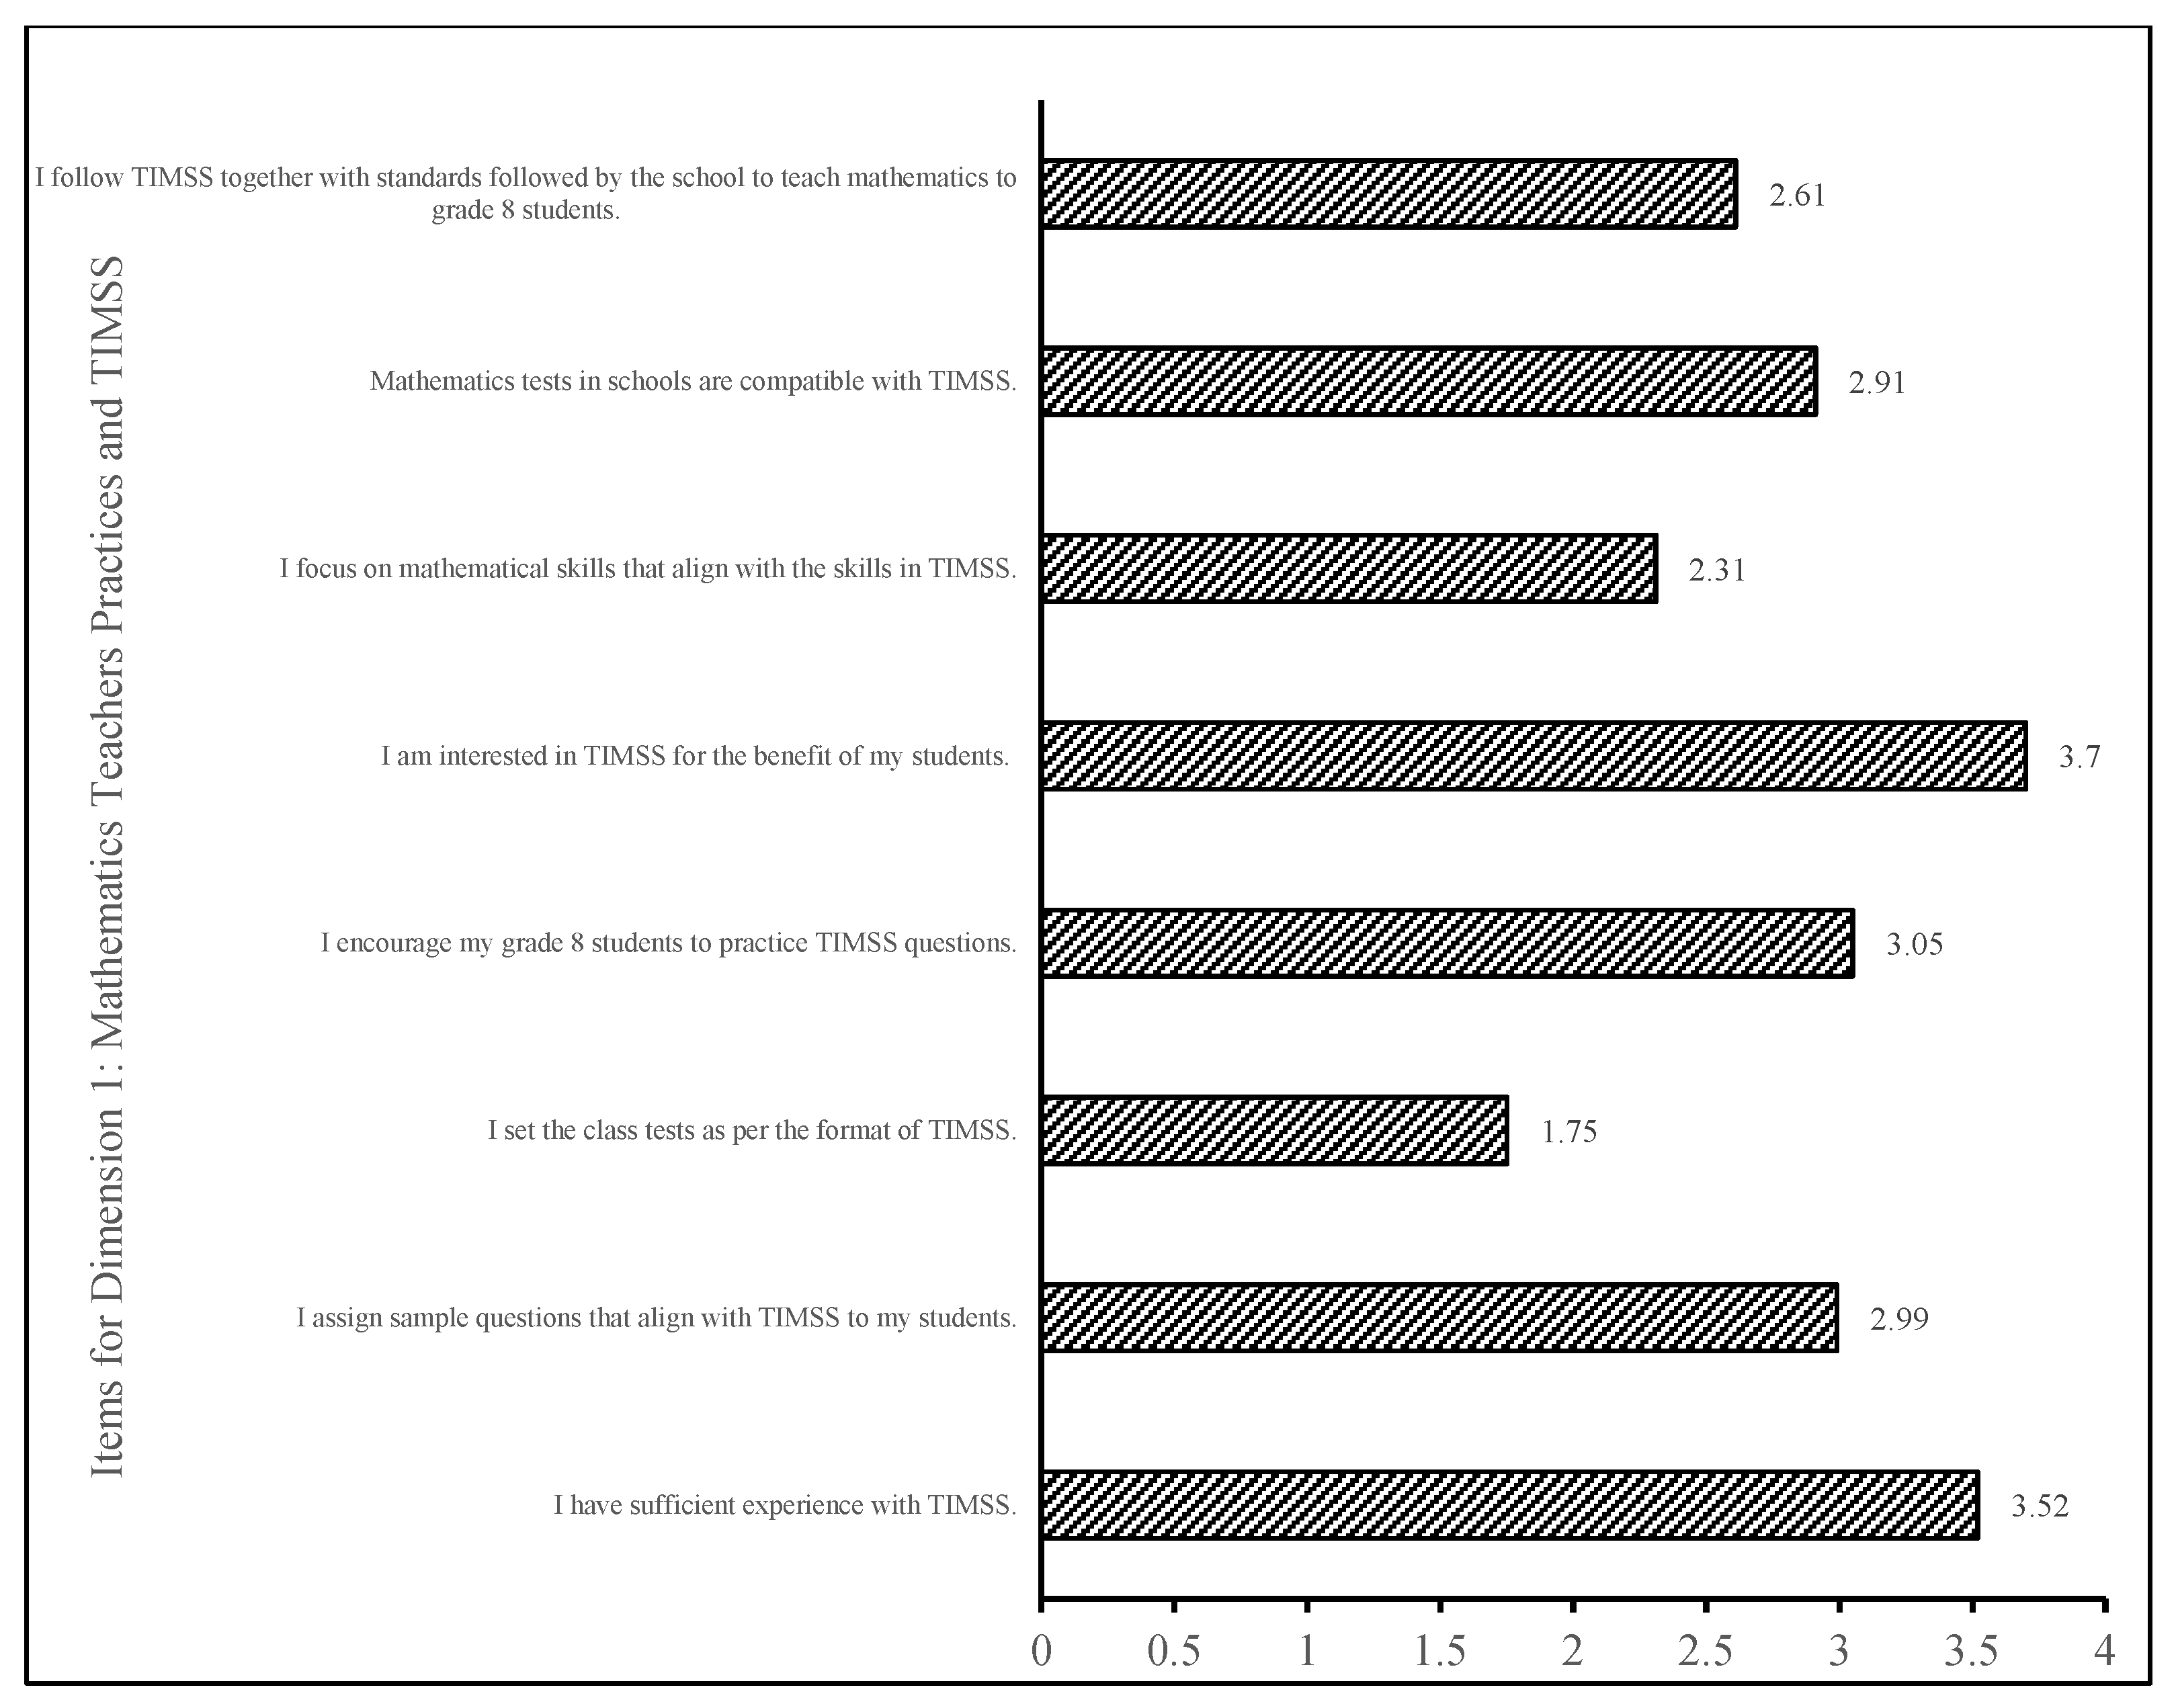
4.2. Mathematics Teachers’ Self-Reported Practices Related to TIMSS
A One-Sample
t-test was conducted to examine teachers’ self-reported practices related to TIMSS (
Table 4).
The one-sample
t-test results above (
Table 4) show that teachers have positive perceptions towards having sufficient experience with TIMSS (Mean = 3.52, SD = 1.190,
p < 0.05). This means that teachers believe they have sufficient experience with TIMSS. Similarly, they had significantly positive perceptions of the benefits of TIMSS for students (Mean = 3.70, SD = 0.794, and
p < 0.05). However, they expressed negative perceptions on the items related to the class tests using the format of TIMSS (Mean = 1.75, SD = 1.074, and
p < 0.05), the focus on mathematical skills that align with the skills in TIMSS (Mean = 2.31, SD = 1.50, and
p < 0.05), and following TIMSS together with the standards followed by the school to teach mathematics to grade 8 students (Mean = 2.61, SD = 1.189, and
p < 0.05). Their perceptions were neutral toward assigning sample questions that align with TIMSS to their students, encouraging grade 8 students to practice TIMSS questions, and compatibility between mathematics tests in schools and TIMSS (
p > 0.05). Overall, teachers had a negative perception toward Dimension 1: Mathematics Teachers’ Practices for TIMSS (Mean = 2.86, SD = 0.58 and
p < 0.05) (
Table 4,
Figure 3).
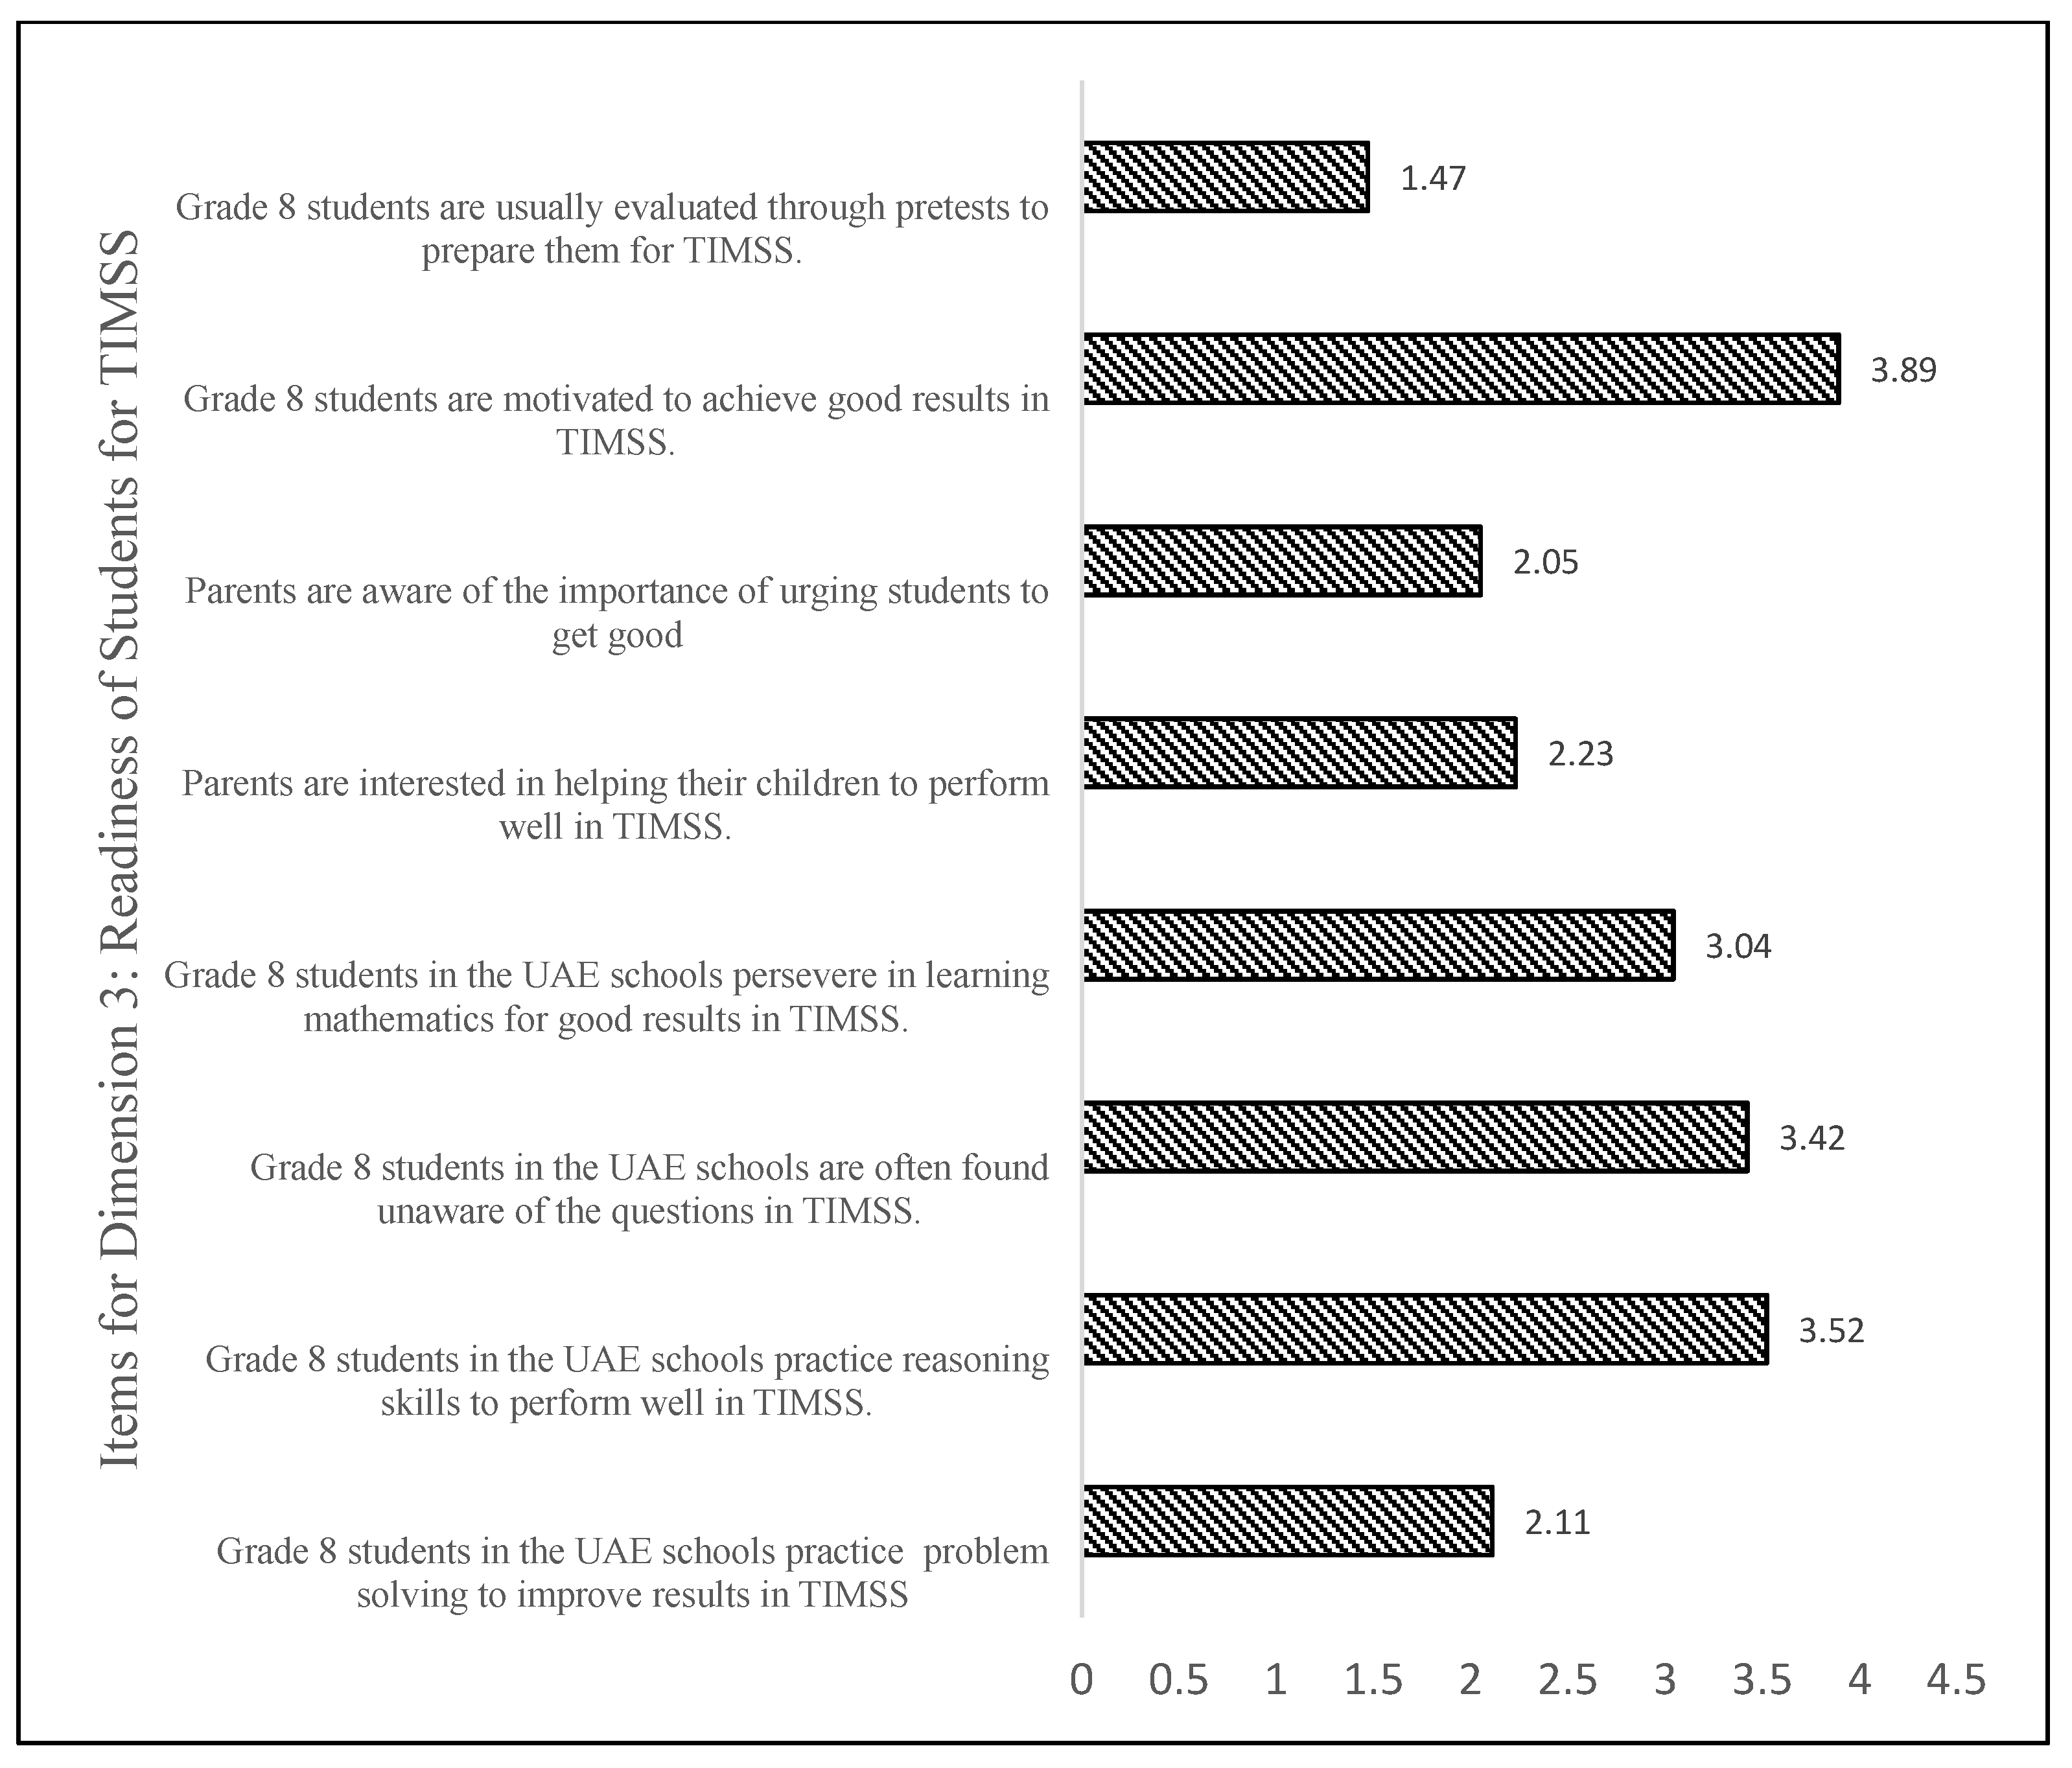
4.3. Mathematics Teachers’ Perceptions of Student Readiness for TIMSS
A One-Sample t-test was conducted in order to examine teachers’ perceptions on Dimension 3: Readiness of Students for TIMSS. These items had five-point Likert-scale responses from strongly disagree (coded 1) to strongly agree (coded 5), and the neutral value of 3 was used as a test value.
Figure 3 shows the distribution of average item scores for the readiness of students for TIMSS from the teachers’ viewpoint. The one-sample
t-test above (
Table 5) shows that teachers’ perception of student readiness for TIMSS is significantly negative due to the output realized (mean = 2.11, SD = 1.38,
p > 0.05); the value of this test item was less than 3.0. However, certain items highlighted by
Table 3 above, such as students’ motivation to attain better results (mean = 3.89, SD = 0.82,
p > 0.05) and practicing reasoning skills to achieve better results (mean = 3.52, SD = 0.82,
p > 0.05) had test values higher than 3.0. Among the negative items indicating poor readiness student readiness concern grade 8 students in UAE schools practicing problem solving to improve results in the TIMSS (mean = 2.11, SD = 1.38,
p > 0.05) and parents’ interest in helping their children to perform well in TIMSS (mean = 2.23, SD = 1.19,
p > 0.05); additionally,
Table 3 shows statistically significant negative perceptions regarding parents’ awareness of the importance of urging students towards high achievement (mean = 2.05, SD = 1.20,
p > 0.05) and awareness that grade 8 students are usually evaluated through pretests to prepare them for TIMSS (mean = 1.47, SD = 0.938,
p > 0.05). This clearly shows negative perceptions regarding the readiness of students for TIMSS. Nonetheless, grade 8 students in UAE schools who practice reasoning skills positively perform well in TIMSS (mean = 3.52, SD = 0.89,
p < 0.05), and grade 8 students in UAE schools were found to often be unaware of the TIMSS questions (mean = 3.42 SD = 0.88,
p < 0.05) (
Table 5,
Figure 4).
4.4. Mathematics Teachers’ Perceptions of the School and Classroom Environment for TIMSS
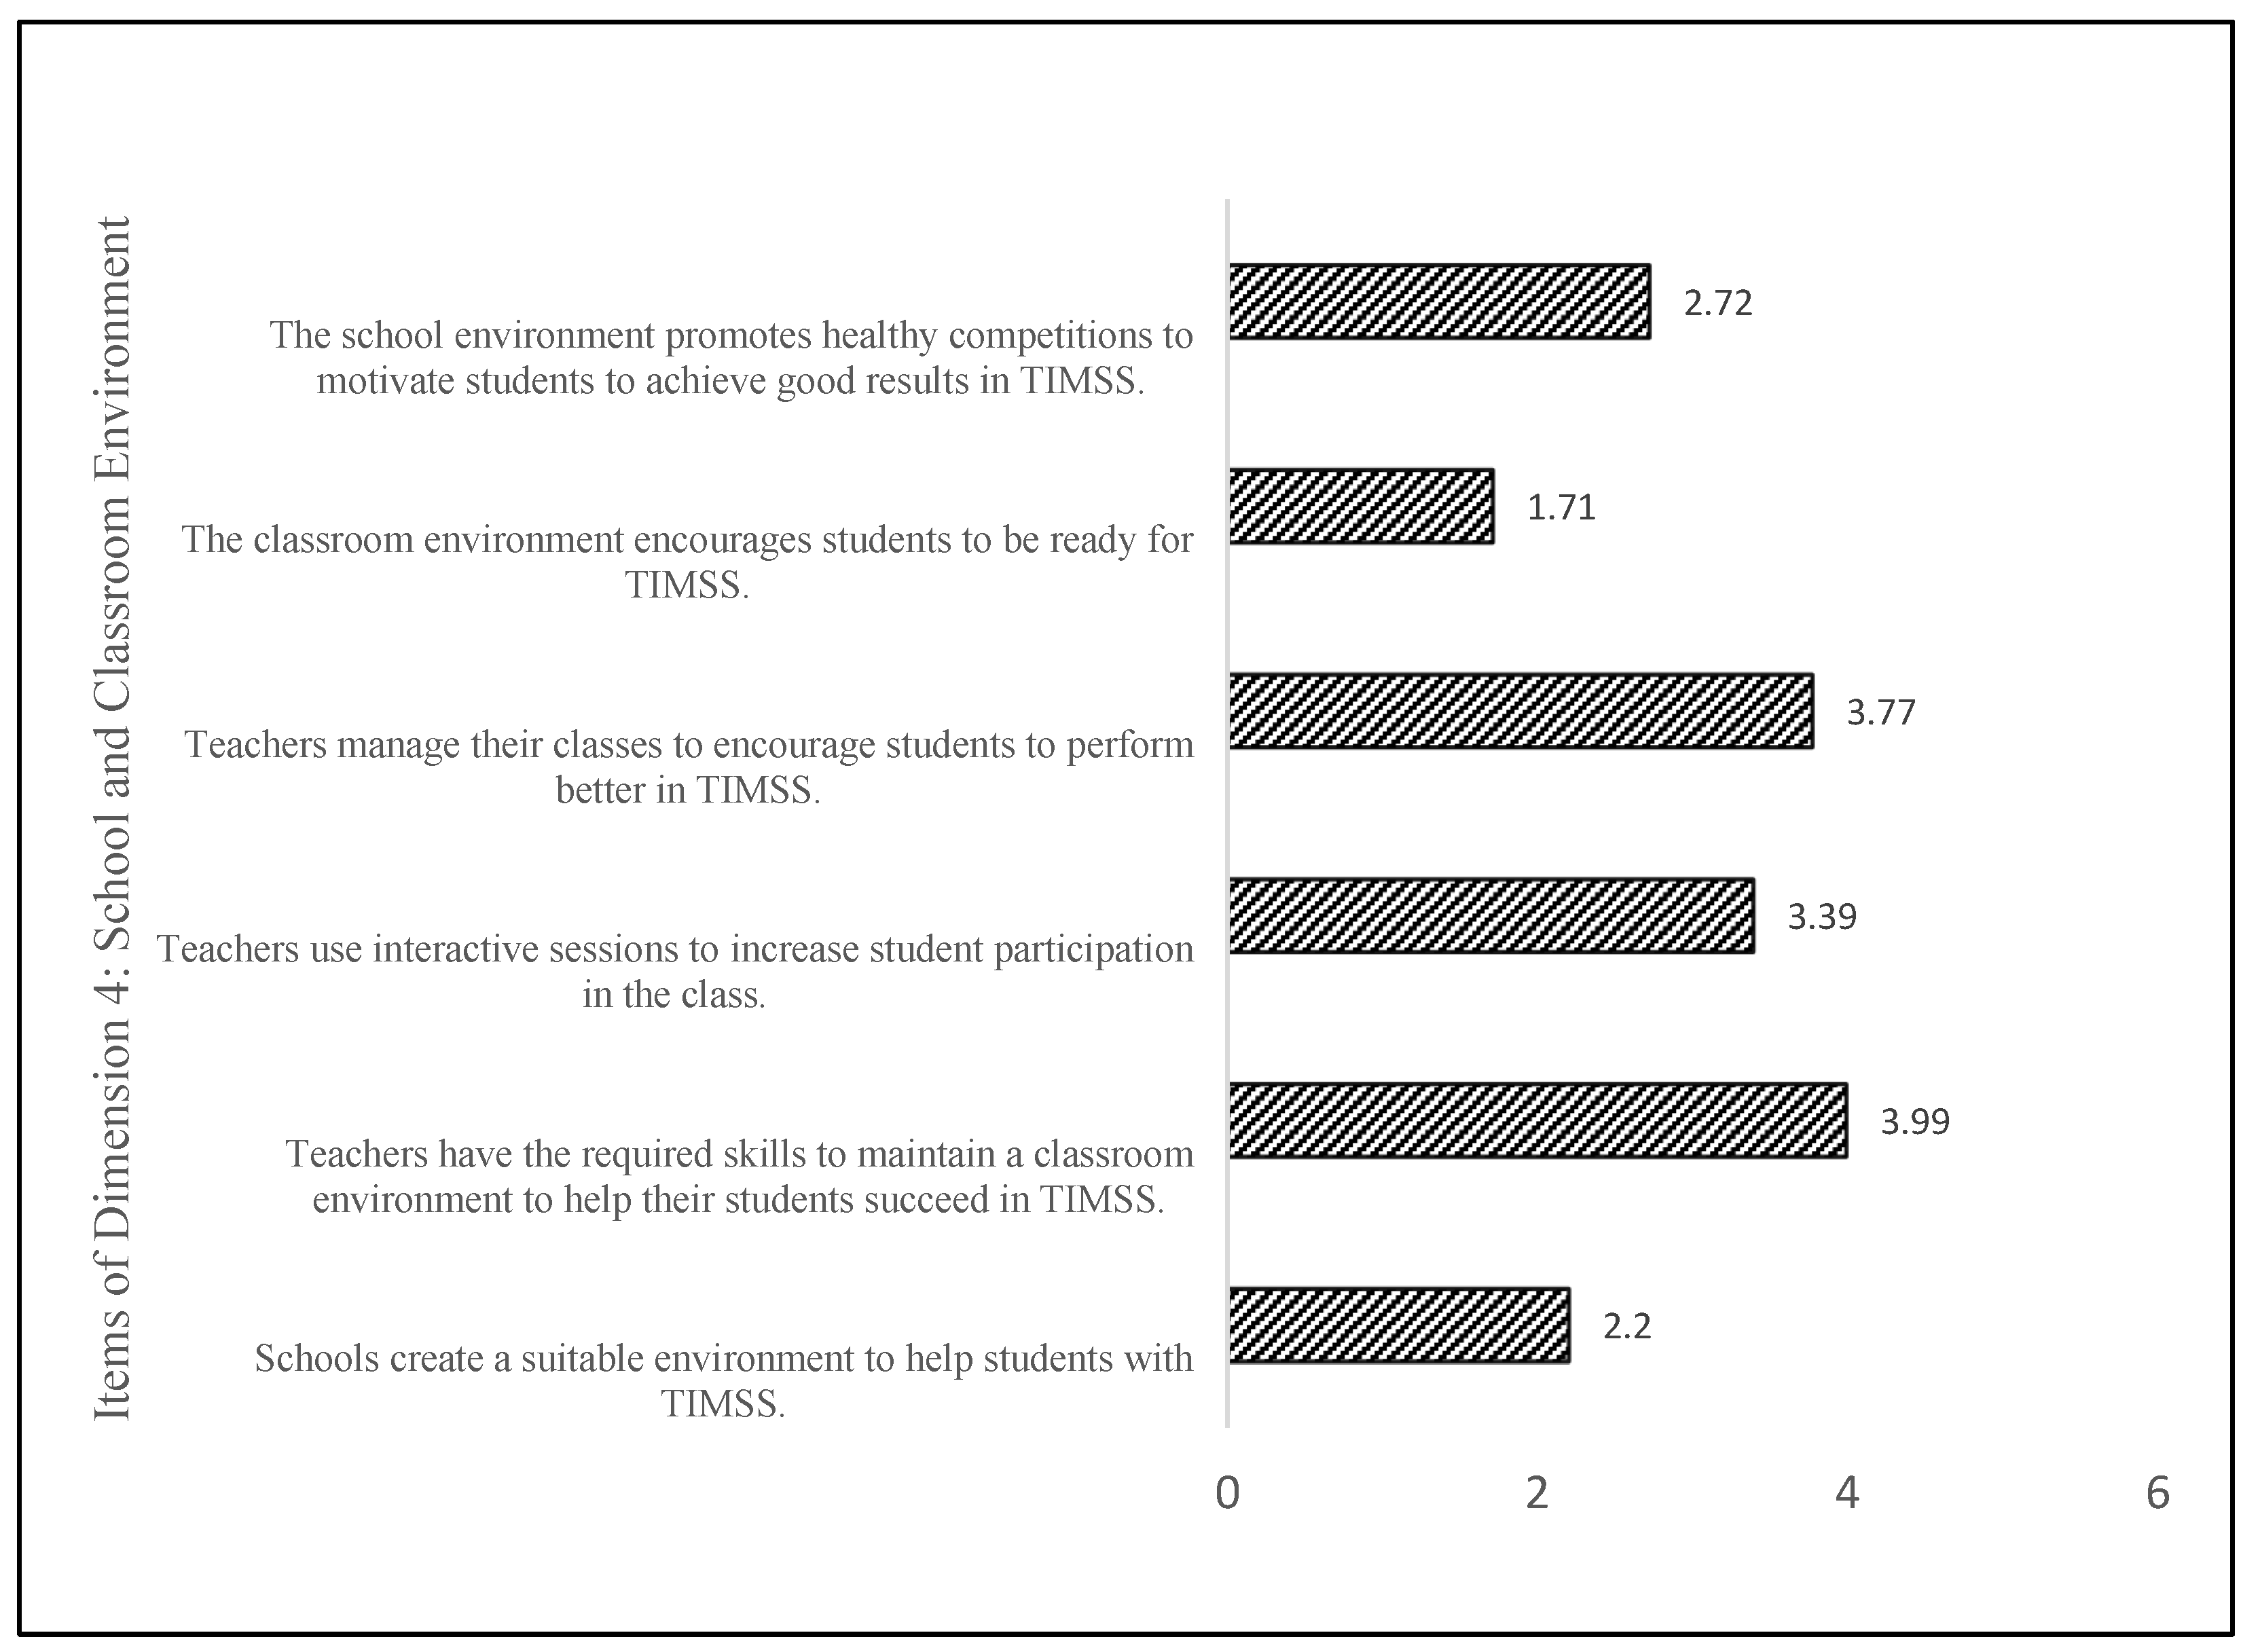
A One-Sample t-test was conducted in order to examine teachers’ perceptions on items related to Dimension 4: School and Classroom Environment. These items had five-point Likert-scale responses from strongly disagree (coded 1) to strongly agree (coded 5), and the neutral value of 3 was used as a test value.
Figure 5 shows the distribution of average item scores for school and classroom environment for TIMSS from the teachers’ perspective. The one-sample
t-test above (
Table 6) shows that the teachers had negative perceptions on Dimension 4: School and Classroom Environment. School and classroom environment was statistically significantly negative because it attained an overall mean less than 3.0. The test expressed negative perceptions as to whether the classroom environment encourages students to be ready for TIMSS (Mean = 1.71, SD = 1.14, and
p < 0.05), emphasis on schools creating a suitable environment to help students with TIMSS (Mean = 2.20, SD = 1.40, and
p < 0.05), and whether the school environment promotes healthy competition to motivate students achieve good results in TIMSS (Mean = 2.72, SD = 1.34, and
p < 0.05). Nevertheless, the test shows that the teachers have the required skills to maintain a classroom environment to help their students succeed in TIMSS (Mean = 3.99, SD = 0.77,
p < 0.05). Equally, teachers use interactive sessions to increase students’ participation in their class (Mean = 3.39, SD = 1.15, and
p < 0.05), and teachers positively manage their classes to encourage students to perform better in TIMSS (Mean = 3.77, SD = 0.71 and
p < 0.05) (
Table 6,
Figure 5).
4.5. Differences between Males and Females with Respect to Mathematics Teachers’ Perceptions of TIMSS
To examine whether there is any difference between male and female teachers’ perceptions of TIMSS in Abu Dhabi Emirate schools, an independent samples
t-test was utilized. The mean (M) and standard deviation (SD) of each group are illustrated in
Table 7.
An independent samples t-test for mathematics teachers’ perceptions of TIMSS in Abu Dhabi Emirate schools based on gender showed that there was a statistically significant difference between male and female teachers in overall perception of TIMSS (Male: Mean = 2.98, SD = 0.31; Female: Mean = 2.87, SD = 0.28, and p-value = 0.000 < 0.01). In addition, an independent samples t-test showed no was statistically significant differences between male and female teachers in Dimension 1: Mathematics Teachers’ Practices with TIMSS (Male: Mean = 2.88, SD = 0.64; Female: Mean = 2.84, SD = 0.52, and p-value = 0.47 > 0.01). Male and female teachers have different perceptions concerning “Mathematics Teachers’ Practices and TIMSS”. Similarly, an independent t-test indicated that there was no statistically significantly difference between male and female teachers in Dimension 2: Mathematics and Instruction (Male: Mean = 3.20, SD = 0.45; Female: Mean = 3.14, SD = 0.39, and p-value = 0.109 > 0.01), meaning that male and female have similar opinions towards Dimension 2: Mathematics and Instruction. The independent t-test indicated that there was no statistically significantly difference between male and female teachers in Dimension 3: Readiness of Students for the TIMSS (Male: Mean = 2.75, SD = 0.44; Female: Mean = 2.69, SD = 0.42, and p-value = 0.134 > 0.01), meaning that male and female teachers have a similar opinion towards Dimension 3: Readiness of Students for TIMSS. In the same vein, an independent t-test indicated that there was a statistically significantly difference between male and female teachers in Dimension 4: School and Classroom Environment (Male: Mean = 3.14, SD = 0.56; Female: Mean = 2.81, SD = 0.58, and p-value = 0.000 < 0.01), meaning that male and female teachers have different opinions towards Dimension 4: School and Classroom Environment.
4.6. Differences between Public and Private Schools with Respect to Mathematics Teachers’ Perceptions of TIMSS
To examine whether there is any difference between public and private school teachers’ perceptions of the TIMSS in Abu Dhabi Emirate schools, an independent samples
t-test was utilized. The mean (M) and standard deviation (SD) of each group are illustrated in (
Table 8).
An independent samples t-test for mathematics teachers’ perceptions of TIMSS in Abu Dhabi Emirate schools based on school type showed that there was no statistically significant difference between public and private schools in overall teachers’ perception of TIMSS (public: Mean = 2.95, SD = 0.30; private: Mean = 2.89, SD = 0.30, and p-value = 0.018 > 0.01). In addition, an independent samples t- test showed no statistically significant difference between public and private schools in teacher perceptions of Dimension 1: Mathematics Teachers Practices for the TIMSS (public: Mean = 2.87, SD = 0.59; private: Mean = 2.84, SD = 0.56, and p-value = 0.524 > 0.01). Similarly, an independent t-test indicated that there was no statistically significantly difference between public and private schools in terms of teachers’ perceptions in Dimension 2: Mathematics and Instruction (public: Mean = 3.15, SD = 0.45; private: Mean = 3.18, SD = 0.37, and p-value = 0.512 > 0.01). An independent t-test indicated a statistically significantly difference between public and private schools in teachers’ perceptions of Dimension 3: Readiness of Students for TIMSS (public: Mean = 2.66, SD = 0.49; private: Mean = 2.78, SD = 0.34, and p-value = 0.000 < 0.01). In the same vein, an independent t-test indicated a statistically significantly difference between public and private schools in teachers’ perceptions of Dimension 4: School and Classroom Environment (public: Mean = 3.18, SD = 0.58; private: Mean = 2.70, SD = 0.49, and p-value = 0.000 < 0.01).
4.7. Differences in Teachers’ Perceptions of TIMSS in Abu Dhabi Emirate Schools Based on Math Teaching Experience
To examine whether there is any difference in teachers’ perceptions of TIMSS in Abu Dhabi Emirate Schools based on teachers’ level of math teaching experience, a one-way ANOVA and post hoc comparisons were utilized.
In order to determine whether the differences in the mathematics teachers’ perceptions of TIMSS in Abu Dhabi Emirates schools were statistically significant with experience (at significance level α≤ 0.05), one-way ANOVA was used, as shown in
Table 9.
A one-way ANOVA test was conducted to determine whether there were differences in overall teachers’ perceptions of TIMSS on Dimension 1: Mathematics Teachers perceptions of TIMSS, Dimension 2: Mathematics teachers’ practices of TIMSS, Dimension 3: Mathematics teachers’ perceptions of student readiness for the TIMSS, and Dimension 4: Mathematics teachers’ perceptions of school and classroom environment for TIMSS based on teachers’ level of experience (
Table 9). Participants were classified into four groups, namely, less than 5 years (n = 40), between 6 and 10 years (n = 40), between 11 and 15 years (n = 226), and 16 years and above (n = 216). There were no outliers, as assessed by boxplot, and data were normally distributed for each group, as assessed by Shapiro–Wilk test (
p > 0.05). All variances were homogeneous, as assessed by Levine’s test of homogeneity of variances (
p = 0.053 > 0.01). Data are presented as means, and the standard deviations of math teachers’ overall perception scores showed statistically significant differences between groups with different levels of experience: F (3, 518) = 4.12,
p < 0.01. Teachers’ perceptions of TIMSS increased from the group with 11 to 15 years’ experience (M = 2.88, SD = 0.26) to the group with 16 years’ experience and above (M = 2.96, SD = 0.30), in that order. Tukey’s post hoc analysis revealed that the increase from the group with 11 to 15 years’ experience to the group with 16 years’ experience or more was statistically significant 0.05, but not at 0.01 level (
p = 0.016). However, no other group differences were statistically significant (
Table 10).
In the same vein, the following data are presented as means and standard deviation. The Dimension 1: Mathematics Teachers’ Practices for TIMSS showed statistically significantly differences between different experience groups: F (3, 518) = 4.54, p < 0.05. Dimension 1: Mathematics Teachers’ Practices for TIMSS showed a change from the group with less than 5 years’ experience (M = 3.15, SD = 0.34) to the group with between 11 and 15 years’ experience (M = 2.79, SD = 0.44), and the group with 16 years and above (M = 2.87, SD = 0.66). Tukey’s post hoc analysis revealed that the changes from the former group to the latter groups were statistically significant (p < 0.01). The data revealed that Dimension 2: Mathematics teachers’ perceptions of TIMSS showed no statistically significantly differences between groups with different levels of experience: F (3, 518) = 2.84, p > 0.01. Similarly, the one-way ANOVA results indicated that Dimension 3: Teachers’ perception about student readiness for TIMSS was not statistically significant among groups with different levels of teaching experience: F (3, 518) = 1.89, p > 0.01.
However, the Dimension 4: Teachers’ perceptions of School and Classroom Environment for TIMSS showed statistically significantly differences among groups with different levels of teaching experience: F (3, 518) = 31.99,
p < 0.01 (
Table 9). Scores on mathematics teachers’ perceptions of School and Classroom Environment for TIMSS score changed from the group with less than 5 years’ experience (M = 3.10, SD = 0.54) to the group with between 11 and 15 years’ experience (M = 2.72, SD = 0.51) and then to the group of 16 years and above (M = 3.22, SD = 0.60), in that order. Tukey’s post hoc analysis revealed that the increase from the former group to the latter were statistically significant (
p < 0.01). Furthermore, there was an increase from the group with between 6 and 10 years’ experience (M = 2.82, SD = 0.51) to the group with 16 years’ experience and above (M = 3.22, SD = 0.60). The increased scores in the groups with more teaching experience was indicated by Tukey’s post hoc analysis, which revealed that the increase from the group with between 6 and 10 years’ experience to the group with 16 years’ experience or more was statistically significant (
p < 0.01).
4.8. Differences in Teachers’ Perceptions of TIMSS in Abu Dhabi Emirates Schools Based on Math Teachers’ Qualifications
To examine whether there are any difference in teachers’ perceptions of TIMSS in Abu Dhabi Emirates schools based on math teachers’ qualifications, a one-way ANOVA test and post hoc comparisons were utilized. The mean (M) and standard deviation (SD) of each group are illustrated in
Table 11, while the post hoc comparisons are shown in
Table 12.
A one-way ANOVA test was conducted to determine whether there are differences in overall teachers’ perception of TIMSS on Dimension 1: Mathematics Teachers Practices for the TIMSS, Dimension 2: Mathematics and Instruction, Dimension 3: Readiness of Students for the TIMSS, and Dimension 4: School and Classroom Environment on the basis of math teachers’ qualifications (
Table 11). The participants were classified into three groups: Bachelor’s degree (n = 298), Master’s degree (n = 208), and PhD (n = 16). There were no outliers, as assessed by boxplot; data were normally distributed for each group, as assessed by the Shapiro–Wilk test (
p > 0.05). Variances were homogeneous, as assessed by Levine’s test of homogeneity of variances (
p = 0.053). For math teachers’ overall perception scores, the one-way ANOVA results indicated no statistically significant differences among groups with different levels of qualifications: F (2, 519) = 2.191,
p > 0.05.
For Dimension 1: Mathematics Teachers’ Practices for TIMSS scores, the one-way ANOVA results indicated no statistically significant differences among teachers with different qualifications: F (2, 519) = 0.986, p > 0.05. In the same vein, the one-way ANOVA results indicated that scores on Mathematics Teachers’ Perceptions of TIMSS were not statistically significantly different across the groups with different educational qualifications at 0.05 level of significance. However, the Dimension 3: Mathematics Teachers’ Perceptions of Student Readiness for TIMSS showed statistically significant differences by teachers’ qualifications: F (2, 519) = 3.566, p < 0.05. Mathematics Teachers’ Perceptions of Student Readiness for the TIMSS showed an increase from teachers with a Bachelor’s degree (M = 2.71, SD = 0.40) to those with a PhD (M = 3.00, SD = 0.34), also Master’s degree (M = 2.70, SD = 0.49) to a PhD (M = 3.00, SD = 0.34). Tukey’s post hoc analysis revealed that the increase from the Bachelor’s degree group to the PhD group was statistically significant (p = 0.025 < 0.05); and the increase from the Master’s degree group to the PhD group was statistically significant (p = 0.023 < 0.05). However, no other group differences were statistically significant.
The one-way ANOVA results indicated that scores on Dimension 4: Mathematics Teachers’ Perceptions of School and Classroom Environment for TIMSS were statistically significant among the groups with different qualifications: F (2, 519) = 12.556, p < 0.01. Scores on Mathematics Teachers’ Perceptions on School and Classroom Environment for TIMSS increased from the Bachelor’s degree group (M = 2.85, SD = 0.58) to the Master’s degree group (M = 3.28, SD = 0.57). Tukey’s post hoc analysis revealed that the increase from the Bachelor’s degree group to the Master’s degree group was statistically significant (p < 0.01), and none of the other pairs were statistically significant different at 0.01 levelo of significance.
5. Discussion
A one-Sample t-test was conducted to examine the perceptions of teachers on items related to mathematics teachers’ practices for TIMSS. The results of the One-Sample t-test indicated that teachers had negative views towards practices for TIMSS (Mean = 2.86, SD = 0.58 and p < 0.05), indicating that their perception of classroom practices were not aligned with TIMSS. A One-Sample t-test was conducted to examine teachers’ perceptions of items related to mathematics teachers’ perceptions of TIMSS. The results of the One-Sample t-test indicated that teachers had a positive perception toward TIMSS (Mean = 3.17, SD = 0.41 and p < 0.05). In addition, a One-Sample t-test was conducted to examine the teachers’ perceptions of student readiness for TIMSS. The One-Sample t-test clearly shows a negative assessment of the readiness of the students for TIMSS (Mean = 2.71, SD = 0.43 and p < 0.05). Similarly, a One-Sample t-test was conducted to examine the mathematics teachers’ perceptions of the school and classroom environment for TIMSS. The results of the One-Sample t-test indicated that teachers had negative perceptions as to whether the classroom environment encourages students to be ready for TIMSS (Mean = 1.71, SD = 1.14, and p < 0.05).
Quite a few research studies have been conducted concerning mathematics teaching practices and TIMSS. This study concludes that creating a suitable environment for students, conducting interactive academic sessions, encouraging classroom environments, and promoting healthy and competitive school settings all play a significant role in student performance in mathematics, and lead to remarkable results in TIMSS. According to Güven and Akçay [
43], teachers should have sufficient experience and knowledge to deliver lessons to students efficiently. Alharbi et al. [
38] highlight teacher quality as among the critical determinants of the student learning process. A similar study by Berger et al. [
44] concluded that this attribute plays an essential role in mathematics performance. Several studies have been performed in relation to mathematics and instruction. In these studies, the efforts of Clavel, Mendez, and Crespo [
45] are comprehensive and lucid. These studies have led their study to conclude that activities such as a suitable environment for students, active involvement of skilled teaching staff, collaborative academic sessions, a motivational attitude of teachers, and ideal distribution of resources and time were helpful in improving students’ performance in mathematics in TIMMS in 2015. Incikabi et al. [
46] clearly show that teachers need to use simplified instruction when teaching mathematics. Mathematics teaching and learning can be simplified by achieving higher student engagement using flipped classes [
47]. This is most applicable when introducing new topics that students might not be conversant in. Another study carried out by Cuenca-Carlino et al. [
48] concluded that mathematics and instructions were pivotal in determining mathematics performance in TIMSS. The results of the present study suggest the same, especially considering that mathematics and instruction are at the center of mathematics teaching in alignment with TIMSS.
Davis et al. [
39] performed different studies on students’ readiness for TIMSS in order to understand the environmental impact on learning. The results led their research to confirm that an exceptional school environment, proficient instructors, communicative class sittings, better classroom management, overall classroom ambiance f, and competing milieu in schools all considerably affected mathematics performance in 2015. Furthermore, Ersan and Rodriguez [
49] revealed that most students employed different tactics to study for mathematics examinations. Teachers may see this preparation as inadequate, and as a result can guide students on what to do and what to avoid [
49]. Another similar study by Provasnik et al. [
50] showed that students’ readiness for TIMSS is an integral part of their performance. The findings of this study support this view, and helping to recognize that the readiness of students for TIMSS is among the primary determinants of performance in TIMSS. The school and classroom environment have been explored extensively by Eriksson et al. [
51] in their studies. Their results explain that well-prepared teaching staff and their cordial efforts to customize the school environment and classroom setup played a pivotal part in determining how 2015 TIMMS students performed in mathematics. An ingenious study by Kartianom and Retnawati [
52] showed that schools are ideal places for students to learn, as they contain all of the necessary amenities. The teachers are well trained to handle even those students who have challenges in understanding certain concepts [
53].
Despite the independent
t-test showing no statistically significant differences between male and female teachers in their opinions on teacher perceptions and practices regarding TIMSS, mathematics instruction, and readiness of students for TIMSS, Dimension 4 revealed a critical issue in teacher perceptions towards the school and classroom environment. Kartal [
31] highlighted that despite the initiatives taken globally to ensure equality in performance and participation, the TIMMS performance in mathematics for 8th-grade females was very low in 2015. Another study by Burroughs et al. [
32] indicated that various initiatives should be undertaken to address female teacher perceptions and classroom environment to ensure equity of outcome performance, not only equity in terms of accessing educational opportunities in mathematics. These studies show that the results of the present study are concrete and legitimate. In addition, teachers and critical players in the classroom and school environment should make efforts to counter gender stereotypes.
Even though the independent
t-tests showed no statistically significant differences between private and public schools in teachers’ perceptions of practices for TIMSS, mathematics, and instruction or of the readiness of their students for TIMSS, Dimension 4 introduces an essential issue regarding teachers’ perceptions towards school and the class environment. Cordero [
33] elaborate on this by explaining efforts towards ensuring 8th-grade students in public schools perform better. Despite this, their performance in TIMSS 2015 was significantly low. A different though related study by Bdeir [
34] further supports this, pointing out that more effective measures should be put in place to support students’ performance in public schools, particularly in mathematics. Students in public schools need to be provided with all the essentials, including being taught using the most updated syllabi used in private schools [
35]. These studies support the findings of the current study. Furthermore, the disparities between private schools and public schools should be dealt with by all stakeholders, including teachers and principals.
Our One-way ANOVA analysis indicated statistically significant differences in mathematics teaching experience regarding mathematics teaching practices for TIMSS, mathematics, instruction, and school and class environment. On the other hand, readiness for TIMSS did not significantly differ when considering teaching experience. This result is consistent with Burroughs et al. [
32], who showed that a teacher’s experience has a role in determining an 8th-grade student’s understanding. A more experienced teacher is more likely to use different and friendlier teaching strategies to teach mathematics to students. These findings are similar to another study by Alharbi et al. [
38] which confirmed that students’ readiness for mathematics exams is not necessarily affected by their teacher’s experience. Even teachers who have fewer than five years’ experience can affect the performance of 8th-grade students in TIMSS mathematics [
37]. Teachers who used modern teaching methods proved that experience only plays a role in allowing teachers to understand their students better [
39], which offers further confirmation that the results of the present study are viable and provide a real picture of how experience can affect performance without depending on school and class environment.
Our ANOVA results showed no statistically significant disparities in teacher qualifications based on teachers’ perceptions of the school and class environment or students’ readiness for TIMSS. Our results showed that mathematics teaching practices and instruction for TIMSS mathematics were inconsistent with the other dimensions and did not significantly affect performance when looked at from the perspective of teachers’ qualifications. The results showed that qualifications ranged from a Bachelor’s degree to a Masters’ Degree or PhD. The main difference in perceptions occurred between those teachers with a Master’s degree and those with a PhD, with the other groups having minimal significance. These findings are similar to those of Støle et al. [
54] on this topic; they showed that teachers’ qualifications affected 8th-grade students’ performances in TIMSS 2015. These findings are consistent with another related study by Ambussaidi and Yang [
55], in which they showed that it takes much more than a good school and class environment to understand mathematics effectively.
According to this study, one requirement for student success is that mathematics teachers should be adequately qualified, where qualifications include being well trained when engaging in teaching and learning activities. Even without the school and class environment, a qualified teacher is likely to teach 8th-grade students to understand mathematics without struggling [
49]. These previous findings provide support for the present study; the issue of qualifications among teachers has been demonstrated as a critical component in performing well in mathematics. Qualifications can be resolved in different ways, although not necessarily through considering school and class environments. While PhD-holding teachers were not necessarily more useful in teaching young 8th-grade students, their qualifications placed them in a position to understand the primary components affecting their students’ TIMSS performance in mathematics.


