Abstract
Since there is a possibility that work from home will become one of the major working styles in the era of a new normal after the COVID-19 pandemic, it is necessary to examine an effect of work from home on life of residents at home and on energy consumption. Therefore, a web-based questionnaire survey was conducted at the end of October 2020 for households in which any of the family members was a work from home worker. In regard to the changes in life schedule, work from home helped 21.5% of respondents to sleep 30 min more or even longer. This shows that the loss of commuting time to work due to work from home improved the health of respondents in terms of sleep. In terms of the changes in energy consumption, more than a quarter of households experienced an increase in electricity consumption. Around 40~50% of households whose monthly electricity consumption increased from last year were not aware of the reasons for the increase or realized it for the first time when they answered the questionnaire survey. This indicates that feedback using home energy management systems, etc., play an important role in promoting energy-saving behavioral changes. An analysis of the causes of the increase in energy consumption by households reveals that the increase in hours of use of air-conditioners is significantly correlated with the increase in household electricity consumption in August (p = less than 0.01). The large-scale questionnaire survey on Japanese housing during the COVID-19 pandemic in this study elucidated that work from home as a countermeasure against COVID-19 infection affected the residents’ lives and the energy consumption of each household. This paper also showed the causes of the increase in household energy consumption and the importance of feedback, such as HEMS, in promoting energy-saving behavior. These results are expected to help to improve health of residents and energy saving in the era of a new normal.
1. Introduction
The pandemic of COVID-19 caused drastic changes on a global scale. IEA reported that energy-related annual CO2 emissions in 2020 showed a decrease of about 200 million tons of CO2 over the previous year all around the world for the first time in human history [1].
In terms of working-style changes, more and more companies have adopted teleworking and work from home (WFH) in response to COVID-19. Teleworking is organizational work performed outside of the normal organizational confines of space and time, augmented by information and communication technologies [2]. WFH is a form of teleworking, referring to working remotely from the worker’s own home [3]. According to an estimation made by the International Labour Organization, only 7.9% of the workforce worldwide worked from home prior to the pandemic of COVID-19, but most of the governments of advanced countries ordered a lockdown or declared a state of emergency in 2020 [4]. According to a nationwide questionnaire survey conducted by PERSOL Research and Consulting Co., Ltd., 38.8% of workers who were located in the areas subject to the state of emergency declared by the government of Japan in April 2020 worked from home [5]. Although those workers have gradually come back to their offices, many of them still work from home.
Since the pandemic of COVID-19 has brought about many social changes in Japan, various surveys on the diffusion of WFH in Japan were conducted [6,7,8]. In addition, some international academic papers focused WFH [9,10] and investigated such topics as transportation habits, vigor at work, and response to WFH [11,12,13,14]. Furthermore, several studies that analyzed an effect of lifestyle changes in the house due to the widespread adoption of WFH on energy consumption of private and household sectors were published, but the findings are still insufficient [15,16,17]. The widespread adoption of WFH in 2020 indicates that WFH has rapidly spread in response to the state of emergency and gained a footing as a new working style, although the rate of WFH workers has been gradually declining. The current situation in which working hours are reduced or work from home is recommended as part of anti-COVID-19 measures seems to anticipate a future in which the reform of working practices is going to be fully established.
Future energy demand of buildings can be predicted by investigating the time-series data of energy consumption of current houses. The housing sector has a large effect on the reduction of energy consumption in the private sector in the global trend of energy saving and decarbonization under the Paris Agreement, and so the prediction of residential energy consumption is an important research issue with a view to realizing carbon-neutral, resilient, and comfortable life as advocated by the government of Japan [18].
Based on these backgrounds, this study conducted a survey on behaviors at home and energy consumption during the pandemic of COVID-19, and analyzed if there were any changes and, if so, the cause thereof. The study aims to investigate working-style changes and energy consumption at home during the pandemic of COVID-19 and explore how to improve the living environment and energy-saving behaviors of residents in the era of a new normal.
2. Materials and Methods
2.1. Study Design
This survey was conducted from 21 to 28 October 2020. The number of samples was set to be 1000 with reference to other questionnaire surveys conducted of households [19,20,21,22]. The resident areas, as well as the ratios of age groups and gender of respondents, were set to be equal. This is to confirm whether the distribution of questionnaire results is biased depending on area, age, or gender. Since it is difficult to identify a household surveyed based on the outcomes, there is no need to consider the handling of personal information in this questionnaire survey. All the participants were given an explanation to the purpose of this questionnaire survey and the use of data and gave consent.
2.2. Questionnaire Survey
The midterm and summer of 2019 and 2020 questionnaire surveys were prepared. Table 1 shows the questions asked. Details of the survey items is indicated by Table A1. The questions survey the behavioral changes investigated at the time when residents wake up, go to work, take a shower or bath, and go to sleep in 2019, May 2020, and August 2020 by minute. Moreover, the hours of use of air-conditioners were also surveyed. These surveys asked respondents if they used an air-conditioner in each month, how often they used an air-conditioner per day, and the hourly time used in 2019 and 2020. The questions on energy consumption were extracted from previous questionnaire surveys. The type of house and attributes of residents, electric appliances, monthly electricity consumption, and attitudes toward energy consumption were asked in multiple-choice or open-ended ways. The questionnaire on the electric appliances asked about the number and size of TVs and refrigerators owned. In addition, the questionnaire asked about the ownership of cooking appliances, such as induction heating (IH) stove, dishwasher, and rice cooker, and investigated the impact of the increased use of cooking appliances by WFH on electricity consumption. The questionnaire on attitudes toward energy consumption asked for reasons for change/no change in monthly electricity consumption in 2020 from 2019 with mandatory descriptions.

Table 1.
Questionnaire items and target months.
2.3. Setting of Target
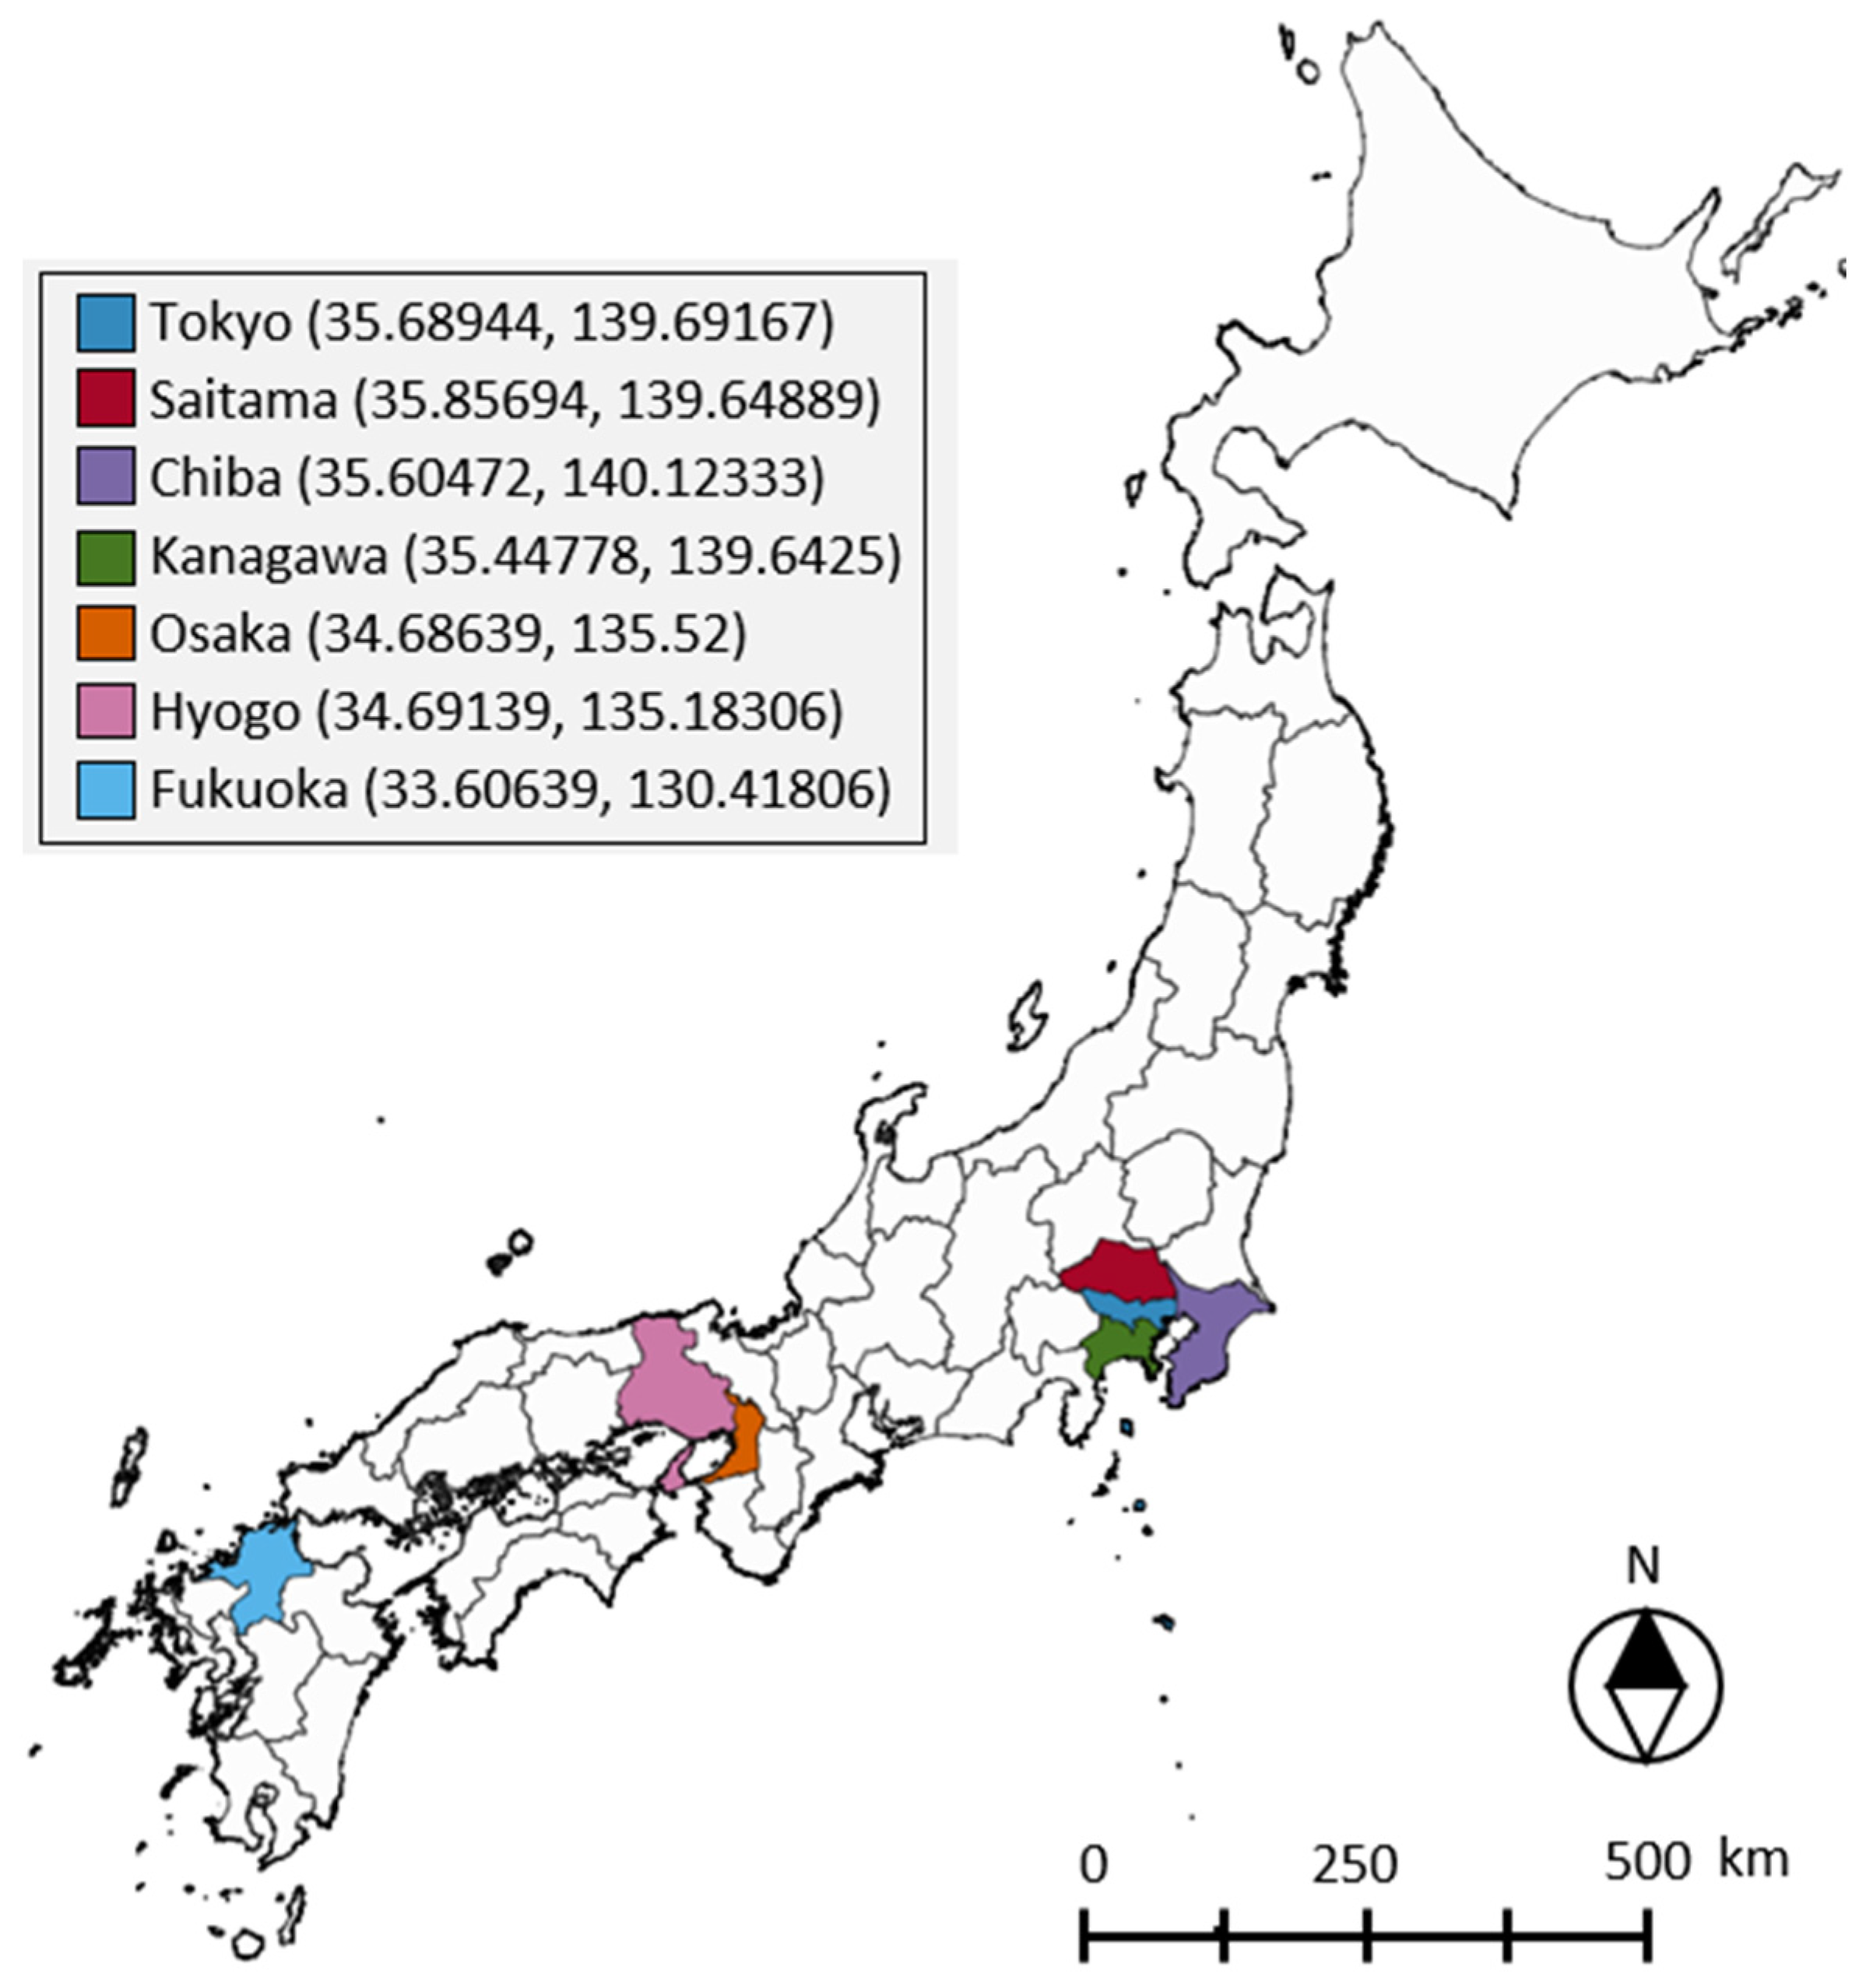
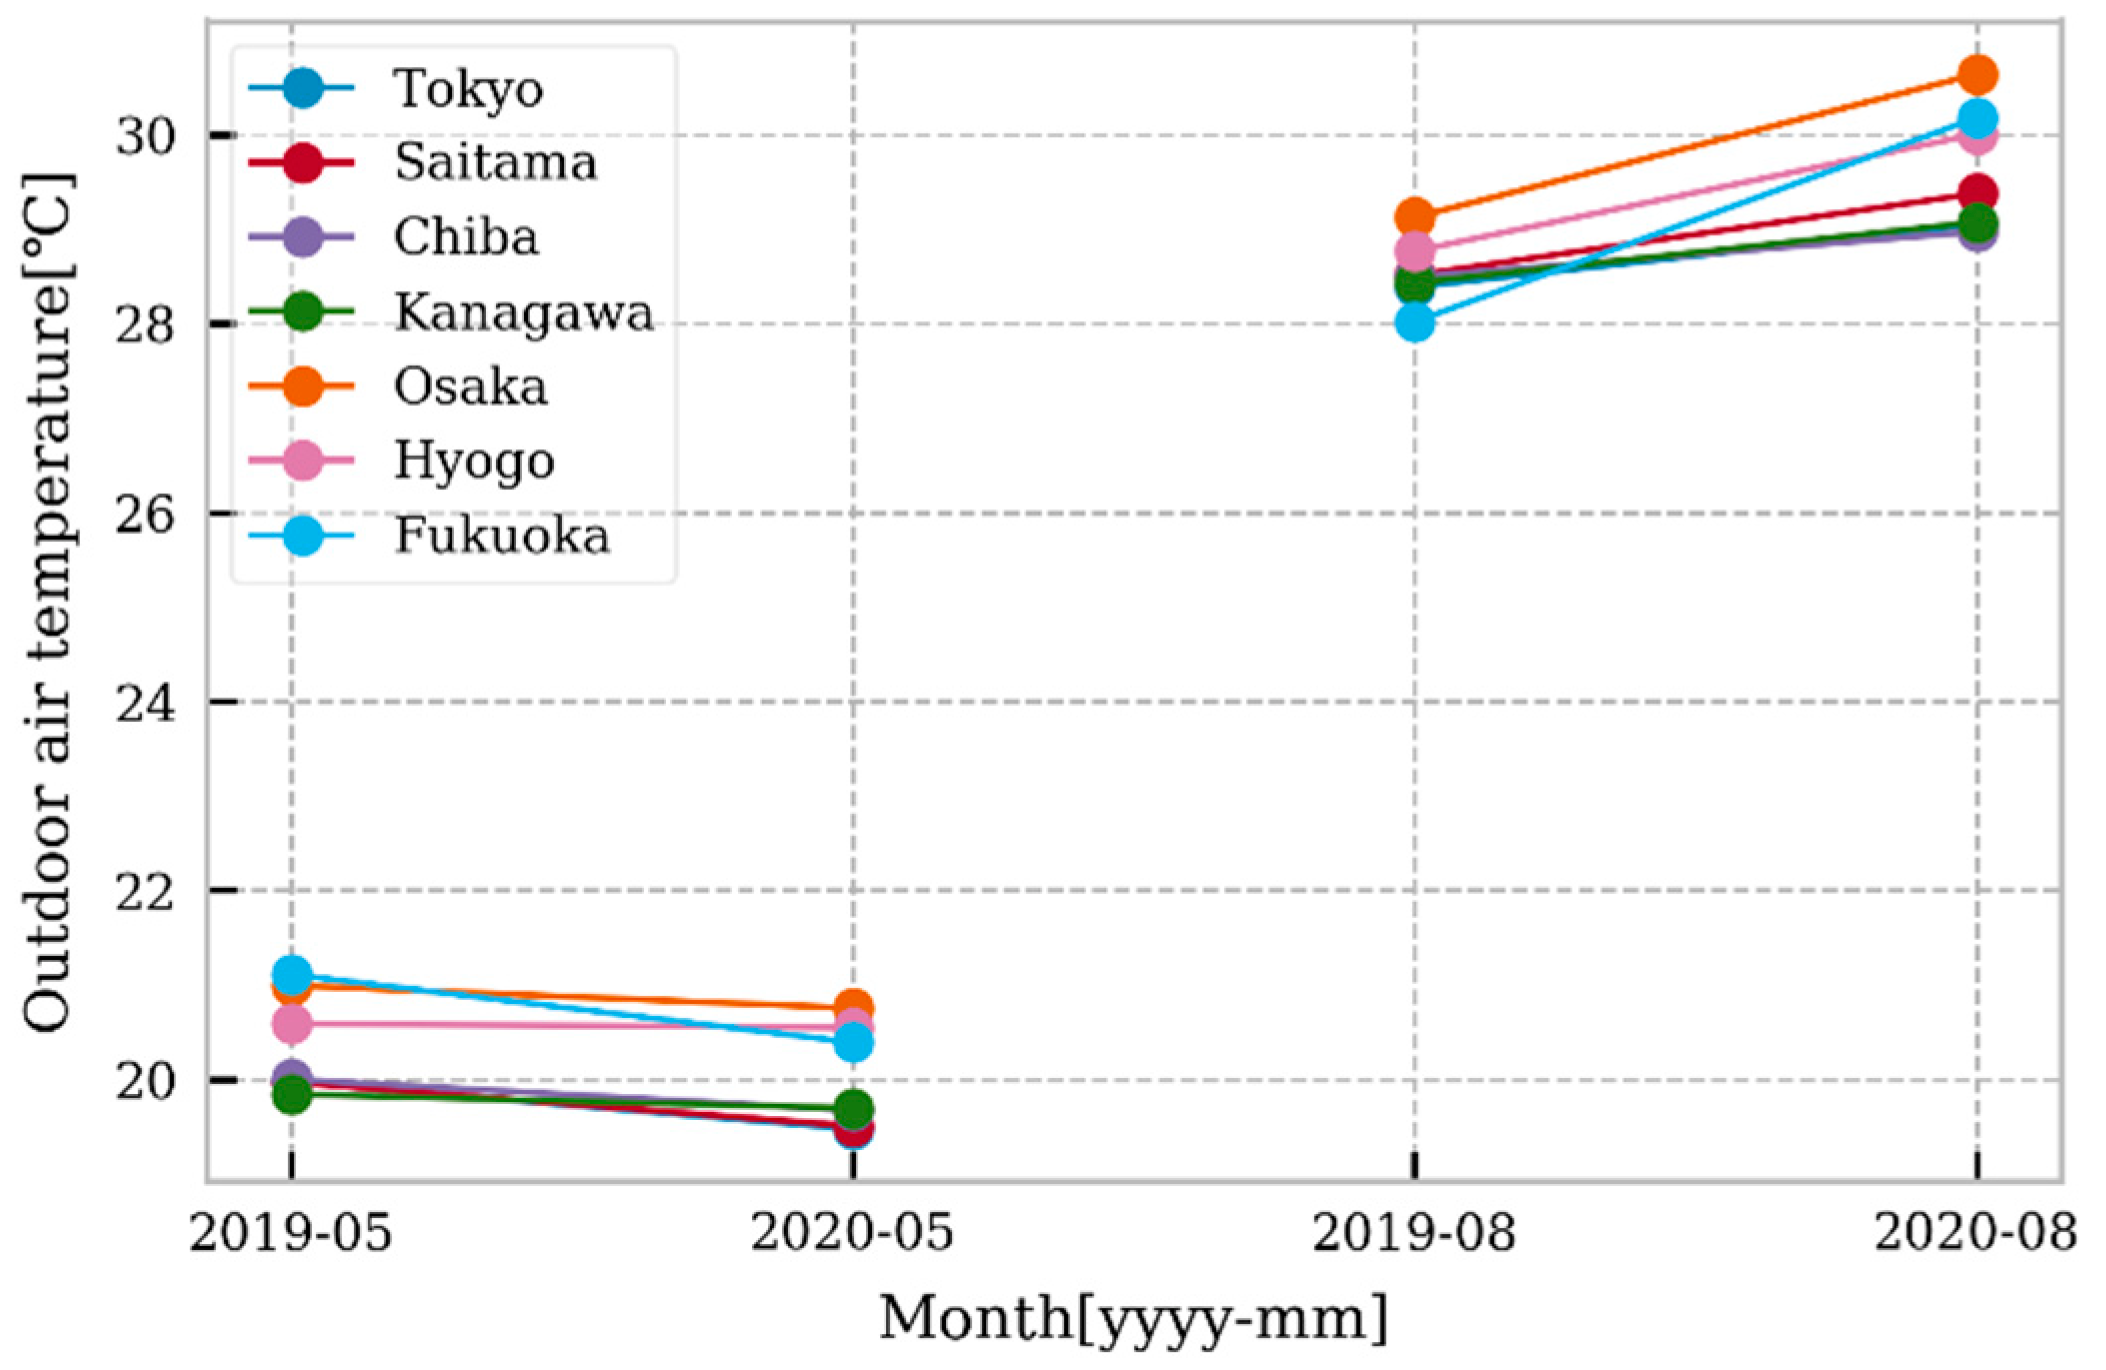
The households that live in the areas subject to the first state of emergency declared in April to May 2020 were surveyed. Figure 1 shows the seven target areas (Tokyo, Saitama, Chiba, Kanagawa, Osaka, Hyogo, and Fukuoka) [23,24]. Latitudinal differences between target area of up to two degrees may cause regional differences in outdoor air temperature. Therefore, considering that residential energy consumption of air-conditioners is greatly affected by outdoor air temperatures, the average temperature of each target area in May as the midterm representative and August as the summer representative of 2019 and that of 2020 were compared (Figure 2) to verify if differences of monthly electricity consumption of each household between 2019 and 2020 were affected by interregional differences. Temperatures greatly vary between areas, since Japan is long from north to south. However, there were not many interregional differences in temperatures. The biggest interregional difference was 1.7 degrees Celsius in August 2020 (between Chiba and Osaka). Therefore, there would be no interregional differences in electricity consumption due to the use of air-conditioners while residents stay at home. Moreover, in the case of Hyogo prefecture, the average outdoor air temperature in May did not change in 2020 compared to the data of 2019, while it decreased in all other areas, with the biggest decrease of 0.7 degrees Celsius registered in Fukuoka. On the other hand, the outdoor air temperatures of August 2020 marked an increase in all areas compared to 2019, with Fukuoka city having the highest (2.2 degrees Celsius) and Chiba prefecture the lowest (0.5 degrees Celsius). The biggest interregional difference of the annual outdoor air temperature difference in August was 1.7 degrees Celsius. Therefore, it is considered that there is no regional difference in the effect of the annual outdoor air temperature difference on residential electricity consumption.

Figure 1.
Target area.
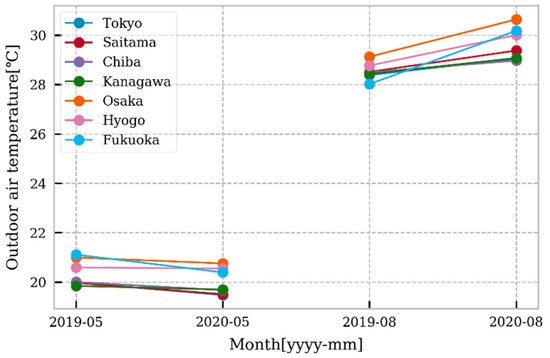
Figure 2.
Average temperature in May and August of 2019 and that of 2020.
The questionnaire survey had some criteria in order to exclude noise in the analysis of impact of WFH on energy consumption. Table 2 shows the criteria for the survey. In addition, the samples of this questionnaire survey were screened under the following criteria.
Table 2.
Criteria for questionnaire survey.
- The monthly electricity consumption is extremely high, exceeding 1000 kWh;
- The respondents worked from home starting in 2019;
- Other erroneous answers (example: there is only one child of compulsory education under 15 years of age).
As a result of the screening, the survey obtained answers from 964 households. Note that this survey asked questions of respondents who had been working from home from April 2020 to August 2020, and so it includes respondents who started WFH at the end of April. Taking into account the government’s request to promote WFH in Japan on April 13 [25], the impact of telecommuting on midterm electricity consumption was analyzed in the May questionnaire, and not in the April one.
2.4. Data Analysis and Statistical Hypothesis Test
This study analyzed samples and investigated changes in daily schedules and energy consumption of residents due to WFH. As for daily schedules, the time when respondents and their families woke up, went to work, came back from work, took a bath, and went to sleep were compared in 2019 and 2020. In addition, electricity consumption in May and August 2020 was compared to that in the same months of 2019.
The relationship between the increase in the monthly electricity consumption and the questions asked in the questionnaire survey was analyzed based on a hypothesis test using the chi-square test or unpaired t-test. The samples were divided into a group of households whose monthly electricity consumption increased and a group of households whose monthly electricity consumption did not increase to see if there was a significant difference of variables between the groups. All p-values were two-sided, and two-sided p-values less than 0.05 were considered statistically significant.
3. Results
3.1. Ratio of Major Attributes of Samples
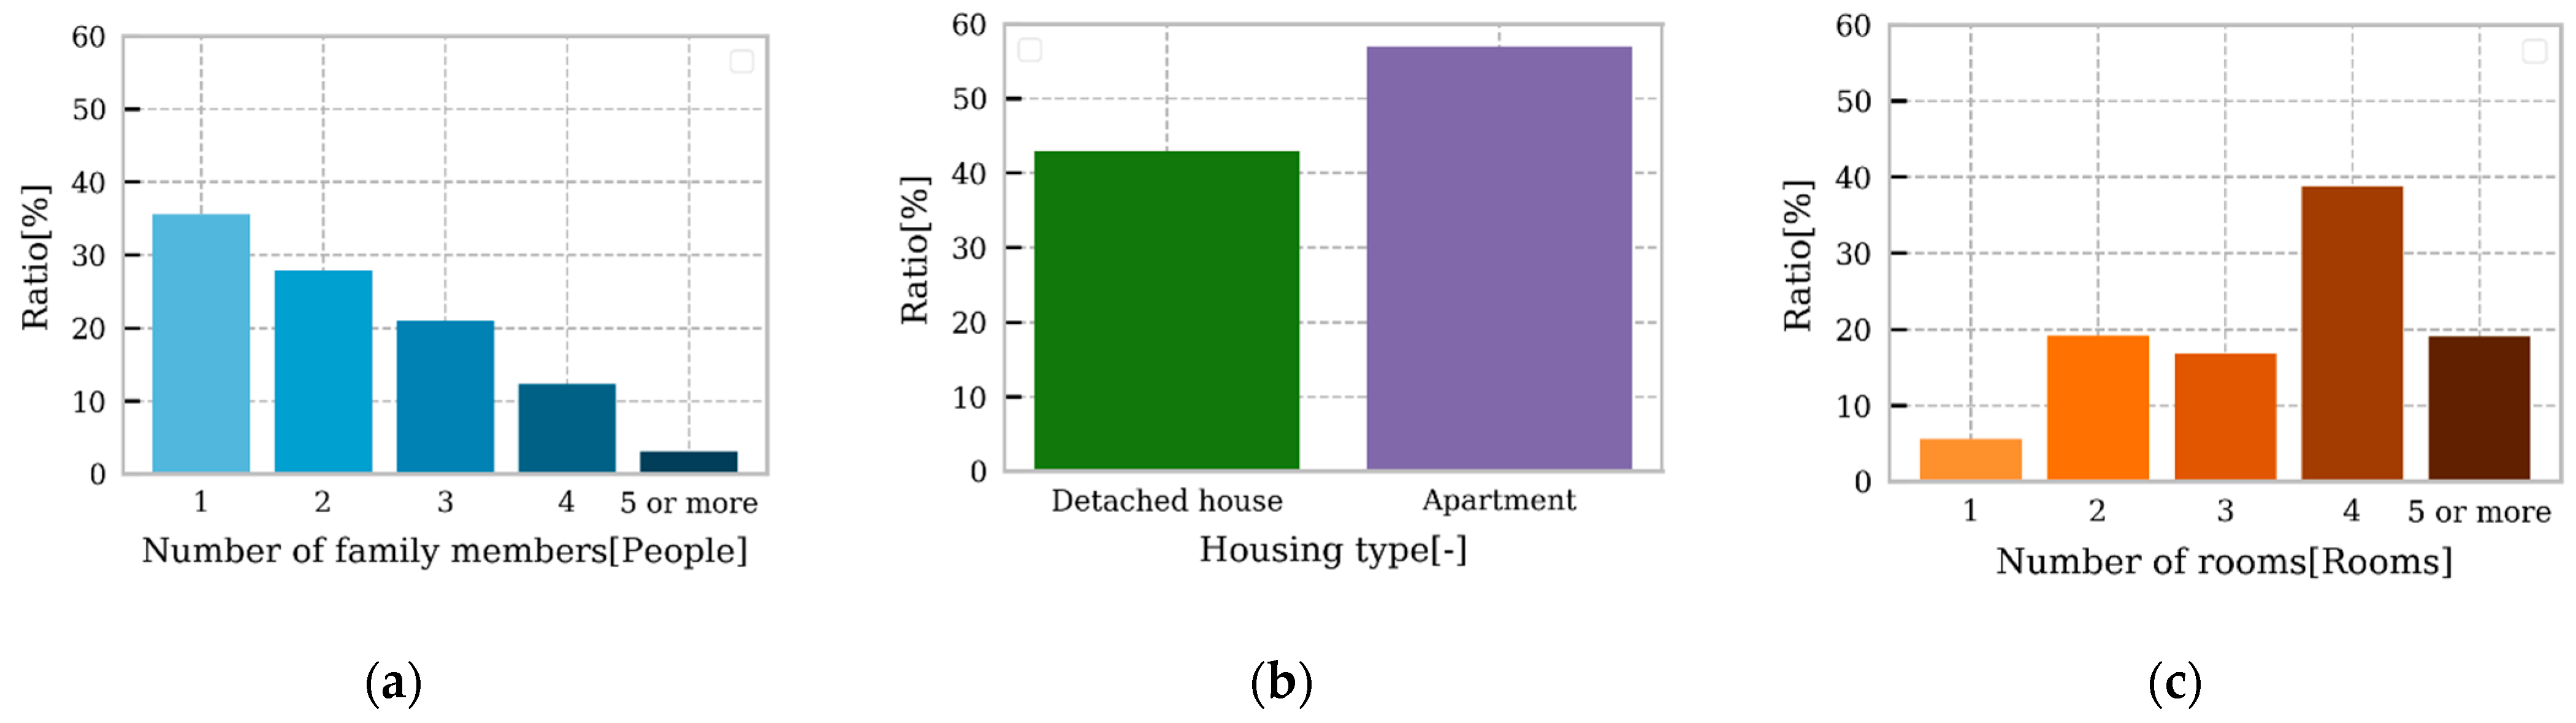
Figure 3a–c shows the ratio of major attributes of the samples. No extreme concentration or bias of data was observed in each attribute.
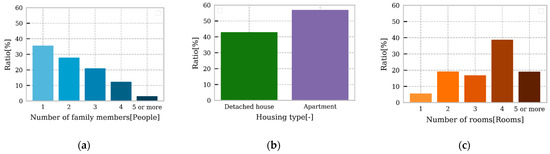
Figure 3.
Ratio of major attributes of the samples. (a) Number of family members; (b) housing type; (c) number of rooms.
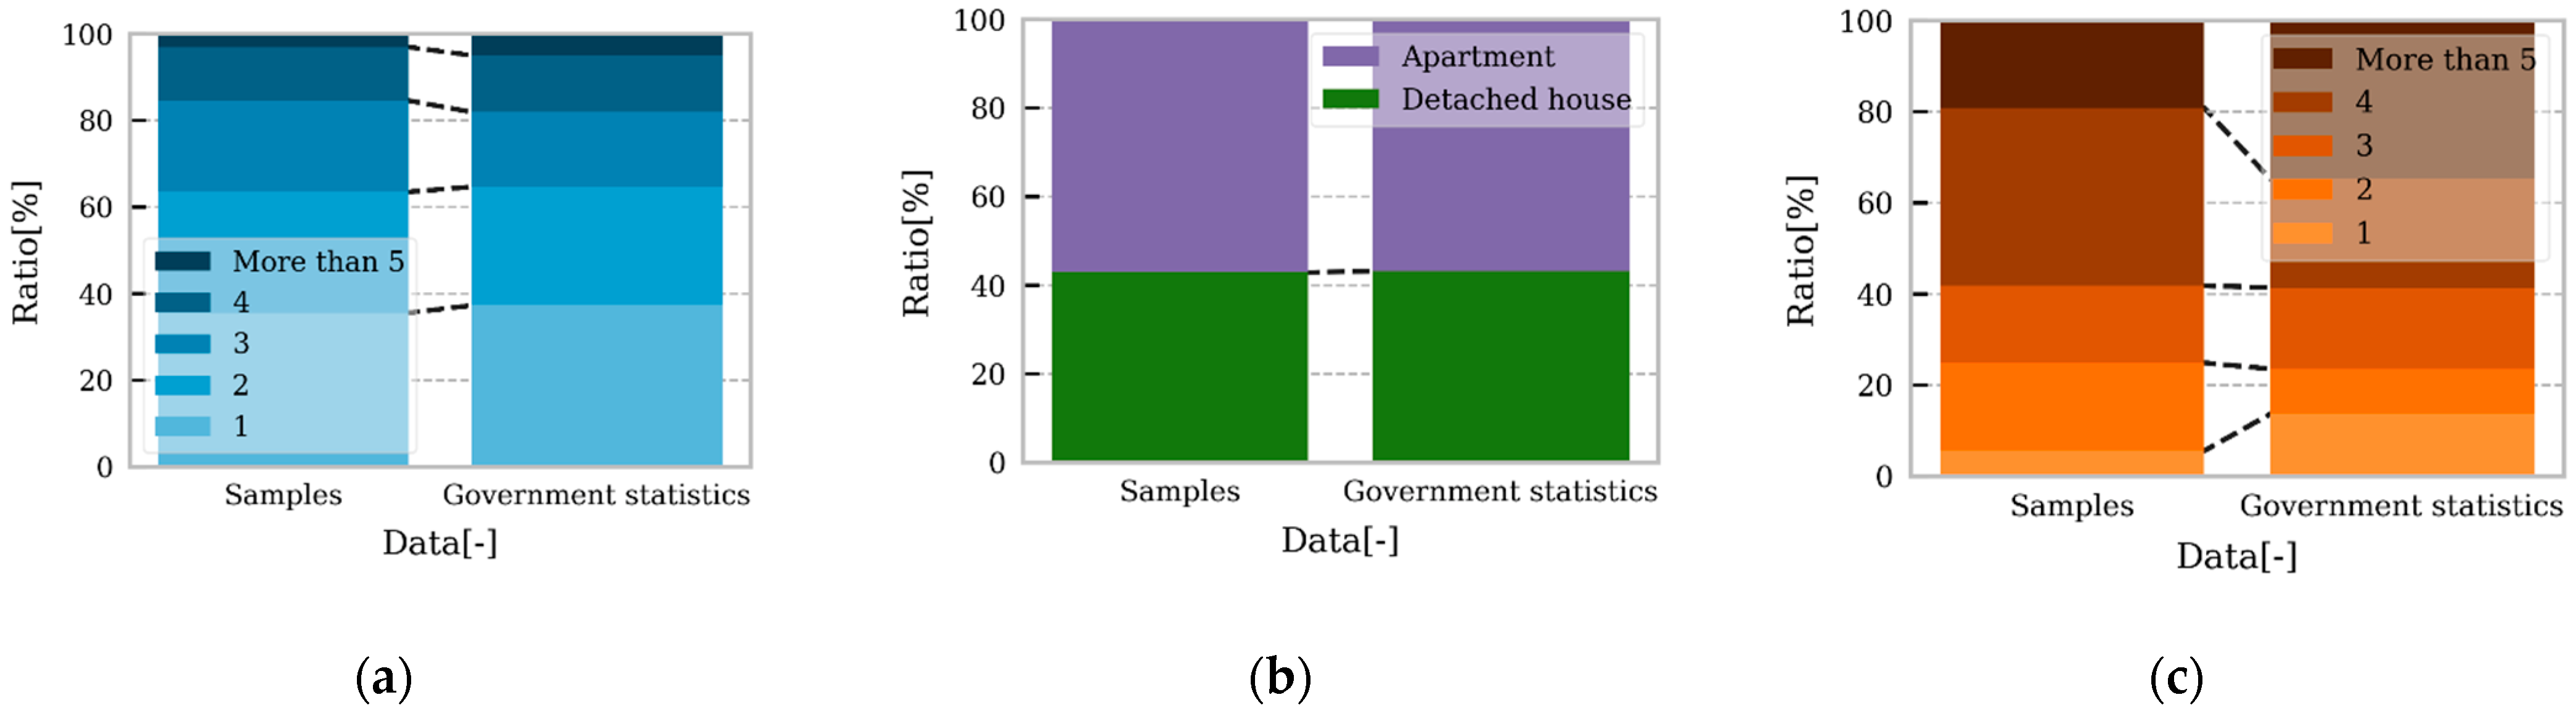
The number of households by the number of family members and housing type have national data issued by the Census and Statistics Department [26,27]. Thus, this study compared that data with the total value of samples (Figure 4a,b). There was not any deviation from the national distribution in terms of the number of family members and housing type. On the other hand, the number of rooms of the samples had deviations from the national distribution in all but three rooms. These results indicate that the samples are typical households in the survey areas in terms of the number of family members and housing type. However, the results of the analysis on the number of rooms in this survey may differ from those of a typical household in the survey area.
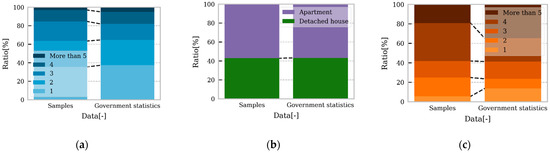
Figure 4.
Comparison of the ratio between samples and government statistics. (a) Number of family members; (b) housing type; (c) number of rooms.
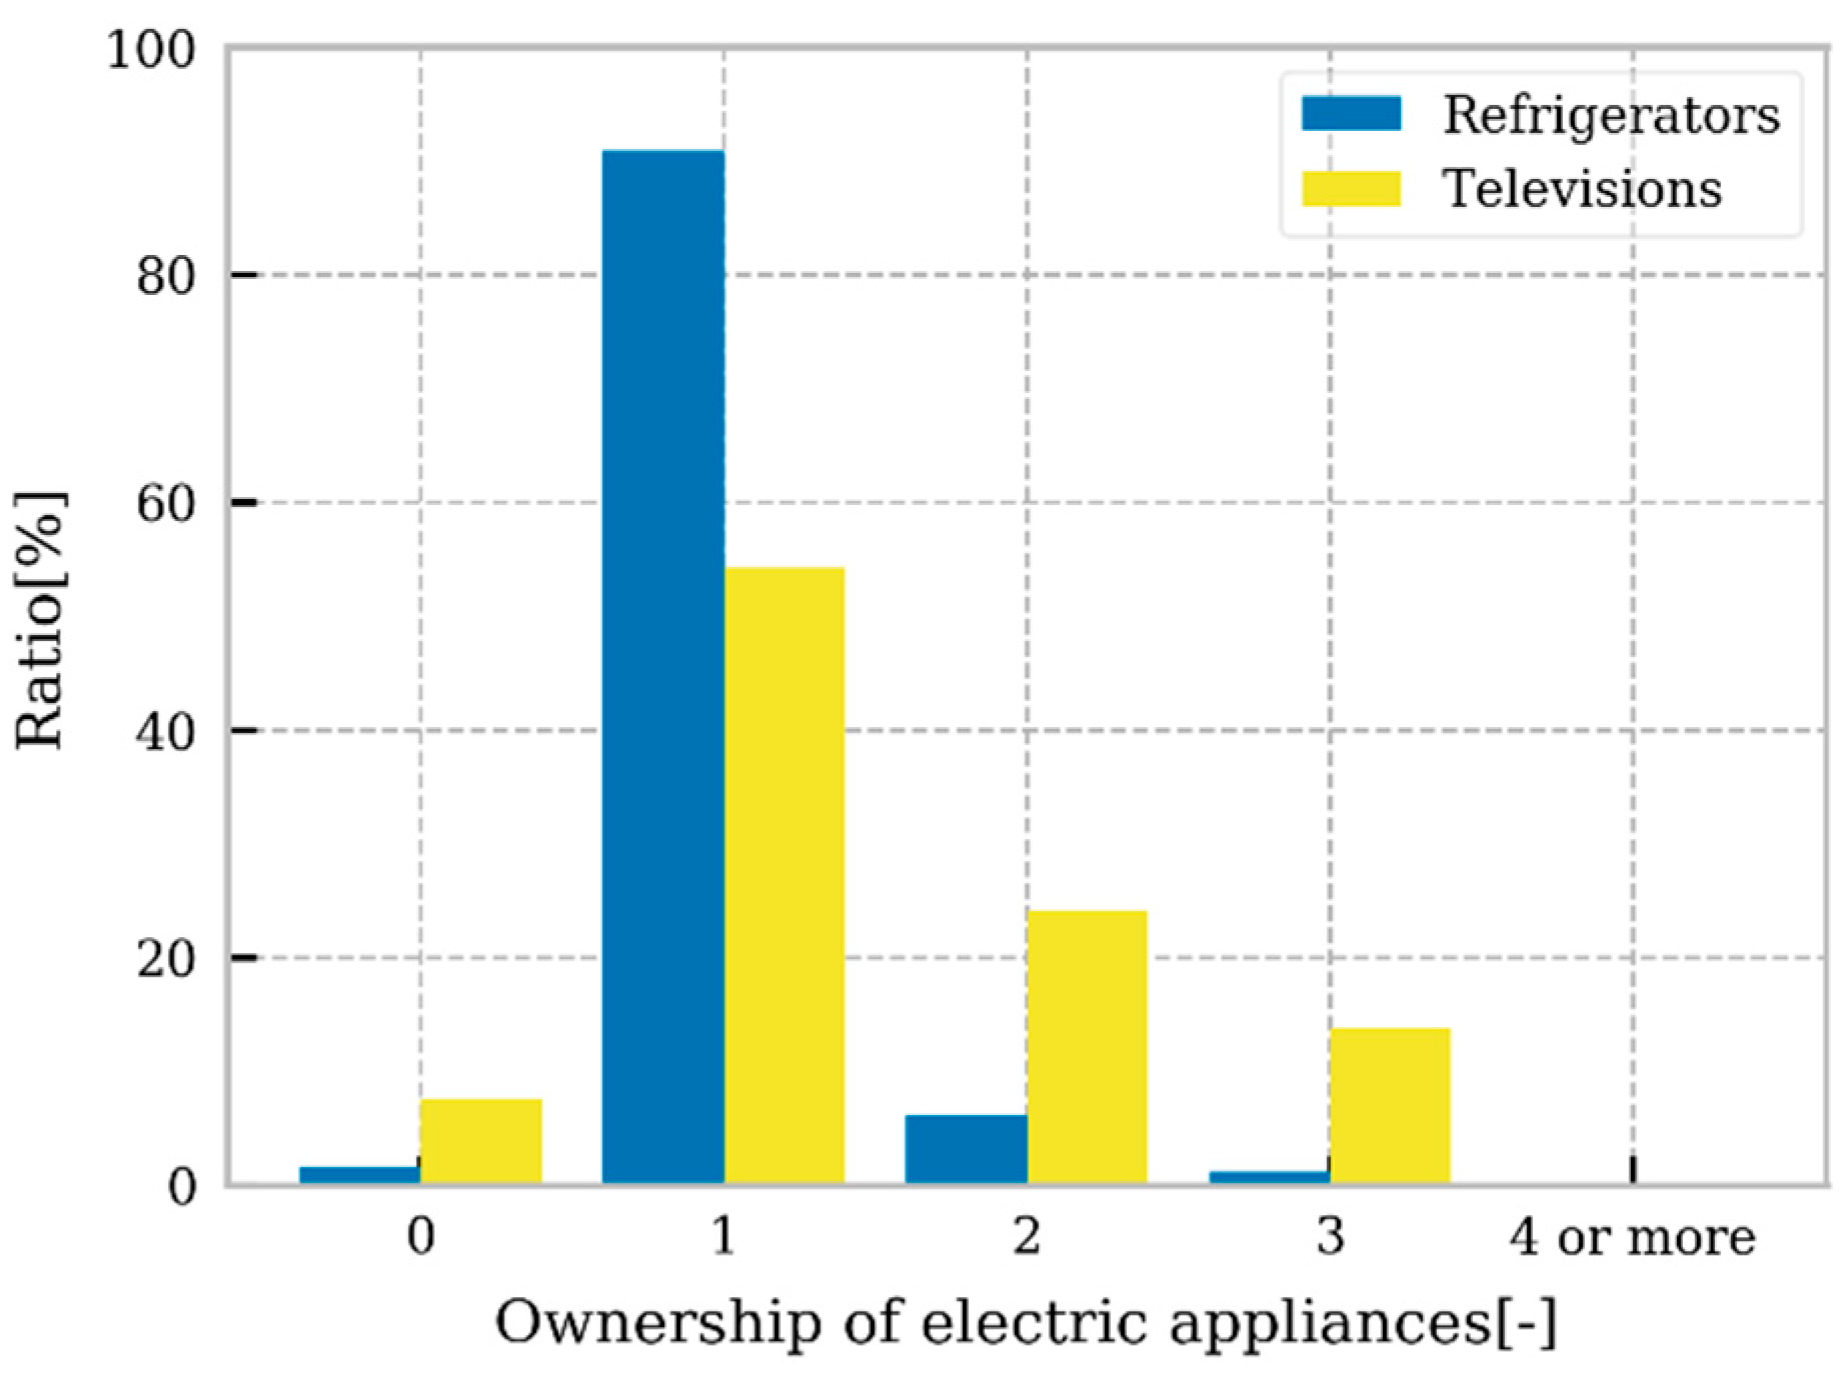
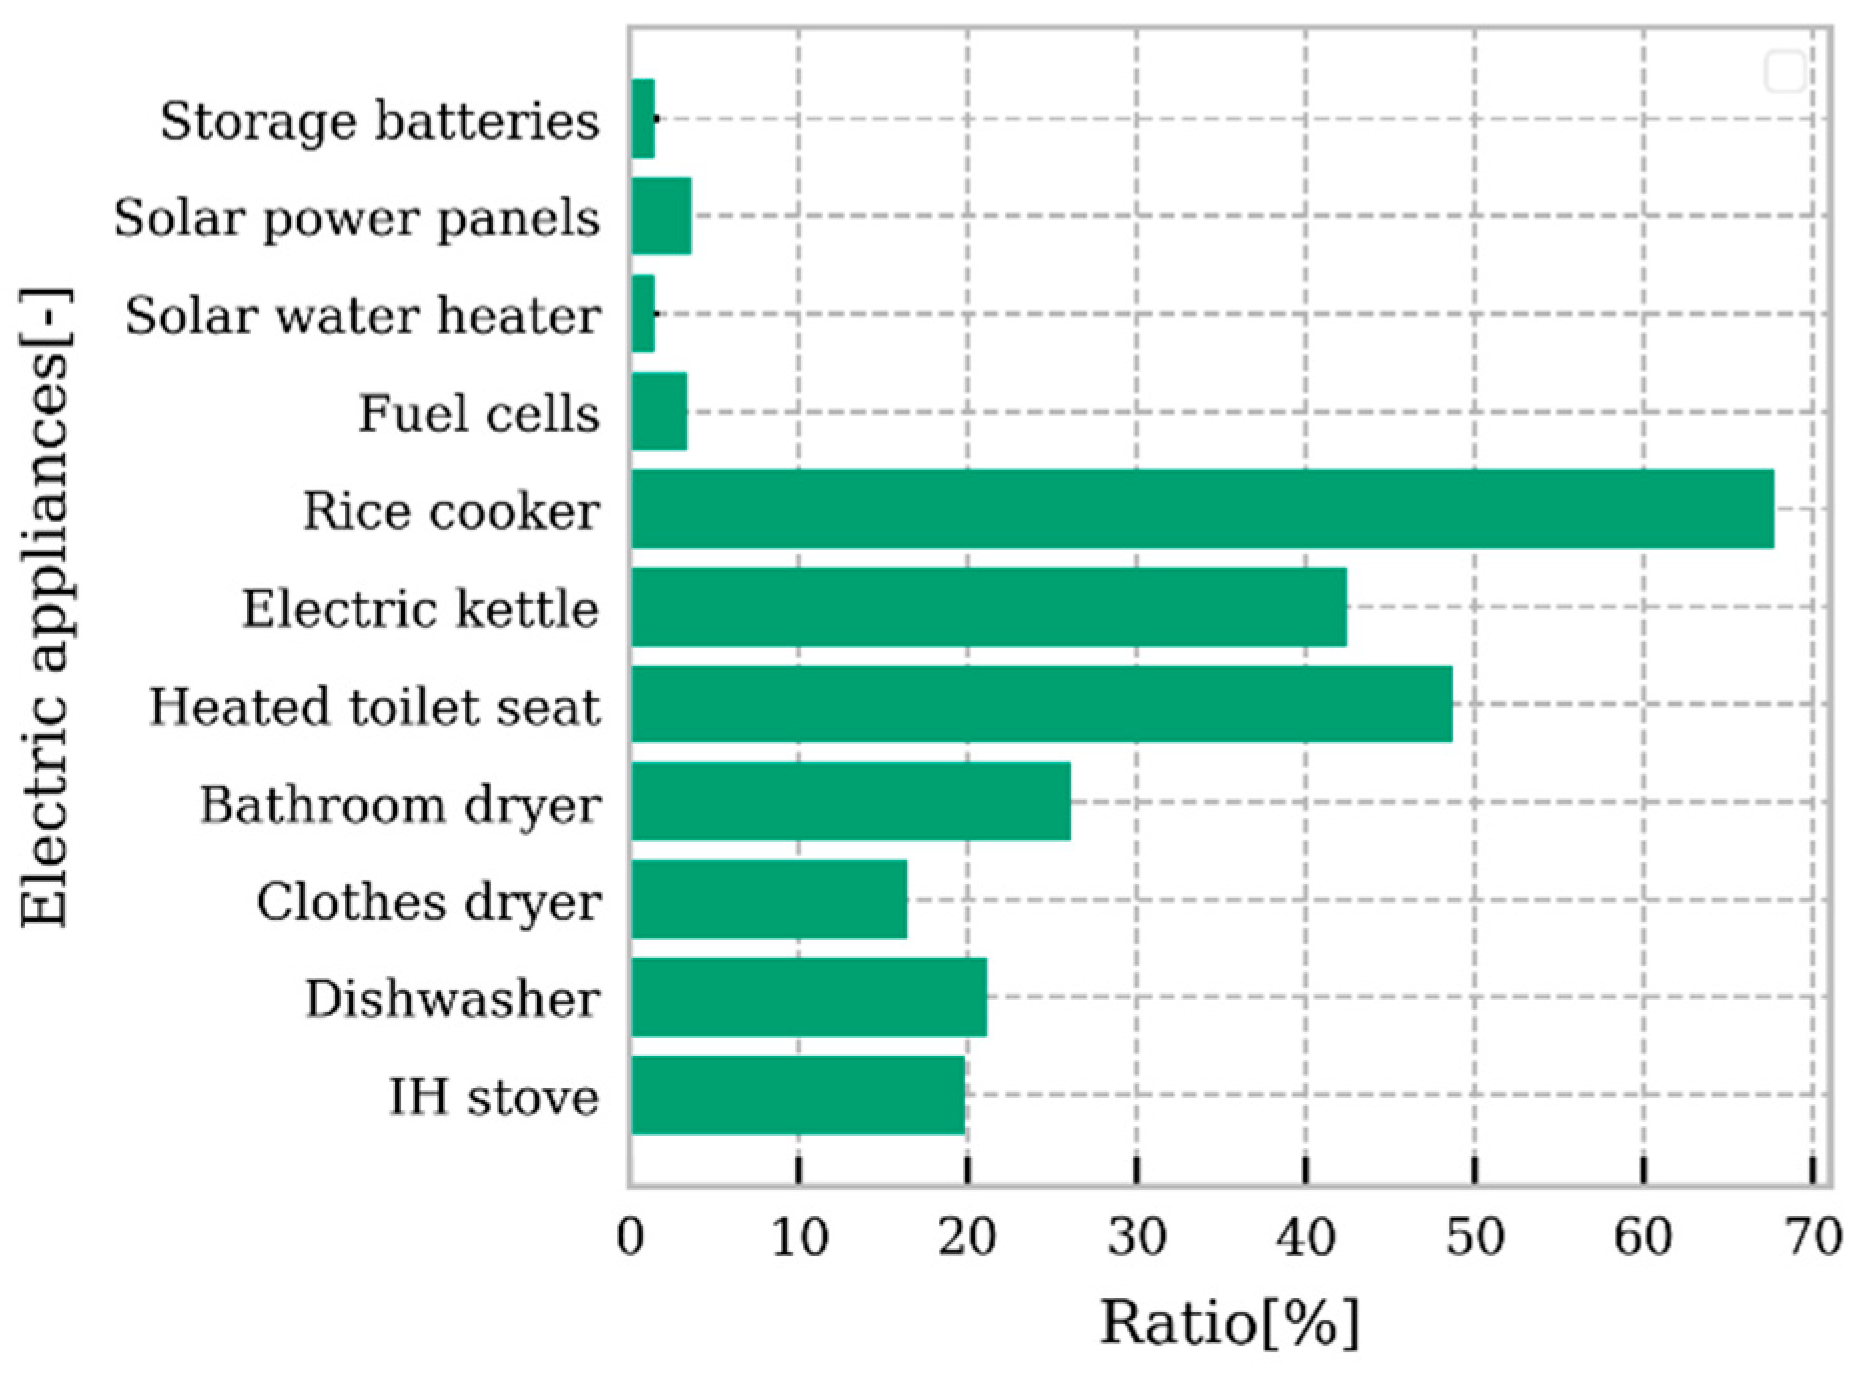
The ratio of ownership of electric appliances is shown in Figure 5 and Figure 6. Most households surveyed own one or more refrigerators or televisions, accounting for more than 90% of households. Furthermore, 48.6% of households own heated toilet seats which annually consume much electricity following refrigerators, illumination, TVs, and air-conditioners. Overall, 20.4% of households use an IH stove for cooking, and a total of 4.9% of households have introduced renewable energy, such as solar-powered water heaters and solar panels.
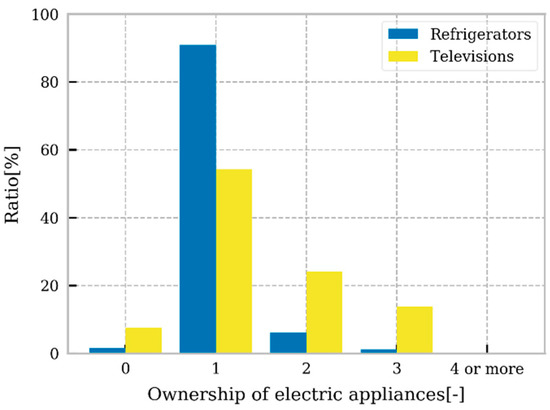
Figure 5.
Breakdown of the number of refrigerators and televisions owned by the sample.

Figure 6.
Ratio of ownership of electric appliances in the sample.
3.2. Changes in Daily Schedules of Residents
This section compared the time when the respondent of each household woke up, took a shower or bath, and went to bed between May 2019 and May 2020. Figure 7 shows the ratios of respondents who answered that their daily schedules changed by plus or minus 30 min in WFH workers. About 60% of respondents answered that their wake-up time changed by more than 30 min, and more than 40% answered that they woke up more than 1 h later than 2019. More than 50% of respondents answered that the time they took a bath changed by more than 30 min. More respondents answered that they took a bath earlier than 2019 compared to those who answered that they took a bath later than 2019. On the other hand, there was no significant change in bedtime compared to the wake-up or bathing time. More than 70% of respondents went to sleep at almost the same hour as 2019. In addition, 21.5% of respondents marked an increase of more than 30 min in sleeping hours compared to the year 2019.
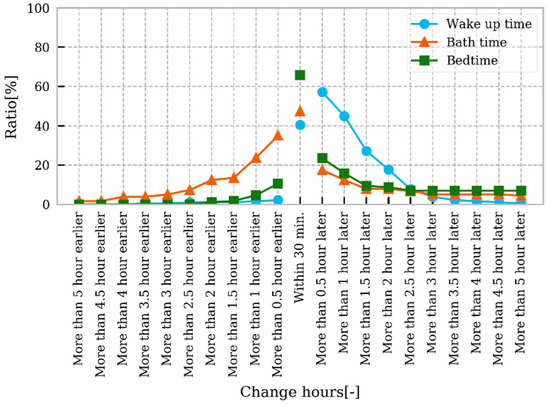
Figure 7.
Ratios of respondents who answered that their daily schedules changed in WFH workers.
This section also compared the time when the respondents’ family members woke up, took a shower or bath, and went to sleep between May 2019 and May 2020. The results were categorized by age group (youth: under 18 years old; productive age: 18~65 years old; elderly; over 65 years old). Figure 8a–c shows the ratios of respondents who answered that their daily schedules changed by plus or minus 30 min in WFH workers’ family members. The time when about 20% of youths and productive age woke up, took a bath, or went to sleep changed. The youth group seems to indicate that their living environments changed due to advancement to higher-level education and for other reasons, in addition to the influence of a family WFH worker. However, most of the family members of elderly people did not change their schedules.
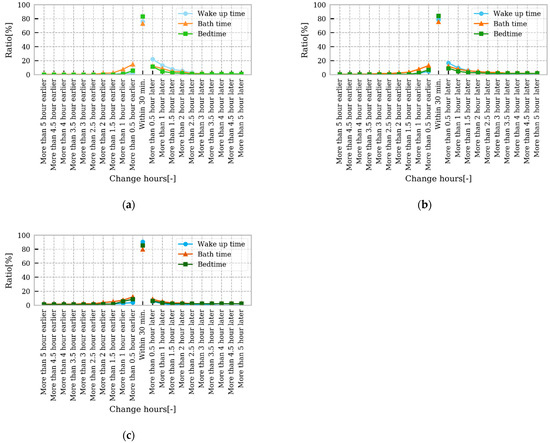
Figure 8.
Ratios of respondents who answered that their daily schedules changed in WFH workers’ family members. (a) Youth; (b) productive age; (c) elderly.
3.3. Changes in the Use of Air-Conditioners
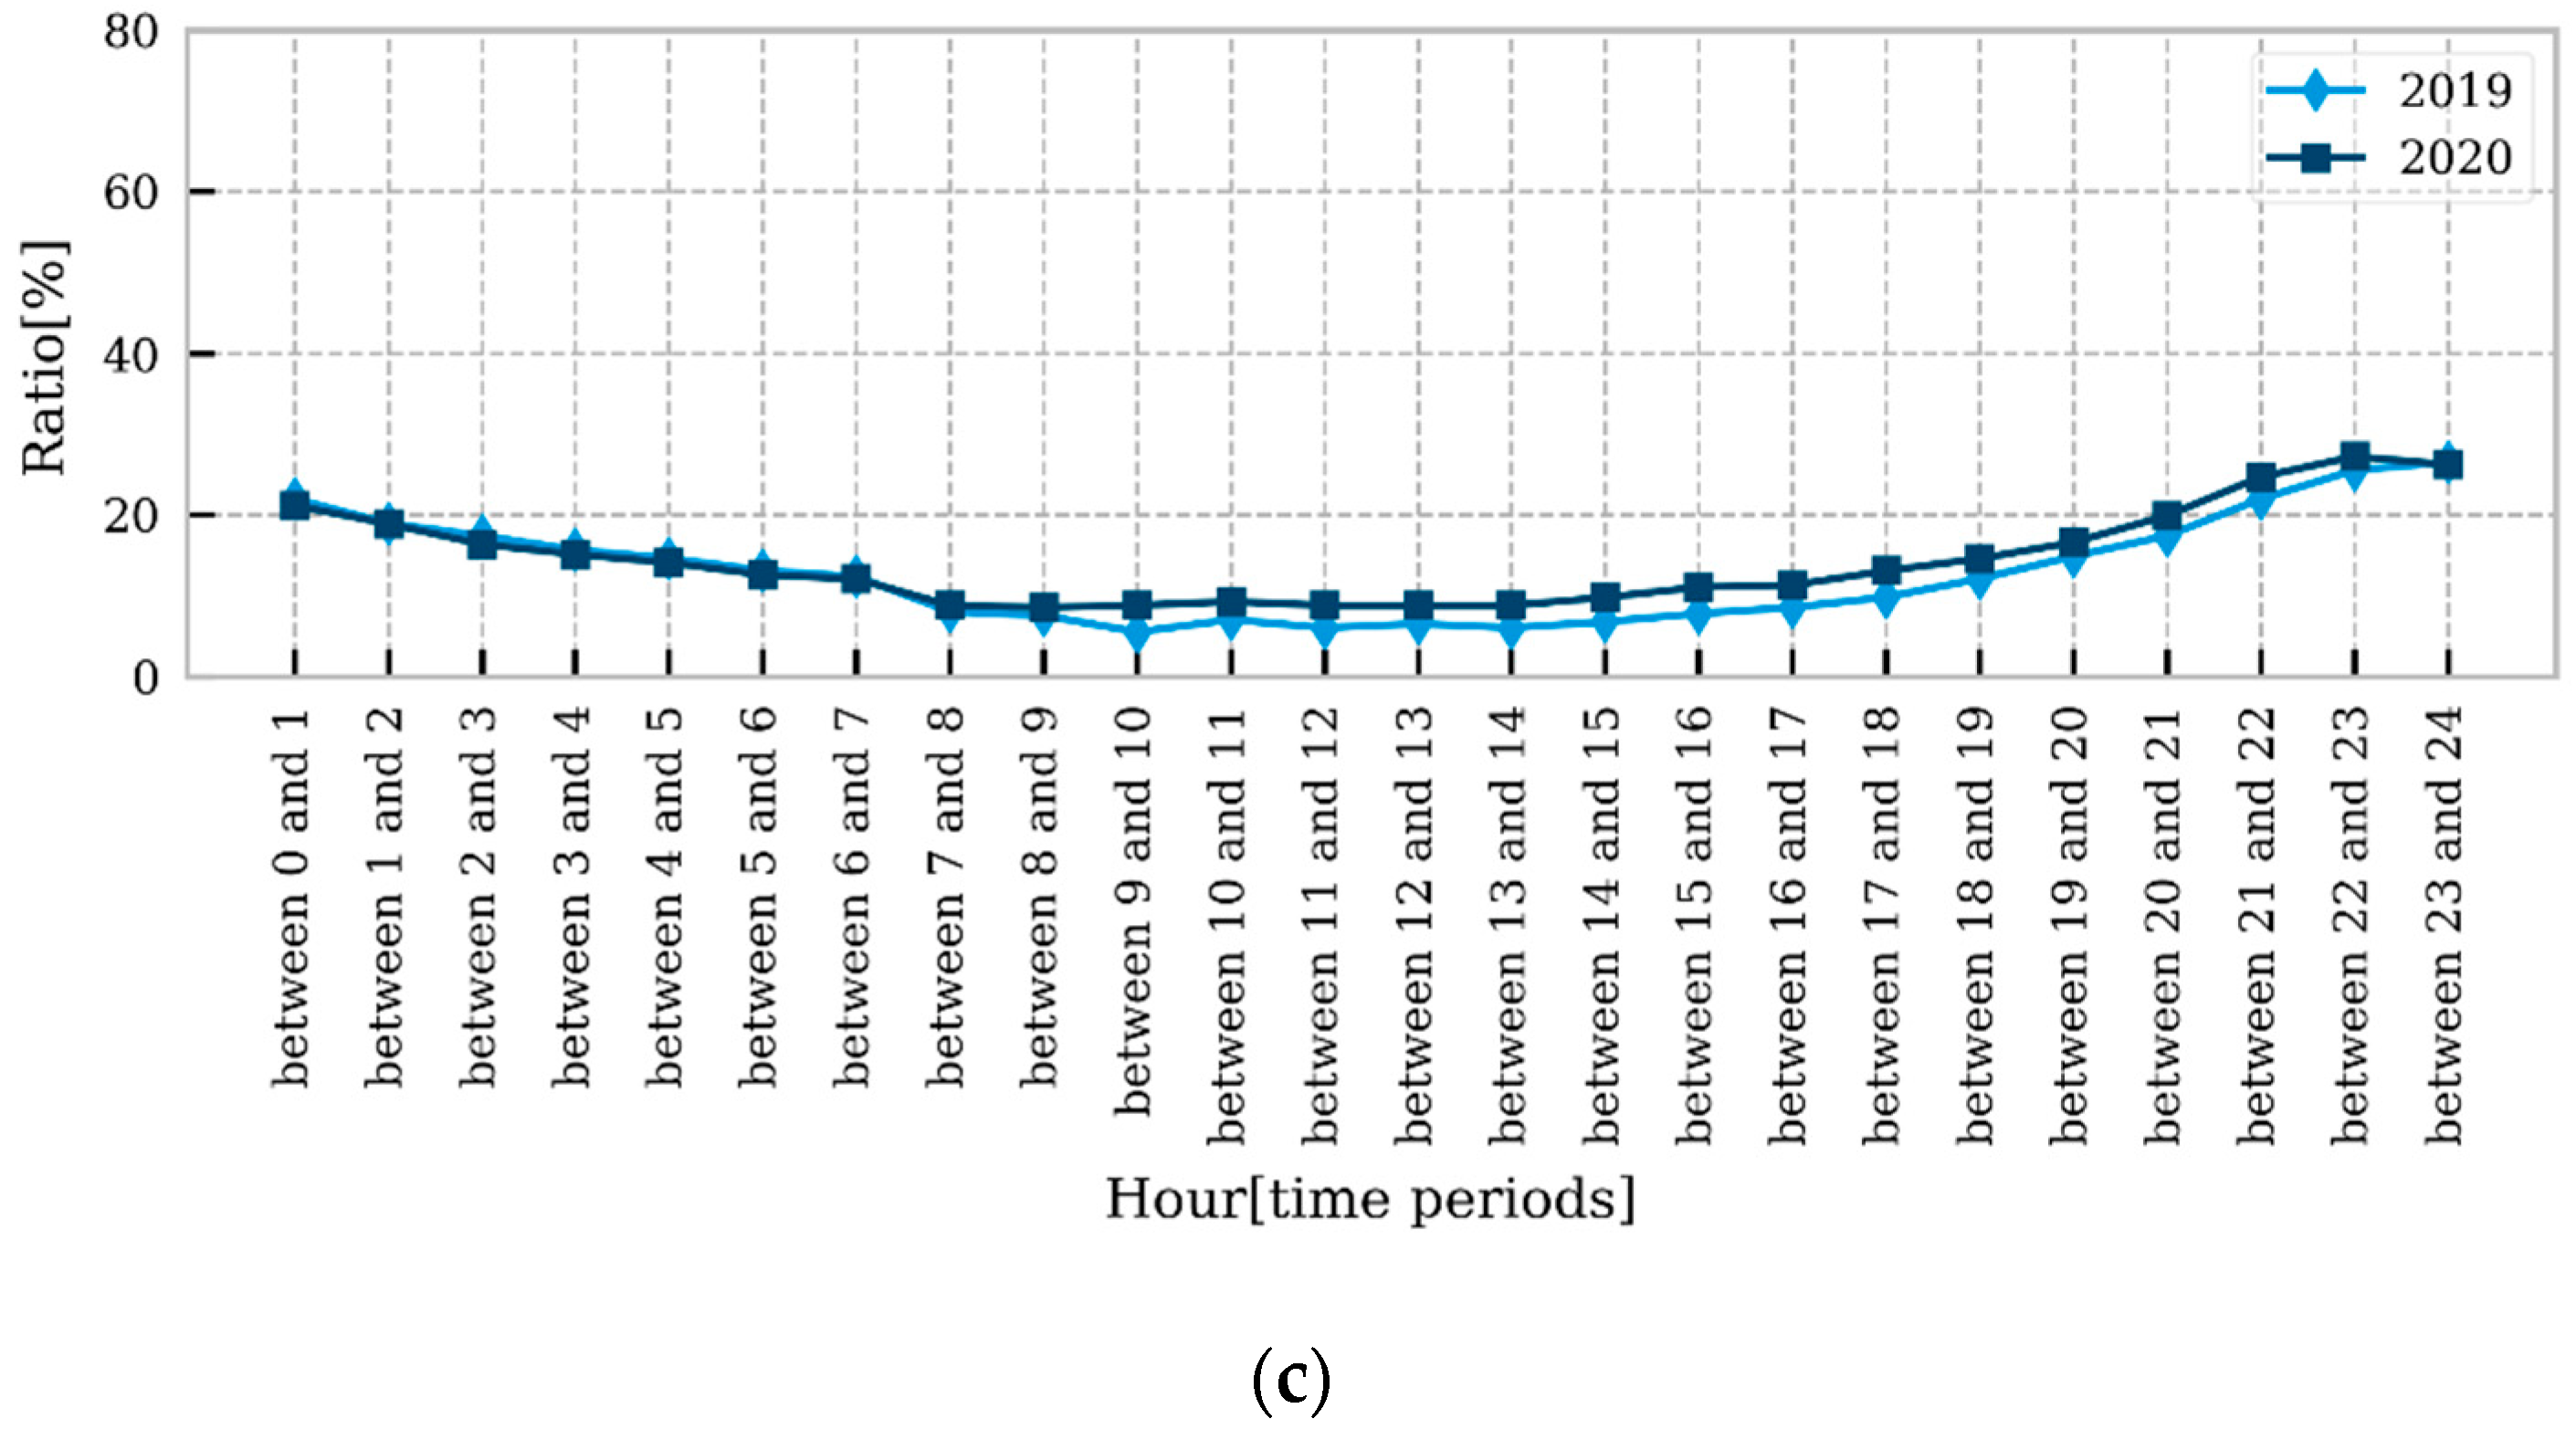
In the previous section, it was revealed that WFH may affect the daily schedules of workers. Therefore, this section analyzed a change of the use of air-conditioners in summer due to WFH. If each room (living room/kitchen, bedroom/study room, and children’s room) has an air-conditioner, the time zone of the air-conditioner used on weekdays was compared in 2019 and 2020. It should be noted that houses without air-conditioners were excluded. Figure 9 shows the comparison of the ratio of households using air conditioning in the rooms and indicates no significant difference between 2019 and 2020. On the other hand, the comparison of the hourly ratio of households that used air-conditioners on weekdays in 2019 and 2020 (Figure 10a–c) indicated that the ratio of households that used air-conditioners increased between 8:00 AM and 6:00 PM in all rooms, and the average increase rate was 8.6% for the living room/kitchen, 4.2% for the bedroom/study room, and 2.6% for the children’s room.
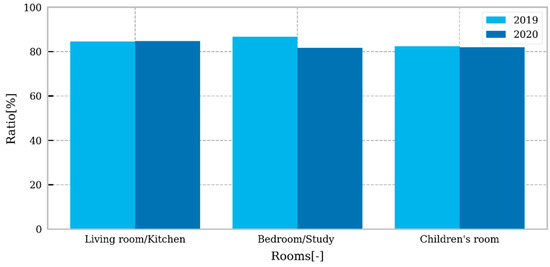
Figure 9.
Ratio of households that used air-conditioners in the major rooms in August of 2019 and that of 2020.
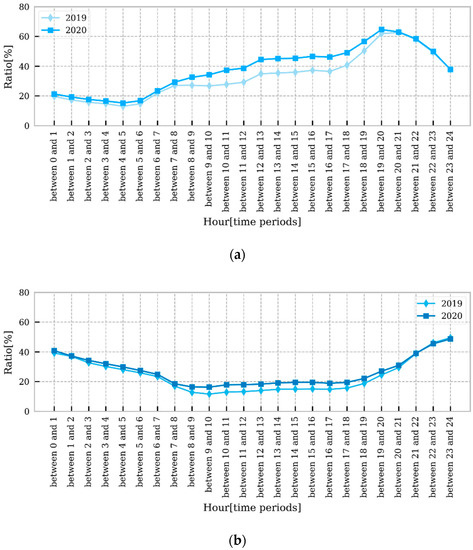
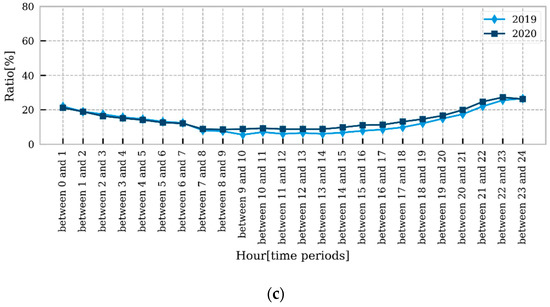
Figure 10.
Hourly ratio of households that used air-conditioners on weekdays in August of 2019 and that of 2020. (a) Living room/kitchen; (b) bedroom/study; (c) children’s room.
3.4. Changes in Energy Consumption
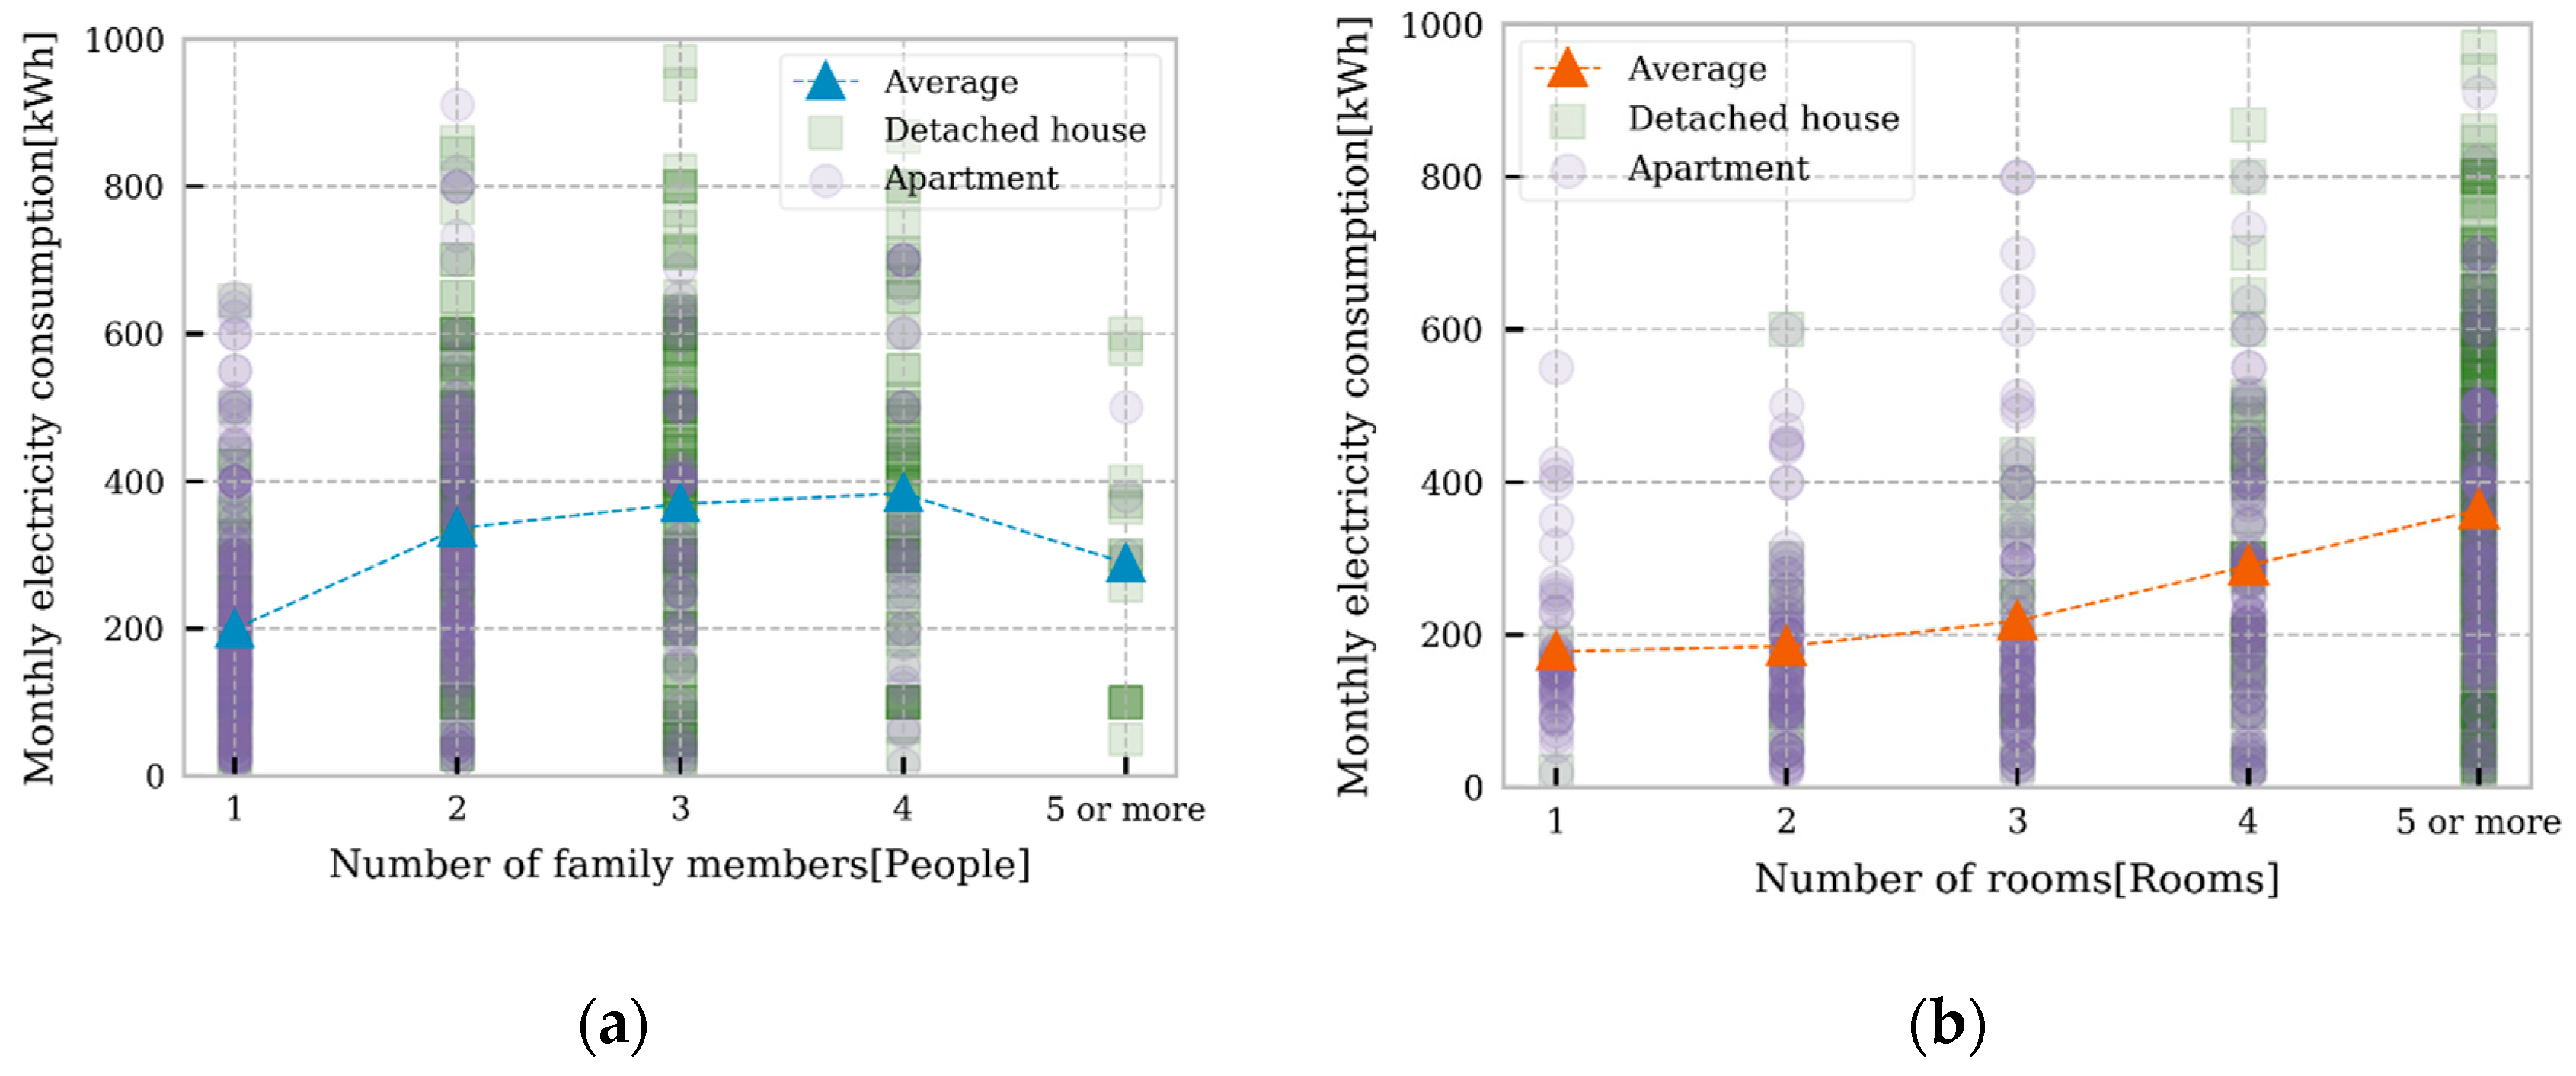
This section analyzed electricity consumption of each household in May when the state of emergency was in force and in August when energy consumption was expected to increase due to the use of air-conditioners when many residents were working from home. A base analysis plotted electricity consumption of sample households in August by the number of family members (a household with five or more members is categorized into “5 or more”) and by the number of rooms (living room and dining kitchen are counted separately as one room, and a house with five rooms or more is categorized into “5 or more”) (Figure 11a,b). The results indicated that electricity consumption simply increased as the number of rooms increased. This increase is thought to be influenced by the increase in the number of lighting and air conditioning systems in the house due to the increase in the number of rooms. On the other hand, the result of the number of family members shows that four-person households have the highest average electricity consumption and the average electricity consumption of households with five or more people is lower than that of four-person households. This can be attributed in part to the spread of solar power generation and energy-saving home appliances. It is conceivable that the increase in the number of households accompanied by an increase in the number of people in the household may have facilitated the installation of high-efficiency home appliances and solar power equipment.
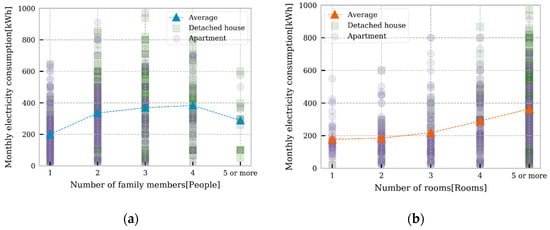
Figure 11.
Electricity consumption of sample households in August 2020. (a) Number of family members; (b) number of rooms.
Electricity consumption of each household in May and August was analyzed to extract the households whose electricity consumption had increased from 2019 to 2020 (Figure 12). More than a quarter of the samples (about 250 households or more) marked an increase of electricity consumption by more than 5% in May and August, while more than 10% (about 100 households or more) marked an increase more than 20% in May and August. Moreover, 40~50% of households answered that they were not aware of the reason for this increase or realized it for the first time at the time of responding to the questionnaire survey.
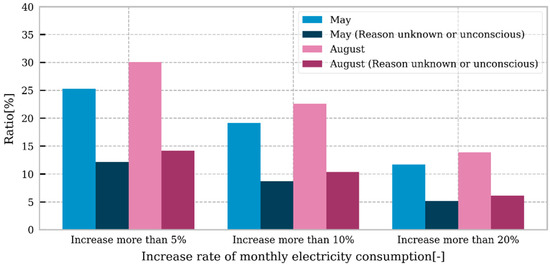
Figure 12.
Ratio of households that increased monthly electricity consumption in 2020 compared to the previous year.
3.5. Comparison of Attributes between Groups of Households Whose Consumption of Electric Power Increased and Did Not Increase
In order to analyze factors of the increase in electricity consumption, the households were divided into a group of households whose electricity consumption increased by more than 5% (hereinafter “increase group”) and a group of other households whose electricity consumption did not increase (“non-increase group”), and each item surveyed was compared and validated. Figure 13a,b shows the comparison of the ratios of the number of rooms and the number of family members in each group as the principal items. As a result of conducting chi-square tests, no significant differences were found between the two groups in May and August.
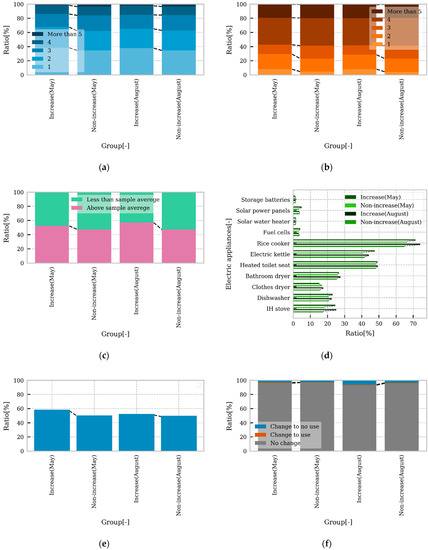
Figure 13.
Comparison of surveyed items between increase group and non-increase group. (a) Ratio of number of family members; (b) ratio of number of rooms; (c) ratio of high consumption/small consumption households of monthly electricity consumption in 2019; (d) ratio of ownership of electric appliances; (e) ratio of family members who are at home during the day in each household; (f) ratio of the change in air-conditioner use.
Moreover, Figure 13c,d compares such items as the ratio of high consumption/small consumption households in monthly electricity consumption in 2019 and the ownership of house appliances for cooking and toilets including IH stoves, rice cookers, and heated toilet seats, but there were no significant differences between the increase group and the non-increase group in these items. Especially for the cooking appliances such as IH stove, dishwasher, and rice cooker, since there were no significant differences between the groups, this survey did not show the impact of the increased use of cooking appliances by WFH on monthly electricity consumption. Furthermore, Figure 13e,f shows the comparison of differences in such items as the ratio of households whose residents are at home and the number of days in which air-conditioners were used in each household by month in 2019 and 2020. The results indicated in these figures demonstrate that there are no significant differences between the two groups in terms of the ratio of households in which the number of residents who stayed at home during the day and the number of days in which air-conditioners were used.
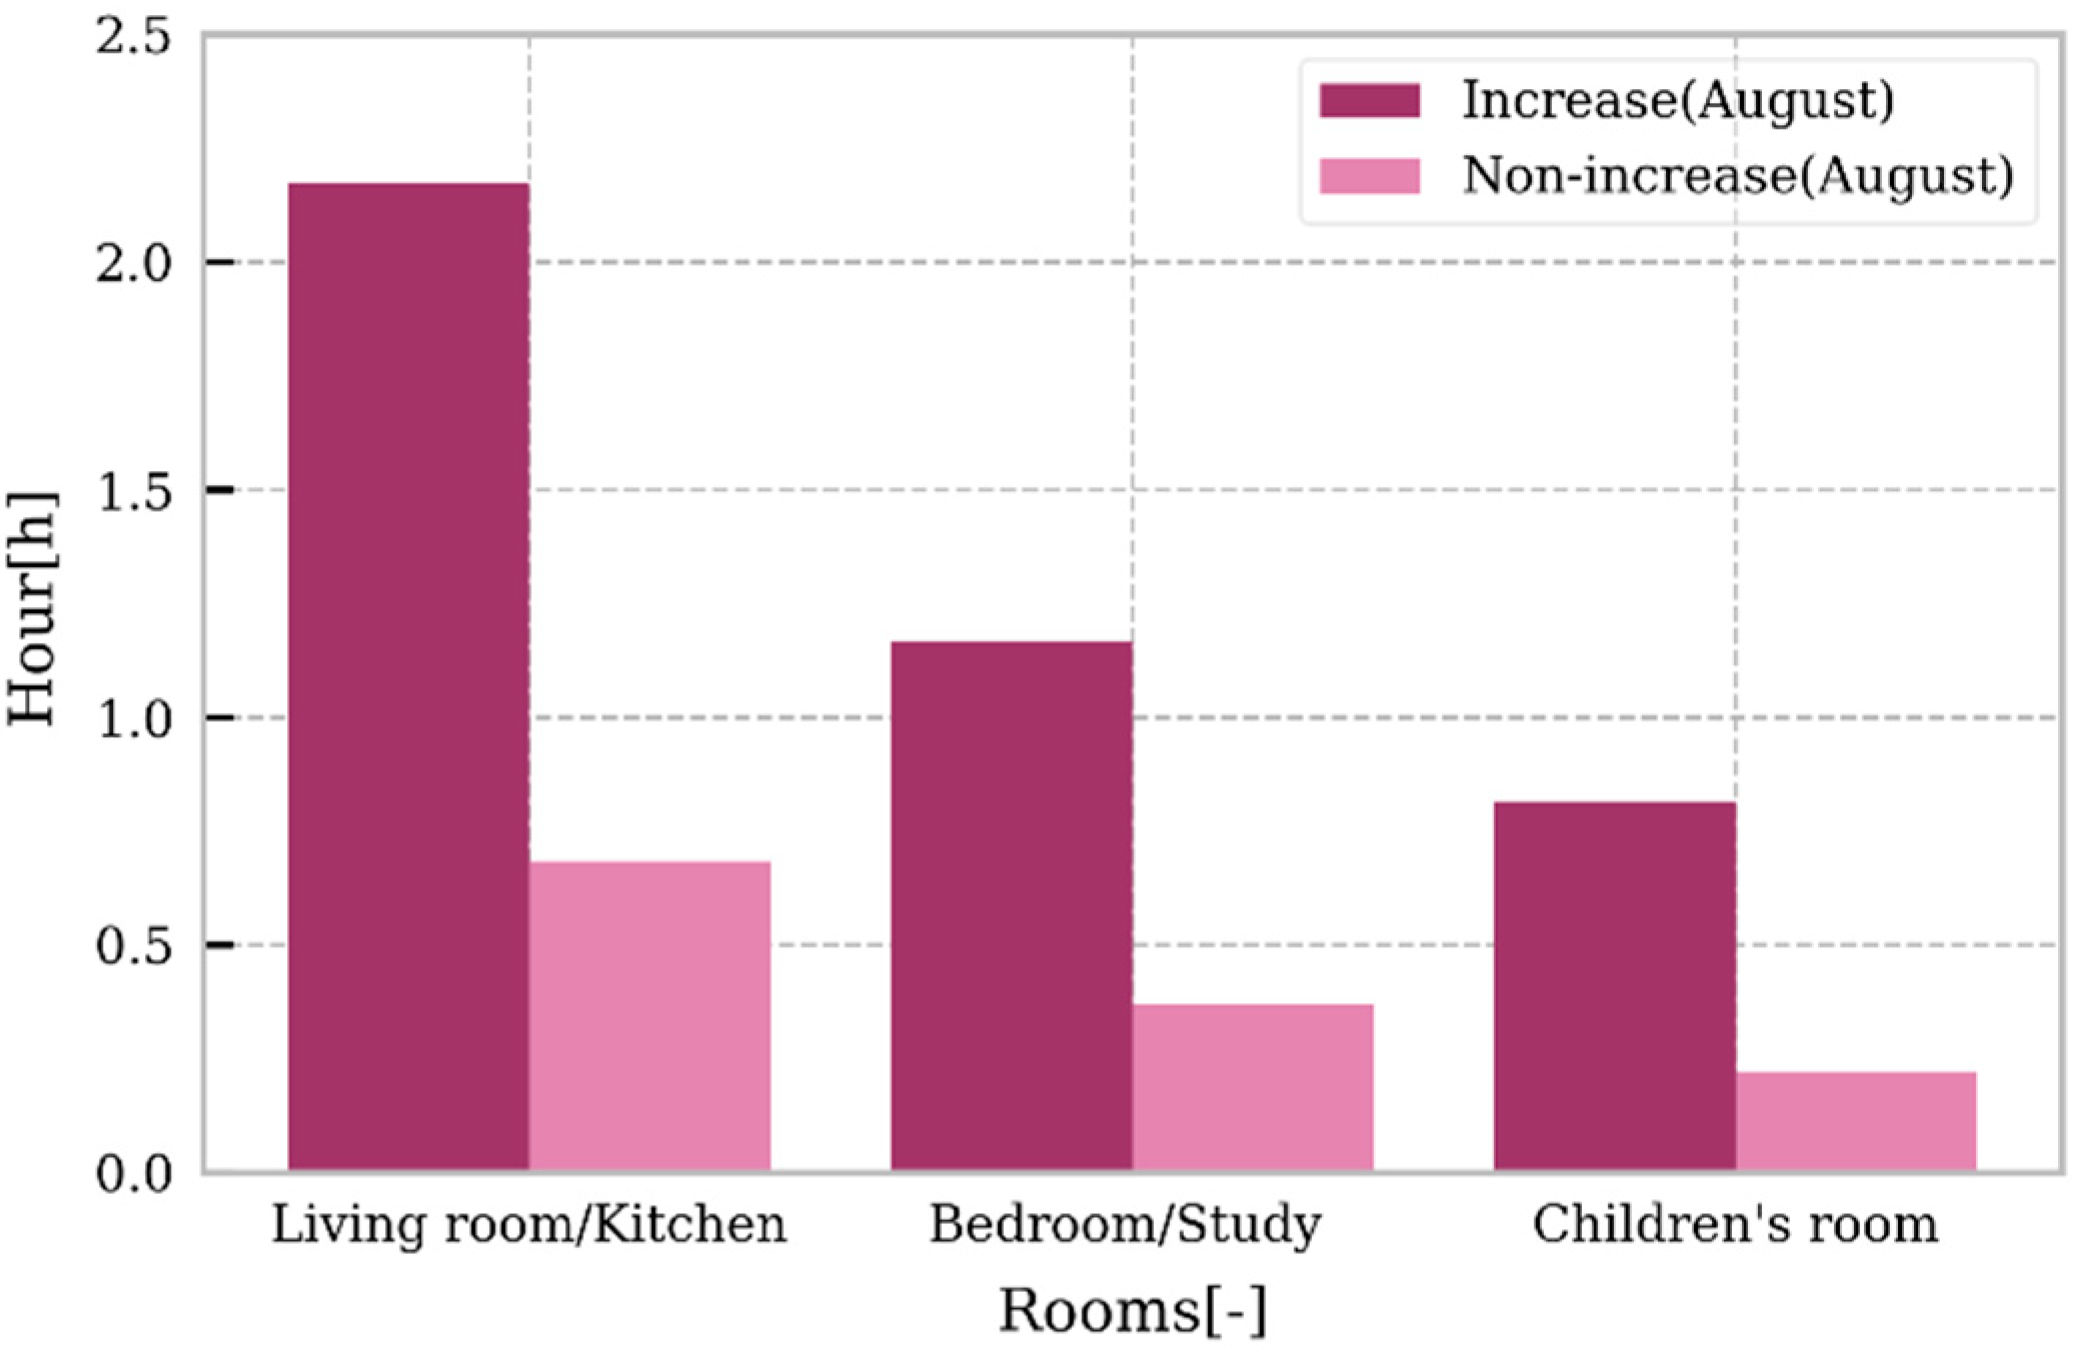
On the other hand, a difference in the average of increased hours of 2020 cooling time from 2019 was calculated within each group (Figure 14). The result shows that the average time of use of air-conditioners of the increase group was 1.5 h more than that of the non-increase group in the living room where many homeworkers work in Japan [28]. After testing normality and homogeneity of data on the hours of use of air-conditioners, this study conducted t-tests. The results showed significant differences between the two groups in the living room/kitchen and bedroom and study room.

Figure 14.
Comparison of group average of increased hours in 2020 cooling time from 2019 between increase group and non-increase group.
4. Discussion
4.1. Summary of Findings
This study analyzed lifestyle changes of residents and household electricity consumption during the pandemic of COVID-19 (from May to August 2020). A cross-sectional analysis of 964 households in the seven areas compared working styles before and during the pandemic. The following results were obtained: (1) the wake-up time of about 60% of homeworkers changed by more than 30 min, and the time of taking a bath also changed by more than 30 min in the case of more than 50% of workers; (2) not many changes were found in daily schedules of family members compared to workers; (3) the number of households that used air-conditioners in their living room and bedroom during the day increased in August; (4) more than a quarter of the samples marked an increase in electricity consumption in May and August 2020 by more than 5% compared to the same months in 2019. Around 40~50% of households were not aware of the reasons for the increase or realized it for the first time at the time of responding to the questionnaire survey; (5) the increase in the hours of use of air-conditioners in the living room and bedroom had a significant correlation with the increase in household electricity consumption in August (p = less than 0.01).
4.2. Impact of WFH on Workers and Their Families
According to a questionnaire survey conducted by PERSOL Research and Consulting Co., Ltd., (Tokyo 107-0062, Japan) only 23.1% of respondents worked from home in March 2020 and it was 45.8% as of November 2020 [3,29]. Working styles have changed significantly, and WFH has increased its relative importance so that both offices and homes are essential as working places.
The results of this questionnaire survey demonstrate that WFH has a great impact on daily schedules of workers. This study investigated some reasons for the changes in the wake-up time and bathing time. As shown in Figure 7, since the average commuting time to work is longer than 1 h in urban areas in Japan, the time of taking a bath seems to have become earlier [30]. Moreover, WFH helped 21.5% of respondents sleep 30 min more or even longer. This shows that the loss of commuting time to work due to WFH improved the health of respondents in terms of sleep. On the other hand, most of family members did not experience changes in their daily schedules (Figure 8). This result provided the conclusion that WFH for workers does not have a great impact on the life of their family members.
4.3. Importance of Information That Encourages Behavioral Changes (Nudge)
Around 40~50% of households were not aware of the reasons for the increase in energy consumption or realized it for the first time when they answered the questionnaire survey. This result shows the importance of providing residents with feedback using HEMS, etc., to encourage them to change their attitude toward energy saving. If residents noticed a change in monthly energy consumption due to WFH, this would give them an incentive to save energy costs. Moreover, residents can examine actions for effective energy saving by revealing reasons for the increase in energy consumption based on HEMS data analysis, etc., and receiving feedback [31,32].
Behaviors of residents are important in improving the energy performance of buildings. The Green Growth Strategy of Japan also advocates the change of mind-set and the expansion of behavioral changes through nudges [33]. If residential energy consumption continues to increase due to WFH, the importance of a nudge, which encourages residents to take energy-saving actions, is likely to further increase.
4.4. Factors of the Increase in Energy Consumption Due to WFH
Figure 13a,b shows no significant differences in the ratio of the number of rooms and the number of family members between the increase group and the non-increase group. These results indicate that the factors such as that the number of family members is small and that there is a room for WFH in the house are not related to the increase in electricity consumption. Although the increase in the number of people at home and the number of rooms used during the day appears to suggest the increase in illumination usage, it may not be a major factor which affects the monthly electricity consumption.
Furthermore, since there are no significant differences in the monthly electricity consumption in 2019 between the samples, it is assumed that whether household electricity consumption is big or small is not associated with the increase in electricity consumption due to WFH. Furthermore, the items such as the ownership of electric appliances for cooking and defecation did not have significant differences between the two groups. Possible reasons are that residents do not always cook lunch, although the number of persons at home during the day increases due to WFH, and that electricity consumption by heated toilet seats is minimal, because they are not used in summer.
On the other hand, as shown in Figure 14, there was a significant difference in annual change in the hours of use of air-conditioners in each room (living room/kitchen, bedroom/study room, children’s room) in August between the two groups. The increase in the hours of use of air-conditioners due to WFH is considered a factor in the increase in household electricity consumption during summer. If residents seek the same level of satisfaction for a home working environment as air-conditioned offices, room-temperature control with air-conditioners is an effective means for providing a satisfactory thermal environment. Therefore, the increase in the hours of use of heaters could be a factor of bringing about the increase in household electricity consumption during winter.
4.5. Study Limitations
This study had the following limits. Firstly, the questionnaire survey investigated residents’ behaviors and electricity consumption in the midterm and summer. Electricity and gas consumed by heating and hot-water supply during winter account for a large percentage of the annual household energy consumption [34]. In addition, this survey showed that the reasons for the increase in electricity consumption in the midterm due to WFH are others than the questionnaire items in this study. In order to clarify the increase in electricity consumption in the midterm, it should be desirable to add questions about laptop PCs and displays for WFH. Therefore, it is important to investigate behaviors of residents and equipment for WFH as well as the consumption of energy such as electricity and gas during the winter. However, the peak of electric power demand in Japan is during the day in summer [21]. Summer demand reduction of the residential sector is necessary for peak demand reduction in Japan [35]. This study proposes that it is significant to investigate trends of household demand in summer in order to control the increase in electricity consumption.
Secondly, this study conducted the questionnaire survey in a specific period (April to August 2020) during the pandemic of COVID-19. Since the state of COVID-19 is changing every day, the current results should be handled carefully. Once the majority of the general public is vaccinated, working styles are expected to change again. Therefore, future studies need to be conducted paying attention to social conditions after the general public gets vaccinated.
Moreover, it is required to investigate the reduction in gasoline consumption by cars from the perspective of energy consumption. Although most people use public transportation systems in urban areas for commuting, more than 10% use private cars [36]. In cases of examining household energy consumption, it is required to take the reduction in energy consumption from those factors into consideration. In addition, there is a possibility that WFH contributes not only to the increase in household energy consumption but also to energy consumption during the day due to changes in time-series demand curves. Therefore, this study proposes to conduct a detailed analysis on whether self-consumption of electricity generated by solar panels would increase its importance.
5. Conclusions
This survey targeting 1000 households in Japan indicates that WFH due to the pandemic of COVID-19 changed household electricity consumption and lifestyle and daily schedules of homeworkers. Many responded that they slept one hour or longer than before due to WFH. On the other hand, WFH had little impact on the life of family members of homeworkers. In regard to changes in energy consumption, the increase in the hours of use of air-conditioners and the increase in electricity consumption showed a significant relationship. These results are expected to be useful for improving the health of residents and energy saving in the age of a new normal. Future study is planned to conduct a similar study during the winter season. It will create a pattern of time-series energy load in houses of WFH workers based on results obtained from that study and will consider an efficient capacity and operation setting of solar power-generation facilities and fuel cells in consideration of the increase in energy consumption during the day.
Funding
This research received no external funding.
Institutional Review Board Statement
Not applicable.
Informed Consent Statement
Not applicable.
Data Availability Statement
The data are available in a publicly accessible repository.
Conflicts of Interest
The author declares no conflict of interest.
Appendix A
Table A1.
Details of the survey items.
Table A1.
Details of the survey items.
| Classification | Survey Question | Answer | |||
|---|---|---|---|---|---|
| Attribute | Please select the number of rooms in your current residence. | 1 room | 2 rooms | 3 rooms | |
| 4 rooms | 5 or more | ||||
| Please select the attributes of each resident in order of age, with the oldest first. If there are more than six people, please answer the five oldest. | Male/ Pre-school | Male/ Elementary school student | Male/ Junior high school student | ||
| Male/ 15–18 years old | Male/ 19–69 years old | Male/ 70 or over | |||
| Female/ Pre-school | Female/ Elementary school student | Female/ Junior high school student | |||
| Female/ 15–18 years old | Female/ 19–69 years old | Female/ 70 or over | |||
| Lifestyle and daily schedule | Please describe weekday living schedule of each resident for the 2019 fiscal year (April 2019 to March 2020). If the weekday life schedule varies from day to day, please describe the average time of day. | Getting out of bed | Described in minutes for each resident | ||
| Going to work or school | |||||
| Returning home | |||||
| Bathing (including showering only, and including when entering in the morning) | |||||
| Going to bed | |||||
| Please describe weekday living schedule of each resident in May 2020. If your weekday life schedule varies from day to day, please indicate the time of day during WFH, online classes, and home study periods. | Getting out of bed | Described in minutes for each resident | |||
| Going to work or school | |||||
| Returning home | |||||
| Bathing (including showering only, and including when entering in the morning) | |||||
| Going to bed | |||||
| Please describe weekday living schedule of each resident in August 2020. If your weekday life schedule varies from day to day, please indicate the time of day during WFH, online classes, and home study periods. | Getting out of bed | Described in minutes for each resident | |||
| Going to work or school | |||||
| Returning home | |||||
| Bathing (including showering only, and including when entering in the morning) | |||||
| Going to bed | |||||
| Electric appliances | Please describe the number of refrigerators owned in August 2020. | Described in numbers | |||
| Please describe the capacity of the largest refrigerator you own. | Described in liters | ||||
| Please describe the number of TVs owned in August 2020. | Described in numbers | ||||
| Please describe the size of the TV you own that you mainly use. | Described in inches | ||||
| Please select owned electric appliances. | Rice cooker | Electric kettle | Heated toilet seat | ||
| Bathroom dryer | Clothes dryer | Dishwasher | |||
| IH stove | Storage batteries | Solar power panels | |||
| Solar water heater | Fuel cells | ||||
| Air-conditioner | Please select whether you used the air conditioner in each month. If you have difficulty answering the exact question for 2019, please answer for the spring of 2019 for April and May, and for August for the hottest time of the year in 2019. | April 2019 | Used air conditioning more than 15 days per month | Did not use air conditioning for more than 15 days per month | |
| May 2019 | |||||
| August 2019 | |||||
| April 2020 | |||||
| May 2020 | |||||
| August 2020 | |||||
| Please select one answer for each room regarding the frequency of use of air-conditioners. If you have difficulty answering the exact question for August, please answer for the hottest time of 2019 or 2020, respectively. | Living room/Kitchen in August 2019 | Used almost every day. | Occasionally used | Not used | |
| Bedroom/Study in August 2019 | There is no applicable room. | ||||
| Children’s room in August 2019 | |||||
| Living room/Kitchen in August 2020 | |||||
| Bedroom/Study in August 2020 | |||||
| Children’s room in August 2020 | |||||
| Please select all the times that apply to the use of air conditioning for each room on weekdays. | Living room/Kitchen in August 2019 | No cooling | 0 o’clock | 1 o’clock | |
| Bedroom/Study in August 2019 | 2 o’clock | 3 o’clock | 4 o’clock | ||
| Children’s room in August 2019 | 5 o’clock | 6 o’clock | 7 o’clock | ||
| Living room/Kitchen in August 2020 | 8 o’clock | 9 o’clock | 10 o’clock | ||
| Bedroom/Study in August 2020 | 11 o’clock | 12 o’clock | 13 o’clock | ||
| Children’s room in August 2020 | 14 o’clock | 15 o’clock | 16 o’clock | ||
| 17 o’clock | 18 o’clock | 19 o’clock | |||
| 20 o’clock | 21 o’clock | 22 o’clock | |||
| 23 o’clock | |||||
| Electricity consumption | Please describe the amount of electricity consumption in your household. | April 2019 | Described in kWh | ||
| May 2019 | |||||
| August 2019 | |||||
| April 2020 | |||||
| May 2020 | |||||
| August 2020 | |||||
| Please describe why your monthly electricity consumption in 2020 has changed or not changed from 2019. | Be sure to describe | ||||
References
- International Energy Agency. Global Energy Review: CO2 Emissions in 2020. 2021. Available online: https://www.iea.org/articles/global-energy-review-co2-emissions-in-2020 (accessed on 27 July 2021).
- Bui, T.; Higa, T.; Sivakumar, V.; Yen, J. Beyond telecommuting: Organizational Suitability of Different Modes of Telework. In Proceedings of the 29th Annual Hawaii International Conference on System Sciences, Wailea, HI, USA, 3–6 January 1996; Volume 3, pp. 344–353. [Google Scholar] [CrossRef]
- Park, S.; Jeong, S.; Chai, D.S. Remote e-Workers’ Psychological Well-being and Career Development in the Era of COVID-19: Challenges, Success Factors, and the Roles of HRD Professionals. Adv. Dev. Hum. Resour. 2021, 23, 222–236. [Google Scholar] [CrossRef]
- International Labour Organization. Working from Home: Estimating the Worldwide Potential. 2020. Available online: https://www.ilo.org/wcmsp5/groups/public/---ed_protect/---protrav/---travail/documents/briefingnote/wcms_743447.pdf (accessed on 27 July 2021).
- PERSOL Research and Consulting Co., Ltd. Detailed Data of the Second Survey Results. 2020. Available online: https://rc.persol-group.co.jp/assets/files/news-data.xlsx (accessed on 27 July 2021).
- Sato, K.; Kobayashi, S.; Yamaguchi, M.; Sakata, R.; Sasaki, Y.; Murayama, C.; Kondo, N. Working from home and dietary changes during the COVID-19 pandemic: A longitudinal study of health app (CALO mama) users. Appetite 2021, 165, 105323. [Google Scholar] [CrossRef] [PubMed]
- Chiba, A. The effectiveness of mobility control, shortening of restaurants’ opening hours, and working from home on control of COVID-19 spread in Japan. Health Place 2021, 70, 102622. [Google Scholar] [CrossRef] [PubMed]
- Hanibuchi, T.; Yabe, N.; Nakaya, T. Who is staying home and who is not? Demographic, socioeconomic, and geographic differences in time spent outside the home during the COVID-19 outbreak in Japan. Prev. Med. Rep. 2021, 21, 101306. [Google Scholar] [CrossRef] [PubMed]
- Toscano, F.; Zappalà, S. Social isolation and stress as predictors of productivity perception and remote work satisfaction during the COVID-19 pandemic: The role of concern about the virus in a moderated double mediation. Sustainability 2020, 12, 9804. [Google Scholar] [CrossRef]
- Morikawa, M. Productivity of Working from Home during the COVID-19 Pandemic: Evidence from an Employee Survey; RIETI Discussion Paper Series 20-E-073. Available online: https://www.rieti.go.jp/jp/publications/dp/20e073.pdf (accessed on 10 February 2022).
- Nayak, S.; Pandit, D. Potential of telecommuting for different employees in the Indian context beyond COVID-19 lockdown. Transp. Policy 2021, 111, 98–110. [Google Scholar] [CrossRef]
- Campisi, T.; Tesoriere, G.; Trouva, M.; Papas, T.; Basbas, S. Impact of Teleworking on Travel Behaviour During the COVID-19 Era: The Case Of Sicily, Italy. Transp. Res. Procedia 2022, 60, 251–258. [Google Scholar] [CrossRef]
- Pulido-Martos, M.; Cortés-Denia, D.; Lopez-Zafra, E. Teleworking in Times of COVID-19: Effects on the Acquisition of Personal Resources. Front. Psychol. 2021, 12, 2485. [Google Scholar] [CrossRef] [PubMed]
- Cellini, M.; Pisacane, L.; Crescimbene, M.; Di, F.F. Exploring Employee Perceptions towards Smart Working during the COVID-19 Pandemic: A Comparative Analysis of Two Italian Public Research Organizations. Public Organ. Rev. 2021, 21, 815–833. [Google Scholar] [CrossRef]
- Hannah, V.; Ahmed, A.; Maya, P.; Sharane, S.; Cynthia, C.; William, O. New Insights on the Energy Impacts of Telework in Canada. Can. Public Policy 2021, 47, 460–467. [Google Scholar] [CrossRef]
- Moncef, K.; Mohammad, A. Review analysis of COVID-19 impact on electricity demand for residential buildings. Renew. Sustain. Energy Rev. 2021, 143, 110888. [Google Scholar] [CrossRef]
- Dragan, C.; Aleksandar, N.; Ivana, T. Impact of people’s behavior on the energy sustainability of the residential sector in emergency situations caused by COVID-19. Energy Policy 2021, 230, 110532. [Google Scholar] [CrossRef]
- The Government of Japan. The Long-Term Strategy under the Paris Agreement. 2019. Available online: https://www.env.go.jp/earth/earth/ondanka/mat3.pdf (accessed on 27 July 2021).
- Robinson, C.; Yan, D.; Bouzarovski, S.; Zhang, Y. Energy poverty and thermal comfort in northern urban China: A household-scale typology of infrastructural inequalities. Energy Build. 2018, 177, 363–374. [Google Scholar] [CrossRef]
- Stelmach, G.; Zanocco, C.; Flora, J.; Rajagopal, R.; Boudet, H.S. Exploring household energy rules and activities during peak demand to better determine potential responsiveness to time-of-use pricing. Energy Policy 2020, 144, 111608. [Google Scholar] [CrossRef]
- Ozawa, A.; Kudoh, Y.; Yoshida, Y. A new method for household energy use modeling: A questionnaire-based approach. Energy Build. 2018, 162, 32–41. [Google Scholar] [CrossRef]
- Wittenberg, I.; Matthies, E. How do PV households use their PV system and how is this related to their energy use? Renew. Energy 2018, 122, 291–300. [Google Scholar] [CrossRef]
- Data of Japan. Japan. Geojson. Available online: https://github.com/dataofjapan/land/commit/c686f194db009794b63b38585af060fbe1b0b304 (accessed on 28 January 2022).
- Geospatial Information Authority of Japan. XYZ Tiles “Blank Map”. Available online: https://maps.gsi.go.jp/development/ichiran.html (accessed on 28 January 2022).
- Ministry of Economy, Trade and Industry. METI Requested Related Associations to Promote Teleworking of Workers and Other Actions as Responses to Government’s Declaration of State of Emergency Involving Novel Coronavirus Disease. Available online: https://www.meti.go.jp/english/press/2020/0413_002.html (accessed on 28 January 2022).
- The National Statistics Center. 2015 Population Census. Basic Complete Tabulation on Population and Households. 2017. Available online: https://www.e-stat.go.jp/en/stat-search/files?page=1&layout=datalist&toukei=00200521&tstat=000001080615&cycle=0&tclass1=000001089055&tclass2=000001089056&tclass3val=0 (accessed on 27 July 2021).
- The National Statistics Center. 2018 Housing and Land Survey. Basic Tabulation on Dwellings and Households. Available online: https://www.e-stat.go.jp/en/stat-search/files?page=1&layout=datalist&toukei=00200522&tstat=000001127155&cycle=0&year=20180&month=0&tclass1=000001129435&tclass2=000001129436&tclass3val=0 (accessed on 28 January 2022).
- Recruit Co., Ltd. Press Release. 2020. Available online: https://www.recruit.co.jp/newsroom/recruit-sumai/data/upload/07a49f312ad3ef3f6eb08d2e4dac6f08.pdf (accessed on 27 July 2021).
- PERSOL Research and Consulting Co., Ltd. Detailed Data of the Fourth Survey Results. 2020. Available online: https://rc.persol-group.co.jp/news/files/telework4-2.xlsx (accessed on 27 July 2021).
- The National Statistics Center. Survey on Time Use and Leisure Activities. 2016 Survey on Time Use and Leisure Activities. 2016. Available online: https://www.e-stat.go.jp/en/stat-search/files?page=1&layout=datalist&toukei=00200533&tstat=000001095335&cycle=0&tclass1=000001095377&tclass2=000001095393&tclass3=000001095396&stat_infid=000031616633&tclass4val=0 (accessed on 27 July 2021).
- Brülisauer, M.; Goette, L.; Jiang, Z.; Schmitz, J.; Schubert, R. Appliance-Specific feedback and social comparisons: Evidence from a field experiment on energy conservation. Energy Policy 2020, 145, 111742. [Google Scholar] [CrossRef]
- Kim, H.B.; Iwamatsu, T.; Nishio, K.; Komatsu, H.; Mukai, T.; Odate, Y.; Sasaki, M. Field experiment of smartphone-based energy efficiency services for households: Impact of advice through push notifications. Energy Build. 2020, 223, 110151. [Google Scholar] [CrossRef]
- The Government of Japan. Green Growth Strategy through Achieving Carbon Neutrality in 2050. 2020. Available online: https://www.meti.go.jp/english/press/2020/pdf/1225_001b.pdf (accessed on 27 July 2021).
- Ministry of Economy, Trade and Industry. Japan’s Energy White Paper 2020. 2020. Available online: https://www.enecho.meti.go.jp/about/whitepaper/2020pdf/whitepaper2020pdf_all.zip (accessed on 27 July 2021).
- Taniguchi, A.; Inoue, T.; Otsuki, M.; Yamaguchi, Y.; Shimoda, Y.; Takami, A.; Hanaoka, K. Estimation of the contribution of the residential sector to summer peak demand reduction in Japan using an energy end-use simulation model. Energy Build. 2016, 112, 80–92. [Google Scholar] [CrossRef]
- The National Statistics Center. 2010 Population Census. Tabulation on Place of Work or Schooling for Population and Industries. 2012. Available online: https://www.e-stat.go.jp/en/stat-search/files?page=1&layout=datalist&toukei=00200521&tstat=000001039448&cycle=0&tclass1=000001049567&tclass2=000001051128&tclass3val=0 (accessed on 27 July 2021).


Publisher’s Note: MDPI stays neutral with regard to jurisdictional claims in published maps and institutional affiliations. |
© 2022 by the author. Licensee MDPI, Basel, Switzerland. This article is an open access article distributed under the terms and conditions of the Creative Commons Attribution (CC BY) license (https://creativecommons.org/licenses/by/4.0/).