
Going Beyond Global Indicators—Policy Relevant Indicators for SDG 6 Targets in the Context of Austria


Abstract
1. Introduction
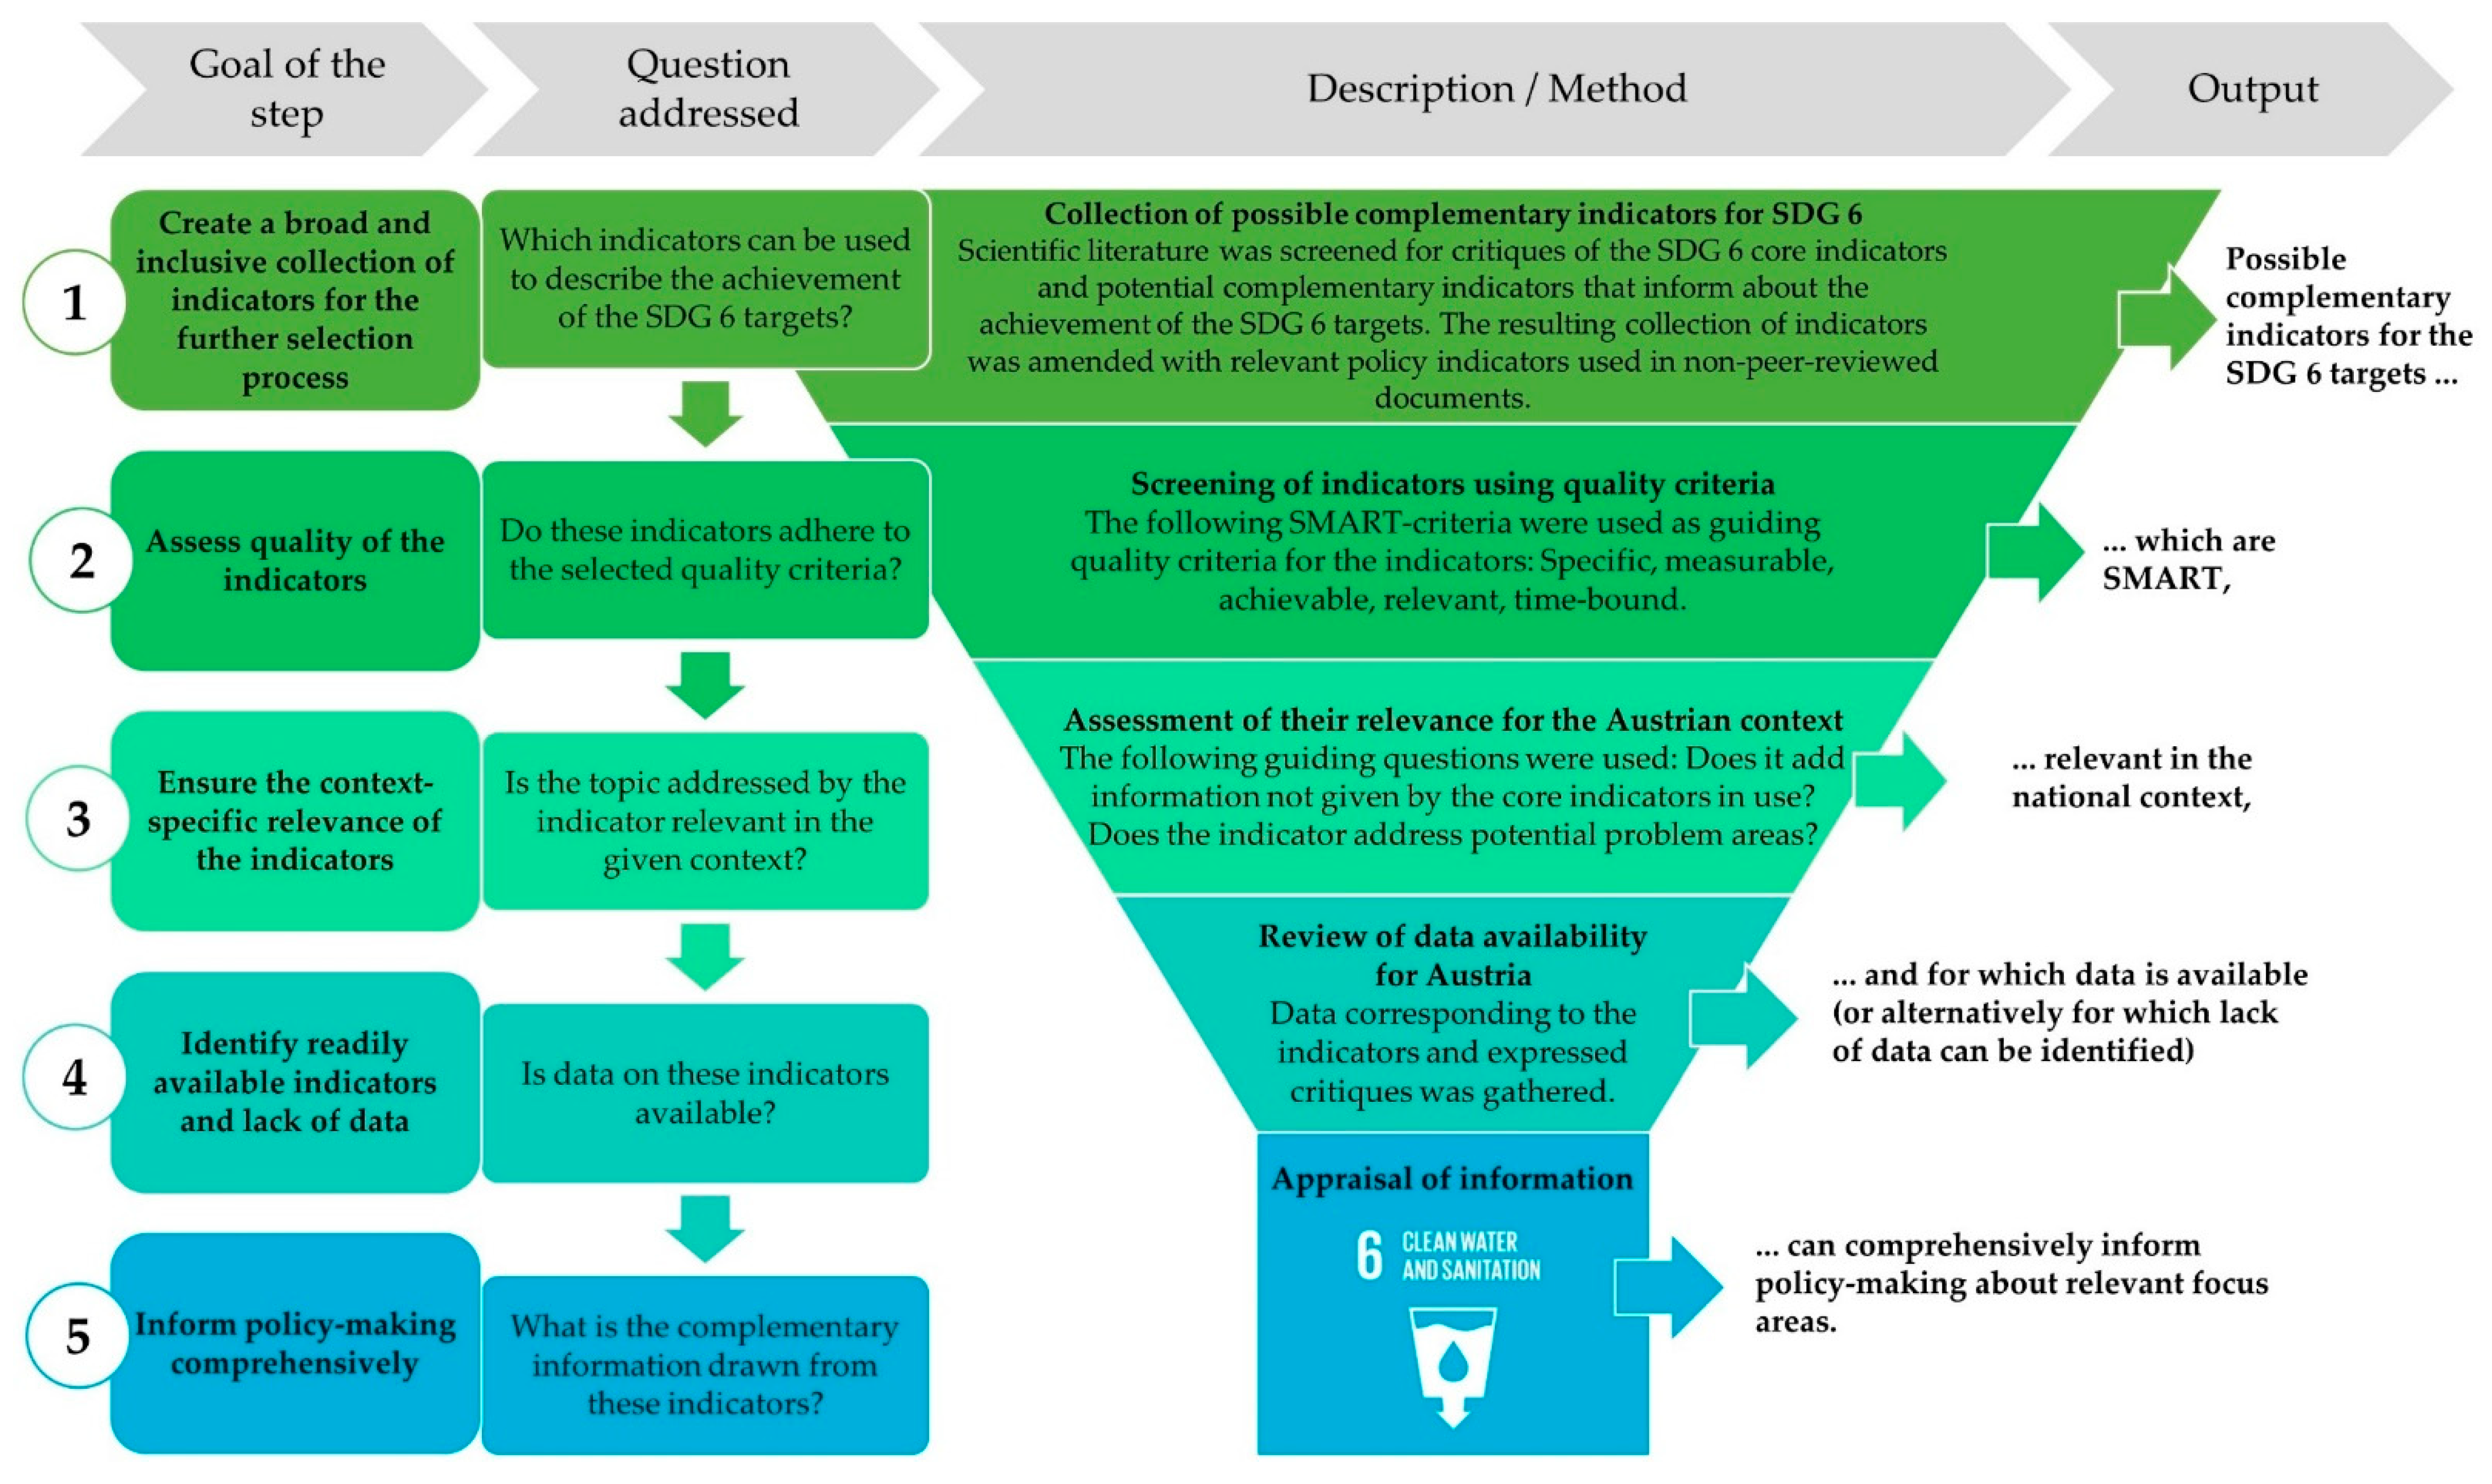
2. Materials and Methods
- the collection of possible indicators for the achievement of SDG 6 from literature;
- the assessment of these indicators on whether they fulfil the SMART criteria; and
- on their relevance for the Austrian context;
- a check of data availability for these indicators for Austria; and
- the illustration of additional information that can be drawn from these indicators and the corresponding data.
- Does the indicator add information not given by the core indicators for SDG 6?
- Does the indicator address a potential problem area in the national context of Austria?
3. Results and Discussions
3.1. Overview on SDG 6 Targets and Indicators
3.2. Indicators for Target 6.1
3.2.1. Critical Appraisal of Indicators for Target 6.1
3.2.2. Status Quo of Target 6.1 in Austria
3.3. Indicators for Target 6.2
3.3.1. Critical Appraisal of Indicators for Target 6.2
3.3.2. Status Quo of Target 6.2 in Austria

| 6.2.1. | Proportion of Population Using (a) Safely Managed Sanitation Services | 100% [41] 1 |
|---|---|---|
| and (b) a Hand-Washing Facility with Soap and Water | n.d. | |
| Category | Complementary Indicators | Available Data for Austria |
| Disaggregation | By gender: Share of total population not having indoor flushing toilet for the sole use of their household (male/female) [16,39] | 0.8/0.9% (2020) [73] |
| By gender: Share of total population having neither a bath, nor a shower in their dwelling (male/female) [16,39] | 0.6/0.7% (2020) [74] | |
| By income: Population having neither a bath, nor a shower, nor indoor flushing toilet in their household by poverty status (below/above 60% of median equivalised income) [16,39] | 0.4/0.6% (2020) [75] | |
| Disaggregation by age/disadvantaged [16,39] | n.d. | |
| Geographic location [16,39,51,52] | 99.20 (rural)/99.95 (urban) (2020) [39] 2 | |
| Migratory status [18] | n.d. | |
| Race/ethnicity [18] | n.d. | |
| Accessibility | Sanitation service at school [16,39] | n.d. |
| Sanitation service at health care facilities [16,39] | insufficient data [39] | |
| Availability/equity/quality | In-depth questionnaire on WASH (water, sanitation, hygiene) level with household and individual-level indicators between people and households with and without disabilities [25] | n.d. |
| WASH access of vulnerable and marginalized groups using, e.g., Equitable Access Score-card [27] | n.d. | |
| Female/male perceptions and concerns about the (1) availability; (2) accessibility; (3) quality (cleanliness, hygiene, water for cleaning); and (4) safety for female/male adults/children/elderly/differently abled, of water, sanitation and hygiene services in public places (such as markets, hospitals, tourist places, town squares), by geographical location in the survey area [33,42] | n.d. | |
| Female/male perceptions and concerns of the (1) availability; (2) accessibility; (3) quality (cleanliness, hygiene, water for cleaning); and (4) safety for female/male adults/children/elderly/differently abled, of water, sanitation and hygiene services in camps for refugees, migrants, asylum seekers and displaced people(s) [33,42] | n.d. | |
| Acceptability | Conditions of privacy in the latrine [26] | n.d. |
| Conditions of comfort in the latrine [26] | n.d. | |
| Satisfaction with the location of the facility [26] | n.d. | |
| Affordability | Household contribution to construction of the facility [26] | n.d. |
| Investment to construct a sanitation facility [26] | n.d. | |
| Reasons for not having a latrine: insufficient money [26] | n.d. | |
| Average wastewater fee in % of average income | 1.3% [72] | |
| Hygiene | Private place to wash and change [40] | n.d. |
| Use of menstrual materials (reusable/singe-use) [40] | n.d. | |
| Participation in activities during menstruation [40] | n.d. | |
| Awareness of menstruation before menarche [40] | n.d. | |
| Prevalence of menstrual taboos amongst the target population [40] | n.d. | |
| Infrastructure | Infrastructure investment (target value: 3.8% of GDP) [15,57] 3 | Transport infrastructure investment and maintenance spending 3: 2.3 Mrd € (2019) [76] (~0.5% of GDP) 4 |
| Investment in wastewater management (target value for asset class “Water” 5: 0.6% of GDP) | 350 Mio €/a (2014–2016) [72] (~0.08% of GDP) | |
| Age of infrastructure [15] | 11% older than 50 years [72] | |
| Status class of sewage system * | 32% of total sewage system in need for action to be rehabilitated (immediate to long-term) [72] | |
| Estimation of percentage of private house connections that exhibit defects * | 70% [72] | |
| Rehabilitation rate of sewage system (required according to ÖWAV [72]: 1.8%) * | ~0.14%(2016–2018) [72] |
3.4. Indicators for Target 6.3
3.4.1. Critical Appraisal of Indicators for Target 6.3
3.4.2. Status Quo of Target 6.3 in Austria
3.5. Indicators for Target 6.4
3.5.1. Critical Appraisal of Indicators for Target 6.4
3.5.2. Status Quo of Target 6.4 in Austria
| 6.4.1 | Change in Water-Use Efficiency over Time | 103 $/m3 [41] |
|---|---|---|
| 6.4.2 | Level of Water Stress: Freshwater Withdrawal as a Proportion of Available Freshwater Resources | 9.64% [113] |
| Category | Complementary Indicators | Available Data for Austria |
| (Residential) per capita water use [53,104] | 126 L/capita/day [98] | |
| Socioeconomic aspects | Jobs per million cubic metre in heavily water-dependent sectors (Mm3/a) [53] | n.d. |
| Change in the ratio of gross economic value added by irrigated and rainfed agriculture to the volume of water consumed by rainfed and irrigated agriculture over time [102] | n.d. | |
| Yield per unit of water use/water intensity of food production [52,108,114,115] | n.d. | |
| Annual freshwater demand for agriculture [52] | 124 Mm3/a [98] | |
| Annual freshwater demand of industry * | 2210 Mm3/a [98] | |
| Annual freshwater demand of water supply * | 753 Mm3/a [98] | |
| Energy produced per unit of water used for energy production (productivity) [14,108] | n.d. | |
| Energy intensity of water supply * | 0.33 kWh/m3 [54] | |
| Efficiency | Water leakage [15] | ~14% of network supply [98] (p. 201) |
| Municipal water losses [53] | n.d. | |
| Water scarcity | Water scarcity/Water exploitation index (WEI+) [15,28] values >20% are widely accepted to imply that water resources are under stress [15,116] | For Austria: 1.7% (2016) 1 [98] |
| Ground water depletion (Mm3/a) [101,103] | 826 Mm3/a which corresponds to about 16% of the available groundwater resources are used by extraction from wells, [98] | |
| Quantitative status of groundwater bodies near the surface * | All show a good status, but two exhibit a risk to fail this status in 2027 [98] | |
| Disaggregation | Level of water stress for river basin districts * | WEI+ for the Austrian part of the river basin Rhine: 0.39% and of the river basin Danube (excl. March): 3.57% (2016) [98] |
| Intensity of use of groundwater bodies | Detailed assessment at groundwater level available [98] | |
| Spatially disaggregated water use efficiency [102,103] | n.d. | |
| Equity | Gini index of water use [104] | n.d. |
| Water footprint | Blue water footprint of national consumption/net water abstraction [20,28,83] | 795.3 Mm3/a (1996–2005) [84] |
| Internal: 130.7 Mm3/a (1996–2005) [84] | ||
| External: 664.6 Mm3/a (1996–2005) [84] | ||
| Total blue water footprint per capita * | 271 L/cap/d (1996–2005) based on [84] | |
| Internal: 45 L/cap/d (1996–2005) based on [84] | ||
| External: 226 L/cap/d (1996–2005) based on [84] | ||
| Green water footprint [20,28,83] | Of national consumption 9140 Mm3/a (1996–2005) [84] | |
| Internal: 3193 Mm3/a (1996–2005) [84]; | ||
| External: 5947 Mm3/a (1996–2005) [84]; | ||
| Total green water footprint per capita * | 3108 L/cap/d (1996–2005) based on [84] | |
| Internal: 1086 L/cap/d (1996–2005) based on [84] | ||
| External: 2022 L/cap/d (1996–2005) based on [84] | ||
| Total water footprint per capita * | 4738 L/cap/d [117] 2 | |
| Availability | Proportion of available freshwater resources per capita [108] | Available groundwater resources: ~5115 Mm3/a [98] |
3.6. Indicators for Target 6.5
3.6.1. Critical Appraisal of Indicators for Target 6.5
3.6.2. Status Quo of Target 6.5 in Austria
3.7. Indicators for Target 6.6
3.7.1. Critical Appraisal of Indicators for Target 6.6
3.7.2. Status Quo of Target 6.6 in Austria
3.8. Indicators for Target 6.a
3.8.1. Critical Appraisal of Indicators for Target 6.a
3.8.2. Status Quo of Target 6.a in Austria
3.9. Indicators for Target 6.b
3.9.1. Critical Appraisal of Indicators for Target 6.b
3.9.2. Status Quo of Target 6.b in Austria
3.10. General Critical Aspects Related to the Use of Indicators
4. Conclusions
- The set of core indicators proposed by the UN does not fully cover the aims of the specific targets and various aspects that would be necessary to thoroughly capture whether a country’s development is entirely sustainable, e.g., the aim to increase recycling and reuse is not covered by the indicators for Target 6.3. Details on other aspects that are insufficiently covered can be found in the sections on the critical appraisal of the indicators for the respective targets.
- A multitude of complementary and SMART indicators is available for Targets 6.1–6.6, that can be particularly relevant for countries of the Global North and in consideration of the Agenda 2030’s aspiration of developed countries leading action. For Targets 6.a and 6.b, complementary indicators are rare and further research would be needed to draw a comprehensive picture of the status quo of these targets.
- Complementary indicators increase the knowledge on specific aims of the targets but also the efforts required for reporting on the progress of achievement of SDG targets. Considering the complexity of coherent monitoring and persistent and prevalent data gaps for the core indicators, the need to keep the global indicators framework simple is evident.
- Although the indicators are designed to allow country-wide assessment and country-to-country comparison, one should not forget that to achieve the targets more specific information is required. Disaggregation of data, e.g., according to gender, age, location is highly needed and recommended wherever relevant in consideration of the potentially increased monitoring efforts.
- While quantitative indicators might be helpful for benchmarking and trend analysis, for policy making they need to be discussed within a broader national context. To fully assess target implementation and allow priority setting, defining of targets and weighting based on stakeholder discussions might be necessary in a follow-up step.
- Interlinkages within the SDG 6 targets and with other SDGs are apparent. Indicators could be used as a means to underline these interlinkages, e.g., using composite indices and enable clear communication and effective implementation. This was not the focus of this assessment and could be enhanced in future studies.
- Future research could aim at developing methods for efficient disaggregation, localisation and the closing of data gaps of core as well as complementary indicators. Further, the development of complementary indicators for the MoI and several aspects of sustainability, that are currently not sufficiently covered and partly difficult to measure, deserve intensified research.
- Complementary indicators, for many of which data are readily available, can ensure more specific and complete assessment towards reaching SDG 6 targets in Austria and be used to complement progress reporting, e.g., within the Voluntary National Reviews.
- Targets 6.1 and 6.2 are achieved to a great extent in Austria, yet, continued efforts are required to provide and guarantee safely managed systems. In-depth assessment to cover WASH access in public spaces as well as for vulnerable and marginalized groups could be useful. Infrastructure investment should correspond to the respective needs and be managed with foresight considering future challenges like climate change, population changes and resources depletion.
- Comprehensive data on water quality in Austria to complement Target 6.3 are widely available. However, diffuse pollution from mainly agriculture is one of the major challenges. In-depth assessment of interlinkages could be one way to tackle this. Recovery and reuse of energy, water and nutrients are not extensively practised but are currently becoming more relevant.
- Integrated monitoring of Target 6.4 is complex and requires a set of indicators and corresponding interlinkages to be assessed. Assessment at the level of groundwater bodies indicates an at least good status for all groundwater bodies at present but two exhibit risk to fail this status in 2027. For a comprehensive picture of local challenges, a more detailed spatially and temporally disaggregated assessment would be required. Besides domestic water resources, water resources abroad should be protected by tackling the high external water footprint of Austrian consumption.
- While Target 6.5 is doubtlessly difficult to grasp, IWRM level in Austria appears to be relatively high and, with the national water management plan and transboundary arrangements for water cooperation for all relevant rivers, a solid basis for the future is existing. Adequate financing, integrated land use management, participation and fragmented responsibilities are identified to be the bottlenecks for more comprehensive implementation. Tackling these is imperative considering the importance given to widely established IWRM to meet future challenges.
- As main deficits for achieving Target 6.6, hydro-morphological pressures and diffuse pollution are identified. These impact, among others, sediment balance and biodiversity, and threaten various species and ecosystems.
- Insufficient data are available on the impact of water-related development cooperation of Austria. Taking the internationally agreed target of 0.7% of GNI as benchmark, financial development aid is not sufficient to achieve Target 6.a.
- Data basis for Target 6.b is sparse and few complementary indicators are suggested. Decision making in the water sector in Austria is strongly formalized and while technically participation is foreseen, it is often rather a formality. Nonetheless, participation, or more generally speaking, transdisciplinary processes, will be key to achieving the sustainable transformation aspired within the Agenda 2030.
- While Austria and the identified complementary indicators can serve as example for a country in the Global North, the results are particularly relevant for the Austrian context. A similar assessment for other countries might result in a different set of suitable indicators.
Author Contributions
Funding
Institutional Review Board Statement
Informed Consent Statement
Data Availability Statement
Acknowledgments
Conflicts of Interest
References
- United Nations. Transforming Our World: The 2030 Agenda for Sustainable Development; UN: New York, NY, USA, 2015. [Google Scholar]
- Resolution Adopted by the General Assembly on 28 July 2010 64/292. The Human Right to Water and Sanitation. Available online: https://undocs.org/pdf?symbol=en/A/RES/64/292 (accessed on 25 December 2021).
- Weststrate, J.; Dijkstra, G.; Eshuis, J.; Gianoli, A.; Rusca, M. The Sustainable Development Goal on Water and Sanitation: Learning from the Millennium Development Goals. Soc. Indic. Res. 2019, 143, 795–810. [Google Scholar] [CrossRef]
- Fukuda-Parr, S.; McNeill, D. Knowledge and Politics in Setting and Measuring the SDGs: Introduction to Special Issue. Glob. Policy 2019, 10, 5–15. [Google Scholar] [CrossRef]
- Sachs, J.D. From Millennium Development Goals to Sustainable Development Goals. Lancet 2012, 379, 2206–2211. [Google Scholar] [CrossRef]
- UN Water. Summary Progress Update 2021: SDG 6—Water and Sanitation for all, Geneva, Switzerland, 2021. Available online: https://www.unwater.org/publication_categories/sdg6-progress-reports/ (accessed on 26 December 2021).
- Requejo-Castro, D.; Giné-Garriga, R.; Pérez-Foguet, A. Data-driven Bayesian network modelling to explore the relationships between SDG 6 and the 2030 Agenda. Sci. Total Environ. 2020, 710, 136014. [Google Scholar] [CrossRef]
- Alcamo, J. Water quality and its interlinkages with the Sustainable Development Goals. Curr. Opin. Environ. Sustain. 2019, 36, 126–140. [Google Scholar] [CrossRef]
- Hua, T.; Zhao, W.; Wang, S.; Fu, B.; Pereira, P. Identifying priority biophysical indicators for promoting food-energy-water nexus within planetary boundaries. Resour. Conserv. Recycl. 2020, 163, 105102. [Google Scholar] [CrossRef]
- UN Water. Water and Sanitation Interlinkages across the 2030 Agenda for Sustainable Development, Geneva, 2016. Available online: https://www.unwater.org/publications/water-sanitation-interlinkages-across-2030-agenda-sustainable-development/ (accessed on 19 August 2021).
- Miola, A.; Borchardt, S.; Neher, F.; Buscaglia, D. Interlinkages and Policy Coherence for the Sustainable Development Goals Implementation: An Operational Method to Identify Trade-Offs and Co-Benefits in a Systemic Way; Publications Office of the European Union: Luxembourg, 2019; ISBN 978-92-79-99556-9. [Google Scholar]
- Jaramillo, F.; Desormeaux, A.; Hedlund, J.; Jawitz, J.; Clerici, N.; Piemontese, L.; Rodríguez-Rodriguez, J.; Anaya, J.; Blanco-Libreros, J.; Borja, S.; et al. Priorities and Interactions of Sustainable Development Goals (SDGs) with Focus on Wetlands. Water 2019, 11, 619. [Google Scholar] [CrossRef]
- Kurian, M.; Scott, C.; Reddy, V.R.; Alabaster, G.; Nardocci, A.; Portney, K.; Boer, R.; Hannibal, B. One swallow does not make a summer: Siloes, trade-offs and synergies in the water-energy-food nexus. Front. Environ. Sci. 2019, 7, 7. [Google Scholar] [CrossRef]
- UN Water. Integrated Monitoring Guide for Sustainable Development Goal 6 on Water and Sanitation Targets and Global Indicators, 2017. Available online: https://www.unwater.org/publications/sdg-6-targets-indicators/ (accessed on 26 September 2019).
- Essex, B.; Koop, S.; van Leeuwen, C.J. Proposal for a National Blueprint Framework to Monitor Progress on Water-Related Sustainable Development Goals in Europe. Environ. Manag. 2020, 65, 1–18. [Google Scholar] [CrossRef]
- Guppy, L.; Mehta, P.; Qadir, M. Sustainable development goal 6: Two gaps in the race for indicators. Sustain. Sci. 2019, 14, 501–513. [Google Scholar] [CrossRef]
- Bartram, J.; Brocklehurst, C.; Bradley, D.; Muller, M.; Evans, B. Policy review of the means of implementation targets and indicators for the sustainable development goal for water and sanitation. NPJ Clean Water 2018, 1, 3. [Google Scholar] [CrossRef]
- Bain, R.; Johnston, R.; Mitis, F.; Chatterley, C.; Slaymaker, T. Establishing sustainable development goal baselines for household drinking water, sanitation and hygiene services. Water 2018, 10, 1711. [Google Scholar] [CrossRef]
- Muchala, B. SDG Indicators Challenged by Many UN Member States. Available online: https://twn.my/title2/finance/2016/fi160305.htm (accessed on 26 December 2021).
- Bhaduri, A.; Bogardi, J.; Siddiqi, A.; Voigt, H.; Vörösmarty, C.; Pahl-Wostl, C.; Bunn, S.E.; Shrivastava, P.; Lawford, R.; Foster, S.; et al. Achieving sustainable development goals from a water perspective. Front. Environ. Sci. 2016, 4, 4. [Google Scholar] [CrossRef]
- United Nations Economic and Social Council. Report of the Inter Agency and Expert Group on Sustainable Development Goal Indicators: Items for Discussion and Decision: Data and Indicators for the 2030 Sustainable Development Agenda E/CN.3/2016/2, 2016. Available online: https://undocs.org/en/E/CN.3/2016/2 (accessed on 25 December 2021).
- United Nations. SDG Indicators: Global Indicator Framework for the Sustainable Development Goals and Targets of the 2030 Agenda for Sustainable Development. Available online: https://unstats.un.org/sdgs/indicators/indicators-list/ (accessed on 7 September 2021).
- UN Water. Roles and Responsibilities SDG Monitoring and Reporting. Available online: https://www.sdg6monitoring.org/activities/roles-and-responsibilities/ (accessed on 26 December 2021).
- Dickens, C.; Smakhtin, V.; McCartney, M.; O’Brien, G.; Dahir, L. Defining and Quantifying National-Level Targets, Indicators and Benchmarks for Management of Natural Resources to Achieve the Sustainable Development Goals. Sustainability 2019, 11, 462. [Google Scholar] [CrossRef]
- Banks, L.M.; White, S.; Biran, A.; Wilbur, J.; Neupane, S.; Sharma, A.; Kuper, H. Are current approaches for measuring access to clean water and sanitation inclusive of people with disabilities? Comparison of individual-And household-level access between people with and without disabilities in the Tanahun district of Nepal. PLoS ONE 2019, 14, e0223557. [Google Scholar] [CrossRef]
- Baquero, O.F.; Gallego-Ayala, J.; Giné-Garriga, R.; de Palencia, A.-F.; Pérez-Foguet, A. The Influence of the Human Rights to Water and Sanitation Normative Content in Measuring the Level of Service. Soc. Indic. Res. 2017, 133, 763–786. [Google Scholar] [CrossRef]
- Ezbakhe, F.; Gine-Garriga, R.; Pérez-Foguet, A. Leaving no one behind: Evaluating access to water, sanitation and hygiene for vulnerable and marginalized groups. Sci. Total Environ. 2019, 683, 537–546. [Google Scholar] [CrossRef]
- Vanham, D.; Hoekstra, A.Y.; Wada, Y.; de Bouraoui, F.; Roo, A.; Mekonnen, M.M.; van de Bund, W.J.; Batelaan, O.; Pavelic, P.; Bastiaanssen, W.; et al. Physical water scarcity metrics for monitoring progress towards SDG target 6.4: An evaluation of indicator 6.4.2 “Level of water stress”. Sci. Total Environ. 2018, 613–614, 218–232. [Google Scholar] [CrossRef]
- Farinosi, F.; Giupponi, C.; Reynaud, A.; Ceccherini, G.; Carmona-Moreno, C.; de Roo, A.; Gonzalez-Sanchez, D.; Bidoglio, G. An innovative approach to the assessment of hydro-political risk: A spatially explicit, data driven indicator of hydro-political issues. Glob. Environ. Chang. 2018, 52, 286–313. [Google Scholar] [CrossRef]
- Varady, R.G.; Zuniga-Teran, A.A.; Garfin, G.M.; Martín, F.; Vicuña, S. Adaptive management and water security in a global context: Definitions, concepts, and examples. Curr. Opin. Environ. Sustain. 2016, 21, 70–77. [Google Scholar] [CrossRef]
- McCracken, M.; Meyer, C. Monitoring of transboundary water cooperation: Review of Sustainable Development Goal Indicator 6.5.2 methodology. J. Hydrol. 2018, 563, 1–12. [Google Scholar] [CrossRef]
- Jiang, Z.; Jiang, W.; Ling, Z.; Wang, X.; Peng, K.; Wang, C. Surface water extraction and dynamic analysis of baiyangdian lake based on the google earth engine platform using sentinel-1 for reporting sdg 6.6.1 indicators. Water 2021, 13, 138. [Google Scholar] [CrossRef]
- Miletto, M.; Pangare, V.; Thuy, L.; Piccione, P. Gender-Responsive Indicators to Close the Sex-Disaggregated Water Data Gap. In Advances in Geoethics and Groundwater Management: Theory and Practice for a Sustainable Development; Abrunhosa, M., Chambel, A., Peppoloni, S., Chaminé, H.I., Eds.; Springer International Publishing: Berlin/Heidelberg, Germany, 2021; pp. 381–383. ISBN 978-3-030-59319-3. [Google Scholar]
- Fraisl, D.; Campbell, J.; See, L.; Wehn, U.; Wardlaw, J.; Gold, M.; Moorthy, I.; Arias, R.; Piera, J.; Oliver, J.L.; et al. Mapping citizen science contributions to the UN sustainable development goals. Sustain. Sci. 2020, 15, 1735–1751. [Google Scholar] [CrossRef]
- Körfgen, A.; Förster, K.; Glatz, I.; Maier, S.; Becsi, B.; Meyer, A.; Kromp-Kolb, H.; Stötter, J. It’s a Hit! Mapping Austrian Research Contributions to the Sustainable Development Goals. Sustainability 2018, 10, 3295. [Google Scholar] [CrossRef]
- UniNEtZ. UniNEtZ: Universitäten und Nachhaltige Entwicklungsziele. Available online: https://www.uninetz.at/en/ (accessed on 13 December 2021).
- Organisation for Economic Co-Operation and Development. Country Profile of Austria. Available online: https://data.oecd.org/austria.htm (accessed on 14 December 2021).
- EUROSTAT. EUROSTAT Database. Available online: https://ec.europa.eu/eurostat/web/main/data/database (accessed on 14 December 2021).
- WHO/UNICEF. Joint Monitoring Programme for Water Supply, Sanitation and Hygiene (JMP). Available online: https://washdata.org/ (accessed on 10 December 2021).
- UNICEF. Guidance for Monitoring Menstrual Health and Hygiene, New York, 2020. Available online: https://washdata.org/monitoring/menstrual-health (accessed on 10 December 2021).
- UN Water. SDG 6 Snapshot in Austria. Available online: https://sdg6data.org/country-or-area/Austria (accessed on 8 December 2021).
- Miletto, M.; Pangare, V.; Thuy, L. Tool 1—Gender-Responsive Indicators for Water Assessment, Monitoring and Reporting: UNESCO WWAP Toolkit on Sex-Disaggregated Water Data; UNESCO: Paris, France, 2019; ISBN 978-92-3-100325-7. [Google Scholar]
- United Nations Economic and Social Council. Report of the Inter-Agency and Expert Group on Sustainable Development Goal Indicators: Items for Discussion and Decision: Data and Indicators for the 2030 Agenda for Sustainable Development E/CN.3/2017/2, 2017. Available online: https://undocs.org/en/E/CN.3/2017/2 (accessed on 10 December 2021).
- United Nations General Assembly. Report of the Special Rapporteur on the Human Right to Safe Drinking Water and Sanitation, Catarina de Albuquerque A/HRC/18/33, 2011. Available online: https://undocs.org/A/HRC/18/33 (accessed on 11 December 2021).
- European Commission. Indicators to Measure Social Protection Performance: Implications for EC Programming, Tools and Methods Series; European Union: Brussels, Belgium, 2017; ISBN 978-92-79-64611-9. [Google Scholar]
- World Health Organization. Sustainable Development Goals and Universal Health Coverage Regional Monitoring Framework: Applications, Analysis and Technical Information; WHO: Manila, Philippines, 2017; ISBN 978 92 9061 837 9. [Google Scholar]
- United Nations Children’s Fund; World Health Organization. The Measurement and Monitoring of Water Supply, Sanitation and Hygiene (WASH) Affordability: A Missing Element of Monitoring of Sustainable Development Goal (SDG) Targets 6.1 and 6.2; WHO: New York, NY, USA, 2021; ISBN 978-92-400-2328-4.
- United Nations General Assembly. Human Rights to Water and Sanitation in Spheres of Life beyond the Household with an Emphasis on Public Spaces: Report of the Special Rapporteur on the Human Rights to Safe Drinking Water and Sanitation A/HRC/42/47, 2019. Available online: https://undocs.org/en/A/HRC/42/47 (accessed on 11 December 2021).
- Cetrulo, T.B.; Marques, R.C.; Malheiros, T.F.; Cetrulo, N.M. Monitoring inequality in water access: Challenges for the 2030 Agenda for Sustainable Development. Sci. Total Environ. 2020, 727, 138746. [Google Scholar] [CrossRef]
- Federal Ministry of Agriculture, Regions and Tourism. Trinkwasserversorgung der Bevölkerung. Available online: https://info.bmlrt.gv.at/themen/wasser/nutzung-wasser/wasserversorgung/versorgung.html (accessed on 8 December 2021).
- Adams, E.A.; Smiley, S.L. Urban-rural water access inequalities in Malawi: Implications for monitoring the Sustainable Development Goals. Nat. Resour. Forum 2018, 42, 217–226. [Google Scholar] [CrossRef]
- Saladini, F.; Betti, G.; Ferragina, E.; Bouraoui, F.; Cupertino, S.; Canitano, G.; Gigliotti, M.; Autino, A.; Pulselli, F.M.; Riccaboni, A.; et al. Linking the water-energy-food nexus and sustainable development indicators for the Mediterranean region. Ecol. Indic. 2018, 91, 689–697. [Google Scholar] [CrossRef]
- Cole, M.J.; Bailey, R.M.; Cullis, J.; New, M.G. Water for sustainable development in the Berg Water Management Area, South Africa. S. Afr. J. Sci. 2018, 114, 114. [Google Scholar] [CrossRef]
- Österreichische Vereinigung für das Gas- und Wasserfach. Die Österreichische Trinkwasserwirtschaft-Branchendaten und Fakten, Vienna, 2018. Available online: https://www.ovgw.at/wasser/ressource/ (accessed on 30 June 2021).
- Österreichische Vereinigung für das Gas- und Wasserfach. Klar, Frisch, Wohlschmeckend: Bestnoten für Österreichs Trinkwasserversorgung. Available online: https://www.ots.at/presseaussendung/OTS_20210518_OTS0129/klar-frisch-wohlschmeckend-bestnoten-fuer-oesterreichs-trinkwasserversorgung-bild (accessed on 25 December 2021).
- EUROSTAT. Population Connected to Public Water Supply. Available online: https://appsso.eurostat.ec.europa.eu/nui/show.do?dataset=env_wat_pop&lang=en (accessed on 8 December 2021).
- Woetzel, J.; Garemo, N.; Mischke, J.; Hjerpe, M.; Palter, R. Bridging-Global-Infrastructure-Gaps. Available online: https://www.mckinsey.com/business-functions/operations/our-insights/bridging-global-infrastructure-gaps (accessed on 25 December 2021).
- Amerstorfer, A.; Götz, G.; Heidler, S.; Herco, S.; Hörtenhuber, A.; Laber, J.; Müller, B.; Breindl, D.; Grieb, W.; Steinbacher, K.; et al. Umweltinvestitionen des Bundes: Maßnahmen der Wasserwirtschaft 2019, 2020. Available online: https://info.bmlrt.gv.at/service/publikationen/wasser/Umweltinvestitionen-des-Bundes---Massnahmen-der-Wasserwirtschaft-2019.html (accessed on 10 December 2021).
- Verordnung des Bundesministers für Soziale Sicherheit und Generationen über die Qualität von Wasser für den Menschlichen Gebrauch: Trinkwasserverordnung-TWV, 2001. Available online: https://www.ris.bka.gv.at/GeltendeFassung.wxe?Abfrage=Bundesnormen&Gesetzesnummer=20001483 (accessed on 25 December 2021).
- Bundesministerium Arbeit, Soziales, Gesundheit und Konsumentenschutz. Österreichischer Trinkwasserbericht 2017: Bericht der Bundesministerin für Arbeit, Soziales, Gesundheit und Konsumentenschutz über die Qualität von Wasser für den Menschlichen Gebrauch (Trinkwasser) zur Information der Verbraucherinnen und Verbraucher, 2017. Available online: https://www.verbrauchergesundheit.gv.at/lebensmittel/trinkwasser/Trinkwasserbericht.html (accessed on 9 December 2021).
- European Commission. Report from the Commission: Synthesis Report on the Quality of Drinking Water in the Union Examining Member States’ Reports for the 2011–2013 Period, Foreseen under Article 13(5) of Directive 98/83/EC COM(2016) 666 Final. Available online: https://eur-lex.europa.eu/legal-content/EN/TXT/PDF/?uri=CELEX:52016DC0666&from=EN (accessed on 9 December 2021).
- Organisation for Economic Co-operation and Development. Gross Domestic Product (GDP). Available online: https://data.oecd.org/gdp/gross-domestic-product-gdp.htm#indicator-chart (accessed on 9 December 2021).
- Renner, S.; Bok, L.; Igloi, N.; Linou, N. What Does it Mean to Leave No One behind?: A UNDP Discussion Paper and Framework for Implementation, 2018. Available online: https://www.undp.org/publications/what-does-it-mean-leave-no-one-behind#modal-publication-download (accessed on 8 December 2021).
- Turman-Bryant, N.; Clasen, T.F.; Fankhauser, K.; Thomas, E.A. Measuring progress towards sanitation and hygiene targets: A critical review of monitoring methodologies and technologies. Waterlines 2018, 37, 229–247. [Google Scholar] [CrossRef]
- Tilley, E.; Ulrich, L.; Lüthi, C.; Reymond, P.; Zurbrügg, C. Compendium of Sanitation Systems and Technologies, 2nd ed.; EAWAG: Dübendorf, Switzerland, 2014; ISBN 978-3-906484-57-0. [Google Scholar]
- Spuhler, D.; Scheidegger, A.; Maurer, M. Generation of sanitation system options for urban planning considering novel technologies. Water Res. 2018, 145, 259–278. [Google Scholar] [CrossRef]
- Sustainable Sanitation Alliance. Towards More Sustainable Sanitation Solutions-SuSanA Vision Document 2008. Available online: https://www.susana.org/en/knowledge-hub/resources-and-publications/library/details/267 (accessed on 25 December 2021).
- Statistik Austria. Ziel 06–Sauberes Wasser und Sanitäreinrichtungen–Indikatoren: Verfügbarkeit und Nachhaltige Bewirtschaftung von Wasser und Sanitärversorgung für Alle Gewährleisten, 2020. Available online: https://www.statistik.at/web_de/statistiken/internationales/agenda2030_sustainable_development_goals/un-agenda2030_monitoring/index.html (accessed on 13 December 2021).
- World Health Organization. UN-HABITAT. Progress on Safe Treatment and Use of Wastewater: Piloting the Monitoring Methodology and Initial Findings for SDG Indicator 6.3.1; World Health Organization: Geneva, Switzerland, 2018; ISBN 978-92-4-151489-7. [Google Scholar]
- Österreichischer Behindertenrat. Eurokey. Available online: https://www.behindertenrat.at/euro-key/ (accessed on 24 June 2021).
- Suchthilfe Wien. Tätigkeitsbericht 2020: Mobile Soziale Arbeit im Öffentlichen Raum, 2020. Available online: https://www.suchthilfe.wien/2/taetigkeitsberichte/ (accessed on 24 June 2021).
- Österreichischer Wasser- und Abfallwirtschaftsverband. Branchenbild der Österreichischen Abwasserwirtschaft 2020, 2019. Available online: https://www.oewav.at/upload/medialibrary/oewav_bb_2020_gesamt_DL.pdf (accessed on 24 June 2021).
- EUROSTAT. Share of Total Population Not Having Indoor Flushing Toilet for the Sole Use of Their Household. Available online: https://appsso.eurostat.ec.europa.eu/nui/show.do?dataset=tessi294&lang=en (accessed on 28 December 2021).
- EUROSTAT. Share of Total Population Having Neither a Bath, Nor a Shower in Their Dwelling. Available online: https://appsso.eurostat.ec.europa.eu/nui/show.do?dataset=tessi293&lang=en (accessed on 28 December 2021).
- EUROSTAT. Population Having Neither a Bath, Nor a Shower, Nor Indoor Flushing Toilet in Their Household by Poverty Status. Available online: https://ec.europa.eu/eurostat/databrowser/view/sdg_06_10/default/table?lang=en (accessed on 28 December 2021).
- Organisation for Economic Co-Operation and Development. Transport Infrastructure Investment and Maintenance Spending. Available online: https://stats.oecd.org/Index.aspx?DataSetCode=ITF_INV-MTN_DATA (accessed on 24 June 2021).
- UN Water. Sustainable Development Goal 6—Synthesis Report 2018 on Water and Sanitation; United Nations (UN): New York, NY, USA, 2018; ISBN 978-92-1-101370-2. [Google Scholar]
- Hoekstra, A.Y.; Buurman, J.; van Ginkel, K.C.H. Urban water security: A review. Environ. Res. Lett. 2018, 13, 53002. [Google Scholar] [CrossRef]
- EUROSTAT. SDG 6—Clean Water and Sanitation: Ensure Availability and Sustainable Management of Water and Sanitation for All. Available online: https://ec.europa.eu/eurostat/statistics-explained/index.php?title=SDG_6_-_Clean_water_and_sanitation (accessed on 26 December 2021).
- Verordnung des Bundesministers für Land- und Forstwirtschaft über die Allgemeine Begrenzung von Abwasseremissionen in Fließgewässer und Öffentliche Kanalisationen: Allgemeine Abwasseremissionsverordnung–AAEV. Available online: https://www.ris.bka.gv.at/GeltendeFassung.wxe?Abfrage=Bundesnormen&Gesetzesnummer=10010977 (accessed on 25 December 2021).
- Oftner, M.; Lenz, K.; Zieritz, I. Kommunales Abwasser: Österreichischer Bericht 2020. Available online: https://info.bmlrt.gv.at/themen/wasser/wasser-eu-international/europaeische-und-internationale-wasserwirtschaft/berichte/lagebericht_2020.html (accessed on 16 December 2021).
- Langergraber, G.; Pressl, A.; Kretschmer, F.; Weissenbacher, N. Small wastewater treatment plants in Austria—Technologies, management and training of operators. Ecol. Eng. 2018, 120, 164–169. [Google Scholar] [CrossRef]
- Hoekstra, A.Y.; Chapagain, A.; van Oel, P. Advancing Water Footprint Assessment Research: Challenges in Monitoring Progress towards Sustainable Development Goal 6. Water 2017, 9, 438. [Google Scholar] [CrossRef]
- Mekonnen, M.M.; Hoekstra, A.Y. National Water Footprint Accounts: The Green, Blue and Grey Water Footprint of Production and Consumption; Value of Water Research Report Series No. 50, Delft, The Netherlands, 2011. Available online: https://research.utwente.nl/en/publications/national-water-footprint-accounts-the-green-blue-and-grey-water-f (accessed on 30 June 2021).
- Organisation for Economic Co-operation and Development. Nutrient Balance (Indicator); OECD: Paris, France, 2021. [Google Scholar]
- Egle, L.; Zoboli, O.; Thaler, S.; Rechberger, H.; Zessner, M. The Austrian P budget as a basis for resource optimization. Resour. Conserv. Recycl. 2014, 83, 152–162. [Google Scholar] [CrossRef]
- Neugebauer, G.; Kretschmer, F.; Kollmann, R.; Narodoslawsky, M.; Ertl, T.; Stoeglehner, G. Mapping Thermal Energy Resource Potentials from Wastewater Treatment Plants. Sustainability 2015, 7, 12988–13010. [Google Scholar] [CrossRef]
- Federal Ministry for Climate Action, Environment, Energy, Mobility, Innovation and Technology. Die Bestandsaufnahme der Abfallwirtschaft in Österreich: Statusbericht 2021 (Referenzjahr 2019), 2021. Available online: https://www.umweltbundesamt.at/umweltthemen/abfall/abfallaufkommen (accessed on 13 December 2021).
- Lindtner, S.; Hnatek, V. Leistungsnachweise der ÖWAV-Kläranlagen-Nachbarschaften: Betriebsjahr 2020, 2021. Available online: https://www.oewav.at/KAN/Unterlagen/KAN-Leistungsnachweise (accessed on 16 December 2021).
- EUROSTAT. Area under Organic Farming. Available online: https://ec.europa.eu/eurostat/databrowser/view/t2020_rn120/default/table (accessed on 13 December 2021).
- Environment Agency Austria. Abfallwirtschaftliche Daten. Available online: https://www.umweltbundesamt.at/umweltthemen/abfall/abfall-daten (accessed on 13 December 2021).
- Directive 2000/60/EC of the European Parliament and of the Council of 23 October 2000 Establishing a Framework for Community Action in the Field of Water Policy: Water Framework Directive-WFD. Available online: https://eur-lex.europa.eu/legal-content/EN/TXT/?uri=CELEX:32000L0060 (accessed on 13 December 2021).
- Bundesministerium für Land- und Forstwirtschaft, Umwelt und Wasserwirtschaft. Nationaler Gewässerbewirtschaftungsplan (NGP)-2015. Available online: https://info.bmlrt.gv.at/themen/wasser/wasser-oesterreich/wasserrecht_national/planung/NGP-2015.html (accessed on 1 July 2021).
- Bundesministerium für Landwirtschaft, Regionen und Tourismus; Umweltbundesamt. Wassergüte in Österreich-Jahresbericht (2016–2018): Überwachung des Gewässerzustands Gemäß GZÜV (BGBl. II Nr. 479/2006 i.d.F. BGBl. II Nr. 128/2019. Available online: https://info.bmlrt.gv.at/themen/wasser/wasserqualitaet/jahresbericht_2016-2018.html (accessed on 27 December 2021).
- European Environment Agency. Country Report: Austrian Bathing Water Quality in 2020. Available online: https://www.eea.europa.eu/themes/water/europes-seas-and-coasts/assessments/state-of-bathing-water (accessed on 27 December 2021).
- Amann, A.; Weber, N.; Krampe, J.; Rechberger, H.; Zoboli, O.; Zessner, M. Operation and Performance of Austrian Wastewater and Sewage Sludge Treatment as a Basis for Resource Optimization. Water 2021, 13, 2998. [Google Scholar] [CrossRef]
- Kretschmer, F.; Neugebauer, G.; Stoeglehner, G.; Ertl, T. Participation as a Key Aspect for Establishing Wastewater as a Source of Renewable Energy. Energies 2018, 11, 3232. [Google Scholar] [CrossRef]
- Lindinger, H.; Grath, J.; Brielmann, H.; Schönbauer, A.; Gattringer, I.; Formanek, C.; Broer, M.; Rosmann, T.; Holler, C.; Szerencsits, M.; et al. Wasserschatz Österreichs: Grundlagen für Nachhaltige Nutzungen des Grundwassers. Hintergrunddokument. Available online: https://info.bmlrt.gv.at/themen/wasser/nutzung-wasser/wasserschatz-oesterreichs-studie.html (accessed on 22 October 2021).
- Neunteufel, R.; Schmidt, B.-J.; Perfler, R. Ressourcenverfügbarkeit und Bedarfsplanung auf Basis geänderter Rahmenbedingungen. Österr Wasser- Abfallw 2017, 69, 214–224. [Google Scholar] [CrossRef][Green Version]
- Langergraber, G.; Germann, V. Sauberes Wasser und Sanitärversorgung SDG06. In UniNEtZ-Optionenbericht: Österreichs Handlungsoptionen zur Umsetzung der UN-Agenda 2030 für eine lebenswerte Zukunft; Allianz Nachhaltige Universitäten in Österreich, Ed.; UniNEtZ: Vienna, Austria, 2021. [Google Scholar]
- Gain, A.K.; Giupponi, C.; Wada, Y. Measuring global water security towards sustainable development goals. Environ. Res. Lett. 2016, 11, 124015. [Google Scholar] [CrossRef]
- Hellegers, P.; van Halsema, G. SDG indicator 6.4.1 “Change in water use efficiency over time”: Methodological flaws and suggestions for improvement. Sci. Total Environ. 2021, 801, 149431. [Google Scholar] [CrossRef]
- Giupponi, C.; Gain, A.K.; Farinosi, F. Spatial assessment of water use efficiency (SDG Indicator 6.4.1) for regional policy support. Front. Environ. Sci. 2018, 6, 6. [Google Scholar] [CrossRef]
- Cole, M.J.; Bailey, R.M.; Cullis, J.; New, M.G. Spatial inequality in water access and water use in South Africa. Water Policy 2018, 20, 37–52. [Google Scholar] [CrossRef]
- Baubekova, A.; Kvasha, A. Implementing water-related sustainable development goals. In The Aral Sea Basin; Taylor & Francis Group: Abingdon, UK, 2019; pp. 197–221. [Google Scholar]
- Chapagain, A.K. Water Footprint: State of the Art: What, Why, and How? Encyclopedia of Sustainable Technologies; Elsevier: Oxford, UK, 2017; pp. 153–163. [Google Scholar]
- Vallino, E.; Ridolfi, L.; Laio, F. Measuring economic water scarcity in agriculture: A cross-country empirical investigation. Environ. Sci. Policy 2020, 114, 73–85. [Google Scholar] [CrossRef]
- Nhamo, L.; Mabhaudhi, T.; Mpandeli, S.; Dickens, C.; Nhemachena, C.; Senzanje, A.; Naidoo, D.; Liphadzi, S.; Modi, A.T. An integrative analytical model for the water-energy-food nexus: South Africa case study. Environ. Sci. Policy 2020, 109, 15–24. [Google Scholar] [CrossRef]
- Baggio, G.; Qadir, M.; Smakhtin, V. Freshwater availability status across countries for human and ecosystem needs. Sci. Total Environ. 2021, 792, 148230. [Google Scholar] [CrossRef]
- Vanham, D.; Mekonnen, M.M. The scarcity-weighted water footprint provides unreliable water sustainability scoring. Sci. Total Environ. 2021, 756, 143992. [Google Scholar] [CrossRef]
- Kölbl, J.; Theuretzbacher-Fritz, H.; Neunteufel, R.; Perfler, R.; Gangl, G.; Kainz, H.; Haberl, R. Experiences with Water Loss PIs in the Austrian Benchmarking Project; Proceedings Water Loss: Bukarest, Romania, 2007. [Google Scholar]
- Fuchs-Hanusch, D. Betrieb, Instandhaltung und Entwicklung der siedlungswasserwirtschaftlichen Infrastrukturnetze: Herausforderungen im 21. Jahrhundert. In "Zukunft denken"-Wasserwirtschaft 2035; Österreichischer Wasser- und Abfallwirtschaftsverband, Ed.; Der Österreichische Wasser- und Abfallwirtschaftsverband (ÖWAV): Wien, Austria, 2015; pp. 65–72. ISBN 978-3-902978-46-2. [Google Scholar]
- UN Water. Progress on Level of Water Stress. Available online: https://sdg6data.org/indicator/6.4.2 (accessed on 28 December 2021).
- Whitcraft, A.K.; Becker-Reshef, I.; Justice, C.O.; Gifford, L.; Kavvada, A.; Jarvis, I. No pixel left behind: Toward integrating Earth Observations for agriculture into the United Nations Sustainable Development Goals framework. Remote Sens. Environ. 2019, 235, 111470. [Google Scholar] [CrossRef]
- Qian, X.-Y.; Liang, Q.-M. Sustainability evaluation of the provincial water-energy-food nexus in China: Evolutions, obstacles, and response Strategies. Sustain. Cities Soc. 2021, 75, 103332. [Google Scholar] [CrossRef]
- European Environment Agency. Use of Freshwater Resources in Europe. Available online: https://www.eea.europa.eu/data-and-maps/indicators/use-of-freshwater-resources-3/assessment-4 (accessed on 18 December 2021).
- Neunteufel, R.; Sinemus, N.; Grunert, M. Virtuelles Wasser 2021: Wasserfußabdruck-der Wasserverbrauch für Güter des Täglichen Bedarfs. Available online: https://info.bmlrt.gv.at/themen/wasser/foerderungen/virtuelles-wasser-wasserfussabdruck.html (accessed on 19 December 2021).
- Vanham, D. Der Wasserfußabdruck Österreichs: Wie viel Wasser nützen wir tatsächlich, und woher kommt es? Österreichische Wasser- Abfallwirtschaft 2012, 64, 267–276. [Google Scholar] [CrossRef]
- De Chaisemartin, M. Measuring transboundary water cooperation within the framework of Agenda 2030: A proposal for a revision of SDG Indicator 6.5.2. Water Int. 2020, 45, 60–78. [Google Scholar] [CrossRef]
- Benson, D.; Gain, A.K.; Giupponi, C. Moving beyond water centricity? Conceptualizing integrated water resources management for implementing sustainable development goals. Sustain. Sci. 2020, 15, 671–681. [Google Scholar] [CrossRef]
- Giupponi, C.; Gain, A.K. Integrated spatial assessment of the water, energy and food dimensions of the Sustainable Development Goals. Reg. Environ. Chang. 2017, 17, 1881–1893. [Google Scholar] [CrossRef]
- Mohammadpour, P.; Mahjabin, T.; Fernandez, J.; Grady, C. From national indices to regional action-An Analysis of food, energy, water security in Ecuador, Bolivia, and Peru. Environ. Sci. Policy 2019, 101, 291–301. [Google Scholar] [CrossRef]
- Zhang, P.; Cai, Y.P.; Zhou, Y.; Tan, Q.; Li, B.W.; Li, B.; Jia, Q.P.; Yang, Z.F. Quantifying the water-energy-food nexus in Guangdong, Hong Kong, and Macao regions. Sustain. Prod. Consum. 2022, 29, 188–200. [Google Scholar] [CrossRef]
- Bidoglio, G.; Vanham, D.; Bouraoui, F.; Barchiesi, S. The water-energy-food-ecosystems (WEFE) nexus. Encycl. Ecol. 2018, 4, 459–466. [Google Scholar]
- Bertule, M.; Glennie, P.; Bjørnsen, P.K.; Lloyd, G.J.; Kjellen, M.; Dalton, J.; Rieu-Clarke, A.; Romano, O.; Tropp, H.; Newton, J.; et al. Monitoring water resources governance progress globally: Experiences from monitoring SDG indicator 6.5.1 on integrated water resources management implementation. Water 2018, 10, 1744. [Google Scholar] [CrossRef]
- OECD Water Governance Indicator Framework, 2018. Available online: http://oe.cd/water-gov (accessed on 20 December 2021).
- Onencan, A.M.; Enserink, B.; van de Walle, B. Sustainability indicators: Monitoring cross-county water cooperation in the Nzoia river basin, Kenya. Sustainability 2019, 11, 560. [Google Scholar] [CrossRef]
- Hussein, H.; Menga, F.; Greco, F. Monitoring transboundary water cooperation in SDG 6.5.2: How a critical hydropolitics approach can spot inequitable outcomes. Sustainability 2018, 10, 3640. [Google Scholar] [CrossRef]
- Yalew, S.G.; Kwakkel, J.; Doorn, N. Distributive Justice and Sustainability Goals in Transboundary Rivers: Case of the Nile Basin. Front. Environ. Sci. 2021, 8, 281. [Google Scholar] [CrossRef]
- Mukuyu, P.; Lautze, J.; Rieu-Clarke, A.; Saruchera, D.; McCartney, M. The devil’s in the details: Data exchange in transboundary waters. Water Int. 2020, 45, 884–900. [Google Scholar] [CrossRef]
- Srebotnjak, T.; Carr, G.; de Sherbinin, A.; Rickwood, C. A global Water Quality Index and hot-deck imputation of missing data. Ecol. Indic. 2012, 17, 108–119. [Google Scholar] [CrossRef]
- Organisation for Economic Co-Operation and Development. OECD Regulatory Policy Outlook 2021: Austria Country Profile. Available online: https://www.oecd.org/gov/regulatory-policy/country-profiles-oecd-regulatory-policy-outlook-2021-2018-2015.htm (accessed on 23 December 2021).
- Worldbank. Worldwide Governance Indicators. Available online: https://info.worldbank.org/governance/wgi/Home/Reports (accessed on 23 December 2021).
- Statistik Austria. Ergebnisse im Überblick: Tertiärquote der 30- bis 34-Jährigen, 2021. Available online: https://www.statistik.at/web_de/statistiken/menschen_und_gesellschaft/bildung/bildungsindikatoren/tertirquote/index.html (accessed on 24 December 2021).
- EUROSTAT. Eco-Innovation Index. Available online: https://ec.europa.eu/eurostat/en/web/products-datasets/product?code=t2020_rt200 (accessed on 28 December 2021).
- Center for Hazards and Risk Research-CHRR-Columbia University; Center for International Earth Science Information Network-CIESIN-Columbia University. Global Flood Hazard Frequency and Distribution; NASA Socioeconomic Data and Applications Center (SEDAC): Palisades, NY, USA, 2005. [Google Scholar] [CrossRef]
- Wada, Y.; van Beek, L.P.H.; Wanders, N.; Bierkens, M.F.P. Human water consumption intensifies hydrological drought worldwide. Environ. Res. Lett. 2013, 8, 34036. [Google Scholar] [CrossRef]
- World Resources Institute. Aqueduct Global Flood Risk Country Rankings. Available online: https://www.wri.org/data/aqueduct-global-flood-risk-country-rankings (accessed on 28 December 2012).
- Organisation for Economic Co-Operation and Development. Financing Water Supply, Sanitation and Flood Protection: Country Fact Sheet. Available online: https://www.oecd.org/publications/financing-water-supply-sanitation-and-flood-protection-6893cdac-en.htm (accessed on 28 December 2021).
- Umweltbundesamt. Treibhausgase. Available online: https://www.umweltbundesamt.at/klima/treibhausgase (accessed on 29 December 2021).
- Umweltbundesamt. Erneuerbare Energie. Available online: https://www.umweltbundesamt.at/energie/erneuerbare-energie (accessed on 28 December 2021).
- Statistik Austria. Gesamtenergiebilanz Österreich 1970 bis 2020 (Detailinformation). Available online: https://www.statistik.at/web_de/statistiken/energie_umwelt_innovation_mobilitaet/energie_und_umwelt/energie/energiebilanzen/index.html (accessed on 28 December 2021).
- ND-GAIN. ND-GAIN Country Index. Available online: https://gain.nd.edu/our-work/country-index/rankings/ (accessed on 28 December 2021).
- Transboundary Waters Assessment Programme. Transboundary Waters Assessment Programme: River Basins (RB) Assessment. Data Portal. Available online: http://twap-rivers.org/indicators/ (accessed on 23 December 2021).
- The European Parliament and the Council of the European Union. Directive 2007/60/EC of the European Parliament and of the Council of 23 October 2007 on the Assessment and Management of Flood Risks: Floods Directive. Off. J. Eur. Union 2007, 288, 27–34.
- Leis, J.-L.; Kienberger, S. Climate Risk and Vulnerability Assessment of Floods in Austria: Mapping Homogenous Regions, Hotspots and Typologies. Sustainability 2020, 12, 6458. [Google Scholar] [CrossRef]
- Simperler, L.; Himmelbauer, P.; Ertl, T.; Stoeglehner, G. Prioritization of stormwater management sites in urban areas. J. Environ. Manag. 2020, 265, 110507. [Google Scholar] [CrossRef]
- Simperler, L.; Kretschmer, F.; Ertl, T. A methodical framework for analysing the cause of urban pluvial flooding in a hillside settlement. Water Sci. Technol. 2019, 79, 1798–1807. [Google Scholar] [CrossRef] [PubMed]
- Kleidorfer, M.; Tscheikner-Gratl, F.; Vonach, T.; Rauch, W. What can we learn from a 500-year event? Experiences from urban drainage in Austria. Water Sci. Technol. 2018, 77, 2146–2154. [Google Scholar] [CrossRef]
- Blöschl, G.; Parajka, J.; Blaschke, A.P.; Hofstätter, M.; Haslinger, K.; Schöner, W. Klimawandel in der Wasserwirtschaft–Schwerpunkt Hochwasser, Dürre und Trockenheit: Follow up zur ZAMG/TU-WIEN STUDIE (2011) Anpassungsstrategien an den Klimawandel für Österreichs für Österreichs Wasserwirtschaft im Autrag von Bund und Ländern. Available online: https://info.bmlrt.gv.at/service/publikationen/wasser/Klimawandel-in-der-Wasserwirtschaft---Zusammenfassung1.html (accessed on 1 July 2021).
- Forio, M.A.; Goethals, P.L. An Integrated Approach of Multi-Community Monitoring and Assessment of Aquatic Ecosystems to Support Sustainable Development. Sustainability 2020, 12, 5603. [Google Scholar] [CrossRef]
- Springgay, E.; Ramirez, S.C.; Janzen, S.; Brito, V.V. The forest-water nexus: An international perspective. Forests 2019, 10, 915. [Google Scholar] [CrossRef]
- Koschorreck, M.; Downing, A.S.; Hejzlar, J.; Marcé, R.; Laas, A.; Arndt, W.G.; Keller, P.S.; Smolders, A.J.P.; van Dijk, G.; Kosten, S. Hidden treasures: Human-made aquatic ecosystems harbour unexplored opportunities. Ambio 2020, 49, 531–540. [Google Scholar] [CrossRef]
- Hakimdavar, R.; Hubbard, A.; Policelli, F.; Pickens, A.; Hansen, M.; Fatoyinbo, T.; Lagomasino, D.; Pahlevan, N.; Unninayar, S.; Kavvada, A.; et al. Monitoring water-related ecosystems with earth observation data in support of Sustainable Development Goal (SDG) 6 reporting. Remote Sens. 2020, 12, 1634. [Google Scholar] [CrossRef]
- Council Directive 92/43/EEC of 21 May 1992 on the conservation of natural habitats and of wild fauna and flora: Habitats Directive. Off. J. Eur. Union 1992, 206, 7–50.
- Organisation for Economic Co-Operation and Development. Land Cover Change in Countries and Regions. Available online: https://stats.oecd.org/Index.aspx?DataSetCode=LAND_COVER_CHANGE (accessed on 20 August 2021).
- World Resources Institute. Global Forest Watch: Forest Monitoring Designed for Action. Available online: https://www.globalforestwatch.org/ (accessed on 27 December 2021).
- Food and Agriculture Organization of the United Nations. Global Forest Resources Assessment 2015: Desk Reference; FAO: Rome, Italy, 2015; ISBN 978-92-5-108826-5. [Google Scholar]
- Organisation for Economic Co-Operation and Development. Protected Areas. Available online: https://stats.oecd.org/Index.aspx?DataSetCode=PROTECTED_AREAS (accessed on 20 August 2021).
- EUROSTAT. Natura 2000 Protected Areas. Available online: https://appsso.eurostat.ec.europa.eu/nui/submitViewTableAction.do (accessed on 27 December 2021).
- EUROSTAT. National Expenditure on Environmental Protection by Institutional Sector. Available online: https://appsso.eurostat.ec.europa.eu/nui/show.do?dataset=env_ac_epneis&lang=en (accessed on 27 December 2021).
- Scheikl, S.; Seliger, C.; Grüner, B.; Muhar, S. Ausweisung Wertvoller Gewässerstrecken in Österreich und Deren Schutzstatus. Available online: https://www.wwf.at/de/view/files/download/showDownload/?tool=12&feld=download&sprach_connect=3631#:~:text=Derzeit%20weisen%2011%25%20(328%20km,oder%20ein%20hohes%20Entwicklungspotential%20auf (accessed on 1 July 2021).
- Lazowski, W.; Schwarz, U.; Essl, F.; Götzl, M.; Peterseil, J.; Egger, G. Aueninventar Österreich: Bericht zur Bundesweiten Übersicht der Auenobjekte, 2011. Available online: https://info.bmlrt.gv.at/suchergebnisse.html?q=aueninventar (accessed on 20 August 2021).
- Convention on Wetlands of International Importance Especially as Waterfowl Habitat: Ramsar Convention on Wetlands, 1971. Available online: https://www.ramsar.org/sites/default/files/documents/library/current_convention_text_e.pdf (accessed on 23 December 2021).
- Bundesministerium für Land- und Forstwirtschaft, Umwelt und Wasserwirtschaft. Ramsar-Gebiet in Österreich, Vienna, 2014. Available online: https://info.bmlrt.gv.at/themen/wasser/wasser-eu-international/europaeische-und-internationale-wasserwirtschaft/feuchtgebiete/ramsar/ransar-gebiete-austria.html (accessed on 23 December 2021).
- Borgwardt, F.; Muhar, S.; Schmutz, S. Erhalt und Wiederherstellung der ökologischen Funktionen von Binnengewässern (inkl. Moore & Feuchtgebiete) Option 6.4. In UniNEtZ-Optionenbericht: Österreichs Handlungsoptionen zur Umsetzung der UN-Agenda 2030 für eine Lebenswerte Zukunft; Allianz Nachhaltige Universitäten: Vienna, Austria, 2021. [Google Scholar]
- Organisation for Economic Co-Operation and Development. Country Programmable Aid (CPA): Frequently Asked Questions. Available online: https://www.oecd.org/development/effectiveness/countryprogrammableaidcpafrequentlyaskedquestions.htm (accessed on 23 December 2021).
- Organisation for Economic Co-Operation and Development. Country Programmable Aid—A Provider Perspective, 2021. Available online: https://public.tableau.com/views/CPA-Donor/CPA-Donor?amp;:embed=y&:display_count=no&:showVizHome=no (accessed on 23 December 2021).
- Bundesministerium für Finanzen. Entwicklungszusammenarbeit: Übersicht Gemäß § 42 Abs. 4 BHG 2013, März 2018. Available online: https://service.bmf.gv.at/BUDGET/Budgets/2018_2019/beilagen/Entwicklungszusammenarbeit_2018_2019.pdf (accessed on 11 June 2021).
- Austrian Development Agency. Austrian Development Agency Geschäftsbericht 2012. Available online: https://www.entwicklung.at/mediathek/publikationen/berichte (accessed on 23 December 2021).
- Leroch, K. Die OEZA im Wassersektor: Presentation at Wassertag 2020. Vienna, Austria. 2020; unpublished. [Google Scholar]
- Organisation for Economic Co-Operation and Development. Grants by Private Agencies and NGOs. Available online: https://data.oecd.org/drf/grants-by-private-agencies-and-ngos.htm (accessed on 19 August 2021).
- Resolution Adopted by the General Assembly on 27 July 2015 69/313. Addis Ababa Action Agenda of the Third International Conference on Financing for Development: Addis Ababa Action Agenda; New York, 2015. Available online: https://undocs.org/A/RES/69/313 (accessed on 23 December 2021).
- Jutzi, J.-P.; Walther, P. Wirkungsbericht: Schweizer Entwicklungszusammenarbeit im Wassersektor. In Direktion für Entwicklung und Zusammenarbeit (DEZA); Staatssekretariat für Wirtschaft (SECO): Bern, Switzerland, 2008; ISBN 3-03798-085-0. [Google Scholar]
- Seidelmann, R. South-Western Towns: A Review of the Results and Sustainability of Water and Sanitation Interventions since 1996. Final Report, Wien, 2013. Available online: https://www.entwicklung.at/fileadmin/user_upload/Dokumente/Publikationen/Downloads_Laender_DivBerichte/Uganda/SW_Towns_Review_ExecutiveSummary_01.pdf (accessed on 24 June 2021).
- Mahmud, M.R.; Reba, M.N.; Yahya, N.N.; Hashim, M. Harnessing Earth Observation System for Fast-Realizing Sustainable Development Goal (SDG) on Clean Water and Sanitation; IOP Publishing: Bristol, UK, 2020. [Google Scholar]
- Quinlivan, L.; Chapman, D.V.; Sullivan, T. Applying citizen science to monitor for the Sustainable Development Goal Indicator 6.3.2: A review. Environ. Monit. Assess. 2020, 192, 218. [Google Scholar] [CrossRef] [PubMed]
- Bishop, I.J.; Warner, S.; van Noordwijk, T.; Nyoni, F.C.; Loiselle, S. Citizen science monitoring for sustainable development goal indicator 6.3.2 in England and Zambia. Sustainability 2020, 12, 10271. [Google Scholar] [CrossRef]
- Cochran, F.; Daniel, J.; Jackson, L.; Neale, A. Earth observation-based ecosystem services indicators for national and subnational reporting of the sustainable development goals. Remote Sens. Environ. 2020, 244, 111796. [Google Scholar] [CrossRef] [PubMed]
- Taylor, J.; Graham, M.; Louw, A.; Lepheana, A.; Madikizela, B.; Dickens, C.; Chapman, D.V.; Warner, S. Social change innovations, citizen science, miniSASS and the SDGs. Water Policy 2021. [Google Scholar] [CrossRef]
- UNU-INERH; UNOSD. SDG 6 Policy Support System (SDG-PSS). Available online: https://sdgpss.net/en/ (accessed on 25 December 2021).
- Resolution Adopted by the General Assembly on 6 July 2017 71/313. Work of the Statistical Commission Pertaining to the 2030 Agenda for Sustainable Development, 2017. Available online: https://undocs.org/A/RES/71/313 (accessed on 25 December 2021).

| Data Base | Search Strings/Screening Method | # of Results |
|---|---|---|
| Scopus | TITLE-ABS-KEY (“indicator*” AND “SDG*” OR “Sustainable Development Goal*” OR “Agenda 2030” OR “2030 Agenda” AND “SDG 6” OR “goal 6” OR “water and sanitation” OR “target 6*” OR “indicator 6*”) | 160 |
| TITLE-ABS-KEY (“indicator*” AND “SDG*” OR “Sustainable Development Goal*” OR “Agenda 2030” OR “2030 Agenda” AND “SDG 6” OR “goal 6” OR “target 6*” OR “indicator 6*” OR water OR sanitation) AND TITLE (water OR sanitation) | +109 | |
| Web of Science | “indicator*” AND (“SDG*” OR “Sustainable Development Goal*” OR “Agenda 2030” OR “2030 Agenda”) AND (“SDG 6” OR “goal 6” OR “target 6*” OR “indicator 6*” OR “water and sanitation”) in “topic” | +16 |
| “indicator*” AND (“SDG*” OR “Sustainable Development Goal*” OR “Agenda 2030” OR “2030 Agenda”) AND (“SDG 6” OR “goal 6” OR “target 6*” OR “indicator 6*” OR water OR sanitation) in “topic” AND TITLE (water OR sanitation) | +18 |
| Criteria | Definition |
|---|---|
| Specific | The indicator is precisely formulated. |
| Measurable | It is feasible to collect data for the indicator; the indicator is clearly defined and measurable. |
| Achievable | A target value can be specified, but does not have to be defined yet as for some indicators this might require normative considerations and extensive stakeholder discussions. |
| Relevant | The indicator can be linked to one of the SDG 6 targets or specifically addresses one of the critical aspects raised. |
| Time-bound | The indicator can be monitored at a desired frequency and allows to track changes. |
| Targets | Indicators |
|---|---|
| 6.1 By 2030, achieve universal and equitable access to safe and affordable drinking water for all | 6.1.1 Proportion of population using safely managed drinking water services |
| 6.2 By 2030, achieve access to adequate and equitable sanitation and hygiene for all and end open defecation, paying special attention to the needs of women and girls and those in vulnerable situations | 6.2.1 Proportion of population using (a) safely managed sanitation services and (b) a hand-washing facility with soap and water |
| 6.3 By 2030, improve water quality by reducing pollution, eliminating dumping and minimizing release of hazardous chemicals and materials, halving the proportion of untreated wastewater and substantially increasing recycling and safe reuse globally | 6.3.1 Proportion of domestic and industrial wastewater flows safely treated |
| 6.3.2 Proportion of bodies of water with good ambient water quality | |
| 6.4 By 2030, substantially increase water-use efficiency across all sectors and ensure sustainable withdrawals and supply of freshwater to address water scarcity and substantially reduce the number of people suffering from water scarcity | 6.4.1 Change in water-use efficiency over time |
| 6.4.2 Level of water stress: freshwater withdrawal as a proportion of available freshwater resources | |
| 6.5 By 2030, implement integrated water resources management at all levels, including through transboundary cooperation as appropriate | 6.5.1 Degree of integrated water resources management |
| 6.5.2 Proportion of transboundary basin area with an operational arrangement for water cooperation | |
| 6.6 By 2020, protect and restore water-related ecosystems, including mountains, forests, wetlands, rivers, aquifers and lakes | 6.6.1 Change in the extent of water-related ecosystems over time |
| 6.a By 2030, expand international cooperation and capacity-building support to developing countries in water- and sanitation-related activities and programmes, including water harvesting, desalination, water efficiency, wastewater treatment, recycling and reuse technologies | 6.a.1 Amount of water- and sanitation-related official development assistance that is part of a government-coordinated spending plan |
| 6.b Support and strengthen the participation of local communities in improving water and sanitation management | 6.b.1 Proportion of local administrative units with established and operational policies and procedures for participation of local communities in water and sanitation management |
| 6.1.1. | Proportion of Population Using Safely Managed Drinking Water Services 1 | 99% [41] |
|---|---|---|
| Category | Complementary Indicators | Available Data for Austria |
| Disaggregation | By age/disadvantaged [16] | n.d. |
| By gender [16,39] | n.d. | |
| By income [16,39] | n.d. | |
| Geographic location [16,51,52] | At least basic services 2: 100% (rural)/100% (urban) [39] | |
| By migratory status [18] | n.d. | |
| By race/ethnicity [18] | n.d. | |
| Accessibility | Water supply at school [16,39] | n.d. |
| Water supply at health care facilities [16,39] | n.d. | |
| Availability/ equity | Concentration index in the provision of water services (coefficient of inequality in water access ordered by income) [49] | n.d. |
| Entropy measures: Measures the detachment of the current distribution of people from different socioeconomic levels without access to current water compared to a completely perfect distribution, where a proportional fraction of people without access is present in each socioeconomic level. [49] | n.d. | |
| Atkinson index: A normative value, that includes a parameter ε, which “is linked to a social utility or willingness by individuals to accept a more equal distribution“ [49]. The “Atkinson index shows the percentage of total Water coverage that a given society would have to forego to have more equal shares of water coverage between socioeconomic levels.” [49] | n.d. | |
| Gini-index of piped water access [53] | n.d. | |
| In-depth questionnaire on WASH (water, sanitation, hygiene) level with household and individual-level indicators between people and households with and without disabilities [25] | n.d. | |
| WASH access of vulnerable and marginalized groups (persons with special physical needs, users of health facilities, users of educational facilities, users of retirement homes, prisoners, refugees, homeless people, travellers and nomadic communities, people living in housing without water and sanitation, persons without access to water and sanitation in their workplace) using, e.g., Equitable Access Score-card [27] | n.d. | |
| Female/male perceptions and concerns about the (1) availability; (2) accessibility; (3) quality (cleanliness, hygiene, water for cleaning); and (4) safety for female/male adults/children/elderly/differently abled, of water, sanitation and hygiene services in public places (such as markets, hospitals, tourist places, town squares), by geographical location in the survey area [33,42] | n.d. | |
| Female/male perceptions and concerns of the (1) availability; (2) accessibility; (3) quality (cleanliness, hygiene, water for cleaning); and (4) safety for female/male adults/children/elderly/differently abled, of water, sanitation and hygiene services in camps for refugees, migrants, asylum seekers and displaced people(s) [33,42] | n.d. | |
| Affordability | Average water bill per month in % of average income per month (target value < 4%) [15] | 0.8% [54] |
| Tariff perception [26] | 70% assess the price/performance ratio to be very adequate or adequate [55] | |
| Population connected to public water supply * | 91.8% (in 2016) [56] | |
| Infrastructure | Water-related investment * (target value: 0.6% of GDP [57]) 4 | ~247 Mio. €/year investment in drinking water supply (not specifically infrastructure) [54] (~0.05% of GDP) 3 |
| 191 Mio € environmentally relevant investments in water supply at municipal level in 2019 [58] (~0.04% of GDP) 3 | ||
| Age of infrastructure * | 1/3 of drinking water pipes is older than 40 years; 12% older than 50 years [54] | |
| Water quality | Water quality of drinking water [8,15] | According to drinking water regulation [59]: |
| excellent quality [60] | ||
| Compliance rate of quality of drinking water according to defined standards * | Microbiological parameters: 99.84% Chemical parameters: 99.9% Indicator parameters: 99.9% (2011–2013) [61] | |
| Water treatment within the household [26] | n.d. | |
| Acceptability | Satisfaction with the service [26] | 60% of respondents are very satisfied [55] |
| Water quality perception [26] | 90% of respondents assessed the water quality as very good [55] |
| 6.3.1 | Proportion of Domestic and Industrial Wastewater Flows Safely Treated | 99% [41] |
|---|---|---|
| 6.3.2 | Proportion of Bodies of Water with Good Ambient Water Quality | 82% [41] |
| Category | Complementary Indicators | Available Data for Austria |
| Single index | Secondary wastewater treatment 1 (target: 100%) [15] | 99.6% including wastewater treatment plant with PE < 50 [68,82] |
| Removal efficiency (for >50 PE) | Biological oxygen demand (BOD5): 99%; Chemical oxygen demand (COD): 95% [81] | |
| Tertiary wastewater treatment 2 (target: 100% [15]): Removal efficiency (for >50 PE) | Nitrogen: 81% [81] | |
| Phosphorus: 91% [81] | ||
| Water footprint | Grey water footprint per water resources system vs. maximum sustainable grey water footprint in that system [83] | n.d. |
| Total grey water footprint of national production * | 1033 Mm3/a (1996–2005) [84] | |
| Total grey water footprint of national consumption * | 2936.2 Mm3/a (1996–2005) [84] | |
| Internal: 748.7 Mm3/a (1996–2005) [84] | ||
| External: 2187.5 Mm3/a (1996–2005) [84] | ||
| Total grey water footprint per capita * | 998 L/cap/d (1996–2005) based on [84] | |
| Internal: 744 L/cap/d (1996–2005) based on [84] | ||
| External: 254 L/cap/d (1996–2005) based on [84] | ||
| Nutrient and energy recovery and recycling | (Gross) nutrient balance: as the difference between the nutrient inputs entering a farming system (mainly livestock manure and fertilisers) and the nutrient outputs leaving the system (the uptake of nutrients for crop and pasture production) * | Nitrogen: 32 kg/ha (2016), 46 kg/ha (2017) Phosphorus: −1 kg/ha (2016), 2 kg/ha (2017) [85] |
| Nutrient recovery (%) (target 100%) [15] | 27% of phosphorus from sewage sludge and 3% contained in animal waste are recovered [86] | |
| Wastewater to energy (target 100%) [15] | Heat potential: 3375 GWh/a (~40% of the thermal energy generated in plants without combined heat and power supply; potential reduction of 17% of the Austrian global warming potential for room heating) potential for power generation: 115.5 GWh/a [87] | |
| Awareness about wastewater (as part of wastewater reuse effectiveness index) [13] | n.d. | |
| Treatment/use of sewage sludge * | 21% agricultural reuse; 46% thermal treatment and use of waste heat; 33% other treatment (e.g., composting, mechanical-biological treatment or humification) [88] | |
| Energy intensity | Average specific energy consumption of wastewater treatment plant * | ~44 kWh/PE120/a (>50 PE ad w/o the WWTP in Vienna) [72] |
| Share of self-produced electric power at wastewater treatment plants * | 37% (from various sources including photovoltaic, digester and natural gas) [89] | |
| Interlinkages | Crops grown under wastewater (as part of wastewater reuse effectiveness index) [13] | n.d. |
| Area irrigated by wastewater (as part of wastewater reuse effectiveness index) [13] | n.d. | |
| People depending on wastewater (as part of wastewater reuse effectiveness index) [13] | n.d. | |
| Area under organic farming in percent of total agricultural land | 25.33 (2019) [90] | |
| Municipal solid waste collected (%) (target: 100%) [15] 3 | 100% (2019) [91] | |
| Municipal solid waste recycled (%) (target: 65%) [15] | Close to 60% (2019) [91] | |
| Municipal solid waste to energy (%) (target: 100%) [15] | 7% of total waste (2019) [91] | |
| Water quality | Surface water quality (target according to the EU Water Framework Directive (WFD) [92]: at least good chemical status for all water bodies) [15] | At least good: streams (in % of length): 76.7%; 57 of 62 natural lakes (>50 ha) [93] |
| Groundwater quality (target according to the WFD [92]: at least good chemical status for all water bodies) [15] | 4 of 138 groundwater bodies fail the good chemical water status [93] | |
| Ecological water quality [15] (ecological status or ecological potential) (target according to the WFD [92]: at least good ecological status or ecological potential for all water bodies) [15] | At least good: streams (in % of length): 38.5%; 55 of 62 lakes (>50 ha) [93] | |
| Pesticides in the water environment [8] | Groundwater: 40 out of 1960 measurement points are at risk [93] | |
| Biochemical oxygen demand in rivers [68] | 1.68 mg O2/L (2018) [79] | |
| Nitrate in groundwater [93] | 21.92 mg/L (2018) [79]; details are available [93,94] | |
| Phosphate in rivers [93] | 0.032 mg/L (2018) [79]; details are available [93,94] | |
| Number of monitoring sites in rivers with respective status class of physicochemical parameters | Very good/good: 70 (78%) Less than good: 20 (22%) [94] | |
| Bathing sites with excellent water quality [93] | Excellent: 255 (97.7%); Good: 5 (1.9%); Not classified: 1 (0.4%) [95] |
| 6.5.1 | Degree of Integrated Water Resources Management | 91% [41] |
|---|---|---|
| 6.5.2 | Proportion of Transboundary Basin Area with an Operational Arrangement for Water Cooperation | 100% [41] |
| Category | Complementary Indicators | Available Data for Austria |
| Interlinkage with Target 6.3 | Municipal solid waste recycled (%) [15] | see Target 6.3 (Table 6.) |
| Municipal solid waste collected (%) [15] | ||
| Municipal solid waste to energy (%) [15] | ||
| Crops grown under wastewater (% of subsistence crops) (as part of wastewater reuse effectiveness index) [13] | ||
| Area irrigated by wastewater (%) (as part of wastewater reuse effectiveness index) [13] | ||
| Awareness about wastewater (%) (as part of wastewater reuse effectiveness index) [13] | ||
| People depending on wastewater (%) (as part of wastewater reuse effectiveness index) [13] | ||
| Water quality index (Target in the Environmental Performance Index: 100 [131]) [101,120] | 75.85 (2008) [131] | |
| Interlinkage with Target 6.4 | Jobs per million cubic metres in heavily water-dependent sectors (Mm3/a) [53] | see Target 6.4 (Table 7) |
| Change in the ratio of gross economic value added by irrigated and rainfed agriculture to the volume of water consumed by rainfed and irrigated agriculture over time [102] | ||
| Yield per unit of water use/water intensity of food production [52,108,114,115] | ||
| Energy produced per unit of water used for energy production (productivity) [108] | ||
| Water leakage [15] | ||
| Municipal water losses [53] | ||
| Energy intensity of water production [115] | ||
| Annual freshwater withdrawal for agriculture [52] | ||
| Green water footprint [28,83] | ||
| Water scarcity index [101,120] | n.d. | |
| Water productivity index [120] | n.d. | |
| Participation | Environmental democracy index [120] | n.d. |
| Presence and nature of procedures for participation by female/male members of local communities in decision-making in transboundary water management; number and nature of gender-specific decisions/actions as a result of this participation [42] 2 | n.d. | |
| Gender and equity | Gender development index [120] | n.d. |
| Percentage of national, sub-national, sectoral budget allocations, and procedures for integrating gender concerns in water policy frameworks [33,42] 2 | n.d. | |
| Measures for creating public awareness regarding gender-specific content in water policy frameworks; evidence of implementation of measures [33,42] 2 | n.d. | |
| Number of female/male staff in different job positions (levels), job field, and salaries (scales) in (a) national ministries that deal with water resources, and (b) in public/private utilities and commissions for water-related services [33,42] 2 | n.d. | |
| Ecological protection | Global environmental flow requirement index [120] | Detailed assessment of residual water flows is available [93] |
| Governance | World governance index [120] | Set of (sub-)indicators available [132,133] |
| Tertiary education attainment (considered as essential for good water governance by Essex et al. [15]; target: 40% of 25–64-year-olds) [15] | 30–34-year-olds: 41.6 (2020) [134] | |
| Innovation | Eco-innovation index based on 16 sub-indicators, complements other measurement approaches of innovativeness and aims to promote a holistic view on economic, environmental and social performance (EU average = 100) * | 130 (2019) [135] |
| Vulnerability and resilience | Flood frequency index [101] | Country scale flood frequency during 1985–2003 [136] |
| Drought index [101] | 0.5° spatial resolution; Yearly value of 2012 available [137] | |
| Flood vulnerability (target: low risk) [15] | Annual flood affected population: 7163 [138] | |
| Population potentially affected in flood risk areas | 40% (2015) [139] | |
| Estimated annual average per-capita-expenditure on flood protection | 41 €/a [139] | |
| CO2 emissions [15] (target: reducing greenhouse gas emissions from 1990 levels by 20% until 2020 and by 55% until 2030) 1 | GHG emissions (2019): 79.8 Mio t CO2-equivalent (+1.8% compared to 1990 levels) [140] | |
| Renewable energy (% of total) [15] (target for Austria in 2020: 34% [141]) | 36.5% (2020) of gross final energy consumption in Austria [142] | |
| Notre Dame Readiness Index (summarizes a country’s vulnerability to climate change; target: 100) [15] | 71.7 (2019) [143] | |
| Bias due to area as metric | Proportion of volume of water with an operational arrangement for water cooperation [31] | n.d. |
| Proportion of people dependent on the resource with an operational arrangement for water cooperation [31] | n.d. | |
| Complexity of transboundary water cooperation | Scales for water cooperation (e.g., Twins) [119] | n.d. |
| Transboundary legal frameworks (target: very low risk ~ The basin legal framework is guided by key principles of international water law to a very strong degree) [15,101,144] | Danube and Rhine: Very low, Elbe: High [144] | |
| Transboundary political tensions (target: very low risk ~ The levels of potential hydro-political tension due to basin development in absence of institutional capacity are very low) [101] | Danube and Elbe: Moderate; Rhine: Very low [144] | |
| Hydro-political risk: random forest model based on national power; governance; economic wealth; economic dependence on agriculture; international treaties in the basin, population density; population in rural areas; water availability; precipitation stress: yearly precipitation (min = 0; max = 100) [29] | Likelihood of hydro-political issues: Danube: 0.499; Rhine: 0.124; Elbe: 0.167 [29] |
| 6.6.1 | Change in the Extent of Water-Related Ecosystems over Time | 10% of the Water Basins in Austria Is Experiencing Rapid Changes in the Area Covered by Surface Waters [37] |
|---|---|---|
| Category | Complementary Indicators | Available Data for Austria |
| Metric | Water extent [68] | 636 km2 (2019) [68] |
| Water quality | Ecological water quality/ecological water status [15] | see Target 6.3 (Table 6) |
| Pesticides in the water environment [8] | see Target 6.3 (Table 6) | |
| Trace toxic substances [8] | Based on 63 synthetic substances, yearly environmental quality standards were in none of the assessed river-sites exceeded [94] | |
| Number of monitoring sites in rivers with respective status class for ammonium (NH4-N) [8] | Very good/good: 90 (100%) | |
| Spatial extent and quality (Total suspended solids and chlorophyll-a) using earth observation complementary and in combination with to ground-based monitoring [154] | n.d. | |
| Various types of ecosystems | Land cover change * | Percent of change from/to sparse vegetation, cropland, bare area, shrubland, wetland, artificial surfaces, tree cover, inland water, grassland [156] |
| Global Forest Watch Water data [152] | Details on tree cover change available [157] | |
| Protection | Extent of forests managed for soil and/or water protection [152] | 3,869,000 ha (2015) (261,000 ha thereof for production of clean water) [158] |
| Protected areas [16] | 29.2% of total land [159] | |
| Natura 2000 protected areas [16] | 12,895 km2 or 15.4% of terrestrial area [160] | |
| National expenditure on environmental protection by institutional sector * | 12,461.4 Million € [161] | |
| Connectivity | Wetland dysconnectivity * | Danube: Low; Rhine: Very low; Elbe: Moderate [144] |
| Ecosystem impacts from dams * | Danube and Rhine: Very high; Elbe; No data [144] | |
| Hydro-morphological pressures * | For 63% of all water bodies that fail to reach the target of good ecological status fail this due to hydro-morphological pressures [93] | |
| Biodiversity | Threat to fish * | Danube and Rhine: High; Elbe; No data [144] |
| Extinction risk * | Danube: Very high; Rhine: Moderate; Elbe; Low [144] | |
| Threatened species (in percent of known species) * | Mammals: 27%, birds: 31%, reptiles: 64%, fish: 46%, vascular plants: 33%, mosses: 27%, lichens: 21%, invertebrates: 2% [159] |
| 6.a.1 | Amount of Water- and Sanitation-Related Official Development Assistance That Is Part of a Government-Coordinated Spending Plan | n/a [37] |
|---|---|---|
| Category | Complementary Indicators | Available Data for Austria |
| Quality | Country programmable aid (only cumulated data available, no data on WASH sector available) * | 81.7 million USD or 13% of bilateral ODA (2014) [168] |
| Total ODA * | 1630 million € (2019) ~ 0.4% of gross national income (GNI) [169] | |
| Austrian Development Cooperation by ADA (ODA-relevant) * | 101.74 million € (2019) ~ 6.2% of total ODA [170] | |
| Water-relevant * | 6.73 million € (2019) ~ 7% of ODA by ADA [171] | |
| Narrow definition | Grants by private agencies and NGOs (only cumulated data available, no data on WASH sector available) * | 163.09 million USD [172] |
| 6.b.1 | Proportion of Local Administrative Units with Established and Operational Policies and Procedures for Participation of Local Communities in Water and Sanitation Management | Target Largely Achieved [68] |
|---|---|---|
| Category | Complementary Indicators | Available Data for Austria |
| Quality of participation | Procedures in law or policy for participation by users/communities (target: 10 = clearly defined) [41] | 10 [41] |
| Level of participation by users/communities in Austria by sub-sector (drinking water urban/rural, sanitation urban/rural, water resources planning and management) (target: 3 = high) [41] | 3 [41] | |
| Formal/informal; gender | Female/male membership with position and responsibility in local or community, formal and informal institutions, for managing irrigation or water supply [33,42] 1 | n.d. |
| Participation by female/male members (with position) in decision-making meetings in local or community, formal and informal institutions, for managing irrigation and water supply; reasons for participation/non-participation; proportion of female/male participation; number of gender-specific decisions adopted resulting from contributions made by female/male members [33,42] 1 | n.d. |
Publisher’s Note: MDPI stays neutral with regard to jurisdictional claims in published maps and institutional affiliations. |
© 2022 by the authors. Licensee MDPI, Basel, Switzerland. This article is an open access article distributed under the terms and conditions of the Creative Commons Attribution (CC BY) license (https://creativecommons.org/licenses/by/4.0/).
Share and Cite
Germann, V.; Langergraber, G. Going Beyond Global Indicators—Policy Relevant Indicators for SDG 6 Targets in the Context of Austria. Sustainability 2022, 14, 1647. https://doi.org/10.3390/su14031647
Germann V, Langergraber G. Going Beyond Global Indicators—Policy Relevant Indicators for SDG 6 Targets in the Context of Austria. Sustainability. 2022; 14(3):1647. https://doi.org/10.3390/su14031647
Chicago/Turabian StyleGermann, Verena, and Günter Langergraber. 2022. "Going Beyond Global Indicators—Policy Relevant Indicators for SDG 6 Targets in the Context of Austria" Sustainability 14, no. 3: 1647. https://doi.org/10.3390/su14031647
APA StyleGermann, V., & Langergraber, G. (2022). Going Beyond Global Indicators—Policy Relevant Indicators for SDG 6 Targets in the Context of Austria. Sustainability, 14(3), 1647. https://doi.org/10.3390/su14031647