Article

Manufacturing, Exports, and Sustainable Growth: Evidence from Developing Countries

1
School of Economics, Nanjing Audit University, Nanjing 211815, China
2
Ministry of Planning, Development and Special Initiatives, Government of Pakistan, Islamabad 44000, Pakistan
3
Graduate School of International Relations, International University of Japan, Niigata 949-7277, Japan
*
Author to whom correspondence should be addressed.
Sustainability 2022, 14(3), 1646; https://doi.org/10.3390/su14031646
Submission received: 13 December 2021 / Revised: 20 January 2022 / Accepted: 26 January 2022 / Published: 31 January 2022
(This article belongs to the Special Issue Emerging Markets’ Competitive Advantages in Sustainable Management)

Abstract

:
Using data for 130 developing countries over a 24 year period from 1996 to 2019, this study investigates the role of manufacturing development in sustainable growth and how the contribution of the manufacturing sector to growth is affected by exports and the underlying export-oriented policies. By employing a vintage difference GMM estimation developed by Arellano and Bond (1991), we find that the manufacturing sector positively contributes to economic growth in developing countries, whereas exports (and thus, their related growth policies) lead to deindustrialization and are thus harmful to growth. In addition, we find that this export-led deindustrialization and the resulting negative growth effect might differ depending on a country’s stage of development measured in terms of the per capita income level. In particular, the growth of countries with lower income levels is more severely negatively impacted than in the case of the richer countries, which is consistent with the findings in the literature. Finally, our main results are robust under two alternative regression checks in which we take into account the potential endogeneity problem and additionally control for the share of imports in GDP in the model.

1. Introduction

According to the engine of growth hypothesis (or Kaldor’s growth law), the manufacturing sector plays an essential role in contributing to economic growth and sustainable development [1,2,3]. According to the United Nations Brundtland Commission, sustainability is the ability to “meet the needs of present without compromising the ability of future generations to meet their own needs” [4]. Sustainability of the manufacturing is reflected by the effect of its operation and product and its ability to boost employment [5]. For example, Szirmai [6] elaborates on the supportive arguments that industrialization is the main engine of growth and summarizes the features of the manufacturing sector that contribute to the long-run growth of an economy. This growth-driven role of the manufacturing sector is especially important among the various groups of developing countries. Manufacturing has typically been a growth engine in developing countries in East Asia and Latin America, but the effect of manufacturing in advanced economies is less significant [7]. Moreover, manufacturing has also been found to contribute the most to growth in periods of normal growth [8].
For these reasons, understanding the key policies that the developing countries commonly adopt in their pursuit of sustainable economic development as well as the way in which they influence their manufacturing growth has become an essential issue. Among the various development strategies, one practice commonly adopted in most developing countries—the form of trade liberalization—has been the export-led growth promotion policy. The export-led growth paradigm, which became a key policy of the Washington Consensus, was a key development agenda and was recommended to developing countries [9,10]. It was financially supported by international organizations such as the IMF and the World Bank and mainly prevailed during the 1980s and 1990s. It replaced the paradigm of import substitution that had been widely accepted in the 1950s but resulted in increasing skepticism from the 1960s onward based on the experiences of different countries [11,12]. In contrast to import substitution, which restricts imports in order to protect domestic industries from foreign competition, the export-led growth policy has been an outward-oriented policy that urges developing countries to undertake trade reforms by liberalizing international trade and becoming more integrated into the global market.
The adoption of trade liberalization has indeed led to several successful industrialization experiences in East and Southeast Asian economies, while it has failed in countries in Africa and South America [13,14]. In sub-Saharan Africa, evidence of output deindustrialization has been found for Ghana, Sierra Leone, and Zambia, and for Bolivia, Peru, and Venezuela in Latin America. In Ghana, Bolivia, and Peru, deindustrialization actually resulted in negative growth rates for the economy as a whole before 1985 [15].
Economists attribute this failure to the fact that a large portion of the exports in those countries relies on primary goods—the production of which is usually regarded as labor-intensive with low levels of skill and knowledge [16]. The comparative advantage of most of the developing countries on which free trade heavily relies lies in exporting primary goods instead of manufacturing production. This path of change not only does not facilitate technological progress and industrialization but can also divert resources away from the manufacturing sector, causing deindustrialization [12,17,18,19]. In other words, the export-led development goal in many developing countries that guides them to fully exploit their comparative advantage is not well aligned with the goal of industrialization and the growth bonus from structural change. They are in fact contradictory in most development cases and, as a result, lead to the sharply contrasting experiences among different groups of countries [13,14].
In this study, we revisit the issue of the effect of manufacturing development on growth sustainability and industrialization. We contribute to the existing literature by incorporating exports and the interaction between exports and manufacturing into our model to examine how exports affect the contribution of manufacturing to growth among developing countries and how this effect might differ for nations’ various stages of development, as measured by per capita income level. Moreover, to deal with a short panel, we complement the literature by applying an Arellano and Bond GMM estimation [20], an approach not yet widely applied in this stream of the literature.
The remainder of the paper is structured as follows. The empirical arguments for the engine of the growth hypothesis are presented in Section 2. Our data, research motivation, and the empirical methods are discussed in Section 3. The empirical results are presented in Section 4. Section 5 provides a discussion of the theoretical and empirical support for our findings. Section 6 concludes the paper.

2. Theoretical Background and Literature Review

2.1. Theoretical Background

Manufacturing industries have long been considered as the engine for economic growth. However, structural economists have a serious concern over deindustrialization of the manufacturing sector that may harm sustainable growth. Deindustrialization process occurring in developing countries is called premature deindustrialization or Dutch disease. Dutch disease is a term introduced by Corden and Neary [21]. These two economic phenomena of industrial reversal are closely associated with export-oriented policies in developing countries.
IMF and the World Bank imposed export-led policies, such as, neoliberal structural adjustment programs (SAPs), on the vast majority of developing countries with the aim of generating export-led growth [22,23], though the outcome is debatable due to the various patterns shown in different countries [12]. An important concern is that export-oriented policies may induce premature deindustrialization or the Dutch disease phenomenon, and the reasons can be summarized as follows:
(i) Developing countries specializing in primary production export commodities that conform to their comparative advantages: for example, some countries in South America, South and East Asia, and Africa that depend largely on the primary production and extractive sectors such as natural resources and raw materials have experienced premature deindustrialization.
(ii) The radical change in the trade policy of resource-rich developing countries is likely to result in premature deindustrialization. For example, a sudden drop in tariffs may cause an immediate shift in resources away from manufacturing, which is still in its infant stage [12].
(iii) In the short run, a large volume of a primary commodity exportation may crowd out manufacturing export through an appreciation of the real exchange rate [21,24,25,26]. This is a straightforward adverse effect observed in the short run. Previous studies show a negative impact of resource abundance on growth [27,28]. A well-known study used cross-country data to show that countries with rich tradable sectors for natural resources tend to grow slowly during the 1970s and 1980s [29].
(iv) In the medium and long run, a rise in rent-seeking behavior following a discovery and export of natural resources owing to poor governance and political system is likely to result in deindustrialization [30,31,32,33]. Vast research has engaged intensively in studies on the relationship between rent seeking and natural resources, explaining why rent-seeking behavior is so common in resource-based countries [32,34,35,36,37,38,39,40,41,42]. Our research question along this line of research seeks to test how the export may interact with manufacturing development and thus affect growth.

2.2. Literature Review

2.2.1. Manufacturing and Growth

Early studies found a positive correlation between the levels of GDP per capita and the shares of manufacturing [1,2,3]. Recent studies have tried to estimate the relationship between economic growth and the performance of manufacturing using different measurements, including (but not limited to) the growth of the manufacturing sector, the share of manufacturing value-added in GDP, capital intensity, employment, and productivity growth. Most of the studies lend support to the view that the manufacturing sector has positively contributed to economic growth, especially in developing countries [6,7,15,43,44,45].
Fagerberg and Verspagen [7] find that manufacturing acts as a growth engine in developing countries in East Asia and Latin America, but the effect of manufacturing in the advanced economies is not significant. Pieper [15] finds a positive correlation between the productivity of the industrial (manufacturing) sector and overall productivity and employment growth, an evidence supporting the role of the manufacturing sector in sustaining economic growth in developing countries. Rodrik [46] distinguishes between traditional low-productivity and modern high-productivity sectors, which mainly include the manufacturing industry, and finds that the share of the “modern” sector significantly contributes to the GDP growth. Szirmai and Verspagen [47] re-examined the role of manufacturing as a driver of growth in the period 1950–2005 and found a moderate positive impact of manufacturing on growth for the total sample including both advanced and developing economies. In examining subperiods, only the middle period (1970–1990) experienced a direct effect of manufacturing on growth, implying that since 1990, it became more difficult for manufacturing to contribute to growth than in historical periods.
Recent studies at a regional level have reached contradictory conclusions. Kathuria and Raj [48] looked into regional differences in growth in India and concluded that manufacturing still functions as the engine of growth and the effect is particularly pronounced in more industrialized areas. On the other hand, Thomas [49] found that services have been the prime engine of growth resurgence in India since the 1990s, which is in line with Dasgupta and Singh [50], who found that manufacturing, construction, and services were all important drivers of growth between 1973 and 2004. In sum, most of the studies support the growth engine hypothesis which contends that the manufacturing sector is crucial to economic growth at both a country level and regional level.

2.2.2. Export and Growth

Immense studies have extensively explored the role that trade liberalization, especially export, played in industrialization and economic growth, in particular, for developing countries [51,52]. Most of these studies conclude that there is a positive relationship between exports and economic growth [53,54,55]. Export-led growth is associated with enhanced factor productivity by expanding a country’s market base, as well as promoting thresholds effects due to economies of scale and increased capacity utilization. Exporting also might lead countries to rechannel their output from less productive sectors to more productive sectors [56]. A recent study by Isaiah [57] finds that exports from both manufacturing and nonmanufacturing sectors have driven Angola’s economic growth in the long run. Shah et al. [58] investigated the export diversification potential and opportunities for Asian liquefied natural gas (LNG)-exporting countries.
By contrast, structural economists who hold the view of growth engine hypothesis are concerned that the comparative advantage of some developing countries under trade liberalization would cause them to specialize in the low-tech sectors such as primary commodity, raw material production, and natural resource extraction. In the case of primary exports, especially among the group of developing countries, the empirical evidence is very mixed and inconclusive [59,60,61,62]. For example, Michaely [61] and Tyler [62] examine a large sample of developing countries and find a positive relationship between export growth and economic growth for the most developed countries but not for those that are least developed.

2.2.3. Some Closely Related Studies

There are two studies that are closely related to our work. First, Szirmai and Verspagen [47] examined the contribution of the manufacturing value-added to GDP ratio to growth and additionally tested how the education and income per capita level affect the contribution of the manufacturing sector to growth. Using panel data for 88 advanced and developing countries from 1950 to 2005, they employed a Hausman and Taylor estimation technique to conduct the panel regression. We follow their work to study the contribution of the manufacturing to GDP ratio to growth, but differ in our focus in that we include ex-ports and investigate how exports affect the contribution of manufacturing to economic growth for the group of developing countries. Moreover, in contrast to their additional focus on exploring the nonlinear marginal effect of the manufacturing share on growth across different levels of human capital and income, we focus on exploring the nonlinear marginal effect of export-led deindustrialization on growth across different levels of income per capita. Furthermore, instead of using a static panel approach as they do, we employ a dynamic panel model by using the Arellano–Bond GMM estimator, which takes into account the potential dynamic structure of the dependent variable.
Another closely related paper is by Marconi et al. [63] which focuses on testing Kaldor’s first and second law by including exports in a dynamic panel model and employing the Arellano–Bond estimation. Our work differs from theirs in two respects. First, they focus on testing the two laws by investigating the effects of manufacturing value-added growth on total value-added growth and on the manufacturing productivity growth, which are different explanatory variables of interest in contrast to ours. Moreover, they only consider the exports of manufactured goods and do not investigate the growth effect of the interaction between exports and the manufacturing sector. We, however, consider the total exports per se and focus on their interaction with the manufacturing share. Our inclusion of the total exports allows us to investigate the impact of exports in general among developing countries on the effect of premature deindustrialization and of Dutch disease on manufacturing development and economic growth since a large share of the exports are primary products instead of manufactured products in these countries.

3. Data and Methodology

3.1. Data Source and Description

Our sample consists of panel data that encompasses 130 developing countries and covers a 24 year period from 1996 to 2019. The classification of developing countries is based on the World Bank’s definition and classification for the year 2019. The main source of the data is the World Bank databases of World Development Indicators (WDI). WDI include the data on manufacturing value-added, which is used to generate our main variable of interest, which primarily originated from the World Bank National Accounts and OECD National Accounts. For most of the countries, the data on manufacturing value-added are only available from the year 1996. Therefore, in order to accommodate the data availability, we customized our data sample to start from the year 1996. Moreover, as there are many gaps in the data, the countries with fewer observations, particularly those lacking manufacturing data, were dropped from the sample.
All the variables were converted into three-year averages. The advantage in this is that it allows us to focus better on the long-run (sluggish) response of macrovariables of interest by smoothing out the short-run noise from other random events occurring within the proximity of time. Moreover, it also enables us to input the information contained in longer time series while reducing the number of “periods” in the time dimension of the data. This can help hold down the number of instruments, avoiding the problem of too many instruments that overfit the endogenous variables [64,65]. In a later section, we adopt several more steps in our estimation in association with a further reduction in instrument counts.
Our panel dataset is an unbalanced panel dataset that contains some missing values. After taking the three-year average of all variables of interests, which further reduces our data sample, eventually leading to 687 effective observations for our regression analysis in the below section.
Table 1 presents the summary statistics of our data. The real GDP per capita growth rate (gdpg) is the dependent variable in this analysis. GDP per capita represents gross domestic product in constant 2010 U.S. dollar divided by midyear population, which indicates a real variable that has been adjusted by inflation and measured in real terms of goods and services (i.e., real GDP per capita). In our sample, the average GDP growth rate of the developing countries is 2.51%, ranging from −9.49% to 9.97% between 1996 and 2019.
The manufacturing share (ms), our first main variable of interest, is computed by its value-added as a percentage of GDP measuring the countries’ degree of industrialization and the importance of the manufacturing sector that comprises the country’s industrial structure. Government expenditure on education (gee) accounts for current, capital, and transfer expenditures on education made by local, regional, and central governments as a share of GDP. It also includes international fund transfers to the government for the purpose of education. Total population (pop) includes all residents of a country irrespective of legal status or citizenship as per the de facto definition. Exports of goods and services characterize the value of all goods and other market services rendered to the rest of the world. The value of merchandise, freight, insurance, license fees, royalties, transport, travel, and other services, such as business, communication, construction, financial, information, personal, and government services, are included in the definition of exports. The export share (exp), our second main variable of interest, is obtained as the market value of exports as a percentage of GDP. The lagged level of GDP per capita (lgdppc) is measured in constant 2010 U.S. dollars.

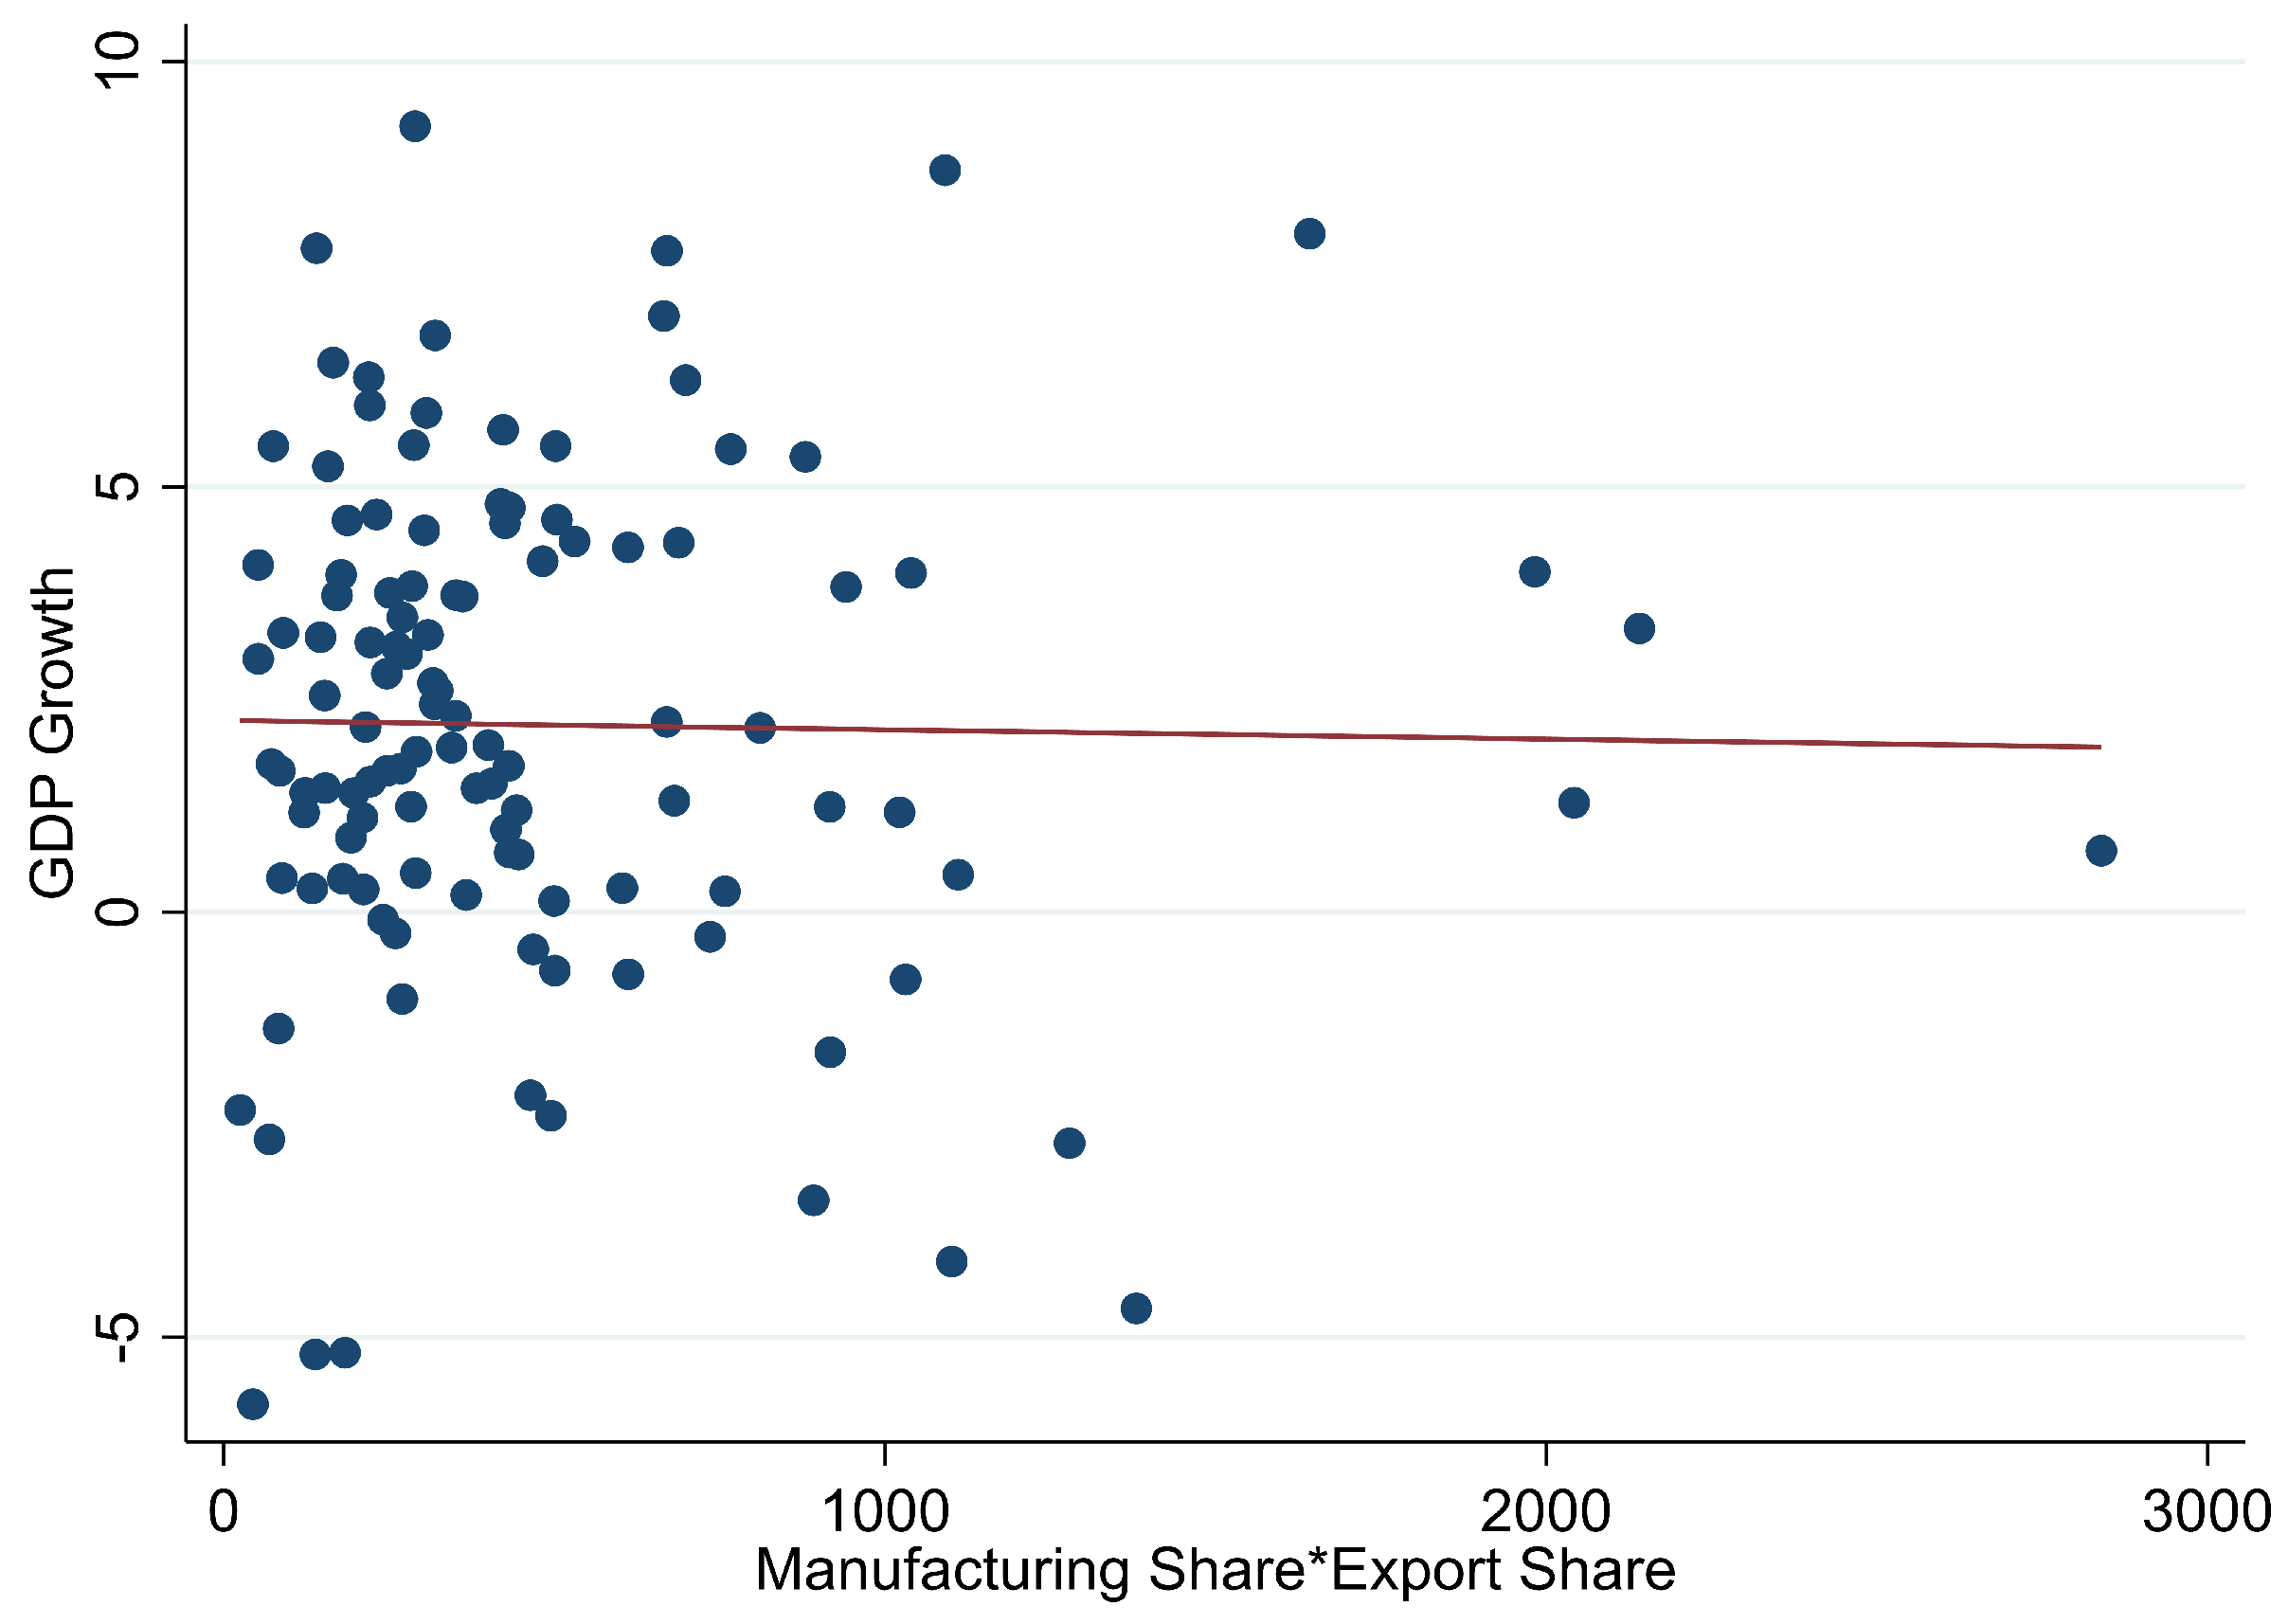
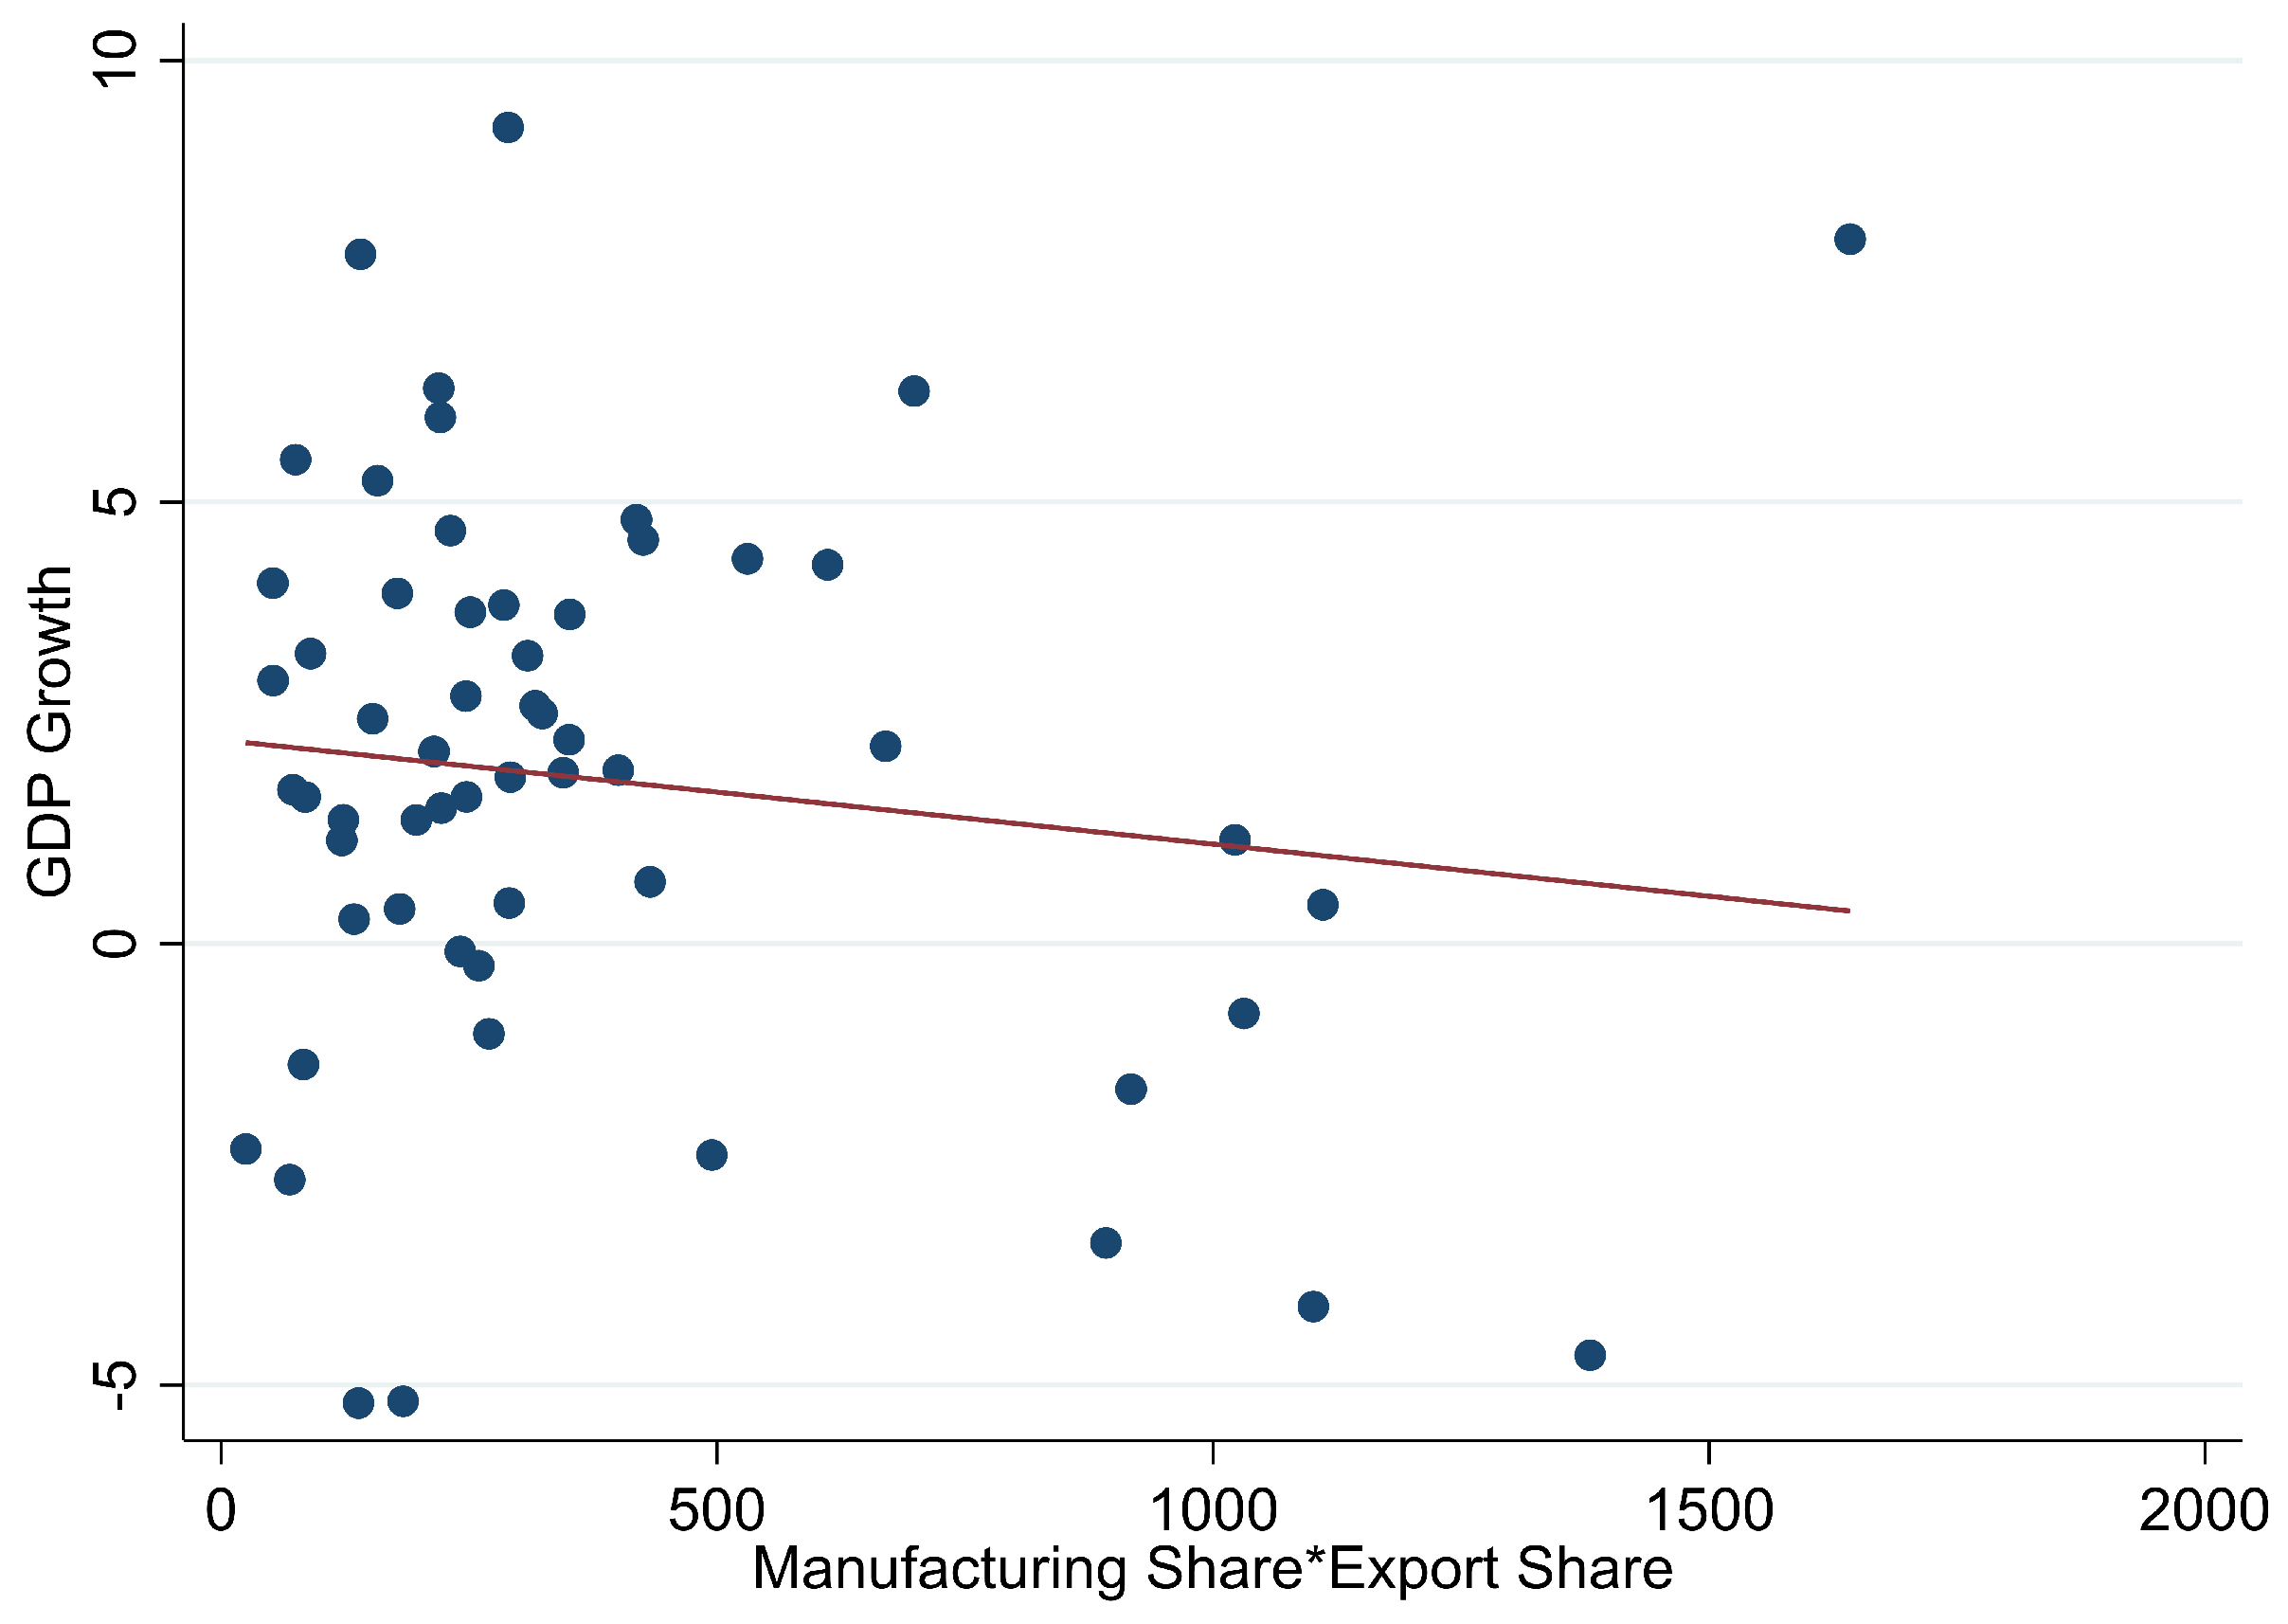
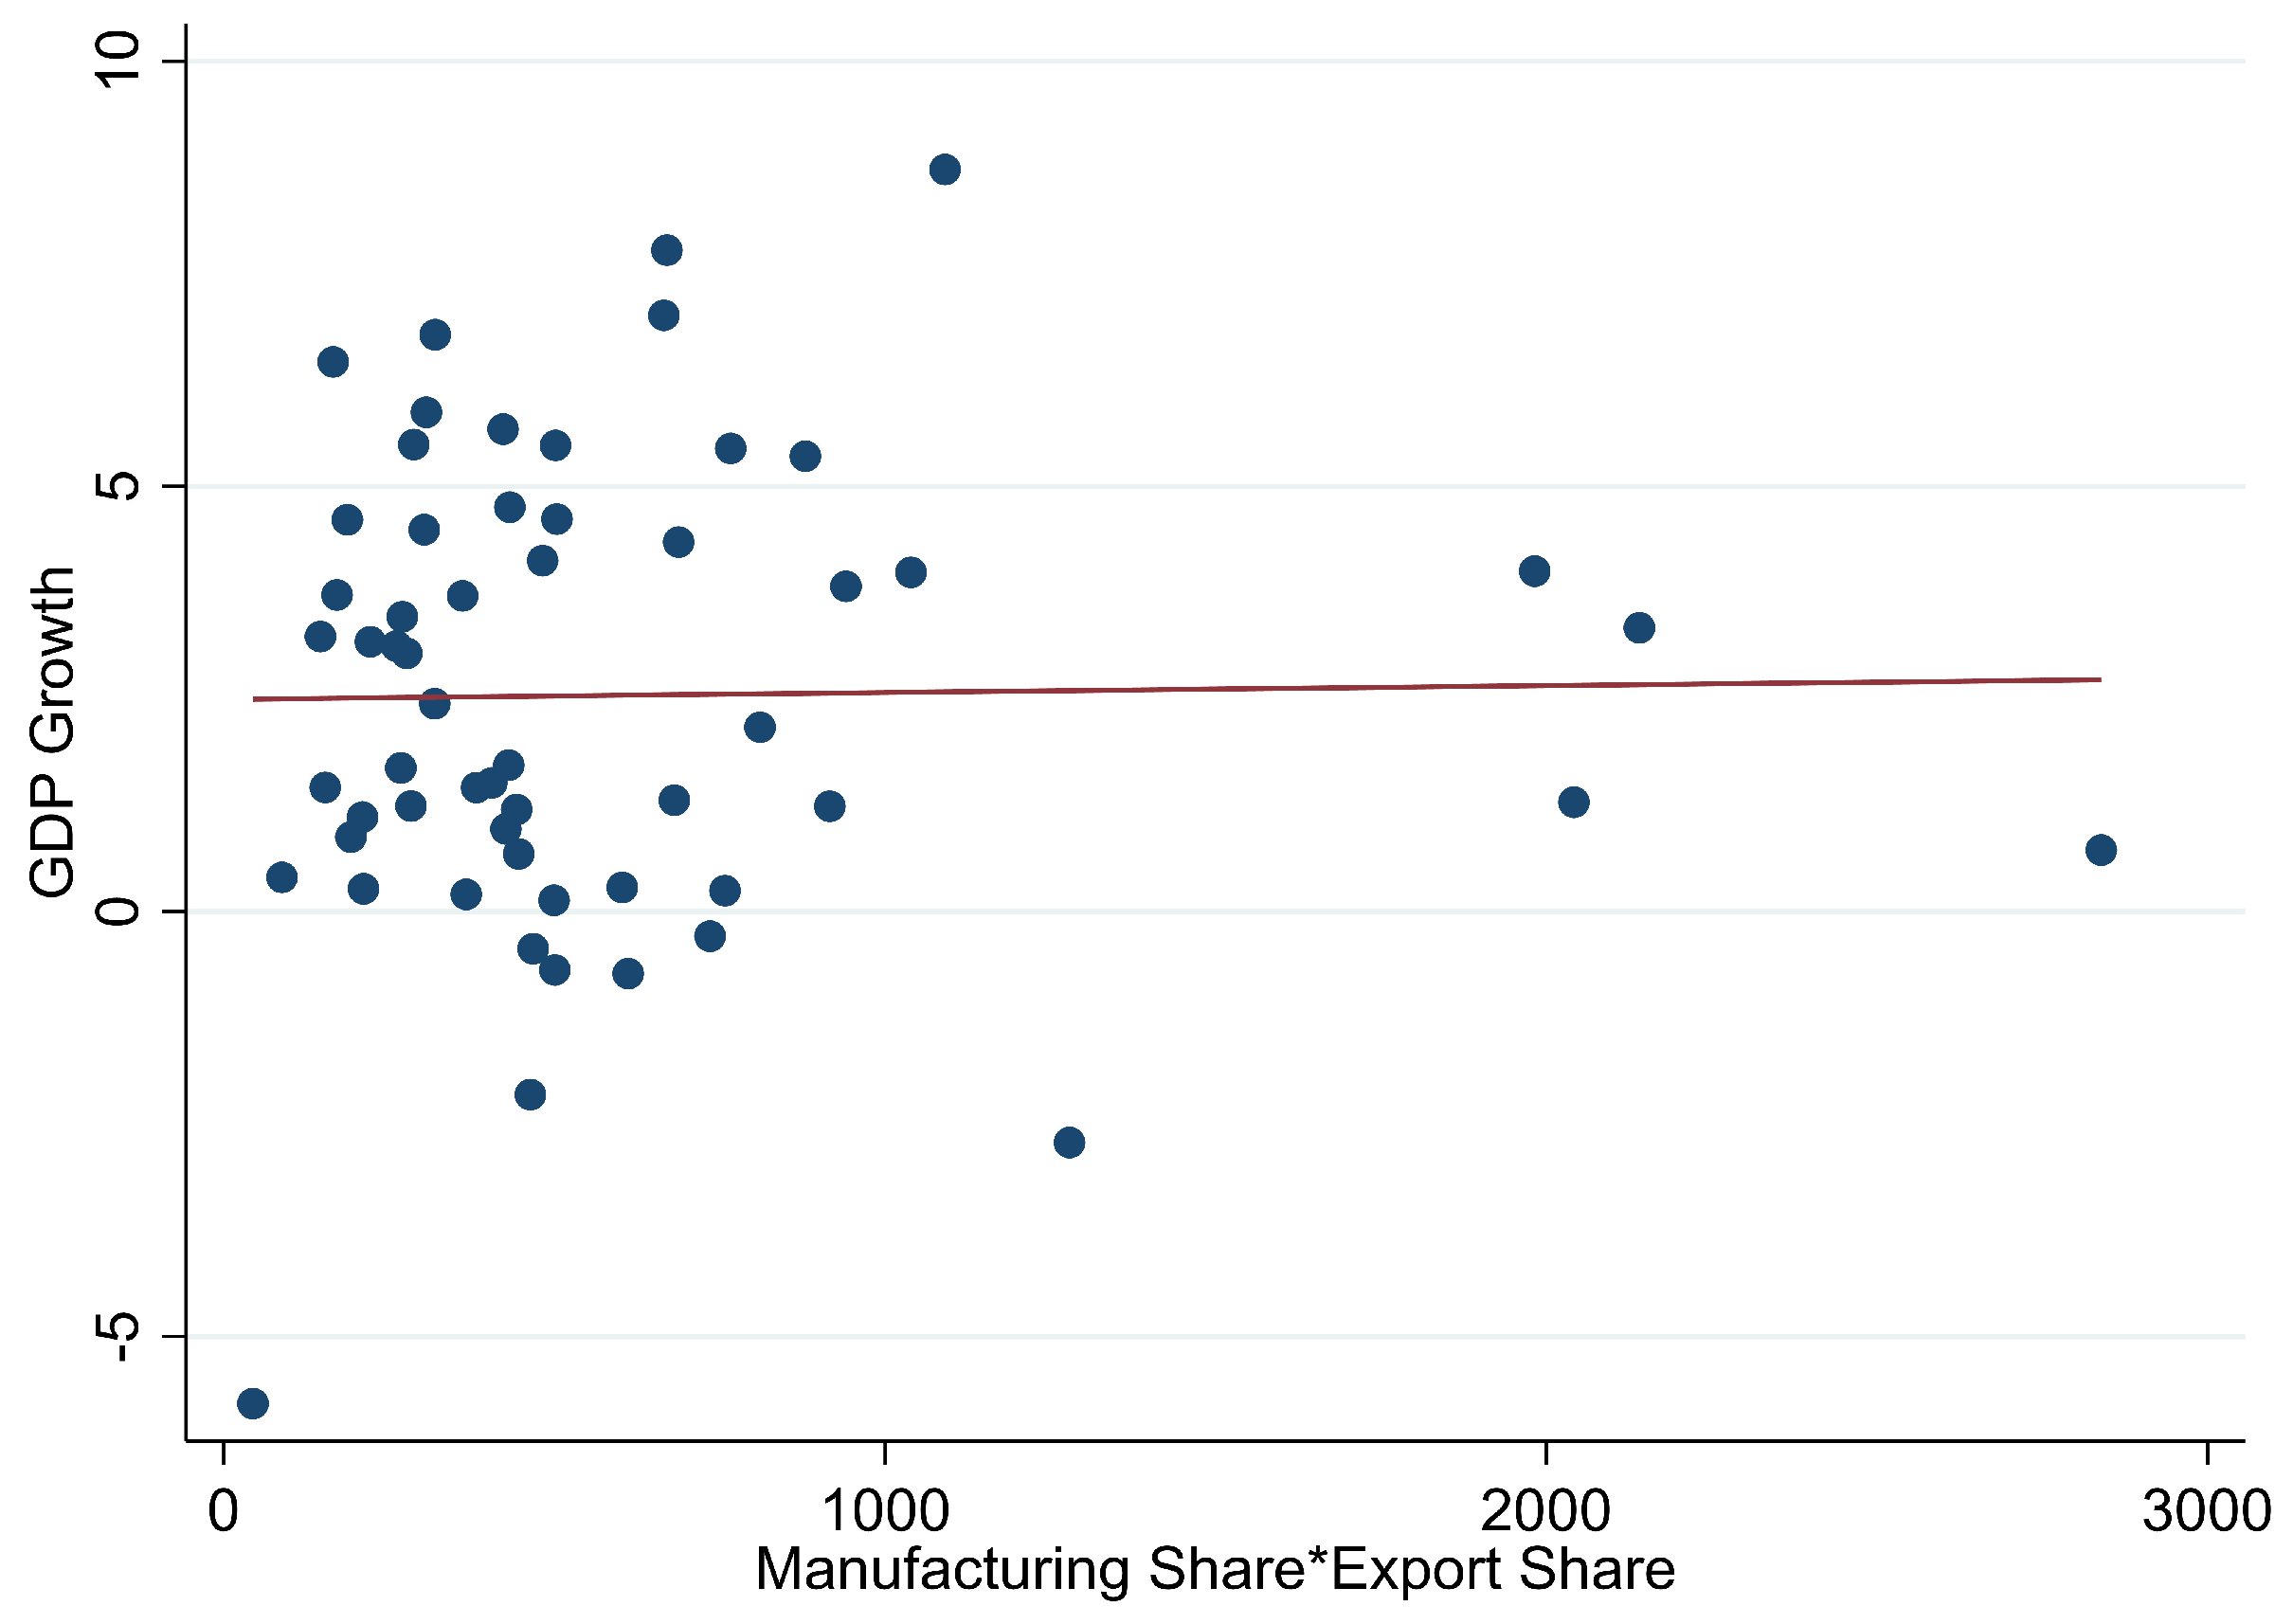
3.2. Research Question and Motivation

Figure 1 plots the correlation between the real growth per capita, gdpg, and the product of the share of manufacturing in GDP and the share of exports in GDP, m s · e x p , for all countries using the beginning period (1996–1998) of our sample that are applied in our GMM estimation.
The figure shows no significant (a slightly negatively sloped) correlation between real GDP growth per capita and the product which would capture the interaction between manufacturing and exports (our main variable of interest). This indicates that exports are apparently unable to affect industrialization and growth.
Interestingly, when we divide the countries in the sample into an upper-income group and a lower-income group, the correlation becomes much more significant and pronounced. Figure 2 shows a negative correlation between GDP growth per capita and the interaction term across the lower-income countries, whereas Figure 3 shows no significant (a slightly positive) correlation between GDP growth per capita and the interaction term across the richer group of countries.
This relationship indicates that exports might cause deindustrialization and thus harm growth in a lower-income group, while having no serious impact on industrialization and growth across the upper-income group. This interesting set of preliminary findings leads us to ask the following questions. How do the exports and their related policies interact with the development of manufacturing and economic growth? In general, do exports worsen industrialization and growth or improve them? Does the impact of exports on industrialization and growth significantly differ between the low-income and high-income countries? In the following, we develop an adequate econometric strategy in an attempt to answer these questions.

3.3. Empirical Model and Approach

3.3.1. Model

The main interest purpose of this study is to explore the contribution of manufacturing industries in sustaining economic growth and to evaluate how exports and, in turn, the extent of an export-oriented trade policy may interact with the development of the manufacturing sector and contribute to economic growth in developing countries. We estimated a panel regression model that allows us to exploit both the dimensions of time dimensions and country-specific variations. Our regression model is specified as follows:
g d p g i , t = γ + α g d p g i , t 1 + X i , t β + Z i , t δ + u t + v i + ϵ i , t ,
where X i , t [ m s i , t m s i , t 1 e x p i , t ( m s i , t · e x p i , t ) ( m s i , t · e x p i , t · d e v i ) g e e i , t ] and Z i , t [ p c t g d p i , t l g d p p c i , t l n p o p i , t d e v i ] . The subscript i = 1 , 2 , 3 . . . . . N represents the country, and t = 1 , 2 , 3 . . . . . T represents the period of time. Our dependent variable denoted as g d p g i , t is the real GDP per capita growth. The lagged dependent variable placed on the right-hand side ( g d p g i , t 1 , denoted as lgdpg in the regression tables) constructs the dynamic structure of the model capturing the AR(1) mean-reverting process of g d p g i , t , which is a standard empirical specification following the growth empirical evidence such as [66,67,68].
Next, X i , t is defined as a vector which contains all potentially predetermined or endogenous regressors, where our main variables of interest are as follows: m s i , t is the share of manufacturing value-added in GDP as in Szirmai and Verspagen [47], which is the standard setup in the literature. This variable captures whether the development of manufacturing plays a sustainable role in economic growth. Moreover, we also include a lagged value of m s i , t , denoted as lms in the regression tables, for one period to capture the idea that manufacturing facilities take time to build and to be effective with period lags to stimulate growth. This setup is similar to that of Szirmai and Verspagen [47], in which lagged m s i , t is used for a few periods as the regressor. Su and Yang [69] also used the lagged manufacturing percentage to GDP and value-added growth in their regression to show that the development of manufacturing Granger causes the TFP. Moreover, many regional industrial development subsidies administered by local governments in China also took time to establish economic advantage and scale needed for regional growth as, for example, the development of the liquid crystal display (LCD) industry in Hefei, Anhui province, and the photovoltaic (PV) industry in Wuxi, Jiangsu province [70].
Moreover, another focus of our study is to examine the degree to which the impact on growth of the manufacturing sector can be indirectly influenced by exports and hence an export-led policy, given that policy often acts as an effective strategy for industrialization and growth in the developing countries. To this end, we include the following three variables: We first include e x p i , t which is the export value to GDP ratio. This variable is included to test for the export-led growth hypothesis in the literature.
Secondly, we include m s i , t · e x p i , t , which is the interaction term between the manufacturing share, m s i , t , and the share of export value in GDP, e x p i , t . This variable is of particular interest to us in understanding how the growth of exports influences sustainability of industrialization for economic growth by adding (a positive or negative) contribution of e x p i , t to the marginal effect of the share of manufacturing on economic growth. From another angle, this term also captures an indirect effect of the export policy on economic growth. The discussion of this interaction term involves two related subjects—“premature” deindustrialization and the Dutch disease—both of which are discussed in detail in Section 5.
Thirdly, we are aware that including both m s i , t and m s i , t · e x p i , t in this model delivers the same marginal effect of the share of manufacturing in growth that is conditional on the same level of exports to GDP ratio. This impact is symmetric and does not vary according to the different development stages of the country. To be more specific, the marginal effect of m s i , t is linear in relation to the share of exports in GDP and across different countries. Nonetheless, a country’s export-led policy at different development stages may exert different impacts on the contribution of the share of manufacturing to economic growth even though the intensity of the exports does not change. First, the export-driven premature deindustrialization and Dutch disease induce asymmetric impacts on growth across countries with different incomes. This asymmetry is due to industrial characteristics that vary across different development stages. In other words, there might exist a “non-linear” marginal effect of m s i , t on growth across rich and poor countries, given the same level of export intensity.
To capture this nonlinear marginal effect, we first created a dummy variable d e v i that sorts the countries into two groups—countries at a higher development stage with dev = 1 and those at a lower development stage with dev = 0. We used their relative income level as a proxy measurement for their development stage. To be specific, dev is measured by the relative quantile of the real GDP per capita among all the developing countries in our sample in the same period. Following that, we created another interaction term, denoted as m s i , t · e x p i , t · d e v i , which multiplies the interaction term m s i , t · e x p i , t by the d e v i dummy. This term can well capture the nonlinear marginal effect of m s i , t on economic growth across the countries at different development stages, conditional on the same level of export intensity.
Lastly, differing from Szirmai and Verspagen [47], who use schooling as a proxy to control for human capital, we used the share of public education expenditure to GDP, g e e i , t , as the proxy for the level of human capital. A common concern in most empirical work that arises over the quality of human capital is that the devotion of resources to education and the education systems differs across countries, which leads to a serious impact on the quality of human capital [71,72]. Government educational expenditure can serve as a qualitative measure for various aspects of educational systems [73,74].
All regressors in X i , t are not strictly exogenous, i.e., they might be treated either as predetermined or endogenous and need to be instrumented for the potential simultaneity problem in the later estimation.
The other set of control variables, Z i , t , contains all strict exogenous regressors including the dummy variable for the development stage, d e v i . We control for the quantile of the real GDP per capita, p c t g d p i , t , which accounts for the relative development and income stage as in Szirmai and Verspagen [47], who control for the relative GDP per capita to the US to represent the distance to the global technological frontier. In addition, we control for the log of population size, l n p o p i , t . We also include the initial income per capita, lgdppc, which is usually included for testing neoclassical growth theory.
The period dummies, u t , are used to control for the worldwide common time trend of industrialization and export-led policy adoption among developing countries when we try to evaluate the sample of countries with noncontemporaneous industrialization processes as well as nonsynchronous timing in terms of the adoption of export-led policies. For example, India experienced industrialization and growth of around 5–6% during two decades in the 1990s and 2000s which was driven by related trade policies [75]. After the 1990s, the export-led paradigm was also adopted in Southeast Asia by Thailand, Malaysia, and Indonesia and in Latin America by Mexico. In the 2000s, China exemplified the mode of export-led growth and exhibited long-term industrialization and growth [9,76]. To address the potential omitted variable bias and explore the within-country variation, we added the country-fixed effects, v i , to remove the time-invariant heterogeneity across countries and thereby improve the statistical accuracy of the inference.

3.3.2. Approach

To properly estimate the above dynamic panel model, we employed the difference-GMM (DGMM) approach developed by Arellano and Bond [20]. The reasons why we employed the DGMM estimation strategy are as follows. First, using Pooled OLS (POLS) to estimate the above regression may cause omitted variable bias because in POLS one cannot isolate the country-fixed effects from the error terms, which can not address the problem of potential correlation between the error term and the regressors. Secondly, using two-way fixed-effect estimation (FE) or random-effect estimation (RE) results in dynamic panel bias because the regressor that captures the dynamics, the lagged dependent variable, is correlated with the demeaned error term in FE. Moreover, DGMM also provides a convenient way to deal with nonstrict exogenous regressors X i , t by directly making use of their lagged values as the instruments that are explained below in more detail. One convenient design of the DGMM is that all of the instruments can be constructed from the lags of the regressors without needing to find an external instrument.
Here, we specify the details of the DGMM approach. Along with the assumptions that (i) ϵ i , t is serially uncorrelated and (ii) X i , t contains nonstrict exogenous regressors, we first of all take the first difference in the regression model in (1) to remove the country-fixed effect. Secondly, we define w i , t as a vector of regressors g i , t 1 , X i , t , Z i , t (i.e., w i , t = [ g i , t 1 , X i , t , Z i , t ] ) and rearrange the difference regression in (1); we premultiply the difference regression by a vector of the lag w i , t as the instruments to form the following moment condition:
E t [ w i , t s Δ ϵ i , t ] = 0 ,
where Δ ϵ i , t represents the error term after taking the first difference in Equation (1) and the w i , t s are the instrumental variables. s represents the lagged periods that we would adopt depending on the type of regressors. Specifically, we take the lag s 2 for the lagged dependent variable g i , t 1 (i.e., the instrument for g i , t 1 starts from g i , t 3 ), which addresses the dynamic panel bias by making all the lag instruments g i , t s for s 2 orthogonal with Δ ϵ i , t . Next, since there is no consensus among the theories regarding the treatment of X i , t , we first treat the X i , t as predetermined regressors in our main regression and take s 1 for the predetermined regressors X i , t to avoid the simultaneity that may arise between X i , t and the error term in the current period ϵ i , t shown in Δ ϵ i , t . Later, we alternatively treat X i , t as a set of endogenous regressors in our robustness estimation. Finally, we assume s = 0 for the strictly exogenous regressors Z i , t .
Third, we further restrict the number of instruments to avoid the over-fitting problem. Note that we select the number of instruments in accordance with the following criteria: (i) the rule of thumb requires that the number of instruments be less than N, the number of countries [63] and (ii) the estimation can pass the two overidentification tests, namely, the Sargan and Hansen tests [77,78], because too many instruments may weaken both the Sargan and Hansen tests [20,79,80]. Therefore, we only take instruments to the maximum of the lag equal to 4 (i.e., s 4 ). On top of that, we also collapse the columns of the instruments in the above moment matrix, embodying the moment E [ w i , t s Δ ϵ i , t ] = 0 for all t and s into a single-moment condition E [ Σ t w i , t s Δ ϵ i , t ] = 0 for all s [64]. Furthermore, we also take into account the robust standard error in our DGMM estimation.
It is worth noting that we do not further consider the System GMM (SGMM) by adding the alternative set of moment conditions in “levels” E [ w i , t s ( v i + ϵ i , t ) ] = 0 , where, by contrast, v i + ϵ i , t is the error term in levels without purging out the country heterogeneity v i shown in Equation (1), and Δ w i , t s is, instead, the first difference of the regressors that we intend to estimate. Adding this set of moment conditions could improve the estimation efficiency when the variables of interest are highly persistent [81]. Estimating only the moment condition in “differences” in Equation (2) with highly persistent regressors would lead to a problem of weak instruments. In our case, our variables are measured by the growth rate and the ratio to GDP, which is much less persistent than their values. Hence, the historical values of the variables now convey effective information about their future changes that can be well captured by the moment condition in Equation (2) and at the same time avoid the need to use extra instruments in the estimation of the additional “levels” moment condition.
Lastly, we report three tests to justify the validity of three assumptions that we made regarding the error terms and the instrumental variables. First, we perform an Arellano and Bond (autocorrelation) test for the error term to show that it is serially uncorrelated. In particular, a serially uncorrelated error term ϵ i , t implies that its difference Δ ϵ i , t could well be characterized by an AR(1) process but not an AR(2) process. Second, we test for the joint validity of the instruments we used for the GMM estimation. To this end, we conduct both the Sargan and Hansen tests of overidentifying restrictions. We guarantee that our estimation results pass the above three tests with the criteria that the p-values have to be greater than the critical 0.05 for our AR(2) test as well as the Sargan J test and fall between 0.05 and 0.8 for the Hansen J test. For the specification of the criteria, see [64,82].
In addition to the DGMM panel estimates obtained from the above procedure (DGMM-P), for purposes of comparison, in the following section, we also present various estimates for simple pooled cross-sectional OLS (POLS), pooled OLS with common time-varying fixed effects (POLS-T), a two-way fixed-effects model (FE), and a standard dynamic DGMM panel regression that only accounts for the dynamic panel bias (DGMM-S) (i.e., dealing with the potential inconsistent estimation of the lagged dependent variable g i , t 1 on the right-hand side of Equation (1), but leaving the weak exogenous covariates X i , t unaddressed). The comparison can help us track how the estimates change according to different approaches and show the advantage of using the DGMM-P estimation procedure.

4. Estimation Results

4.1. Main Regressions

Table 2 reports various estimates from the regression model in Equation (1), which are, respectively, POLS in column 1, POLS-T in column 2, FE in column 3, DGMM-S in column 4, and DGMM-P in column 5. For the first three estimates for POLS, POLS-T, and FE, the p-values in the parentheses are estimated using the robustness standard errors clustered by the country id. We also control for the robustness standard errors for DGMM-S and DGMM-P. Moreover, the table also shows that both of the estimates of DGMM-S and DGMM-P pass the Arellano and Bond (autocorrelation) test, as well as the Sargan and Hansen tests according to the criteria specified in the previous section. Next, the significant estimates of the lagged dependent variable g d p g i , t 1 in the first three regressions (POLS, POLS-T, and FE) justify the legitimate backdrop of using the dynamic panel model by including the lagged dependent variable g d p g i , t 1 even though they are not significant in either of our DGMM-S and DGMM-P estimations.

4.1.1. Main Results of Interest

In the following, we track how the estimates for the share of manufacturing value-added in GDP, m s i , t , change across the five regression approaches. First, the coefficients of m s i , t are negative and significant in POLS and POLS-T. These results are inconsistent with the positive coefficient estimates of m s i , t in most of the literature and might indicate that the estimations could contain several sources of potential bias in these two regressions (e.g., the potential bias may arise from both the omitted time-intercept and country-fixed dummies in POLS and the country-fixed dummy in POLS-T, and of course, the simultaneity bias may arise from the weak exogenous regressors).
After controlling for the country-fixed effects, the coefficient of m s i , t turns out to be positive but remains insignificant in the FE estimation. FE corrects the bias from two omitted time-intercept and country-fixed dummies, but at the expense of generating dynamic panel bias, which makes β i , t remain a consistent estimator. After taking into account the dynamic panel bias in FE, we find that the coefficient of m s i , t in DGMM-S turns out to be negative again. This provides us with some information regarding the direction of the biases. We can infer that the potential endogeneity problem from X i , t affects both FE and DGMM-S, whereas the dynamic panel bias only affects FE. This implies that the former problem causes the DGMM-S estimator to be biased downward, and the presence of dynamic panel bias results in the estimate of m s i , t being biased upward. Both biases work in opposite directions, and the net effect goes on to being a positive coefficient in our FE estimation.
To obtain a consistent estimator for m s i , t , we apply DGMM-P on the basis of DGMM-S by further treating X i , t as a predetermined set of covariates instead of strictly exogenous regressors. As a result, we obtain a positive and significant coefficient of m s i , t as shown in column 5, which is consistent with most of the empirical findings in the studies on developing countries. This verifies the view held by structural economists that, due to the special industrial characteristics in the manufacturing sector as discussed in the Introduction, the policies that set forth the development of the manufacturing sector shall remain a priority in the list of policy recommendations targeted for maintaining sustainable growth in the long run.
As for the interaction term, m s i , t · e x p i , t , we can see that the estimated coefficients in all five regressions exhibit negative signs and are significant in two regressions (in FE and DGMM-P) out of five. This implies that these negative estimates are quite robust across different empirical estimation techniques. After attempting to control for various biases in DGMM-P, the coefficient is significant and is the largest in magnitude among the five regressions. This result indicates that increasing the share of exports would in fact harm the development of manufacturing and reduce the economic growth through this indirect channel even though the exports alone increase the growth rate.
This outcome justifies the concerns over the prevalent growth promotion strategy, i.e., the export-led policies that intend to enhance the development of manufacturing and growth may actually work in the opposite direction, leading to deindustrialization and slower growth. It is not always as effective as expected in catalyzing the industrialization and growth as experienced in some of the East Asian economies (for example, South Korea, Taiwan, Hong Kong, and Singapore in the 1980s) and more recently in China. The explanation for this export-led deindustrialization that retards growth is attributed to the so-called “premature deindustrialization” and “Dutch disease,” both of which are discussed in detail in Section 5.1.
The third variable of interest is the interaction term, m s i , t · e x p i , t · d e v i . The estimates exhibit positive signs across all regressions and are significant in two regressions (in FE and DGMM-P) out of five, similar to m s i , t · e x p i , t . This result is also quite robust. The explanation for this positive coefficient, along with the interaction term m s i , t · e x p i , t discussed above, indicates that the group of countries with higher relative income levels turns out to entail a “less” negative impact of export-led deindustrialization on growth than the group of countries with lower relative income levels. The explanation is provided in Section 5.2.

4.1.2. Other Regressors

Other regressors such as gee obtain a positive and significant sign in our main DGMM-P estimation. This result supports the conventional idea that human capital contributes positively to economic growth. e x p i , t is positive and significant in three regressions (FE, DGMM-S, and DGMM-P) out of five, which is also quite robust. This finding, combined with the estimates found in m s i , t · e x p i , t and d e v i · m s i , t · e x p i , t , to some extent justifies the export-led growth hypothesis (measured as a higher share of exports in GDP) that shows a positive average partial effect of exports on growth.
Finally, it is also interesting to note that the coefficient of pctgdp is positive in all regressions and significant in POLS, DGMM-S and DGMM-P. Recall that pctgdp measures the relative GDP per capita level of each country. The positive coefficient, at first glance, appears to violate the convergence in growth rates predicted in new classical growth theory in contrast to the negative coefficient found in Szirmai and Verspagen [47]. However, after we control for lgdppc, which measures the initial income per capita, we find that it results in a negative sign for all regressions and is significant in four out of the five models. This seemingly contradictory result is actually quite consistent with the predictions in neoclassical growth theory. Since our country sample is very diverse in terms of country characteristics, the above results with a positive estimate in pctgdp and a negative estimate in lgdppc clearly indicate that there is no convergence among the countries while there is convergence within the country. This outcome to some extent coincides with the predictions in the argument for the “conditional convergence” instead of the “absolute convergence”, the well-known hypothesis in the new classical growth theory that the convergence in the growth rate occurs only when the countries share similar characteristics.

4.2. Robustness Check

We conduct two sets of robustness examinations: one with respect to the alternative treatment of the weekly exogenous regressors in X i , t and the other includes additional regressors in imports-related variables.

4.2.1. Dealing with Endogeneity

As in Szirmai and Verspagen [47], we treat the explanatory variables in Z i , t as exogenous. However, there is limited information from the theory that can be used as a guidance in the treatment of X i , t . In our main regressions of interest, we treat them as predetermined variables. In Marconi et al. [63], several variables similar to the ones in our X i , t are treated alternatively as either predetermined or endogenous. Therefore, in this subsection, we reconsider the DGMM-P estimation by dealing with the possible endogeneity problem. We first rerun the DGMM-P regression (i.e., DGMM-E1 in the first column of Table 3) by treating those nonstrict exogenous regressors X i , t (except for our main variable m s i , t ) as potential endogenous variables rather than predetermined ones, and next, we run the second DGMM-P regression by treating all regressors in X i , t including m s i , t as endogenous variables (i.e., DGMM-E2 in the second column of Table 3).
To do so, following Arellano and Bond [20], we revise the moment condition:
E t [ w i , t s Δ ϵ i , t ] = 0 ,
by lagging the vector of the regressors X i , t for two periods, starting from X i , t 2 to X i , t 4 as the instruments except for m s i , t . We retain m s i , t as predetermined in the first regression and follow up to lag it for two periods in the second regression. Two regressions pass all three tests, including the Arellano and Bond (autocorrelation) test, and the Sargan and Hansen tests of overidentifying restrictions under the criteria specified in [64,82].
Taking into account this treatment for the endogeneity problem for X i , t in DGMM-E1 (which retains m s i , t as the predetermined regressor) shows only a slight change in the variance of the m s i , t coefficient estimate, making it less significant while keeping the positive sign. Moreover, the sign and significance of all other main variables of interest do not change, including the coefficients of m s i , t · e x p i , t and of d e v i · m s i , t · e x p i , t . This regression result confirms the consistency and robustness of our results obtained above. Solving all endogeneity problems, including m s i , t in DGMM-E2, gives a similar outcome as in DGMM-E1: The estimate of m s i , t is insignificant while the sign and significance of all other variables of interest are mostly the same. After checking the robustness of these two regressions, we confirm that our findings in Section 4.1 are consistent with this set of results.

4.2.2. Adding the Share of Imports in GDP and Related Regressors

In this set of robustness checks, we add the share of imports in GDP denoted as imp to our regression model where imports of goods and services are defined as the value of all goods and other market services received from the rest of the world.
Recent research has indicated that the spurious regression problem may arise due to the link between exports and economic growth [84]. Imports might be an actual determinant of growth and co-move with exports, especially in the period after trade liberalization. Not controlling for imports may result in serious omitted variable bias [85,86,87].
We take imports and import-related regressors into account in the estimation and separate our examinations into three regressions. Table 4 reports the three regressions in order as follows. In the first regression (DGMM-PM) in column 1, we add the share of import value-added in GDP denoted as i m p i , t to X i , t and keep all the X i , t as predetermined variables as we did in the main regressions in Section 4.1. In the second regression (DGMM-EM1) in column 2, we instead treat all X i , t (including i m p i , t ) as endogenous regressors as we did in Section 4.2.1. In the third regression (DGMM-EM2) in column 3, we include the import-to-GDP share as well as interaction terms in an analogous way to that for the export-to-GDP share. All three regressions passed the tests related to autocorrelation and the overidentifying restrictions. Note that in order to pass the three tests, we adjust the number of lagged instruments in this set of robust DGMM regressions. We instrument X i , t with a one-period lag instrument (i.e., s = 1 ) instead of all instruments being lagged from s = 1 to s = 4 when we treat X i , t as predetermined regressors, and we instrument X i , t with only one two-period lag instrument (i.e., s = 2 instead of all instruments being lagged from s = 2 to s = 4 ).
In the first regression, we find that the signs of the variables of interest are the same and significant in the interaction term m s i , t · e x p i , t . They are also significant in e x p i , t and g e e i , t , which are consistent with our findings in the main regressions. Moreover, the coefficient of the share of imports in GDP does not add any significant difference to the regression, which implies that the results in our main regressions are not mis-specified and are arguably valid without generating much bias if we omit the import share in our main regression models in Section 4.1. Similarly, in the second regression, the results remain, keeping the sign of the main variable of interest the same and significant in m s i , t · e x p i , t . The only difference is that g e e i , t turns out to be insignificant. Moreover, the import share does not exhibit significance in the regression either, which is a further reason why we can ignore the bias that it may cause.
In our last regression, by incorporating all the import-related variables including i m p i , t and all the interaction terms parallel to exports m s i , t · i m p i , t and d e v i · m s i , t · i m p i , t , the results become insignificant (including the import share and all its related variables), while their signs remain the same, which again remain consistent with our main findings.

5. Discussion

In this section, we discuss the possible mechanism and economic intuition behind the main results of interest that we obtained from the above regression. Since the positive sign and significance for m s i , t in our main regression DGMM-P is quite consistent with the findings in the literature, our main discussion focuses on the results of two interesting interaction terms m s i , t · e x p i , t and d e v i · m s i , t · e x p i , t .

5.1. Export-Led Deindustrialization and the Growth Impediment (i.e., m s i , t · e x p i , t < 0 )

The structural economists classify manufacturing deindustrialization into three types: (mature) deindustrialization, premature deindustrialization, and Dutch disease. The (mature) deindustrialization refers to a structural transformation experienced by most of the advanced countries in that the manufacturing started to decline alongside a rise in the share of services over time when the development of income per capita reached a point of saturation [17,88].
By contrast, our finding which relates manufacturing deindustrialization and the resulting impediment to growth with exports in the group of developing countries lies in the categories of premature deindustrialization and the Dutch disease. Premature deindustrialization describes a deindustrialization process that a country encounters when it remains in a stage with a lower level of income per capita as well as a lower share of manufacturing in terms of employment or GDP [12], while the Dutch disease is acknowledged as an excess source of deindustrialization which, in a general and broader sense, refers to any adverse impact on the development of manufacturing after a sudden discovery and the subsequent trade involving an endowment that shifts the production possibility frontier outward in an economy [12,89] and possibly occurs in both developed and developing countries. The common and important feature shared by the premature deindustrialization and the Dutch disease is that both are highly related to the exports and trade policy in developing countries.
The sources of premature deindustrialization mainly arise from the following two causes: (i) The tendency toward globalization and trade liberalization leads some of the resource-rich or labor-intensive developing countries to pursue their comparative ad-vantages. As such, in these countries, the specialization in primary production (or services) drives the input resources and employment away from manufacturing. For example, some economies in South America, South and East Asia, and Africa that depend largely on the primary production and extractive sectors of natural resources and raw materials have experienced premature deindustrialization. By contrast, resource-poor economies in East Asia, such as Korea, Taiwan, and Hong Kong in the 1980s, and China since the 2000s specialize in the capital-intensive manufacturing processes. (ii) The radical change in the trade policy of resource-rich developing countries is likely to result in premature deindustrialization. For example, a sudden drop in tariffs may cause an immediate shift in resources away from manufacturing in the infant stage, which does not provide sufficient time to become competitive in the international market. It is observed that in middle-income nations, especially in South America, a rapid policy shift (i.e., a drastic liberalization of trade in Latin America from the previous state-led agenda of import-substituting industrialization (ISI) has led to a sharp decline in manufacturing employment, shifting more labor toward primary production and services, despite their low-income levels in the premature stage [12].
The persistence of the Dutch disease phenomenon may take one of the following two forms: (i) The first form occurs through an appreciation of the real exchange rate that immediately follows a large volume of exports of a primary commodity (e.g., a natural resource discovery), which stifles the manufacturing exports [21,24,25,26]. This is a straightforward adverse effect observed in the short run, also known as the curse of natural resources, which has been extensively studied in the literature. Previous studies show a negative impact of resource abundance on growth [27,28]. The most well-known study by [29] used cross-country data to show that countries with rich tradable sectors for natural resources tended to grow slowly during the 1970s and 1980s.
(ii) The second form refers to a longer-lasting adverse impact on the development of manufacturing in the medium and long run, which involves a rise in rent-seeking behavior and any other related negative macroeffects when discovering and exporting natural resources owing to poor governance and political system [30,31,32,33]. Vast research has examined the relationship between rent-seeking and natural resources, explaining why rent seeking behavior is common in resource-based countries [32,34,35,36,37,38,39,40,41]. One notable piece of evidence shows that Dutch disease can persist historically in a (super) long run, initiated by the colonial era in some underdeveloped and developing countries. Colonizers who exploit resources by extracting and trading from the former colonial countries are more likely to form poor institutions in facilitating their extraction (e.g., weak private property right protection). Evidence shows that Europeans launched on different colonization policies. In particular, in the colonies that are rich in natural resources but poor in settling conditions, Europeans could set up extraction-based institutions that encouraged rent-seeking behavior and served as a pawn in the predatory political regime [42]. This adverse institutional effect on economic growth has continued up to the present time.

5.2. Asymmetric Impact on Deindustrialization and Growth across per Capita Income Levels (i.e., m s i , t · e x p i , t · d e v i > 0 )

Moreover, the positive and significant sign for the interaction term m s i , t · e x p i , t · d e v i indicates the common belief that the effects of export-led premature deindustrialization and Dutch disease on manufacturing productivity and economic growth differ across the rich and the poor countries. Lower-income countries suffer more severely from the impact than the higher income ones; in other words, deindustrialization is more detrimental to growth in low-income countries. Rodrik [90] contends that deindustrialization should be a much bigger problem for developing countries, as it is related to the loss of good jobs, rising inequality, and a decline in innovation capacity.
First, both the chances that deindustrialization would take place and the impact of deindustrialization on growth decrease as technological complexity in manufacturing production increases. The development of manufacturing at an infant stage where the production technology is simple is more likely to experience an industrialization reversal than at a mature stage, partly because more substitutes can be found in the product market under competition and partly because the product line is less costly to replace. Williamson [10] found that deindustrialization more severely affected the economies that were engaged in production based on simple technology.
Next, the service sectors in more advanced economies might be better equipped to replace manufacturing industry as the main growth engine because they tend to be more highly skilled and knowledge-intensive and benefit from self-accumulating productivity and self-exploiting increasing returns. Nonetheless, if the service sector encounters the premature deindustrialization in the early development stage, it might not be sufficiently mature to replace the manufacturing sectors as a sustainable growth engine. Those underprepared service sectors, characterized by low skill and low productivity, do not have the ability to exploit increasing returns and knowledge accumulation and are thus less likely to benefit from trade. Fagerberg and Verspagen [7] found that, in the 1970s and 1980s, manufacturing only acted as an engine of growth in developing, and not in developed, countries.
Finally, deindustrialization in the early development stage often takes place more abruptly in comparison with that in a more advanced stage. This is because countries in the early industrial stage heavily rely on the support funded by international financial institutions and thus need to comply with the terms and conditions specified in the “adjustment program,” which commonly require a radical policy reform. This compliance sometimes induces a sudden and sharp industrialization reversal. It can be observed that in middle-income nations, especially in South America, deindustrialization accompanies rapid policy shifts from import substitution to export-oriented industrialization [12].
As for the Dutch disease, studies show that richer countries are better equipped to deal with this phenomenon. Deaton [16] examined which economic forces are at play in resource economies and why some countries are more prone to be negatively affected by rent-seeking. Dutch disease can occur in all economies, including well-functioning market economies with strong social and political institutions, which is the reason why governments often attempt to mitigate the negative effects of natural resource wealth. While additional problems arise in countries where governments and the rule of law are fragile, huge and sudden wealth can have corrosive effects on those institutions, exacerbating rent-seeking behavior in an effort to appropriate economic rents [22].

6. Conclusions

This study uses data for 130 developing countries covering a 24 year period from 1996 to 2019 to investigate the impact of the development of manufacturing on sustainable growth and takes into account the indirect effect of exports (and thus the underlying export-led policies) on the industrialization process and thus its contribution to growth. By employing a vintage difference-GMM estimation developed by Arellano and Bond [20] along with alternative pooled OLS and fixed-effects regressions, we find that the manufacturing sector, in general, positively contributes to economic growth among developing countries. This result is consistent with the findings in the mainstream literature. Nonetheless, we find that exports and, hence, the exported-related growth policies lead to deindustrialization and thus harm growth indirectly. This result is in contrast with the argument regarding the effectiveness of export-led growth promotion policies in the Washington Consensus and the experiences of export-led industrialization and growth in East Asian economies. It lends support to the structural economists’ views that exports may lead to premature deindustrialization and Dutch disease, which reverses the development of manufacturing and deters growth.
More interestingly, we find that the degree to which exports lead to deindustrialization and impair growth depends on the stage of economic development measured by the per capita income level. In particular, countries with lower income, in general, experience a more severe negative impact on growth than rich ones. This asymmetric impact on different income-per-capita levels is consistent with the findings in the literature alongside the detailed explanations. Finally, our main results are robust under the two alternative regression checks in which we take into account the potential endogeneity problem and control for the share of imports in GDP, respectively.
This study provides empirical evidence to policy-makers in low- and middle-income countries, enabling them to reassess their economic strategies as to whether or not the government should promote and support an export-led growth policy. Our results suggest that an export-led policy does not necessarily encourage economic growth in all countries. Instead, the low-income countries may be impaired by deindustrialization as a result of significant increases in the shares of exports.
The lack of data on both a larger time dimension and a more precise classification of the main variable of interest, for example, export, poses a constraint that limits the scope of this study. In light of this, we propose two new directions for future research. First, if a panel data with a larger time dimension are available, we propose to apply a nonstationary panel time series analysis to study both short-run and long-run effects of export-led policies on deindustrialization and growth. Second, if we used 20 as the common threshold of variance inflation factor (VIF) to evaluate the independent variables in our model, it can be seen that some variables may be considered to have relatively high multicollinearity that may cause difficulty in estimating the coefficients precisely. It is suggested that increasing the number of observations in future studies may be a possible way to reduce this potential issue. Third, to further understand the relationship between exports, the share of manufacturing-sector products to GDP, and output growth, more detailed export data from other sources that contain subcategories of sectors, especially for the primary sector, are needed since these can support more direct tests and hence expand on current research.

Author Contributions

Conceptualization, X.W. and S.A.A.K.; methodology, C.Y.W.; software, S.A.A.K.; validation, X.W., S.A.A.K., and C.Y.W.; formal analysis, X.W. and S.A.A.K.; investigation, X.W. and S.A.A.K.; resources, C.Y.W.; data curation, S.A.A.K.; writing—original draft preparation, X.W.; writing—review and editing, X.W.; visualization, X.W.; supervision, C.Y.W.; project administration, C.Y.W. All authors have read and agreed to the published version of the manuscript.

Funding

This research received no external funding.

Institutional Review Board Statement

Not applicable.

Informed Consent Statement

Not applicable.

Data Availability Statement

The data presented in this study are available on request from the corresponding author.

Conflicts of Interest

The authors declare no conflict of interest.

References

  1. Kaldor, N. Marginal Productivity and the Macro-Economic Theories of Distribution: Comment on Samuelson and Modigliani. Rev. Econ. Stud. 1966, 33, 309–319. [Google Scholar] [CrossRef]
  2. Kaldor, N. Strategic Factors in Economic Development; New York State School of Industrial and Labor Relations, Cornell University: Ithaca, NY, USA, 1967. [Google Scholar]
  3. Pacheco-López, P.; Thirlwall, A.P. A New Interpretation of Kaldor’s First Growth Law for Open Developing Economies. Rev. Keynes. Econ. 2014, 2, 384–398. [Google Scholar] [CrossRef]
  4. United Nations Brundtland Commission. Report of the World Commission on Environment and Development: Our Common Future. 1987. Available online: http://www.un-documents.net/our-common-future.pdf (accessed on 12 December 2021).
  5. Campbell, O.; Asaleye, A.J. Financial sector reforms and output growth in manufacturing: Empirical evidence from Nigeria. Am. Int. J. Contemp. Res. 2016, 6, 112–125. [Google Scholar]
  6. Szirmai, A. Industrialization as an engine of growth in developing countries, 1950–2005. Struct. Chang. Econ. Dyn. 2012, 23, 406–420. [Google Scholar] [CrossRef] [Green Version]
  7. Fagerberg, J.; Verspagen, B. ‘Modern Capitalism’ in the 1970s and 1980s. In Growth, Employment and Inflation; Setterfield, M., Ed.; Palgrave Macmillan: London, UK, 1999; pp. 113–126. [Google Scholar]
  8. Timmer, M.P.; de Vries, G.J. Structural change and growth accelerations in Asia and Latin America: A new sectoral data set. Cliometrica 2009, 3, 165–190. [Google Scholar] [CrossRef] [Green Version]
  9. Palley, T.I. The rise and fall of export-led growth. Investig. Econ. 2012, 71, 141–161. [Google Scholar]
  10. Williamson, J. Democracy and the “Washington consensus”. World Dev. 1993, 21, 1329–1336. [Google Scholar] [CrossRef]
  11. Irwin, D.A. The rise and fall of import substitution. World Dev. 2021, 139, 105306. [Google Scholar] [CrossRef]
  12. Palma, G. Four sources of ‘de-industrialization’ and a new concept of Dutch Disease. Beyond Reforms Struct. Dyn. Macroecon. Vulnerability 2005, 3, 71–116. [Google Scholar]
  13. Tregenna, F. Deindustrialisation, structural change and sustainable economic growth. In MERIT Working Papers; Maastricht Economic and Social Research Institute on Innovation and Technology (MERIT), United Nations University: Maastricht, The Netherlands, 2015. [Google Scholar]
  14. Rodrik, D. Premature deindustrialization. J. Econ. Growth. 2016, 21, 1–33. [Google Scholar] [CrossRef]
  15. Pieper, U.E. Deindustrialisation and the Social and Economic Sustainability Nexus in Developing Countries: Cross-country Evidence on Productivity and Employment. J. Dev. Stud. 2000, 36, 66–99. [Google Scholar] [CrossRef]
  16. Deaton, A. Commodity prices and growth in Africa. J. Econ. Perspect. 1999, 13, 23–40. [Google Scholar] [CrossRef] [Green Version]
  17. Rowthorn, R.; Ramaswamy, R. Growth, Trade, and Deindustrialization. IMF Staff Pap. 1999, 46, 18–41. [Google Scholar] [CrossRef]
  18. Tregenna, F. Deindustrialisation and premature deindustrialization. In Elgar Handbook of Alternative Theories of Economic Development; Elgar: Cheltenham, UK, 2016. [Google Scholar]
  19. Tregenna, F. Characterising deindustrialisation: An analysis of changes in manufacturing employment and output internationally. Camb. J. Econ. 2009, 33, 433–466. [Google Scholar] [CrossRef]
  20. Arellano, M.; Bond, S. Some Tests of Specification for Panel Data: Monte Carlo Evidence and an Application to Employment Equations. Rev. Econ. Stud. 1991, 58, 277–297. [Google Scholar] [CrossRef] [Green Version]
  21. Corden, W.M. Exchange Rate Policy and the Resources Boom. Econ Rec. 1982, 58, 18–31. [Google Scholar] [CrossRef]
  22. Chang, H.J.; Andreoni, A. Bringing Production Back into Development: An introduction. Eur. J. Dev. Res. 2021, 33, 165–178. [Google Scholar] [CrossRef] [PubMed]
  23. Amsden, A. Editorial: Bringing production back in—Understanding Government’s economic role in late industrialization. World Dev. 1997, 25, 469–480. [Google Scholar] [CrossRef]
  24. Corden, W.M. Booming Sector and Dutch Disease Economics: Survey and Consolidation. Oxf. Econ. Pap. 1984, 36, 359–380. [Google Scholar] [CrossRef]
  25. Corden, W.M.; Neary, J.P. Booming Sector and De-Industrialisation in a Small Open Economy. Econ. J. 1982, 92, 825–848. [Google Scholar] [CrossRef] [Green Version]
  26. Ros, J. Development Theory and the Economics of Growth; University of Michigan Press: Ann Arbor, MI, USA, 2000. [Google Scholar]
  27. Auty, R.M. Resource-Based Industrialization: Sowing the Oil in Eight Developing Countries; Oxford University Press: Oxford, UK, 1990. [Google Scholar]
  28. Gelb, A.H. Oil Windfalls: Blessing or Curse? Oxford University Press: Oxford, UK, 1988. [Google Scholar]
  29. Sachs, J.D.; Warner, A.M. Sources of slow growth in African economies. J. Afr. Econ. 1997, 6, 335–376. [Google Scholar] [CrossRef] [Green Version]
  30. Gylfason, T. Resources, Agriculture and Economic Growth in Economies in Transition. Kyklos 2000, 53, 337–361. [Google Scholar] [CrossRef]
  31. Di John, J. Oil abundance and violent political conflict: A critical assessment. J. Dev. Econ. 2007, 43, 961–986. [Google Scholar] [CrossRef]
  32. Auty, R.M. The political economy of resource-driven growth. Eur. Econ. Rev. 2001, 45, 839–846. [Google Scholar] [CrossRef]
  33. Woolcock, M.; Pritchett, L.; Isham, J. The social foundations of poor economic growth in resource-rich countries. In Resource Abundance and Economic Development; Auty, R.M., Ed.; Oxford University Press: Oxford, UK, 2001; pp. 76–92. [Google Scholar]
  34. Tornell, A.; Lane, P.R. The voracity effect. Am Econ Rev. 1999, 89, 22–46. [Google Scholar] [CrossRef]
  35. Ross, M.L. The political economy of the resource curse. World Polit. 1999, 51, 297–322. [Google Scholar] [CrossRef]
  36. Baland, J.M.; Francois, P. Rent-seeking and resource booms. J. Dev. Econ. 2000, 61, 527–542. [Google Scholar] [CrossRef]
  37. Auty, R.M. Natural resource rent-cycling outcomes in Botswana, Indonesia and Venezuela. Int. Soc. 2005, 57, 33–44. [Google Scholar] [CrossRef]
  38. Gylfason, T. Natural resources, education, and economic development. Eur. Econ. Rev. 2001, 45, 847–859. [Google Scholar] [CrossRef]
  39. Easterly, W.; Levine, R. It’s Not Factor Accumulation: Stylized Facts and Growth Models; Central Bank of Chile: Santiago, Chile, 2002; Volume 6, pp. 61–114. [Google Scholar]
  40. Torvik, R. Natural resources, rent seeking and welfare. J. Dev. Econ. 2002, 67, 455–470. [Google Scholar] [CrossRef] [Green Version]
  41. Usui, N. Dutch disease and policy adjustments to the oil boom: A comparative study of Indonesia and Mexico. Resour. Policy. 1997, 23, 151–162. [Google Scholar] [CrossRef]
  42. Acemoglu, D.; Johnson, S.; Robinson, J.A. The colonial origins of comparative development: An empirical investigation. Am Econ Rev. 2001, 91, 1369–1401. [Google Scholar] [CrossRef]
  43. Fagerberg, J.; Verspagen, B. Technology-gaps, innovation-diffusion and transformation: An evolutionary interpretation. Res. Policy. 2002, 31, 1291–1304. [Google Scholar] [CrossRef]
  44. Dasgupta, S.; Singh, A. Manufacturing, Services and Premature Deindustrialization in Developing Countries: A Kaldorian Analysis. In Advancing Development; Palgrave Macmillan: London, UK, 2007; pp. 435–454. [Google Scholar]
  45. Naudé, W.; Szirmai, A.; Lavopa, A. Industrialization Lessons from BRICS: A Comparative Analysis; IZA Discussion Paper No. 7543; IZA Institute of Labor Economics: Bonn, Germany, 2013. [Google Scholar]
  46. Rodrik, D. Growth After the Crisis. In Aftermath; New York University Press: New York, NY, USA, 2001. [Google Scholar]
  47. Szirmai, A.; Verspagen, B. Manufacturing and economic growth in developing countries, 1950–2005. Struct. Chang. Econ. Dyn. 2015, 34, 46–59. [Google Scholar] [CrossRef] [Green Version]
  48. Kathuria, V.; Raj, R.N. Is manufacturing an engine of growth in India? Analysis in the post nineties. In Proceedings of the Frontier Issues in Technology, Development and Environment, Chennai, India, 19–21 March 2010; pp. 22–23. [Google Scholar]
  49. Thomas, J.J. Why is Manufacturing Not the Engine of India’s Economic Growth, Examining Trends, 1959–60 to 2008/9; Mimeo: New Delhi, India, 2009. [Google Scholar]
  50. Dasgupta, S.; Singh, A. Will Services be the new engine of Indian economic growth? Dev. Chang. 2005, 36, 1035–1057. [Google Scholar] [CrossRef]
  51. Awokuse, T.O. Exports, economic growth and causality in Korea. Appl. Econ. Lett. 2005, 12, 693–696. [Google Scholar] [CrossRef]
  52. Awokuse, T.O. Causality between exports, imports, and economic growth: Evidence from transition economies. Econ. Lett. 2007, 94, 389–395. [Google Scholar] [CrossRef]
  53. Bigsten, A.; Gebreeyesus, M. Firm productivity and exports: Evidence from Ethiopian manufacturing. J. Dev. Stud. 2009, 45, 1594–1614. [Google Scholar] [CrossRef]
  54. Sheridan, B.J. Manufacturing exports and growth: When is a developing country ready to transition from primary exports to manufacturing exports? J. Macroecon. 2014, 42, 1–13. [Google Scholar] [CrossRef]
  55. Levin, A.; Raut, L.K. Complementarities between exports and human capital in economic growth: Evidence from the semi-industrialized countries. Econ. Dev. Cult. Chang. 1997, 46, 155–174. [Google Scholar] [CrossRef]
  56. Naudé, W.; Bosker, M.; Matthee, M. Export specialisation and local economic growth. World Econ. 2010, 33, 552–572. [Google Scholar] [CrossRef]
  57. Isaiah Zayone, T.; Henneberry, S.R.; Radmehr, R. Effects of agricultural, manufacturing, and mineral exports on Angola’s economic growth. Energies 2020, 13, 1494. [Google Scholar] [CrossRef] [Green Version]
  58. Shah, S.F.A.; Qyyum, M.A.; Qadeer, K.; Lee, M. Sustainable economic growth and export diversification potential for Asian LNG-exporting countries: LNG–petrochemical nexus development using product space model. Energy 2021, 236, 121334. [Google Scholar] [CrossRef]
  59. Fosu, A.K. Primary Exports and Economic Growth in Developing Countries. World Econ. 1996, 19, 465–475. [Google Scholar] [CrossRef]
  60. Xu, Z. Effects of Primary Exports on Industrial Exports and GDP: Empirical Evidence. Rev. Dev. Econ. 2000, 4, 307–325. [Google Scholar] [CrossRef]
  61. Michaely, M. Exports and growth: An empirical investigation. J. Dev. Econ. 1977, 4, 49–53. [Google Scholar] [CrossRef]
  62. Tyler, W.G. Growth and export expansion in developing countries: Some empirical evidence. J. Dev. Econ. 1981, 9, 121–130. [Google Scholar] [CrossRef]
  63. Marconi, N.; de Borja Reis, C.F.; de Araújo, E.C. Manufacturing and economic development: The actuality of Kaldor’s first and second laws. Struct. Chang. Econ. Dyn. 2016, 37, 75–89. [Google Scholar] [CrossRef]
  64. Roodman, D.M. A note on the theme of too many instruments. Oxf. Bull. Econ. Stat. 2009, 71, 135–158. [Google Scholar] [CrossRef]
  65. Brito, R.D.; Bystedt, B. Inflation targeting in emerging economies: Panel evidence. J. Dev. Econ. 2010, 91, 198–210. [Google Scholar] [CrossRef]
  66. Mankiw, N.G.; Romer, D.; Weil, D.N. A contribution to the empirics of economic growth. Q. J. Econ. 1992, 107, 407–437. [Google Scholar] [CrossRef]
  67. Jones, C.I. Time series tests of endogenous growth models. Q. J. Econ. 1995, 110, 495–525. [Google Scholar] [CrossRef] [Green Version]
  68. Bond, S.; Leblebicioǧlu, A.; Schiantarelli, F. Capital accumulation and growth: A new look at the empirical evidence. J. Appl. Econ. 2010, 25, 1073–1099. [Google Scholar] [CrossRef] [Green Version]
  69. Su, D.; Yang, Y. Manufacturing as the key engine of economic growth for middle-income economies. J. Asia. Pac. Econ. 2017, 22, 47–70. [Google Scholar] [CrossRef] [Green Version]
  70. Lan, X. Embedded Power: Chinese Government and Economic Development; Horizon Books and Shanghai People’s Publishing House: Shanghai, China, 2021. (In Chinese) [Google Scholar]
  71. Hanushek, E.A.; Kim, D. Schooling, Labor Force Quality, and Economic Growth; Working Paper No. 5399; National Bureau of Economic Research: Cambridge, MA, USA, 1995. [Google Scholar]
  72. Lee, J.W.; Barro, R.J. Schooling quality in a cross-section of countries. Economica 2001, 68, 465–488. [Google Scholar] [CrossRef]
  73. Dessus, S. Human Capital and Growth: The Recovered Role of Education Systems. In Policy Research Working Paper 2632; The World Bank: Washington, DC, USA, 1999. [Google Scholar]
  74. Buysse, K.D.L. Human Capital and Growth in OECD Countries: The Role of Public Expenditure on Education. In The impact of Fiscal Policy; Banca d’Italia, Research Department, Public Finance Workshop: Perugia, Italia, 2002. [Google Scholar]
  75. Panagariya, A. Miracles and debacles: In defence of trade openness. World Econ. 2004, 27, 1149–1171. [Google Scholar] [CrossRef]
  76. Song, H. New Challenges to the Export Oriented Growth Model. In Moving toward a New Development Model for East Asia: The Role of Domestic Policy and Regional Cooperation; ERIA Research Project Report 10; Economic Research Institute for ASEAN and East Asia (ERIA): Jakarta, Indonesia, 2011. [Google Scholar]
  77. Sargan, J.D. The Estimation of Economic Relationships using Instrumental Variables. Econometrica 1958, 26, 393–415. [Google Scholar] [CrossRef]
  78. Hansen, L.P. Large Sample Properties of Generalized Method of Moments Estimators. Econometrica 1982, 50, 1029–1054. [Google Scholar] [CrossRef]
  79. Andersen, T.G.; Sørensen, B.E. GMM Estimation of a Stochastic Volatility Model: A Monte Carlo Study. J. Bus. Econ. Stat. 1996, 14, 328–352. [Google Scholar]
  80. Bowsher, C.G. On testing overidentifying restrictions in dynamic panel data models. Econ. Lett. 2002, 77, 211–220. [Google Scholar] [CrossRef] [Green Version]
  81. Blundell, R.; Bond, S. Initial conditions and moment restrictions in dynamic panel data models. J. Econom. 1998, 87, 115–143. [Google Scholar] [CrossRef] [Green Version]
  82. Labra Lillo, R.; Torrecillas, C. Estimando datos de panel dinámicos. Un enfoque práctico para abordar paneles largos. Rev. Colomb. Estad. 2018, 41, 31–52. [Google Scholar] [CrossRef] [Green Version]
  83. Arellano, M.; Bover, O. Another look at the instrumental variable estimation of error-components models. J. Econom. 1995, 68, 29–51. [Google Scholar] [CrossRef] [Green Version]
  84. Awokuse, T.O. Trade openness and economic growth: Is growth export-led or import-led? Appl. Econ. 2008, 40, 161–173. [Google Scholar] [CrossRef]
  85. Esfahani, H.S. Exports, imports, and economic growth in semi-industrialized countries. J. Dev. Econ. 1991, 35, 93–116. [Google Scholar] [CrossRef] [Green Version]
  86. Riezman, R.G.; Whiteman, C.H.; Summers, P.M. The engine of growth or its handmaiden? In Long-Run Economic Growth; Physica-Verlag HD: Berlin/Heidelberg, Germany, 1996; pp. 77–110. [Google Scholar]
  87. Thangavelu, S.M.; Rajaguru, G. Is there an export or import-led productivity growth in rapidly developing Asian countries? A multivariate VAR analysis. Appl. Econ. 2004, 36, 1083–1093. [Google Scholar] [CrossRef]
  88. Rowthorn, R.; Coutts, K. De-industrialisation and the Balance of Payments in Advanced Economies; Centre for Business Research, University of Cambridge: Cambridge, UK, 2013. [Google Scholar]
  89. Palma, J.G. Desindustrialización, desindustrialización ‘prematura’ y un Nuevo concepto del ‘síndrome holandés’. El Trimest. Econ. 2019, 86, 901–966. [Google Scholar] [CrossRef]
  90. Rodrik, D. Back to Fundamentals in Emerging Markets. Project Syndicate, 13 August 2015. [Google Scholar]
Figure 1. Plot of GDP growth versus Manufacturing Share × Export Share for all countries. (Note: Data are obtained from the three-year annual average between 1996 and 1998 for 130 developing countries.)
Sustainability 14 01646 g001
Figure 2. Plot of GDP growth versus Manufacturing Share × Export Share for the lower-income group. (Note: Data obtained from the three-year annual average for 1996–1998 for the lower-income group among the 130 developing countries.)
Sustainability 14 01646 g002
Figure 3. Plot of GDP growth versus Manufacturing Share × Export Share for the upper-income group. (Notes: Data obtained from the three-year annual average for 1996–1998 for the upper-income group among the 130 developing countries.)
Sustainability 14 01646 g003
Table 1. Summary statistics of the data for 130 developing countries.
VariableObs.MeanStd. Dev.MinMax
gdpg6872.512.82−9.499.97
ms68713.156.340.4547.69
gee6874.271.770.7513.73
exp68737.1922.892.39168.78
lnpop68715.921.819.8920.96
lgdppc6875196.085859.28224.3449,491.59
Table 2. Estimates for the shares of manufacturing and exports in GDP growth. 1
(1)(2)(3)(4)(5)
lgdpg0.3011 ***0.3185 ***0.0856 *0.0787−0.2109
(0.0418)(0.0434)(0.0477)(0.1784)(0.1808)
lms0.04810.05050.10020.05630.1376
(0.0617)(0.0610)(0.0822)(0.1104)(0.1343)
gee−0.0313−0.0040.01060.0111.4483 **
(0.0632)(0.0647)(0.1679)(0.2206)(0.5815)
exp0.0160.01570.0711 **0.0848 *0.5620 **
(0.0110)(0.0106)(0.0310)(0.0454)(0.2414)
ms·exp0−0.0002−0.0059 **−0.0019−0.0444 ***
(0.0013)(0.0012)(0.0027)(0.0040)(0.0162)
dev·ms·exp0.00030.00040.0036 *0.0010.0287 **
(0.0008)(0.0008)(0.0018)(0.0034)(0.0136)
dev−0.8315−0.8793−2.1782−0.8103−7.5818 *
(0.6854)(0.6663)(1.4379)(2.0946)(4.2614)
lnpop0.11920.1096−3.3314 *−13.5823 ***−3.6083
(0.0727)(0.0728)(1.9366)(4.7181)(6.9141)
pctgdp0.1339 *0.11490.13880.7373 **0.7287 *
(0.0704)(0.0695)(0.2081)(0.3558)(0.4204)
lgdppc−0.0001 ***−0.0001 **−0.0006 ***−0.0017 ***−0.0006
(0.0000)(0.0000)(0.0001)(0.0005)(0.0005)
N687687687506506
R-sq0.1370.2180.186
Countries130130130119119
Period FENoYesYesYesYes
Country FENoNoYesYesYes
IV’s 2337
AR(1): p-value 0.040.71
AR(2): p-value 0.540.07
Sargan test: p-value 0.300.14
Hansen test: p-value 0.260.48
1 Note: Standard errors are in parentheses. Specifications: (1) pooled OLS; (2) time-fixed effects; and (3) time-and country-fixed effects, with robust standard errors clustered by country. (4) Arellano–Bond estimator using one-step GMM; and (5) Arellano–Bover estimator [83] using one-step GMM. AR(1), AR(2), Sargan and Hansen tests with the respective p-values being reported. * means p < 0.1, ** means p < 0.05, *** means p < 0.01.
Table 3. Estimation results from treating regressors as endogenous. 1
(1)(2)
lgdpg−0.3796−0.3762
(0.2728)(0.2315)
ms1.99180.7793
(1.2223)(0.7526)
lms0.13430.2464
(0.1520)(0.5021)
gee2.7429 **1.3866 **
(1.3602)(0.6525)
exp0.6394 **0.3793 *
(0.2985)(0.2164)
ms·exp−0.0560 **−0.0293 *
(0.0214)(0.0161)
dev·ms·exp0.0382 **0.0193
(0.0188)(0.0138)
dev−8.97410.4352
(5.8981)(3.4561)
lnpop−2.06142.9121
(9.1826)(7.6075)
pctgdp0.8483 *0.7136 *
(0.4713)(0.4137)
lgdppc−0.00010
(0.0008)(0.0006)
N506423
Countries119119
Period FEYesYes
Country FEYesYes
IV’s3331
AR(1): p-value0.760.48
AR(2): p-value0.050.06
Sargan test: p-value0.640.13
Hansen test: p-value0.600.70
1 Note: Standard errors are in parentheses. Specifications: (1) Arellano–Bond estimator using one-step GMM; and (2) Arellano–Bover estimator using one-step S-GMM. AR(1), AR(2), Sargan and Hansen tests with the respective p-values are reported. * means p < 0.1, ** means p < 0.05.
Table 4. Estimation results from including the import share and related regressors. 1
(1)(2)(3)
lgdpg−0.223−0.2424−0.2223
(0.3051)(0.3712)(0.3745)
ms1.11242.09372.0275
(1.1153)(1.4944)(1.3611)
lms0.1458−0.0561−0.2314
(0.1390)(0.9705)(0.9436)
gee1.1501 *2.77872.6402
(0.6084)(1.7559)(2.0362)
imp0.1312−0.0083−0.0154
(0.0856)(0.1306)(0.2117)
exp0.5031 *0.7564 **0.7039
(0.2825)(0.3783)(0.5572)
ms·exp−0.0503 *−0.0647 *−0.0601
(0.0299)(0.0363)(0.0517)
ms·imp 0.0008
(0.0228)
dev·ms·exp0.02760.0440.0406
(0.0280)(0.0358)(0.0354)
dev−6.6908−11.3235−10.3341
(7.9928)(11.0051)(10.7573)
lnpop−4.8535−2.0464−1.9394
(10.0702)(11.9631)(11.3724)
pctgdp0.71960.80330.759
(0.4615)(0.6759)(0.6489)
lgdppc−0.0009−0.0004−0.0004
(0.0010)(0.0011)(0.0010)
N506506506
Countries119119119
Period FEYesYesYes
Country FEYesYesYes
IV’s252424
AR(1): p-value0.900.990.74
AR(2): p-value0.070.080.13
Sargan test: p-value0.840.880.56
Hansen test: p-value0.890.920.80
1 Note: Standard errors are in parentheses. Specifications: (1)–(3) Arellano–Bover estimator using one-step GMM. AR(1), AR(2), the Sargan and Hansen tests with the respective p-values are reported. * means p < 0.1, ** means p < 0.05.
Publisher’s Note: MDPI stays neutral with regard to jurisdictional claims in published maps and institutional affiliations.

