Abstract
In recent decades, scientific interest has grown in tackling the vehicle routing problem with a sustainable approach (Green VRP). There are numerous studies in the literature addressing environmental problems from the point of view of efficient planning that allows visualizing the benefits associated with the use of the new technologies in electric vehicles. This paper focuses on the electric vehicle routing problem and considers the batteries’ state of charge (SoC). The problem considers a set of customers, where each one has a specific demand and a time window. Deliveries are performed through a homogeneous fleet of electric vehicles with a fixed charging capacity and limited autonomy. In particular, when the vehicle is traveling, it consumes an amount of energy proportional to the distance it travels; therefore, it must visit battery recharging stations to continue and complete its route. The objective is to determine the performed routes with the minimum cost (time), while seeking to visit the recharging stations as many times as possible. In this way, overcharging and deep discharges are avoided by protecting the battery from degradation. In this paper, four models are proposed: the first model requires that the battery be fully charged in the stations; the second model allows partial recharging; the third formulation limits deep discharge; and a fourth formulation adheres to a limitation associated with overcharging and tries to keep the battery in its most comfortable place. The efficiency of the proposed formulations is tested in structured instances of different sizes. The results obtained show the efficiency of the formulations proposed for the electric vehicle routing problem when considering battery degradation.
1. Introduction
Green logistics seeks to optimize processes and to reduce or efficiently dispose of waste, thus reducing the pressure humans exert on the planet and its resources [1]. It also seeks to position companies in the market through policies focused on reducing their environmental impact, combining their interests with sustainable thinking within its development plan. Transportation is the main component of such activity and contributes a large portion of the greenhouse gas emissions, according to a report by the International Energy Association in 2014. According to this report, 20% of the emissions to the atmosphere, and three-quarters of this proportion, is emitted by land transport. This situation has led to substantial research interest in finding mechanisms based on ecological transport to reduce pollutant emissions. Hence, there is a focus on the environmental impact of the distribution of goods [2]. Among the existing alternatives to address these environmental issues related to routing (the green vehicle routing problem, VRP), models have been developed based on fleets of vehicles with alternative fuels [3].
Environmental issues have occupied a leading role in logistics operations in the last two decades. Considering the fight against climate change and disruptive technological advances, transport companies seek mechanisms that allow them to reduce the environmental effects associated with the delivery of goods through better planning or less-polluting means of transport. In this context, the developed countries have implemented incentives, tax advantages, and various benefits associated with using vehicles with alternative fuels. The above has aroused interest in research on electric vehicles as a sustainable alternative to conventional transport. In recent years, various routing algorithms have been formulated based on electric vehicles, in which the batteries are the main component; such batteries have a useful life that depends on various factors associated with their use, limiting the autonomy of the vehicles. For this reason, the formulation of methodologies that can solve the routing problem and at the same time represent the behavior of the batteries when using efficient planning in the recharging process is highly beneficial and has the objective of reducing battery degradation.
Electric vehicles are powered by motors that use electrical energy, commonly stored in batteries. Although there is a tendency to think that this type of technology appeared in recent decades, electric vehicles originated more than one hundred years ago. Practical electric vehicles with characteristics similar to today’s ones emerged almost simultaneously with the first conventional combustion vehicle [4]. Electric vehicles can be divided into four classes or basic designs differentiated by their operation: hybrid electric vehicles (HEVs), plug-in hybrid electric vehicles (PHEVs), hydrogen fuel cell vehicles (FCEVs), and battery-powered electric vehicles (BEVs). The focus of this article is on PHEVs and BEVs. PHEVs are hybrid electric vehicles with rechargeable batteries that can recover a full charge by connecting a plug to an external electrical power source. PHEVs also have an electric motor and a combustion engine, and their electric autonomy is greater than that of the conventional hybrids as the combustion engine works as a backup when the batteries are depleted [5]. BEVs do not have a combustion engine, and their propulsion is entirely electric. These vehicles have high efficiency, and the driving range varies according to the battery power capacity. This type of vehicle must be charged from the electrical network [6].
The electric vehicles have some advantages, such as (i) they are entirely charged by provided electricity without buying gas ever again; (ii) the electric vehicles are easy to recharge by using a simple socket without visiting a gas station; (iii) some governments offer some economic incentives as the use of the electric vehicles allows the saving of money; (iv) the electric vehicles, by using electrically powered engines, are 100 percent eco-friendly; (v) the engines of the electric vehicles do not need to be lubricated; therefore, the cost of their maintenance typically goes down; and (vi) the batteries of electric vehicles could last up to ten years. However, the EVs have also some disadvantages, such as (i) the EVs must be recharged at recharge points which are not located at available spaces; (ii) the cost of the EVs is much higher than traditional trucks; (iii) electric vehicles are constrained by battery range and speed; (iv) a complete recharge of a battery could take about 4–6 h; however, this work proposes a scheme to decide the recharge time; and (v) the battery must be replaced depending on the type and its use.
Some recently published papers deal with the essential aspects of electric vehicles worldwide. Macioszek [7] analyzes the problems and issues connected with electric vehicles worldwide and in Poland. Macioszek [8] presents the survey results on the e-mobility infrastructure in the Metropolis (Poland) and the potential for development. Finally, [9] proposes two choice models to estimate vehicle purchase behavior and fuel choice. The authors found that Battery EVs (BEVs) were more likely to be purchased, while existing ownership of a driver’s license and a higher purchase budget reduced such a possibility.
This paper presents the electric vehicle routing problem (E-VRP) and considers the battery state of charge (SoC). For this purpose, the formulation of efficient mathematical models for different battery states is proposed. The results allow evaluation of the impacts of restricting the recharge process and limiting the battery SoC. From the reviewed literature, no studies have been found associated with a solution of the E-VRP that considers battery degradation. The paper’s main contribution is the consideration of the realistic E-VRP while considering battery degradation at the recharging points. The results show that the proposed model could be adapted to real problems. A review is given of the published works related to EVs in the last decade, ranging from the more uncomplicated and mainly theoretical models to formulations that better capture reality with possible future works.
Section 2 presents the literature related to batteries in electric vehicles and their degradation and to aspects related to the routing of electric vehicles. Section 3 describes in detail the proposed methodology based on mathematical formulations. In Section 4, the computational results for instances from the literature are detailed and analyzed. Finally, in Section 5, the conclusions of the findings are described, and future studies are proposed.
2. Literature Review
The battery is the most critical component of an electric vehicle and is the primary energy source for its propulsion. The battery constitutes approximately one-third of its sales price [6]. Lithium batteries are one of the most promising technologies and have a high energy and power density. Lithium batteries are also light, cheap, non-toxic, and capable of accepting a fast charge [10]. Gerssen-Gondelach and Faaij [11] predict that by 2030, due to technological advances, the cost of lithium battery packs should decrease, and their capacity should increase considerably. The current autonomies of electric delivery vehicles are between 100 and 200 km. However, this autonomy depends on the type of battery, its capacity, and additional factors such as the vehicle’s recharge, the slopes of the route, the speed, and the acceleration, among other aspects [2].
Lithium batteries have a specific useful life, and their capacity decreases according to use and the passage of time; thus, repairs aiming to reduce battery degradation and extend battery life should be considered within the daily use of the vehicle. The main factors that affect battery degradation are charge cycles, power and depth of charge, and exposure to high temperatures [12]. Because the battery lifespan depends on several factors, including the user’s use and the vehicle’s exposure, many manufacturers of batteries and electric vehicles apply an expiration date without considering individual use factors.
According to [13], the state of health of a battery is 100% upon manufacture and then decreases with time. The models assume that the end of the valuable life occurs when this capacity decreases to 80%. The end of life is defined as when the battery cannot function according to the minimum requirements [14]. The minimum requirements are considered to be the following:
- Capacity fading: When the capacity of a battery under reference conditions has been reduced to 80% compared to the nominal capacity.
- Energy fading: The maximum power delivered by the battery in the reference conditions is reduced to 80% compared to the nominal power.
Battery University [15] indicates that a complete discharge stresses a battery more than a partial discharge. Therefore, it is better not to discharge a battery entirely but to charge it more frequently. In dynamic stress tests presented in the same work, the loss of the capacity of batteries in different cycles of charge and discharge was determined, as shown in Figure 1.
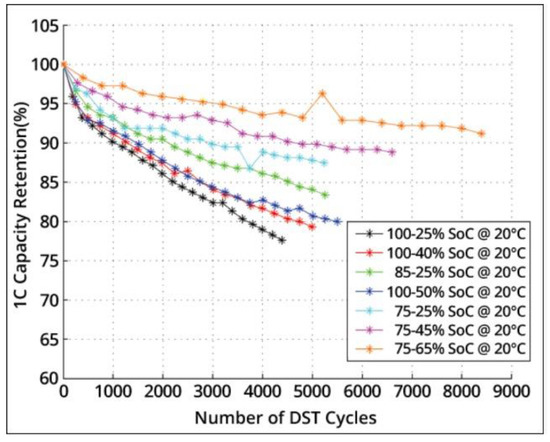
Figure 1.
Battery capacity with respect to charge and discharge cycles. Source [15].
The SoC is the proportion of electrical charge within a battery at a given time in relation to the maximum possible charge [16]. Figure 1 illustrates dynamic stress tests (DST) reflecting the capacity loss when cycling Li ions at various charge and discharge bandwidths. In Figure 1, it [16] can be observed that a more significant degradation occurs in the charge cycles between 25 and 100% of the battery capacity than in a total discharge (reaching 0%). Between 65 and 75% SoC, the battery’s useful life is lengthened; however, in reality, it would be almost impossible to maintain the SoC within that margin as the vehicle autonomy would be minimal and would require having a station that supplies energy nearby at all times. Between 50 and 100% SoC, more than 5000 charge and discharge cycles can be applied; however, problems associated with battery overload would arise each time the recharge was made, and autonomy would still be limited.
Between 25% and 85% SoC, that is, maintaining 60% battery capacity, up to 5000 cycles can be applied; in addition, this range provides sufficient autonomy to deliver goods. The above conditions can be carried out in reality. According to the website of the Porsche brand, lithium batteries are subject to a natural physical and chemical process of progressive wear, bringing with it a reduction in the original autonomy available when the vehicle is produced due to factors such as temperature. In particular, the temperature can affect propulsion power; so, the website recommends avoiding temperatures above 30 °C when parking in full sunlight. In addition, the website indicates that if such avoidance is not possible, the vehicle should be charged to a maximum state of 85% with a high voltage, and the maximum load should be maintained under the threshold of 80%. The company Nissan recommends charging batteries from 20 to 70%. Myall et al. [17] showed that the batteries of the Nissan Leaf model vehicle, with a capacity of 30 kWh, were more affected by degradation than were the batteries of the 24 kWh version, mainly because the former model does not have the option to limit the load; so, it is recharged more frequently to 100%.
Although different models in the literature consider battery charge to follow a linear function in the context of research, this is not the case in reality. In general, load functions are not linear because the voltage and current of the terminals change during the charging process [18]. The charge current is kept constant in the first stage; so, the battery level increases linearly with time. The first phase of charging continues until the voltage of the battery terminals increases to a specific maximum value. In the second phase, the current decreases exponentially, and the voltage at the terminals is kept constant to avoid damage to the battery. Then, the battery level increases concavely with time [2].
Figure 2 presents a typical load curve, where , , and the SoC correspond to the current, the voltage at the terminals, and the SoC, respectively. Due to all the interfering factors, it is highly complex to model this behavior; so, the battery level is determined using differential equations. However, given the complexity of formulating a solution to the VRP with this approach, approximations have been made to these load functions [18]. One of the alternatives used is to perform a piecewise linear approximation, as shown in Figure 3.
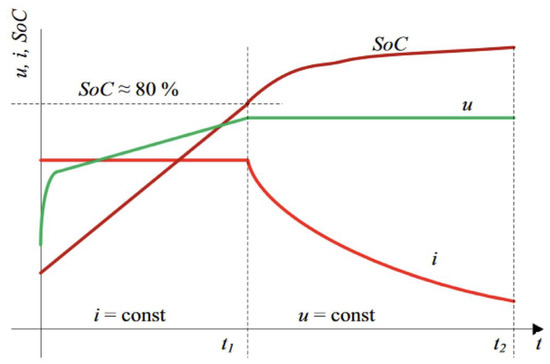
Figure 2.
Typical charging curve, where and represent the current, terminal voltage, and state of charge, respectively. The is equivalent to the battery level. is the period. Source [19].
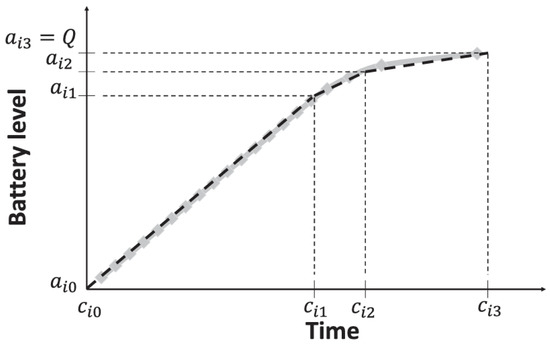
Figure 3.
Real data vs. piecewise linear approximation for a charging station of 22 kW charging a battery of 16 kWh. The battery level Source: [19].
Figure 3 represents the real data for the piecewise linear approximation of a 22 kW load center charging a 16 kWh battery, where and represent the time and load level for each piece of the line [18]. The E-VRP corresponds to a well-known VRP with time windows (VRPTW). Given a set of customers, geographically dispersed depots, and a fleet of vehicles, the VRPTW seeks to determine a set of minimum-cost routes that begin and end in depots. Customers should be visited only once within the defined time windows in which it is possible to provide the service [20]. The problem for conventional vehicles does not consider the action of fueling. If fueling is considered, it is assumed to be of unlimited accessibility or “omnipresent”; so, it is not relevant within the problem, nor does it restrict vehicle autonomy in fleets commonly composed of combustion vehicles.
The extension of the VRPTW that includes electric vehicles (E-VRPTW) is considered an NP-hard combinatorial optimization problem due to the high computational cost in its solution [21]. In the E-VRPTW, as its name implies, a fleet of electric vehicles or mixed fleets composed of electric vehicles, hybrids, or a mixture of both are used. A fleet with a fixed number of trained vehicles with limited autonomy is initially located in a fully recharged depot. These vehicles can leave the depot to serve customers and visit stations where they can recharge their batteries during their planning horizon and thus extend their autonomy to meet customer demand in the corresponding time windows [22]. The objective is to find routes that minimize the cost (distance, time, degradation, and load, among others).
The use of electric vehicles has been growing in recent years due to interest from government entities in taking action concerning the effects produced by pollution, especially with regard to land transportation. Various incentives have been promoted to reduce the use of fossil fuels. According to [23], these incentives range from adopting strict regulations to control fuel consumption and emissions to promoting research and development, offering financing to cover the costs of obtaining a sustainable vehicle. Such actions are mainly taken in developed countries, where, according to the same study, the sales and acquisition of electric vehicles exceed 350,000 units only in the US, followed by Asian and then European countries. Considering that these incentives and advantages have an uncertain future, it is necessary to look for alternatives that significantly reduce emissions and the efficient use of energy and promote electric vehicles over conventional vehicles.
Several authors have proposed studies regarding the size and configuration of fleets. Gonçalves et al. [24] study the problem of the delivery and removal of goods through a fleet composed of electric vehicles and combustion vehicles, allowing fuel or electrical energy to be loaded at any point of its route. Lebeau et al. [25] included time windows, vehicle capacity, and service times in deliveries to customers in their mixed-fleet formulation, considering only linear refills made in the depot. Van Duin et al. [25] included electric vehicles in routing problems without considering the battery charge.
Hiermann et al. [26] proposed a vehicle routing formulation with a heterogeneous fleet of electric vehicles and optimal locations of charging stations. Conrad and Figliozzi [27] formulated a model with time windows and vehicle capacities in which battery recharging can be carried out at customer locations. Erdogan and Miller-Hooks [28] introduced the green VRP considering the recharging of vehicles with alternative fuels. The objective of the work was to minimize the distance traveled, taking into account the driving range and the locations of the charging stations.
Omidvar and Tavakkoli-Moghaddam [29] studied the effect of congestion, considering travel speeds and times. This model allows customers to wait during periods of high congestion. Schneider et al. [21] study the VRP, considering time windows, customer demand, capacity constraints, and autonomy. Recharging at stations was assumed to be linear, and the constant speed and the recharge time were related to the battery’s capacity when arriving at the station. The instances generated by Schneider et al. [21] have been widely used to solve different variants of the E-VRP.
The published works above consider a complete battery recharge when passing through a station. However, several authors, including Desaulniers et al. [30], Keskin and Çatay [31], Felipe et al. [32], and Sassi et al. [33], have included in their routing models the possibility of partial battery recharge. Sassi et al. [33] defined time windows for stations.
Other studies, including multiple recharging options such as fast charging with so-called “superchargers”, have been considered by Kobayashi et al. [34], Keskin and Çatay [31], and Felipe et al. [32]. The last work combines partial recharge with fast charging options.
Some authors added physical variables to make the problem more realistic. Sassi et al. [35] included limitations of the electrical network for the E-VRP. Preis et al. [36] considered components in the routing of electric vehicles related to air resistance, resistance to road slopes, wheels, and regenerative braking. Basso et al. [37] used coefficients related to topography, speed, powertrain efficiency, and acceleration and braking at traffic lights and intersections. Alesiani and Maslekar [38] restricted the number of vehicles simultaneously present at recharging stations. Goeke and Schneider [39] took into account information associated with the vehicle mass, speed, and road shape. Many of the contributions mentioned in this review consider battery recharge as a linear function. However, Montoya et al. [17] consider models with nonlinear components that are introduced in the recharge process.
Sweda and Klabjan [40] considered the problem of finding the minimum cost of an arc in the minimum cost path problem (MCPP), assuming that the battery SoC is always above a minimum threshold and below its capacity, without allowing it to reach zero, thus protecting the battery from deep discharges. Sweda et al. [41] carried out studies to determine the optimal charge of a battery along an arc in the MCPP to obtain greater profitability and contribute to extending the useful life of the batteries. In that work, the costs associated with recharging at stations and the penalties for frequent stops were added to the costs associated with overloading above a certain threshold, primarily if higher voltages were used in the process. Arlsan et al. [42], considering a fleet composed of hybrid vehicles, penalized deep discharge of the battery in the MCPP.
In recent years, thanks to technological advances, alternatives to recharging batteries at stations have been proposed to reduce the cost and the time that such recharging implies. These alternatives include exchanging electric vehicle batteries for fully charged batteries. Among such studies, we can highlight the contributions of Yang and Sun [43], Verma [44], and Hof et al. [45], which include the possibility of adapting recharging stations as exchange locations or modeling the optimal locations of designated stations. Finally, Raeesi and Zografos [46] introduced a new formulation without deviations in the route that allows a battery change to be requested at any place by using exchange vans and synchronizing the routing of the electric vehicles with these “mobile stations.”
Futalef et al. [47] have studied the E-VRP and considered the EV limitations, such as short driving range, high charging time, poor charging infrastructure, and battery degradation. The customers have time windows, and nonlinear charging functions and limited charge station (CS) capacities have been considered within the problem. The authors determine a State of Health (SOH) policy with a charge percentage between 38% and 82%. However, this work assumes that the vehicles leave the depot with a full charge of 82%. Therefore, partial recharge is not considered to improve the battery’s life. Besides, the proposed scheme forces the completion of a full recharge (within the maximum value of the range).
Some works have studied different variants of the E-VRP with special characteristics [48,49,50,51]. Schiffer et al. [48] analyze the deployment of commercial electric vehicles in retail mid-haul logistics fleets for current and future technology scenarios. An approach is to combine the total cost of ownership calculations with a rich, location-routing model proposed by the Electric Location Routing Problem (E-LRP). In [48], the battery degradation considerations are considered an approximation of a consumption linear recharging rate r[kWh/min] when recharging an electric vehicle. This work considers partial recharging, assuming linear, without comparing SOH policies.
Zhang et al. [49] study the battery electric bus service (EBS) and charging strategy to minimize the total operational cost of the transit system, where the cost incurred by battery degradation and nonlinear charging profile is considered. The authors assume that the battery electric bus (BEB) is always charged to a given minimum value (SoCinit) whenever charging activity occurs during the daily operation period. Moreover, at the end of daily operation, the BEB must be recharged back to (SoCinit) to prepare for the next day’s service. According to the authors, this assumption is well in line with the empirically observed charging behaviors as it is convenient to apply and requires less organizational effort. The authors have considered SoCinit ranges from 70% and 100%. Note that the different performance rates for the BEB have not been studied in our proposal.
Xu et al. [50] address the tactical electric vehicle fleet size (EVFS) problem faced by carsharing service (CSS) providers while considering the operational vehicle assignment, vehicle relocation, and vehicle charging strategies (i.e., the charging duration at each station) in pursuit of profit maximization. According to the authors, the novelty of this study lies in the incorporation of the nonlinear battery-wear cost incurred during the battery charging and discharging processes. The authors assume a linear charging and discharging process; both the charging and the discharging rate, i.e., the uniform variation of the SoC per unit of time, are represented by constants, CR and DR, respectively. Likewise [50], the usable battery capacity E is also measured by SoC, i.e., E = 100%. Without the loss of generality, in this work it is assumed that Emin denotes the minimum SoC value allowed for an EV.
Zang et al. [51] adopt three battery depreciation methods to investigate and compare their influences on the EVRP with time windows (EVRPTW): (1) a nonlinear function of charging; (2) a linear function of charge–discharge cycles; and (3) a linear function of total traveling distance. In similarly described works, the authors limit the complete discharge between two charging policies: recharging to total capacity whenever the SoC is lower than 30% versus 10% for a 100 kWh. It is easy to conclude that a lower discharge depth can increase the battery’s life. Therefore, the recharging strategy, such as determining the recharging quantity at a certain state of charge (SOC, the level of battery power), significantly influences the battery’s lifecycle with respect to the EVRP. Our proposal considers the different policies without limiting the discharge process by a penalization scheme of overcharging at stations.
Recently, Reyes-Rubiano et al. [52] analyzed a realistic vehicle routing problem, considering driving-range constraints and stochastic travel times. The objective function minimizes the expected time-based cost required to complete the planned routes. A simheuristic algorithm is proposed to solve it. Finally, Martins et al. [53] propose a categorization of the current work in the field of electric vehicle routing problems. In particular, articles related to the well-known vehicle routing, arc routing, and team orienteering problems have been considered. Several research opportunities have been highlighted.
Table 1 shows the published work carried out in the last decade and considers the particular characteristics of each of the works and how the proposed models differ and assume some of them in their formulation. The variables that stand out in the literature are partial recharging, customer time windows, penalties for complete discharge on the vehicle’s route, overcharging at stations in the energy-transfer process, and the formulations that characterize the recharge curve as a non-linear function.

Table 1.
Main characteristics of the published papers in the last decade.
As described in this section, several published papers have considered different electric vehicle routing problems and considered different charging functions and different constraints. However, no studies consider the E-VRP while considering battery degradation at the recharging points and the different characteristics, as shown in Table 1. In this way, models are desired to solve the E-VRP and contain realistic components.
3. Proposed Methodology
This section describes the Electric Vehicle Routing Problem with Time Window and recharging stations (E-VRPTW). This problem considers the possibility of recharging at any available station with the recharging times depending on the charge level when the vehicle arrives at a station. In addition, the E-VRPTW considers capacity constraints as well as time windows. The objective function minimizes the number of employed vehicles and the total travel distance. We propose four exact models that seek to solve the problem, considering constraints both in the recharging process in the stations and in the state of charge of the batteries (SoC) during the arcs of vehicles on the routes. Our proposed approaches incorporate the characteristics of the battery while avoiding its fast degradation. To our knowledge, no published works deal with this aspect. The mathematical structure of the models is unique and flexible and could be extended to different variants of EVs. Therefore, a comparison of the different strategies to charge the battery has been explored.
3.1. Electric Vehicle Routing Problem Considering the State of Charge of the Batteries
The electric vehicle routing problem involves a set of geographically distributed customers, where each one has a known demand and time window in which they must be visited. Deliveries are performed by a homogeneous fleet of electric vehicles with a fixed load capacity and limited autonomy. While the vehicle is moving, it consumes an amount of energy proportional to the distance it travels; therefore, it must visit as many times as necessary the recharging stations located at various points. These stations allow the battery to be recharged efficiently (amount of energy), and thus, the vehicle could conclude the route. The battery recharging time depends on the charge level when the vehicle arrives at the station and is proportional to the amount of transferred energy.
The main objective is to determine the routes that represent the minimum cost (time) when starting and ending at the depot. The customers must be visited once to satisfy their demand. The aim is to visit the stations the least number of times, allowing a partial recharge that implies transferring only enough energy (recharging efficiency), and avoiding the battery’s deep discharges during the route and overcharging in the transfer process stations. This situation would extend the useful life of the batteries, the main component of electric vehicles.
3.2. Proposed Mathematical Formulations
Mixed-integer linear programming models have been formulated to evaluate the impact generated by partial recharges at the stations and concern a scenario where the battery must be fully recharged to solve the E-VRP while considering the battery SoC. Subsequently, limiting the SoC during the vehicle’s movement in its route and in the energy transfer process was examined. For this purpose, four models with a similar structure were formulated. However, each model has particular constraints that limit certain behaviors in the recharge state and process.
Let be a set of vertices with , where denotes the set of customers and the set of recharging stations, which is defined as , where corresponds to the recharging stations and is a set that contains copies of each station to allow multiple visits to them. The vertices and denote the depots where each route starts and ends.
A set containing depot and/or is expressed as follows: Therefore, the E-VRP that considers the battery SoC can be defined as a complete directed graph. where is the set of arcs with an associated distance and a travel time . Each arc has a constant battery consumption rate . For each route, the remaining battery power consumed is . The fleet is composed of similar electric vehicles with a load capacity and a battery capacity . Each vertex V is associated with a positive demand which is if V. In addition, the set of vertices V has a service time Each node is associated with a time window , where is the earliest start time and is the latest completion time.
In the stations, a linear recharge is assumed, where energy is transferred to the batteries at a rate of . The time incurred for this action will depend on the battery SoC when arriving at the station and on the amount of energy supplied in the transfer process. Decision variables are generated with single indices that track the different states of the vehicle during its route to simplify the model. The index indicates the arrival time at vertex i, , which indicates the remaining charge level at vertex , and , which tracks the battery SoC at node , where . Considering the scenario where partial recharge is allowed in the stations, the variable is included, which indicates the amount of energy supplied to the battery at the station, where . The binary decision variable with takes the value 1 if the arc is traversed and 0 otherwise.
The objective function seeks to minimize the total time used in the routes, considering the time of movement between vertices, the time incurred in recharging the batteries, and the service time. In pursuit of the minimization objective, the model is also responsible for deciding if the size of the fleet defined as input data is optimal for the solution or if the number of electric vehicles to be used can be reduced. Based on the above, four models were formulated, as described below.
3.2.1. Model That Only Allows Batteries to Be Fully Recharged at Stations
This formulation assumes that when arriving at a recharging station, the difference between the battery SoC and its total capacity is supplied at an energy transfer rate ; that is, it does not allow a partial recharge. In this model, the vehicles arrive with energy in their batteries after finishing the route. This situation is the most damaging in terms of battery degradation because the battery is overcharged every time a station is visited, and there are no limitations in terms of complete discharges.
Sets
| Customers | |
| Customers including the depot node , | |
| Real charging stations | |
| Fictitious charging stations, to visit other stations more than once | |
| Real and fictitious charging stations | |
| Customers including the charging stations | |
| Customers including the charging stations and the depot node , | |
| Customers including the charging stations and the depot node , | |
| Customers including the charging stations and the depots node and , |
Parameters
| Euclidean distance from vertex to () | |
| Travel time from vertex to () | |
| Consumption energy from vertex to () | |
| Vehicle capacity | |
| Battery capacity | |
| Consumption energy rate of battery | |
| Charging rate of battery at the station | |
| Fleet size (number of electric vehicles) | |
| Average driver speed | |
| Demand of the node ( is 0 if | |
| Earliest time window of node () | |
| Latest time window of node i () | |
| Service time of node () |
Decision Variables
| If node immediately precedes node () | |
| Otherwise | |
| Decision variable that indicates the arrival time at node () | |
| Decision variable that indicates the remaining capacity of the vehicle battery upon reaching the node (). | |
| Decision variable that indicates the status or remaining capacity of the battery in node (). |
Objective Function:
Subject to:
Equation (1) is the objective function that minimizes the times incurred in the route, considering the time used to move between nodes, the time it takes to recharge the battery at the stations, and the service time at both the customer locations and the charging stations. Only full battery recharge is allowed in the power supply process. Equation (2) guarantees the customers’ connectivity, allowing only one arc to connect to another customer, recharging station, or final depot. Equation (3) addresses visits to recharging stations, allowing an exit arc to another customer node or a final depot if necessary. Equation (4) does not allow a direct arc from the initial depot to the end of the path (depot). Equation (5) finally determines the number of electric vehicles in the fleet to leave the depot. Equation (6) prevents the existence of consecutive recharges, restricting immediate visits to stations. Constraint (7) determines the flow equilibrium, making the number of output arcs equal to the number of input arcs at each vertex. Equation (8) ensures the temporal viability of the arcs that leave the customers and the depot, considering arrival times, service times, and movement times between vertices. Equation (9) guarantees the temporal viability of the arcs that leave the recharging stations, also taking into account the time incurred in recharging the battery, which corresponds to the difference between the SoC of the vehicle upon arrival at the station and the total capacity. Equation (10) guarantees the fulfillment of the time windows at each vertex, including the depot. Equations (8)–(10) are responsible for eliminating sub-routes. Equations (11) and (12) ensure compliance with customer demand. Equation (13) controls the battery SoC upon departure from the depot and the customers, considering the energy consumption between vertices. Equation (14) controls the SoC of the vehicle when arriving and leaving the stations, ensuring total recharge of the battery in this process of energy transfer. Equations (15) and (16) define the decision variables.
3.2.2. Mathematical Model That Allows Partial Recharging of the Battery at Stations
This formulation makes it possible to supply the energy necessary to continue and complete the route at the stations. This model does not require a total recharge; however, it allows it if necessary. The electric vehicles that make up the fleet arrive at the depot without energy in their batteries, which implies an increase in the efficiency of the charging process.
Consider the same sets and parameters of the model (1)–(16), adding, however, a new decision variable:
= Decision variable that indicates the amount of energy supplied to the battery from the vehicle at the charging station ().
Objective Function:
Subject to:
Equation (17) considers the objective function, similar to Equation (1), and considers the incurred time for recharging the station’s battery, which does not necessarily correspond to the total energy remaining to complete the battery’s capacity. Note that this model seeks to recharge only enough energy (partial recharge) to continue the route and thus avoid unnecessary recharging. Equations (18)–(24) have the same interpretation as Equations (2)–(8). Equation (25) guarantees the temporary viability of the vehicles leaving the stations and also considers the incurred time for recharging energy. Equations (26)–(29) are equivalent to constraints (10)–(13). Equation (30) controls the state of charge of the battery (SoC) of the vehicles when arriving and leaving the stations, allowing partial recharging if required (only enough energy). Equation (31) ensures that the supplied energy exceeds the battery capacity. The constraints (32) determine the state of charge (SoC) of the vehicles in the depot. Equations (33)–(35) define the decision variables.
3.2.3. Model That Allows Partial Recharging and Also Limits Battery Discharge
This formulation allows partial recharging at the stations and adds constraints with the limiting of deep discharge. This discharge is one of the factors that most affects the degradation of the batteries, limiting the charge cycles within their useful life. This formulation does not allow the vehicles’ state of charge (SoC) to drop below 25% of their total capacity. It only decreases that percentage in the last edge, including the last visited customer and the depot, prioritizing the entire load at night or in periods where it is most convenient. The formulation is equivalent to model (17)–(35), adding a variable associated with avoiding deep discharges in order to prevent battery degradation. In this way, a new constraint is added to limit the discharge of the battery:
The constraints (36) indicate that the state of charge of the electric vehicle’s battery (SoC) cannot decrease more than 25% of the total capacity. In this way, the aim is to recharge only enough energy. This threshold is only allowed to be exceeded for the edge from the last customer and the depot.
3.2.4. Model That Allows Partial Recharging, Defines a Maximum Charge Threshold, and Limits Battery Discharge
This model allows partial recharging, constraining deep discharge, and prioritizing surface discharge like the previous formulation. It also adds an upper threshold in order to limit the overload in the energy transfer process. This formulation maintains the battery in the recommended interval between 25% and 85%, presenting 60% autonomy, and extending the battery’s useful life over the long term.
This formulation protects the battery from the degradation caused by deep discharges and adds a maximum threshold that limits the state of charge in order to not overcharge the battery in the power supply process. For this purpose, the formulation of the partial recharge model (17)–(36) is considered, replacing the expression (31) with new constraints (37).
Equation (37) defines a maximum threshold for charging the battery in a station, which corresponds to 85% of its total capacity. Finally, to define the number of electric vehicles () that make up the fleet in any of the four formulations, it is necessary to previously solve each formulation described without considering the constraints (5) or (21) by replacing the objective function with the following expression (38).
Equation (38) minimizes the number of vehicles departing from the depot.
4. Computational Experiments
This section presents the experimental results. Julia programmed all the computational tests using the commercial solver Gurobi Optimizer version 9.0.3. All the executions were performed on an Intel® Core™ i5-2430M CPU @ 2.4 GHz processor with an 8 GB RAM and a 64-bit operating system. A resolution time limit of 7200 s was considered.
First, a small, structured instance is presented to clearly show the four models’ impacts. Then, the problem implemented in the Julia programming language is solved through a commercial solver from these generated data. The above data are used in the models implemented in the Julia programming language. Subsequently, the models were tested using instances in the literature appropriate for this variant of the E-VRP.
The following steps have carried out the development of the proposed methodology:
- Review the literature related to electric vehicles, their physical composition, the behavior of the battery, the types of charge, and their fundamental components. A review of the electric vehicle routing problem with time windows (E-VRPWT) was conducted.
- Define the considered problem.
- Formulate the optimization models mathematically and implement them in the Julia programming language.
- Generate structured instances used as input data for the models.
- Adapt instances of the literature according to the considered problem.
- Run experiments with the Gurobi commercial solver for each formulated instance.
- Compare the results obtained between the implemented models, considering the computing time according to the size of the instance, the objective function value, the number of used electric vehicles, the number of times the vehicle arrives at a charging station, and the quantity of energy supplied to recharge the battery.
- Carry out an analysis of the impact generated by allowing partial recharging and restricting the state of charge of the car batteries and how they influenced the results.
4.1. Discussion Results: Instance with 5 Customers—3 Recharging Stations
A structured instance, formulated based on a distribution of points presented by [21] to graphically and in detail represent the impact of partial recharge and the constraints that limit battery SoC, was considered. The instance considers five customers and three battery recharging stations. Table 2 shows the details of the input dataset, and Table 3 presents the instance parameters. The symmetric and Euclidean distance between the vertices that make up the graph is assumed; the calculation is performed using the expression shown in (39).
Table 2.
Description of the Instance.
Table 3.
Main parameters of the Instance.
We assume the symmetric and Euclidean distance between the vertices that make up the graph; the calculation is carried out using the expression shown in (39).
Therefore, the distance matrix including all the vertices is the following:
Considering that both the average driving speed and the rate of energy consumption are constant and of unit value, it is possible to calculate the time used to move between vertices and the amount of energy consumed when performing this movement . Where:
Thus, for this case, it is possible to calculate the matrices corresponding to the movement times and energy consumption between vertices, whose values are equivalent.
Expression (38) is used as an objective function in the proposed algorithm to determine the minimum size of the fleet corresponding to the input data. From the above, to solve the current problem, we define vehicles as this is the highest value obtained for the four formulations; however, the algorithm will determine posteriorly if it is possible to reduce the fleet size and if the associated times can be minimized. Table 4 shows the results of the four models considering the minimization of times in the route. In the results from Table 4, (a) is used for the model that allows partial recharge of the battery at the stations, (b) is for the model that allows partial recharge of the battery at the stations, (c) is for the model that allows partial recharge and limits the discharge of the battery, and (d) is for the model that allows partial recharge, defines a maximum charge threshold, and limits the discharge of the battery.
Table 4.
Results of the four models for the Instance.
All cases presented the optimal solution (Gap 0%). The results are graphically presented below, visualizing the impact of the partial load constraints and the state-of-charge limitations.
When a model (a) is used, the optimum is achieved with a fleet of electric vehicles generating three routes for the delivery of goods. As shown in Figure 4, the vehicles leave the depot fully charged (100% SoC), and then, in each route, a station is visited where the battery is fully recharged. The SoC during the route reaches a minimum of 18.3%, and the maximum is 100%, the latter being achieved when leaving all stations. At the end of the routes, the vehicles arrive at the depot with a certain percentage of energy in their batteries. The objective function is 452.074 s, which considers the movement time between the vertices, the time incurred for power supply at the three stations, and the service time incurred for each customer and station.
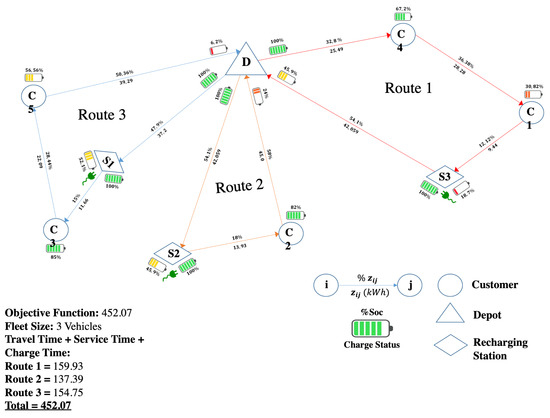
Figure 4.
Model (a): 5 Customer Instances—3 Recharging Stations. Source: Owner.
The optimum is achieved with two electric vehicles when model (b) is used. Therefore, two routes are defined, as shown in Figure 5. Although three visits to recharging stations are performed, the objective function is 372.34 s, lower than the previous case. As the routes of the vehicles are different and time is saved by recharging only enough energy to complete the route, the vehicles return to the depot without energy. The SoC presents a minimum and maximum of 24.21% and 82.64%, respectively, which indicates that it is never necessary to perform a complete recharge.
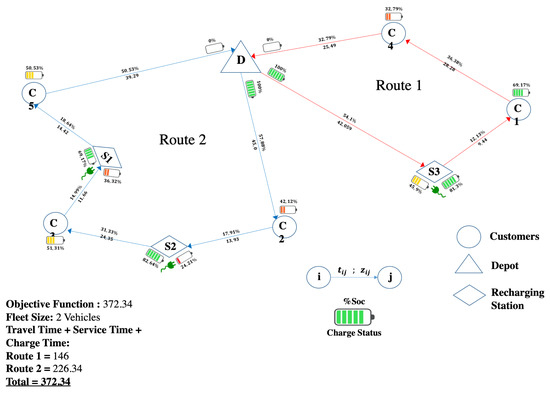
Figure 5.
Model (b): 5 Customer Instances—3 Recharging Stations. Source: Owner.
The optimum is achieved with three electric vehicles when the model (c) is used, as shown in Figure 6. Moreover, the routes traveled by the vehicles are similar to those of model (a). Indeed, routes 2 and 3 are identical in both models, but route 1 changes its trajectory to comply with the efficient recharge and the SoC limitation (SoC > 25%) requirements. The maximum discharge value of the battery is 32.79% of its capacity, higher than the 25% defined as the limit. As with model (b), the batteries arrive without power at the depot. The objective function is 429.93 s, a lower value than model (a), which is mainly justified by the lower time incurred in the energy supply process.
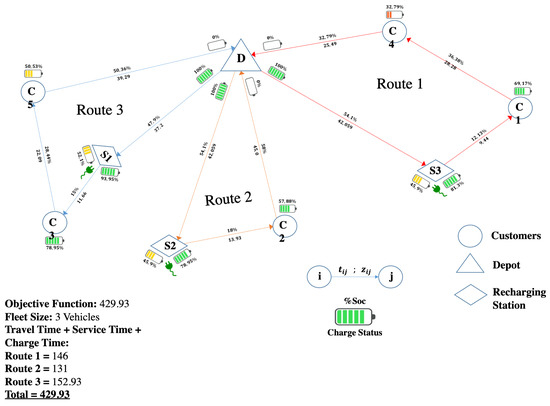
Figure 6.
Model (c): 5 Customer Instances—3 Recharging Stations. Source: Owner.
The optimum is achieved with three electric vehicles when a model (d) is used, as shown in Figure 7. Routes 1 and 2 are the same as those obtained by model (c). However, in route 3, to comply with the limitations of autonomy and to complete the route, it is necessary to visit an additional recharging station; so, the value of the objective function is 444.555 s. A minimum of 32.8% and a maximum of 81.3% are observed with respect to the SoC.
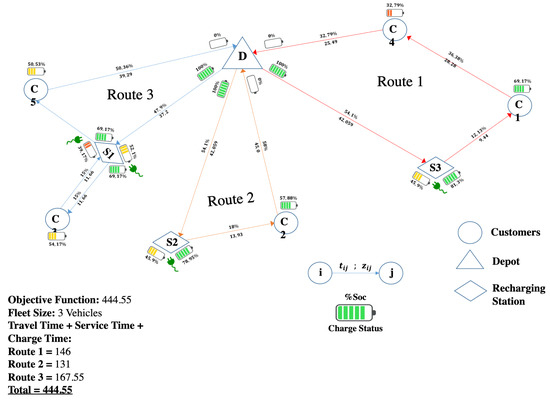
Figure 7.
Model (d): 5 Customer Instances—3 Recharging Stations. Source: Owner.
4.2. Discussion Results: Adapted Instance with 10 Customers—5 Recharging Stations
We considered the existing instances in the literature proposed by Schneider et al. (2014) that have been used in various routing studies with electric vehicles. In particular, it was necessary to adapt the instances incorporating the service time data associated with the recharging stations (42):
The instances consider 5, 10, and 15 customers, whose distribution can be of three forms, types C, R, and RC. The first distribution considers grouped customers; in the second, the customers are randomly distributed; and in the third, the customers are both grouped and randomly distributed. Table 5 shows the characteristics of the test instances.
Table 5.
Description of the instances.
Table 6 and Table 7 show the obtained results for the four models on the ten instances of different sizes.
Table 6.
Number of used vehicles.
Table 7.
Obtained results for all the instances.
The obtained results for five customers (considering both the grouped and the randomly distributed elements) indicate that allowing partial recharge of the battery while maintaining the number of visits to recharging stations decreased the total time, which was mainly due to the savings incurred by recharging only the required amount of energy. By restricting deep discharge (model c), it was unnecessary to incorporate a new vehicle into the fleet for instances C101C5S3, R104C5S3, and RC204C5S4. In addition, the value of the objective function does not vary with respect to the results of model (b), which indicates that the model complied with maintaining an SoC above 25% of the battery capacity. However, in instance R105C5S3, the algorithm showed that an additional electric vehicle is needed to comply with the imposed limitation, increasing the objective function due to the new redistribution of the routes. By including the constraints associated with limiting battery overload, SoC ≤ 85% (model d), for three of the four instances under study, an additional stop at a recharging station is necessary to comply with the desired level of autonomy. This additional step increases the value of the objective function, mainly due to the service time of this new visit, plus the time incurred in the power supply process. However, for C101C5S3, for instance. it was unnecessary to perform this action. Table 6 shows the battery SoC values when leaving the stations and how these values vary according to the model. The solver had a rapid response for the instances with five customers with three or four recharging stations, independently of the distribution of these elements in the graph, in which the computation time did not exceed one second.
For the instances with ten customers, the behavior is similar to that for the instances of five customers. Partial recharge decreases the time incurred in the routes. Instances C202C10S5, R102C10S4, and R203C10S5 present the same number of station visits as in the model that requires full battery recharge; however, for RC108C10S4, where the elements are randomly distributed and grouped, new stops are needed to obtain energy. When applying model (c), limiting deep discharge, only instance R102C10S4 presents the same result as model (b), while the remaining three instances result in a redistribution of routes or consider it necessary to visit a station again to comply with this constraint. When adding a maximum recharge threshold (model d) for the four instances, it is necessary to make new stops at the recharging stations and redistribute the routes to comply with this SoC limitation. In the case of R203C10S5, it is necessary to include an additional vehicle. Therefore, a significant increase in the objective function is produced due to the time spent executing these actions. The solver presented a fast response time, and the maximum resolution time of the models for these instances with ten customers was 273 s for C202C10S5; in the other cases, it did not exceed 80 s.
For 15 customers, tests were performed on the model considering a distribution of the grouped elements. Generally, the consideration of partial recharge decreased the objective function with respect to the total recharge scenario. For C208C15S4, a visit to a recharging station was added. By limiting deep discharge, a redistribution of the routes was produced, and consequently, a change in the percentage of energy supplied. Finally, as observed for the smaller instances, model (d) generated new routes, new visits to stations, in some cases with the need for more vehicles, and, when not meeting the autonomy requirements, an increase in the total time. The computation time, in this case, increased significantly, reaching a maximum of 3427 s and 2000 s on average. Although there is an upward trend in the computational time by increasing the size of the instances, there are some cases in which the particular distribution of the elements affects the rapid solution of the algorithm. An example of the above is instance C208C15S4, which, although it has 15 customers and four recharging stations, can be solved according to model (d) in less than 55 s.
5. Concluding Remarks
In this paper, the electric vehicle routing problem considering the batteries’ state of charge is introduced. This problem evaluates and studies the impact of solving the problem considering efficient recharging to implement scenarios that constrain the autonomy of the vehicles through recommended charge and discharge intervals to extend the life of the batteries. For this purpose, four models capable of representing each of the scenarios mentioned above were proposed, tested, and validated through structured and appropriate instances from the literature.
The proposed models precisely expose the different behaviors in the states of charge of the batteries and can quickly find optimal solutions to the small instances. It was also possible to verify that allowing vehicles to recharge partially reduces the total time spent on delivery routes and contributes to the efficient use of energy. In turn, restricting deep discharges and overcharging, keeping the battery in the state where it is most comfortable, provides sufficient autonomy, which, although it produces an increase in the time spent on the routes due to more significant assistance at the stations, fulfills the customer demand without significantly increasing the number of vehicles in the fleet or the computing time.
Furthermore, it is possible to mention that the computing time, which depends on the size of the instance, is also directly due to the location of both the customers and the charging stations. Therefore, for large instances and a greater concentration of elements, it is necessary to implement heuristic or metaheuristic techniques that allow solving the problem by approximate good quality solutions within a short time.
Future work should focus on studying the different variants of the problem, improving existing algorithms, or adding new variables that bring reality to the formulations. In the case of the problem mentioned above, the scope could be expanded by incorporating heterogeneous fleets of electric vehicles and considering different types of batteries. We could also limit the capacity of the electricity grid, the number of vehicles that recharge simultaneously, and the geographical arrangement of the terrain, considering the energy from the regenerative brake, and include circulation constraints, among others. Finally, granular tabu search strategies could be extended from similar problems [55,56,57,58,59,60] to solve large-size instances of the problem.
Author Contributions
Conceptualization, C.C.-D. and R.L.; methodology, R.L.; software, C.C.-D.; validation, C.C.-D., R.L. and J.W.E.; formal analysis, C.C.-D., R.L. and J.W.E.; investigation, C.C.-D.; resources, C.C.-D.; data curation, C.C.-D.; writing—original draft preparation, J.W.E.; writing—review and editing, J.W.E.; visualization, J.W.E.; supervision, R.L.; project administration, R.L.; funding acquisition, R.L.; All authors have read and agreed to the published version of the manuscript.
Funding
This work has been partially supported by the research project 2060222 IF/R and 2160277 GI/EF from Universidad del Bio-Bio, and Universidad del Valle, Colombia. This support is gratefully acknowledged.
Institutional Review Board Statement
Not applicable.
Informed Consent Statement
Not applicable.
Conflicts of Interest
The authors declare no conflict of interest.
References
- Chunguang, Q.; Xiaojuan, C.; Kexi, W.; Pan, P. Research on Green Logistics and Sustainable Development. In Proceedings of the 2008 International Conference on Information Management, Innovation Management and Industrial Engineering, Taipei, Taiwan, 19–21 December 2008; Institute of Electrical and Electronics Engineers (IEEE): Piscataway, NY, USA, 2008; Volume 3, pp. 162–165. [Google Scholar]
- Pelletier, S.; Jabali, O.; Laporte, G.; Veneroni, M. Battery degradation and behaviour for electric vehicles: Review and numerical analyses of several models. Transp. Res. Part B Methodol. 2017, 103, 158–187. [Google Scholar] [CrossRef]
- Bektaş, T.; Demir, E.; Laporte, G. Green vehicle routing. In Green Transportation Logistics; Springer: Cham, Switzerland, 2016; pp. 243–265. [Google Scholar]
- Høyer, K.G. The history of alternative fuels in transportation: The case of electric and hybrid cars. Util. Policy 2008, 16, 63–71. [Google Scholar] [CrossRef]
- Kebriaei, M.; Niasar, A.H.; Asaei, B. Hybrid electric vehicles: An overview. In Proceedings of the 2015 International Conference on Connected Vehicles and Expo (ICCVE), Shenzhen, China, 19–23 October 2015; Institute of Electrical and Electronics Engineers (IEEE): Piscataway, NY, USA, 2015; pp. 299–305. [Google Scholar]
- Schmalfuß, F.; Mühl, K.; Krems, J.F. Direct experience with battery electric vehicles (BEVs) matters when evaluating vehicle attributes, attitude and purchase intention. Transp. Res. Part F Traffic Psychol. Behav. 2017, 46, 47–69. [Google Scholar] [CrossRef]
- Macioszek, E. Electric Vehicles—Problems and Issues. In Advances in Human Error, Reliability, Resilience, and Performance; Springer Science and Business Media LLC.: Berlin/Heidelberg, Germany, 2019; Volume 1091, pp. 169–183. [Google Scholar]
- Macioszek, E. E-mobility infrastructure in the Górnośląsko-Zagłębiowska Metropolis, Poland, and potential for development. In Proceedings of the 5th World Congress on New Technologies (NewTech’19), Lisbon, Portugal, 18–20 August 2019; Volume 108. [Google Scholar]
- Ling, Z.; Cherry, C.R.; Wen, Y. Determining the Factors That Influence Electric Vehicle Adoption: A Stated Preference Survey Study in Beijing, China. Sustainability 2021, 13, 11719. [Google Scholar] [CrossRef]
- Yong, J.Y.; Ramachandaramurthy, V.K.; Tan, K.M.; Mithulananthan, N. A review on the state-of-the-art technologies of electric vehicle, its impacts and prospects. Renew. Sustain. Energy Rev. 2015, 49, 365–385. [Google Scholar] [CrossRef]
- Gerssen-Gondelach, S.J.; Faaij, A.P. Performance of batteries for electric vehicles on short and longer term. J. Power Sources 2012, 212, 111–129. [Google Scholar] [CrossRef]
- Barré, A.; Deguilhem, B.; Grolleau, S.; Gérard, M.; Suard, F.; Riu, D. A review on lithium-ion battery ageing mechanisms and estimations for automotive applications. J. Power Sources 2013, 241, 680–689. [Google Scholar] [CrossRef] [Green Version]
- Millner, A. Modeling Lithium Ion battery degradation in electric vehicles. In Proceedings of the 2010 IEEE Conference on Innovative Technologies for an Efficient and Reliable Electricity Supply, Waltham, MA, USA, 27–29 September 2010; Institute of Electrical and Electronics Engineers (IEEE): Piscataway, NY, USA, 2010; pp. 349–356. [Google Scholar]
- Lam, L. A Practical Circuit-Based Model for State of Health Estimation of Lion Battery Cells in Electric Vehicles. Master’s Thesis, Delft University of Technology, The Netherlands, 2011. [Google Scholar]
- Battery University. Article BU-808: How to Prolong Lithium-Based Batteries. 2020. Available online: https://batteryuniversity.com/article/bu-808-how-to-prolong-lithium-based-batteries (accessed on 20 November 2021).
- Pelletier, S.; Jabali, O.; Laporte, G. 50th Anniversary Invited Article—Goods Distribution with Electric Vehicles: Review and Research Perspectives. Transp. Sci. 2016, 50, 3–22. [Google Scholar] [CrossRef]
- Myall, D.; Ivanov, D.; Larason, W.; Nixon, M.; Moller, H. Accelerated Reported Battery Capacity Loss in 30 kWh Variants of the Nissan Leaf. Technical Report. 2018. Available online: https://www.preprints.org/manuscript/201803.0122/v1 (accessed on 20 November 2021).
- Montoya, A.; Guéret, C.; Mendoza, J.; Villegas, J.G. The electric vehicle routing problem with nonlinear charging function. Transp. Res. Part B Methodol. 2017, 103, 87–110. [Google Scholar] [CrossRef] [Green Version]
- Hoimoja, H.; Rufer, A.; Dziechciaruk, G.; Vezzini, A. An ultrafast EV charging station demonstrator. In Proceedings of the International Symposium on Power Electronics Power Electronics, Electrical Drives, Automation and Motion, Sorrento, Italy, 20–22 June 2012; Institute of Electrical and Electronics Engineers (IEEE): Piscataway, NY, USA, 2012; pp. 1390–1395. [Google Scholar]
- Daza, J.M.; Montoya, J.R.; Narducci, F. Resolución del problema de enrutamiento de vehículos con limitaciones de capacidad utilizando un procedimiento metaheurístico de dos fases. Rev. EIA 2009, 6, 23–38. [Google Scholar]
- Schneider, M.; Stenger, A.; Goeke, D. The Electric Vehicle-Routing Problem with Time Windows and Recharging Stations. Transp. Sci. 2014, 48, 500–520. [Google Scholar] [CrossRef] [Green Version]
- Lin, B.; Ghaddar, B.; Nathwani, J. Deep Reinforcement Learning for the Electric Vehicle Routing Problem with Time Windows. IEEE Trans. Intell. Transp. Syst. 2021, 1–11. [Google Scholar] [CrossRef]
- Gonçalves, F.; Cardoso, S.R.; Relvas, S.; Barbosa-Póvoa, A.P.F.D. Optimization of a distribution network using electric vehicles: A VRP problem. In Proceedings of the IO2011-15 Congresso da Associação Portuguesa de Investigação Operacional, Coimbra, Portugal, 18–20 April 2011; pp. 18–20. [Google Scholar]
- Lebeau, P.; De Cauwer, C.; Van Mierlo, J.; Macharis, C.; Verbeke, W.; Coosemans, T. Conventional, Hybrid, or Electric Vehicles: Which Technology for an Urban Distribution Centre? Sci. World J. 2015, 2015, 302867. [Google Scholar] [CrossRef] [PubMed] [Green Version]
- Van Duin, J.; Tavasszy, L.A.; Quak, H.J. Towards electric urban freight: First promising steps in the electric vehicle revolution. Eur. Transp. 2013, 54, 1–19. [Google Scholar]
- Hiermann, G.; Puchinger, J.; Ropke, S.; Hartl, R.F. The Electric Fleet Size and Mix Vehicle Routing Problem with Time Windows and Recharging Stations. Eur. J. Oper. Res. 2016, 252, 995–1018. [Google Scholar] [CrossRef] [Green Version]
- Conrad, R.G.; Figliozzi, M.A. The recharging vehicle routing problem. In Proceedings of the 2011 International Conference on Management Science and Industrial Engineering (MSIE 2011), Harbin, China, 8–11 January 2011. [Google Scholar]
- Erdoğan, S.; Miller-Hooks, E. A green vehicle routing problem. Transp. Res. Part E Logist. Transp. Rev. 2012, 4, 100–114. [Google Scholar] [CrossRef]
- Omidvar, A.; Tavakkoli-Moghaddam, R. Sustainable vehicle routing: Strategies for congestion management and refueling scheduling. In Proceedings of the 2012 IEEE International Energy Conference and Exhibition (ENERGYCON), Florence, Italy, 9–12 September 2012; Institute of Electrical and Electronics Engineers (IEEE): Piscataway, NY, USA, 2012; pp. 1089–1094. [Google Scholar]
- Desaulniers, G.; Errico, F.; Irnich, S.; Schneider, M. Exact Algorithms for Electric Vehicle-Routing Problems with Time Windows. Oper. Res. 2016, 64, 1388–1405. [Google Scholar] [CrossRef]
- Keskin, M.; Çatay, B. Partial recharge strategies for the electric vehicle routing problem with time windows. Transp. Res. Part C Emerg. Technol. 2016, 65, 111–127. [Google Scholar] [CrossRef]
- Felipe, Á.; Ortuño, M.T.; Righini, G.; Tirado, G. A heuristic approach for the green vehicle routing problem with multiple technologies and partial recharges. Transp. Res. Part E Logist. Transp. Rev. 2014, 71, 111–128. [Google Scholar] [CrossRef]
- Sassi, O.; Cherif, W.R.; Oulamara, A. Vehicle routing problem with mixed fleet of conventional and heterogenous electric vehicles and time dependent charging costs. Int. J. Math. Comput. Sci. 2014, 9. [Google Scholar] [CrossRef]
- Kobayashi, Y.; Kiyama, N.; Aoshima, H.; Kashiyama, M. A route search method for electric vehicles in consideration of range and locations of charging stations. In Proceedings of the 2011 IEEE Intelligent Vehicles Symposium (IV), Baden-Baden, Germany, 5–9 June 2011; Institute of Electrical and Electronics Engineers (IEEE): Piscataway, NY, USA, 2011; pp. 920–925. [Google Scholar]
- Sassi, O.; Cherif-Khettaf, W.R.; Oulamara, A. Iterated Tabu Search for the Mix Fleet Vehicle Routing Problem with Heterogenous Electric Vehicles. In Advances in Human Error, Reliability, Resilience, and Performance; Springer Science and Business Media LLC.: Berlin/Heidelberg, Germany, 2015; Volume 359, pp. 57–68. [Google Scholar]
- Preis, H.; Frank, S.; Nachtigall, K. Energy-Optimized Routing of Electric Vehicles in Urban Delivery Systems. In Proceedings of the Operations Research; Springer Science and Business Media LLC.: Berlin/Heidelberg, Germany, 2014; pp. 583–588. [Google Scholar]
- Basso, R.; Kulcsar, B.; Egardt, B.; Lindroth, P.; Sanchez-Diaz, I. Energy consumption estimation integrated into the Electric Vehicle Routing Problem. Transp. Res. Part D Transp. Environ. 2019, 69, 141–167. [Google Scholar] [CrossRef]
- Alesiani, F.; Maslekar, N. Optimization of Charging Stops for Fleet of Electric Vehicles: A Genetic Approach. IEEE Intell. Transp. Syst. Mag. 2014, 6, 10–21. [Google Scholar] [CrossRef]
- Goeke, D.; Schneider, M. Routing a mixed fleet of electric and conventional vehicles. Eur. J. Oper. Res. 2015, 245, 81–99. [Google Scholar] [CrossRef]
- Sweda, T.M.; Klabjan, D. Finding minimum-cost paths for electric vehicles. In Proceedings of the 2012 IEEE International Electric Vehicle Conference, Greenville, SC, USA, 4–8 March 2012; Institute of Electrical and Electronics Engineers (IEEE): Piscataway, NY, USA, 2012; pp. 1–4. [Google Scholar]
- Sweda, T.M.; Dolinskaya, I.S.; Klabjan, D. Optimal Recharging Policies for Electric Vehicles. Transp. Sci. 2017, 51, 457–479. [Google Scholar] [CrossRef]
- Arslan, O.; Yıldız, B.; Karaşan, O.E. Minimum cost path problem for Plug-in Hybrid Electric Vehicles. Transp. Res. Part E Logist. Transp. Rev. 2015, 80, 123–141. [Google Scholar] [CrossRef] [Green Version]
- Yang, J.; Sun, H. Battery swap station location-routing problem with capacitated electric vehicles. Comput. Oper. Res. 2015, 55, 217–232. [Google Scholar] [CrossRef]
- Verma, A. Electric vehicle routing problem with time windows, recharging stations and battery swapping stations. EURO J. Transp. Logist. 2018, 7, 415–451. [Google Scholar] [CrossRef]
- Hof, J.; Schneider, M.; Goeke, D. Solving the battery swap station location-routing problem with capacitated electric vehicles using an AVNS algorithm for vehicle-routing problems with intermediate stops. Transp. Res. Part B Methodol. 2017, 97, 102–112. [Google Scholar] [CrossRef]
- Raeesi, R.; Zografos, K.G. The electric vehicle routing problem with time windows and synchronised mobile battery swapping. Transp. Res. Part B Methodol. 2020, 140, 101–129. [Google Scholar] [CrossRef]
- Futalef, J.P.; Muñoz-Carpintero, D.; Rozas, H.; Orchard, M. Evolutionary Algorithm for the Electric Vehicle Routing Problem with Battery Degradation and Capacitated Charging Stations. In Proceedings of the Annual Conference of the PHM Society, Nashville, TN, USA, 9–13 November 2020; Volume 12, p. 9. [Google Scholar]
- Schiffer, M.; Klein, P.S.; Laporte, G.; Walther, G. Integrated planning for electric commercial vehicle fleets: A case study for retail mid-haul logistics networks. Eur. J. Oper. Res. 2021, 291, 944–960. [Google Scholar] [CrossRef]
- Zhang, L.; Wang, S.; Qu, X. Optimal electric bus fleet scheduling considering battery degradation and non-linear charging profile. Transp. Res. Part E Logist. Transp. Rev. 2021, 154, 102445. [Google Scholar] [CrossRef]
- Xu, M.; Wu, T.; Tan, Z. Electric vehicle fleet size for carsharing services considering on-demand charging strategy and battery degradation. Transp. Res. Part C Emerg. Technol. 2021, 127, 103146. [Google Scholar] [CrossRef]
- Zang, Y.; Wang, M.; Qi, M. A column generation tailored to electric vehicle routing problem with nonlinear battery depreciation. Comput. Oper. Res. 2021, 137, 105527. [Google Scholar] [CrossRef]
- Reyes-Rubiano, L.; Ferone, D.; Juan, A.A.; Faulin, J. A simheuristic for routing electric vehicles with limited driving ranges and stochastic travel times. SORT 2019, 1, 3–24. [Google Scholar]
- Martins, L.D.C.; Tordecilla, R.D.; Castaneda, J.; Juan, A.A.; Faulin, J. Electric Vehicle Routing, Arc Routing, and Team Orienteering Problems in Sustainable Transportation. Energies 2021, 14, 5131. [Google Scholar] [CrossRef]
- Barco, J.; Guerra, A.; Muñoz, L.; Quijano, N. Optimal Routing and Scheduling of Charge for Electric Vehicles: A Case Study. Math. Probl. Eng. 2017, 2017, 8509783. [Google Scholar] [CrossRef] [Green Version]
- Linfati, R.; Escobar, J.W.; Cuevas, B. An algorithm based on granular tabu search for the problem of balancing public bikes by using multiple vehicles. DYNA 2014, 81, 284. [Google Scholar] [CrossRef]
- Bernal, J.; Escobar, J.W.; Linfati, R. A granular tabu search algorithm for a real case study of a vehicle routing problem with a heterogeneous fleet and time windows. J. Ind. Eng. Manag. 2017, 10, 646. [Google Scholar] [CrossRef]
- Bernal-Moyano, J.A.; Velasquez, J.W.E.; Marín-Moreno, C.; Linfati, R.; Gatica, G. A comparison of trajectory granular based algorithms for the location-routing problem with heterogeneous fleet (LRPH). DYNA 2017, 84, 193–201. [Google Scholar] [CrossRef]
- Bernal, J.; Escobar, J.W.; Paz, J.C.; Linfati, R.; Gatica, G. A probabilistic granular tabu search for the distance constrained capacitated vehicle routing problem. Int. J. Ind. Syst. Eng. 2018, 29, 453–477. [Google Scholar]
- Bernal, J.; Escobar, J.W.; Linfati, R. A simulated annealing-based approach for a real case study of vehicle routing problem with a heterogeneous fleet and time windows. Int. J. Shipp. Transp. Logist. 2021, 13, 185–204. [Google Scholar] [CrossRef]
- Escobar, J.W.; Duque, J.L.R.; García-Cáceres, R. A granular tabu search for the refrigerated vehicle routing problem with homogeneous fleet. Int. J. Ind. Eng. Comput. 2022, 13, 135–150. [Google Scholar] [CrossRef]
Publisher’s Note: MDPI stays neutral with regard to jurisdictional claims in published maps and institutional affiliations. |
© 2022 by the authors. Licensee MDPI, Basel, Switzerland. This article is an open access article distributed under the terms and conditions of the Creative Commons Attribution (CC BY) license (https://creativecommons.org/licenses/by/4.0/).