Article

Investigating Performance Outcomes under Institutional Pressures and Environmental Orientation Motivated Green Supply Chain Management Practices

by
Wael Hassan El-Garaihy
1,*,
Usama A. Badawi
2,
Walid A. S. Seddik
3 and
M. Sh. Torky
4
1
Department of Management, Imam Abdulrahman Bin Faisal University, Dammam 32425, Saudi Arabia
2
Management Information Systems Department, Collage of Applied Studies and Community Service, Imam Abdulrahman Bin Faisal University, Dammam 32425, Saudi Arabia
3
Marketing Department, Collage of Applied Studies and Community Service, Imam Abdulrahman Bin Faisal University, Dammam 32425, Saudi Arabia
4
Department of General Courses, Collage of Applied Studies and Community Service, Imam Abdulrahman Bin Faisal University, Dammam 32425, Saudi Arabia
*
Author to whom correspondence should be addressed.
Sustainability 2022, 14(3), 1523; https://doi.org/10.3390/su14031523
Submission received: 23 September 2021 / Revised: 13 January 2022 / Accepted: 13 January 2022 / Published: 28 January 2022

Abstract

:
Purpose: The study investigates the role of institutional pressures and environmental orientation in implementing green supply chain practices (GSCPs) in firms. The aim is to construct a comprehensive model based on institutional theory (InT) and resource-based view (RBV) that will help study the effect of GSCPs on performance-based outcomes of industrial firms. Study Design: The study adopted a cross-sectional design, and data were collected from 351 supply chain management professionals from different manufacturing companies in Saudi Arabia. Furthermore, a questionnaire was structured to collect data, and the hypothesis of the study was tested using the PLS-SEM modeling. Findings: The study findings showed a significant effect of institutional pressure on GSCPs. Also, another significant impact of environmental orientation on GSCPs was noted. Lastly, GSCPs of manufacturing companies have a significantly positive effect on economic and ecological performances. Originality: This paper is one of the first to include institutional theory, the resource-based view, institutional pressures, environmental orientation, GSCPs, and company performances outcomes. Also, the paper provides details about performance outcomes by scattering Green Supply Chain Management (GSCM) practices and gives direction to managers for the successful implementation of these practices.

1. Introduction

Industrial leaders are under pressure to develop greater environmental responsibility due to the increase in global pressure from stakeholders in terms of climatic change and its implications [1]. Greening efforts by manufacturing firms to develop environmentally friendly products, systems, technologies, processes, and business practices have become popular due to growing societal awareness of the environment [2]. According to [3,4], green supply chain management, sustainable supply chain management, and environmentally sustainable supply chain management are interlinked and contribute towards goal achievement by minimizing the adverse effects of the firm’s operations on the environment. Similarly, [5] also state that the interlinkage of environmental management with the supply chain is critical in sustaining corporate development.
The supply chain aims to reduce emissions. At present, the trade-offs in the supply chain are quality, carbon, cost, and service [6]. For two reasons, the supply chain is critical to greening manufacturers. To begin with, the supply chain has a close interaction with the natural environment since it deals with the materials needed for manufacturing [7]. Second, the supply chain’s purchasing practices can affect the manufacturing suppliers’ environmental perceptions and capabilities. For successful green supply chain management, resource allocation and organizational structures are significant contributors to sustainable corporate social reputation and brand building. Ref. [8] stated that GSCM aims to decrease the negative environmental impact of services and goods. This is usually because of the increasing environmental issues and to meet the customers’ requirements for environment-friendly products and services [9].
GSCM further supports companies’ competitive and cooperative advantages by increasing their competitiveness and economic performance [10]. Some of the potential benefits of GSCM include increased incorporation of efficiency and effectiveness, enhanced reputation, functional differentiation, and revenue growth [10,11]. A practical philosophy that Green Supply Chain (GSC) initiatives demonstrated was support to companies and their partners in their struggle to gain profits and achieve market share goals. This was possible by reducing environmental risks and their effect on the development of environmental efficiency simultaneously [12].
Many studies have focused on external and internal factors of GSC [13,14], but the impact of internal and external pressures and the drivers on GSC has not been focused on. A study conducted by [15] stated that the GSC initiatives impact the firms’ environmental, financial, and operational performances. Many studies related to GSCM have recognized the internal and external factors of the GSC initiative, but the impact of these factors and the drivers of GSC initiatives have not been investigated simultaneously [13,14].
The engines of GSC initiatives have been explored through multiple perspectives. As far as its external drivers are concerned, the institutional theory and the relationship between institutional pressures and the GSC initiatives have been observed. To ensure that GSCM practices are being successfully implemented, several issues can be considered regarding the internal drivers. First of all, the senior management should be having a clear vision of the environmental policy [16,17]. Secondly, senior managers would be required to perform GSC initiatives [3,8,18]. Also, support from the middle managers is mandatory for stimulating GSC initiatives [14]. According to [19], the environmental orientation can be considered a resource if the firm wants to manage strategic practices, which depends on the resource-based view to enhance the company’s performance. The internal and external factors are considered critical determinants of corporate practices at the strategic level in terms of environmental strategies.
The companies can establish green management capabilities by taking an environmental approach supported by the resource-based view (RBV). According to [19,20], firms can establish a culture of environmental orientation and motivate suppliers to participate in green practices using more active and effective methods for better results. Concerning the environmental problems, Ref. [21] suggested that these problems are not related to the company’s internal processes but rather to supply chain partners in the early and subsequent stages of the manufacturer. Proactive environmental programs and initiatives require cooperation in the supply chain, followed by environmental awareness among supply chain partners to protect the environment [22].
Supply chain collaboration enables all participants to benefit from the close relationship between them, and those relationships are difficult to replicate or imitate. Many firms have understood the importance of maintaining close relationships with suppliers and customers to bring improvisation to green supply chain management. Still, it is not clear how these relationships should be managed to strengthen green management. Earlier studies have found a negative, positive, or no association between GSCP and performance [23,24]. On the other hand, the variables showed inconsistency in both measuring practices and performance. Most of the studies only focused on the relationship between GSCP and performance outcomes rather than practices. Some performance-based variables such as; environmental performance; Social performance, financial performance (economic benefits), economic costs, competitive performance, operational performance, market performance, and intangible performance were implemented in GSCP and performance studies [25,26]. Refs. [8,27,28,29] found that the findings of earlier studies focusing on the impact of green practices on performance outcomes were all mixed. According to [29] these studies show that the firms see GSCM practices as a burden on their limited resources. Therefore, the GSCM activities are crucial to improvising organizational performance [2]. Ref. [11] says that the flexibility and redundancy of resources in the company’s operational settings help to create customer value based on adaptability and which leads to increased flexibility. Still, as per [30], GSCM practices can be more effective to make waste-free processing.
The implementation of GSCM is seen as a problem in developing countries, probably due to weak or no understanding between administrators and managers. However, it is an essential tool of management [31]. According to [11,29,31,32] as per the perception of industrialists and investors, there is little or no impact on customer engagement. These studies also suggest that the effects of GSCM are unclear on performance outcomes.
The study investigates the role of institutional pressures and environmental orientation while adopting green supply chain management practices. Moreover, the study also explores the impact of implementing green supply chain practices on performance. Hence, the study contributes in various ways, such as; imparting knowledge of GSCM through assessing the impact of institutional pressure and environmental orientation, giving an in-depth view about performance outcomes by practicing GSCM drivers. Moreover, it can help the managers to develop a successful implementation of GSCM in their firms. This study also integrates institutional theory with a resource-based view to explore how the institutional pressure and the environmental orientation can drive firms to practice GSC initiatives [11]. The main reason for using institutional theory is that it offers theoretical contributions concerning distinctions between formal and informal institutions, regulative, normative, and cultural-cognitive types of institutions, and multiple levels of institutions. Similarly, RBV gives guidance for the firm’s strategy. The RBV views managerial talents, information capabilities, and administrative procedures as scarce resources to generate economic rents.

1.1. Study Contribution

This study contributes in the following ways:
  • It provides empirical evidence regarding the role of institutional pressures and environmental orientation that can help firms to implement GSCPs.
  • It contributes theoretically by constructing a comprehensive model based on institutional theory and resource-based view to study the effect of GSCPs on performance-based outcomes of industrial firms.
  • It also addresses the strategic means of obtaining excellent firm performance while maintaining sustainability.

1.2. Research Questions

Q1. What makes the firms adopt GSCMPs?
Q2: Does environmental orientation contribute to companies adopting green practices for supply chains?
Q3: Do the institutional pressures contribute to companies adopting green practices for supply chains?
Q4. What is the effect of GSCM practices over different dimensions of firm performance outcomes?

2. Theoretical Review

The model of the current study is based on two theories, namely, institutional theory and resource-based review. The first theory deals with the organizational pressures to adapt to environmentally friendly practices [33]. This theory states three factors that affect environmental formation: coercive pressure, normative pressure, and mimetic pressure [34]. The normative pressure is the external pressure exhibited by the customers, suppliers, and other similar forces [35]. The institutional theory explains that stressors that bring changes affect the companies. Taking this concept into account to realize how the firm can develop implementation strategies to achieve success, consider green supply chain management, it is mandatory to create a performance-based strategy keeping in view the customers’ requirements and the government’s regulations [2]. The coercive pressure can be intrinsic or extrinsic, imposing mimetic pressure with laws, regulations, and practices. Those companies face severe disciplinary measures as they fail to follow these rules and regulations [27,36]. The normative pressure begins when the company cannot make predictions of the situation, and the management shows uncertainty. The firms measure their progress while comparing it with their competitors, keeping the external environmental pressures in view, which results in the success of the companies [27]. This normative pressure keeps the companies under pressure to define or shape their operations to develop competitiveness and continue to grow in the industry. The companies exert internal pressure to adapt to the rules and regulations that contribute to managing their business, which best suits creating environmental management standards.
On the other hand, the resource-based review indicates that a company holding a set of unique resources (such as human capital, assets, information, knowledge, capabilities, and organizational processes) can improve its performance results in creating competitive market-based advantage [37]. In short, the RBV theory suggests that the company’s competitiveness relies on its scarcity, uniqueness, and valuable resources, which becomes a daunting task for its competitors to replace or bring an alternative for it. The GSCM practices are those unique organizational abilities where RBV theory can make its contribution to explain how the adoption of GSCM practices may make contributions to improvise the corporate performance [38]. The RBV may face a problem of competition, build companies, and defend their resources, while the GSCM may seek to cooperate and use strategic resource sharing [38].
Environmental activities must be a part of company plans, which is difficult for many industries [39]. The competitive advantage of any company is an integral part of its unique assets [37]. Therefore, companies need correct and effective management of their capabilities to raise their level of performance and outperform their competitors. Given the tangible assets, companies can outperform the environmental performance of their competitors by relying on their physical assets to enhance their internal processes by using their resources and reducing wastage [40]. The company’s external environment and its internal origin relationship remained unclear until [41] conducted a study supported by [42]. Both confirmed that the company’s resource assessment could not be done separately. The companies should be able to identify the significance of resources so that the interaction within the market conditions is possible and enable the company to take advantage of the market opportunities and avoid threats and competitors. The resources can be tangible or intangible and produce value-added products for the company to the targeted markets. Moreover, they also identified seven types of resources: physical, human, legal, financial, informational, relational, and organizational [40]. The theories above provide a significant base for the current study, which is related to the implementation of GSCM practices to different performance dimensions [40].

2.1. The Effect of Institutional Pressures on the Practices of GSCM

According to [34], the institutional theory states that a company can consider other companies’ actions while determining its organizational practices. The company emphasizes the political and institutional validity of socio-economic rewards and the competition for resources and customers. Taking industrialization into context, a company that consults validity would seek to comply with rules and regulations. There is an increase in the concerns related to environmental protection because of the growing market expectations about social responsibility for environment-based companies [43].
There are two ways for these pressures to operate, to reduce and broaden acceptance of GSCM institutional practices. For example, forced pressure constrains regulatory options over GSCM methods from which product recovery is due to limitations in the structure of networking and capabilities. According to [44], a company’s ability can be compromised to achieve the best performance improvement by compromising the organization’s capacity if undertaking a simulated approach to implement GSCM practices. One of the studies confirmed that companies are likely to be eager to implement GSCM due to environmental requirements, customer support, and government pressure [45]. The study stated that the response is heterogeneous to various institutional pressures, whereas some found that organizational pressure might cause adopting green practices. There are many previous studies in support of our view that institutional pressure positively affects companies in adopting GSCMPs, coercive pressures [15,17,39], normative pressures [46,47], and mimetic pressures, [48,49].
The above studies show that institutional pressures such as coercive, normative, and mimetic positively affect GSCPs. Considering coercive pressures, external stakeholders mainly exert these pressures, such as governmental authorities and non-governmental organizations. They force the companies to execute a variety of environmental regulations and standards as they are essential and compulsory to adopt. They help in shaping the legislative and environmental protection of the organizations. The study develops a hypothesis to see how the manufacturing companies in Saudi Arabia face coercive pressures in adopting GSCPs.
Hypothesis 1 (H1a).
The Saudi Manufacturing companies face coercive pressures positively to adopt GSCM practices.
Next, considering normative pressures, these pressures are mainly exerted by suppliers, consumers, trade unions, media, and other social bodies. They are the driving factors that influence the norms and sense of responsibility as these pressures affect companies’ social complaint behavior and actions. Normative pressures ensure that consumers and suppliers operate in an external environment and companies operate in a social complaint way to encourage GSCPs. The study develops a hypothesis to see how Saudi manufacturing companies take up normative pressures while adopting GSCPs.
Hypothesis 1 (H1b).
The Saudi manufacturing companies face normative pressures positively to adopt GSCM practices.
Considering the last pressure mimetic pressure, it is shown that this pressure comes into play when companies compete to seek superior performance. This is done because the companies need to reply to their competitors’ behavior and actions. This pressure encourages environmental management in companies. Intense mimetic pressure can enable companies to adopt up-to-date environmental management and technologies to generate superior performance. The study develops a hypothesis to see how Saudi manufacturing companies deal with mimetic pressures to adopt GSCPs.
Hypothesis 1 (H1c).
The Saudi manufacturing companies face mimetic pressures positively to adopt GSCM practices.

2.2. Effect of Environmental Orientation on GSCM Practices

As per the resource-based view theory, it is perceived that the company’s strategic direction (environmental orientation) as the valuable intangible resource plays the role of a mentor of strategic practices, enhancing performance [50]. One of the experimental studies conducted in China showed that export projects with higher levels of marketing orientation are more suitable for carrying out strategic activities in various fields such as pricing, marketing communications, and new product development [51]. Similarly, another study showed that the external and internal environmental trends play a role in decision-making to develop environmental strategies within the functional field of marketing [19].
An internal environmental orientation influences the GSCM due to organizational learning and knowledge sharing among company members. The effect of external environmental orientation is best explained based on institutional theory. Based on this perspective, companies need to address the various constraints imposed by some important institutions. The more companies adhere to these institutions’ restrictions, the greater the chances of their stability and validity, and greater will be the circumstances of their survival [34]. One of the previous studies focusing on textile firms narrated that textile firm management fully comprehends GSCM practice implementation techniques in operations and reconfigures accordingly in a competitive business environment while boosting firm performance [52].
The above studies show that internal and external environmental trends grow from internal and external sources, which indicates an impact for each of them on GSCM. Still, this effect may be derived from different paths, even though there is a positive impression for internal environmental trends and external to the GSCM. Therefore, the study develops the following hypotheses to investigate how Saudi manufacturing companies are affected by the internal and external environmental orientations while adopting GSCM practices.
Hypothesis 2 (H2a).
The GSCM practices are affected positively by internal environmental orientation.
Hypothesis 2 (H2b).
The GSCM practices are affected positively by external environmental orientation.

2.3. Association between Green Practices and Performance Outcomes of Companies

A series of measures have been adopted by developed countries for revitalizing the manufacturing industry [53]. It is necessary to measure performance to manage the activities and operations to improve SC management [5]. It is also a prerequisite to enhance. It allows the current system to work efficiently compared to alternative systems [54]. While [55] believes that if there are no appropriate metrics for measuring supply chain performance, this will affect customer satisfaction, leading to lost opportunities to improve SC performance. The indicators or performance measures should be defined and then evaluated to monitor the efforts of organizations in their various activities, which are designed to achieve sustainable development [4].
Many researchers have provided different combinations to study and assess the relationship between green practices and corporate performance. The studies published in the literature showed positive and negative relationships between environmental activities of organizations and the economic, operational, and environmental performance of companies [9,56,57,58]. Therefore, this study develops the following hypotheses to see how Saudi manufacturing companies are affected by GSCM practices.
Hypothesis 3 (H3a).
GSCM practices have a positive influence on Environmental Performance.
Hypothesis 3 (H3b).
GSCM practices have a positive influence on Operational Performance.
Hypothesis 3 (H3c).
GSCM practices have a positive influence on Economic Performance.

2.4. Research Framework

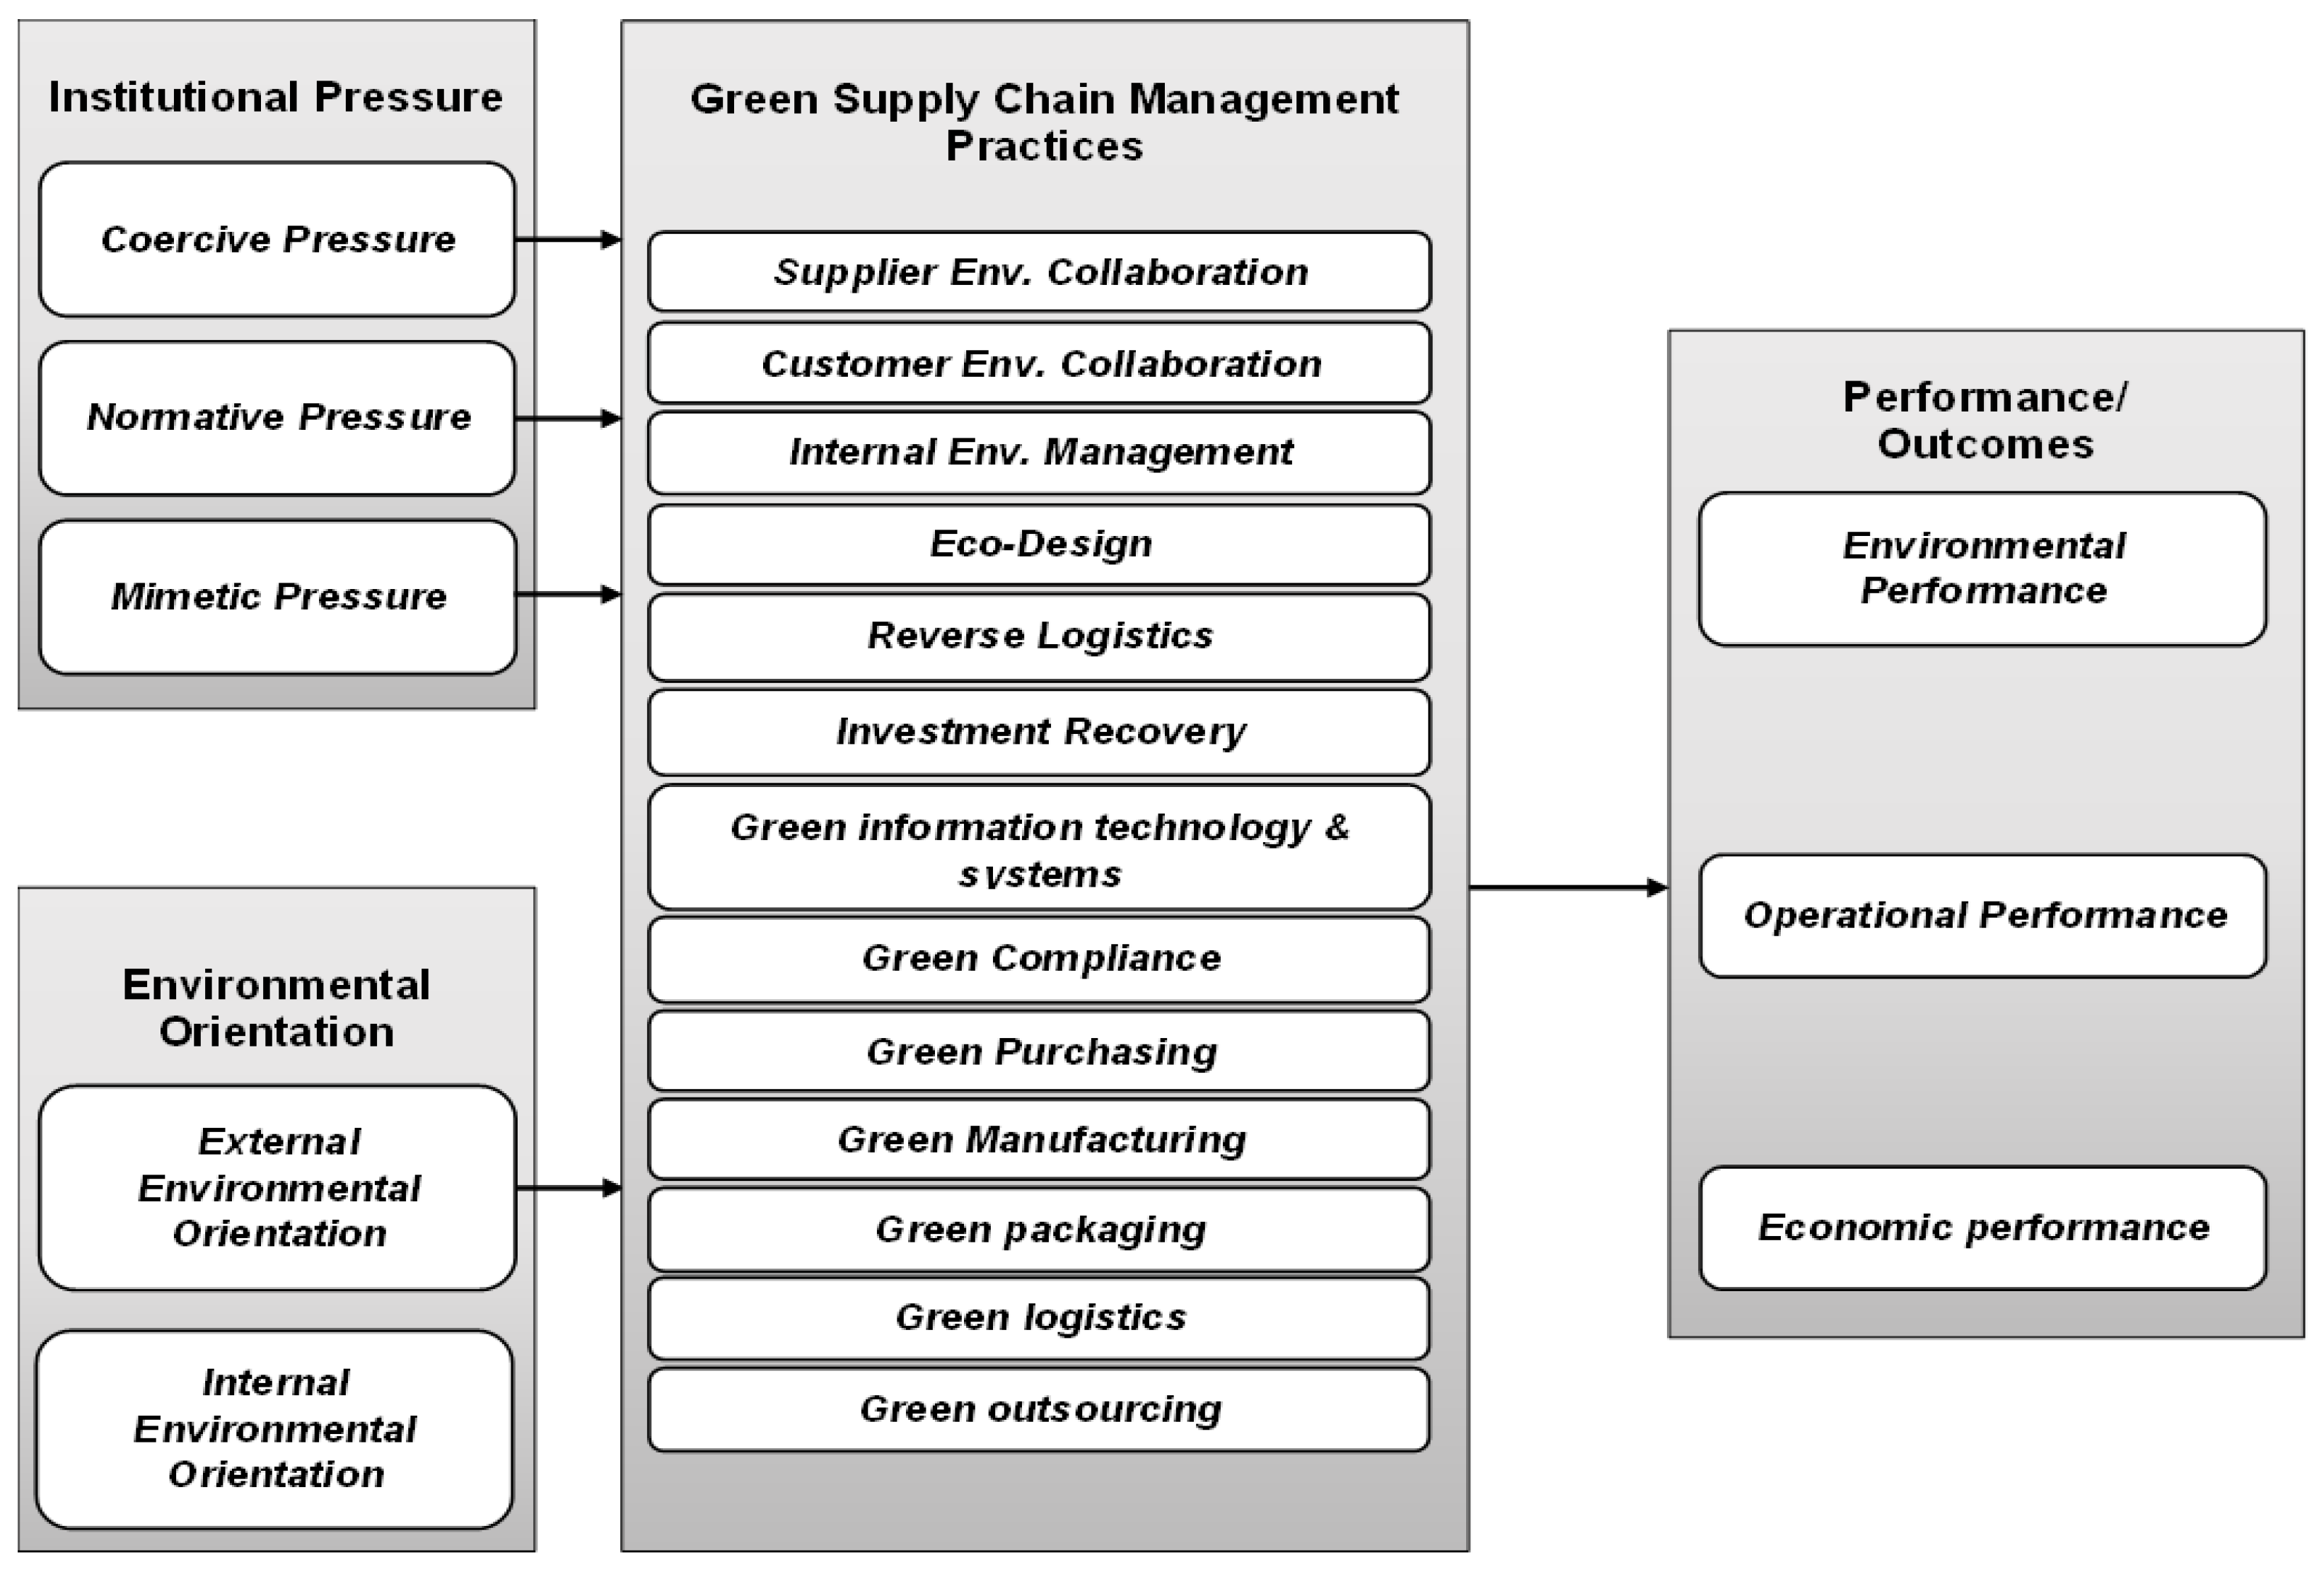
The institutional theory (InT) and RBV, described earlier, helped develop a research framework that comprises four constructs. The first is the institutional pressure which focuses on internal environmental orientation (IEO) and external environmental orientation (EEO). Then the second one mentions the environmental orientation which includes, coercive institutional pressure (IPC), normative institutional pressure (IPN), and institutional mimetic pressure (IPM). Then come the third, which refers to green supply chain practices that are based on supplier environmental collaboration (SEC), customer environmental collaboration (CEC), internal environmental management (IEM), eco-design (ECD)/green design, reverse logistics (RLG), investment recovery (INR), green information technology and systems (GITS), green compliance (GCM), green purchasing (GPR), green manufacturing (GMF), green packaging (GPK), green logistics (GLG), green outsourcing (GOS), and green warehousing (GWH). Lastly, the fourth construct focuses on the firm’s performance outcomes, that is, environmental performance (En. Perf), operational performance (O. Perf), and economic performance (Ec. Perf). Figure 1 illustrates the framework of the study and the relationship between the constructs of the model.

3. Methods

3.1. Study Design, Sample and Biasness

A cross-sectional design was considered and was conducted in Saudi Arabia. The population of the study included supply chain managers and professionals from Saudi manufacturing companies. A total of 11 manufacturing companies were randomly taken into consideration among the different companies functioning in Saudi Arabia. Moreover, the respondents were categorized as top-management, which included CEOs, President and Vice-President, middle-management which included, Director, Senior Manager and Manager, Supervisory level, which included Senior Officer, Officers and Coordinators, and lastly non-managerial staff which included Accountant, Assistant Specialist, etc. In the first quarter of 2020, about 600 questionnaires were disseminated. Then a re-follow-up was done during the following three months. After examining the data, the finalized sample was 351 respondents, and the response rate was 58.5%. Based on that, it can be said that the study’s sample size was achieved more than the minimum sample size, which was based on the 10 times base method, which was confirmed by [59]. The demographic outlines of the respondents and their firms are summarized in Table 1 of the study.
According to the table, the type of work covered by the study sample includes 11 different fields of business. The field of pharmaceuticals represents the highest representation in the sample of 15.7%, followed by the electronics and communication equipment industry by 15%, then the chemical and plastic industries by 12%. In comparison, the lowest proportion of business representation in the sample was then assembled metal products, 4.6%. Besides that, 81.5% of the overall respondents are middle management positions, while 9.7% occupy senior positions, whereas the others were either the supervisors or the non-managerial staff (8.8%).
Based on what was stated in [60], the instructions were procedural to counter the bias in the standard method. They were followed in the referenced research, especially in the questionnaire design and administering stages of dealing with respondents. Due to non-response bias, the responders who were late were considered unresponsive following their behavior [49]. The sample was divided into two groups to list the first and late responders. t-tests compared the averages of the groups, and the results found were insignificant at a 0.05 level. The results indicate the absence of bias when not responding to the questionnaire.

3.2. Data Collection Tool

A questionnaire was used for data collection, and it was divided into two parts: the first part consisted of questions related to the participants’ demographic details. In contrast, the other part consisted of measurement elements adapted from previous research work. These elements were obtained from extensive reviews of studies published in green supply chains and their impacts on firm performance (Appendix A shows the details of the measurement elements and sources obtained from previous studies).
The questionnaire contains three constructions of higher rank, the first is the environmental orientation, the second is institutional pressure, and finally the third is GSCM practices with 14 items, that is, (supplier environmental collaboration, customer environmental, collaboration, internal environmental management, eco-design, reverse logistics, investment recovery, green information technology and systems, green compliance, purchasing, manufacturing, packaging, logistics, outsourcing, and warehousing). As for the last construct, it was firm performance outcomes that were based on three components: environmental performance, operational performance, and economic performance.
All scales items were measured on a Five-Point Likert scale, ranging from 5: Strongly agree to 1: Strongly disagree. Before collecting the data, the validity of the questionnaire was verified by industry experts and academics. Initially, the questionnaire was presented to academics specializing in supply chain management and workers at Imam Abdul Rahman bin Faisal University, Dammam, Saudi Arabia. The questionnaire was given after being revised by 15 industry experts working in industrial companies in the Eastern Province of Saudi Arabia. Their suggestions were incorporated to ensure the validity of the phase and the content. Most of the comments were related to the length of the questionnaire and the diversity of factors. Table A1 in the Appendix A shows the number of elements of each factor before and after the statistical analyses and the factor analysis. Table S1 (Supplementary Materials) shows all the measurement elements and their sources before the statistical analysis process. In contrast, Table S2 (Supplementary Materials) shows the final aspects of the model obtained after completing all the statistical procedures. Table A2 in Appendix A provides factor loadings and significance and Table A3 in Appendix A provides details regarding content validity measures

3.3. Data Analysis

The data obtained through the questionnaire were examined using the SPSS software to help detect the missing data and detect multivariate and univariate outliers. After reviewing the data in the previous step, we applied the least square partial structural equation modeling (PLS-SEM) method using Smart PLS 3.2.4 software (SmartPLS GmbH, Oststeinbek, Germany).

4. Results

4.1. The Convergent Validity

According to [61], convergent validity can be viewed as the convergence of a group that supports achieving the validity level towards the conceptual measurement. Three dimensions commonly contribute to accomplishing the level of convergent validity. For the first dimension, factor loading must be greater than 0.7 and must be statistically significant. According to [62], the second dimension based on what was stated in the average value of the extracted variance (AVE) should be more than 0.5. While, according to the third dimension, the composite reliability must be more than 0.7 to support convergent reliability [61]. In general, the study model fulfills all convergent validity criteria (Table 2).

4.2. The Discriminant Validity

The validity of discrimination is created when the element of the variable is distinguished from the elements of other variables. In general, there are three different scales for assessing the discriminant validity. According to [63], the first measure is that loading all elements inside and outside the construct must be more significant than 0.1. Based on [62], the second scale, called the correlation matrix, is represented by the square root of the AVE shows the absolute value of the structure correlation, as evident in Table 3. According to the test, the diameter value of each construct (which represents the square roots of the AVE) must be higher than its row and column (which represent the connections between the combinations). Finally, the third measure, which is done by performing the test of the heterotrait–monotrait ratio (HTMT), and here, depending on what was indicated by [61], it is necessary for all construct values to be less than 0.9, which the Table 4 shows evidently.

4.3. Predictive Relevance of Model

The study used (f2, R2, and Q2) to study the variable’s predictive power. A robust R2 should be near 0.26, while values between 0.02 and 0.13 represent a weak value of R2 [64]. The predictive power can be determined if the Q2 value is higher than the difference between R2 and Q2 or larger than 0, as per the results of Table 5, which shows the calculating strength of the predictive relevance for all constructs per the stated grounds, which indicates that all the results obtained, whether concerning R2 or Q2, are ideal results.
In addition to the above, the effect of organizational relationships can be checked with the help of p-values, which can contribute here to displaying significance. When measuring the size of the effect, the reference thresholds that can be taken when calculating the size of the effect are as follows: 0.02 is rated as weak. While 0.15 is considered moderate and 0.35 is seen as having a substantial impact [61].
Depending on what has been mentioned, Table 6 shows the values of different effect sizes (f2) for the study constructs. According to the results, there is a noteworthy effect of institutional pressure (coercive) on GSCM at the level of significance 0.01 (β = 0.43, t = 5.731, p < 0.01). Similarly, a significant effect of normative) and mimetic on GSCM is observed, with the overall values of 0.01 (β = 0.52, t = 7.352, p < 0.01) and 0.01 (β = 0.41, t = 5.986, p < 0.01) respectively. Also, there is a significant effect of internal environmental orientation on the GSCM at the significance level 0.01 (β = 0.48, t = 6.771, p < 0.01), while the external environmental orientation has a significant effect on the GSCM at the significance level 0.01 (β = 0.51, t = 7.383, p < 0.01).
In addition to the above and concerning GSCM, the results confirm that they have a significant positive impact on all of the environmental performance, operational performance, and economic performance, which can be explained as follow: GSCM affects environmental performance at the level of significance 0.01 (β = 0.54, t = 10,551, p < 0.01). Likewise, the data demonstrated that it positively affects the operational performance at the level of significance 0.01 (β = 0.48, t = 9.242, p < 0.01). Finally, GSCM affects economic performance at the level of significance 0.01 (=0.53, t = 10.875, p < 0.01).
Based on the results that are presented in Table 5, it can be said that all proposed hypotheses (H1a, b, c; H2a, b; and H3a, b, c) are fully supported as the p-values are all less than 0.05. In short, all institutional pressures like coercive, normative, and mimetic have a significant relationship with green supply chain management (p = 0.000). Also, internal and external environmental orientation have a significantly positive relationship with green supply chain management (p = 0.000). Lastly, variables green supply chain management has a significantly positive relationship with environmental performance, operational performance, and economic performance (p = 0.000).

5. Discussion

Most manufacturers in the Gulf countries, especially Saudi Arabia, try to escape from the sanctions imposed by the administrative authorities and commercial establishments due to ecological infringement to evade economic losses. As [9] stated, this leads these establishments and decision-makers to be ready to adopt practices of GSCM that can contribute to saving these organizations from such unwanted losses. The findings of this study showed that environmental focus and institutional pressures are both critical in persuading firms to adopt green supply chain practices, with institutional pressure having a more significant influence. The study’s findings also indicated that among the many forms of institutional pressures, the standard pressure applied by supply chain partners and consumers has the most influence, followed by simulated pressure and finally forced ranking pressure.
According to [29], environmental concerns have increased globally, which calls for policymakers and environmental experts to employ institutional influence on industries to meet the requirements of environmentally friendly actions. Furthermore, it is imperative to rely on the internal drive and strategic focus on protecting the environment through a top-down approach to implement GSCM practices effectively. Strategists and managers need to work on strategic environmental orientation using transparent communication with the stakeholders related to the targets and opportunities to obtain better operations of GSCM to get the most significant benefits from them [65]. Overall, this study demonstrated that these practices could improve the firm’s performance, which acts as a catalyst for stakeholders and decision-makers to embrace these practices.
This study opens multiple areas for potential research due to the energetic and innovative nature of GSCM. For example, an investigation that collected cross-sectional data can be relied upon in future research to regulate the landscape of changes that respond to the regulatory environment. On the other hand, longitudinal investigation can provide futuristic insight into the implications for the performance of GSCM that was not studied due to the shortage of time. Future longitudinal research may additionally reveal how managers’ perspectives toward these practices are influenced by organizational change, state of the economy, business culture, competitive position, and stakeholder demand.
Finally, suppose multinational companies are dealing with different regulations and network structures. In that case, researchers need to study the various geographic problems associated with green supply chain practices in these companies to gain a comprehensive viewpoint on the relation concerning conservational creativities and supply chain performance. In addition to the preceding, a prospective comparative study of green supply chain practices for companies from different regions of the globe can deliver significant suggestions where green supply chain practices vary because of each area’s philosophy, economic position, and methods.

6. Implications

6.1. Theoretical and Practical Implications

In light of the above discussion, the study offers pragmatic implications for policymakers and organizations. These insinuations and practical implications have vital effects for manufacturers who can achieve improved economic performance based on those practices by employing green supply chain procedures. Policymakers in different organizations need to comprehend the physical associations between external and internal aspects of implementing these practices. On the other hand, policymakers must coordinate the firm’s activities to improve operational, environmental, and economic performance. The results of this study have practical effects on public strategy-makers and regulators as they need to encourage firm managers and manufacturers to employ green supply chain practices in their legislative activities. The results of this study established the impact of normative and mimetic powers of institutional pressure. They considered them as prominent standards that affect the excellent application of GSCM practices in operations. In addition to the above, it is also necessary that government agencies seek to encourage the importance of green environment and work to create consciousness of the benefits of that environment among managers and manufacturers as they are the ones who have the authority to power organizations to make environmentally-friendly changes in their processes.

6.2. Managerial Implications

The result of the study supplied assistance to managers on the basic requirements for expanding and fulfilling successful and superior value green supply chain practices in their organizations. The managers need to consider the role of organizational orientation strategically, environmental orientation will help the firms monitor the strategic way of GSCM practices more accurately than just reacting to external pressures. Managers seeking improved efficiency and effectiveness may employ findings in business strategies to create an eco-friendly, profitable, and profit-seeking corporation by harnessing competitive advantages. Manufacturing practitioners can gain a comprehensive understanding of the interplay of strategic orientation and contextual factors for implementing GSCM practices that reduce environmental impact and improve firm economic performance while taking into account both internal and external pressures. The findings of the study will assist practitioners in capturing the implementation methods of GSCM practices and consistency gaps, as well as intrinsic change structure, production and product system, and culture in order to achieve more exceptional sustainable firm performance. Moreover, the considerable influence of GSCM on all performance results of the organizations would help managers accomplish even better performance. In general terms, it can be said that managers can improve both the productivity and efficiency of their firms in search of sustainable economic advantages by embracing and supporting environmentally friendly practices.

7. Conclusions

The study was directed to observe the role of environmental orientation as a self-motivation to become environmentally responsible. Second, the institutional pressures (coercive, normative, and mimetic) affect government institutions, competitors, and customers and push them to enhance the successful implementation of GSCM. The paper further inspected the effect of GSCM practices on performance indicators of different organizations (environmental, operational, and economic). Based on what the study tried to clarify and the results it reached, it can be viewed as an important study in the framework of the environmental conditions of Saudi Arabia. This study exposes that environmental orientation and institutional pressures are vital for influencing organizations to adopt green supply chain practices, but with an emphasis that the size of the impact is more significant with the presence of institutional pressure. The study results also revealed that amongst the different types of institutional pressures, the most considerable effect is the standard pressure exerted by supply chain partners and customers followed by simulated pressure and then forced ranking pressure. It was emphasized that organizations that implement GSCM practices often focus on structured supply chain partnerships with multiple stakeholders to gain maximum benefits. Concerning the performance of the supply chain of these organizations, the results of this study confirmed that they have positive effects on the bottom line. The result of this study also indicated that the practices of GSCM powerfully affect ecological performance as corporate social responsibility is very useful to attract customer attention, as it affects both operational and economic performance significantly.

7.1. Limitations

Some of the limitations of this study are that there was no in-depth data gathering from supply chain focal businesses, including numerous upstream and downstream stakeholders that may yield distinct research conclusions. The study observes the direct and indirect consequences.

7.2. Future Research

Future studies may concentrate on the mediator in the strategic direction and GSCM interaction and the mediator in GSCM practice and long-term company performance on large scale, encompassing many manufacturing companies’ stakeholders.

Supplementary Materials

The following supporting information can be downloaded at: https://www.mdpi.com/article/10.3390/su14031523/s1. Table S1: Summary Table for Aspects and Practices. Table S2: Final Table for Aspects and Practices.

Author Contributions

Conceptualization, W.H.E.-G. and U.A.B.; methodology, W.H.E.-G. and U.A.B.; software, W.H.E.-G. and M.S.T.; validation, W.H.E.-G.; and U.A.B.; formal analysis, W.H.E.-G., W.A.S.S. and M.S.T.; investigation, W.H.E.-G., U.A.B., M.S.T. and W.A.S.S.; writing—original draft preparation, W.H.E.-G., M.S.T., U.A.B. and W.A.S.S.; writing—review and editing, W.H.E.-G., U.A.B., W.A.S.S. and M.S.T. All authors have read and agreed to the published version of the manuscript.

Funding

This research is funded by the Deanship of Scientific Research at Imam Abdulrahman Bin Faisal University, Saudi Arabia, grant number 2019-395-ASCS.

Institutional Review Board Statement

Not applicable.

Informed Consent Statement

Not applicable.

Data Availability Statement

Not applicable.

Acknowledgments

The authors are highly thankful to all the associated personnel who in any reference contributed to the completion of this study.

Conflicts of Interest

The authors declare no conflict of interest.

Appendix A

Table A1. Details of measures.
Constructs and Their Sub-ElementsInitial ElementsFinal Elements
Institutional Pressure
Coercive Pressure (IPC)44
Normative Pressure (IPN)44
Mimetic Pressure (IPM)33
Sub-Total1111
Environmental Orientation
External Environmental Orientation (EEO)55
Internal Environmental Orientation (IEO)55
Sub-Total 1010
Green Supply Chain Management Practices
Supplier Environmental Collaboration (SEC)55
Customer Environmental Collaboration (CEC)75
Internal Environmental Management (IEM)167
Eco-design (ECD)65
Reverse Logistics (RLG)84
Investment Recovery (INR)33
Green Information Technology and Systems (GITS)54
Green Compliance (GCM)44
Green Purchasing (GPR)105
Green Manufacturing (GMF)105
Green packaging (GPK)2Excluded
Green Logistics (GLG)43
Green outsourcing (GOS)2Excluded
Green warehousing (GWH)3Excluded
Sub-Total9050
Firm Performance Outcomes
Environmental Performance (En. Perf)125
Operational Performance (O. Perf)116
Economic Performance (Ec. Perf)136
Sub-Total3617
TOTAL16388
Source: Authors’ preparation.
Table A2. Factor loadings and significance.
ConstructsItemsLoadingsSEt-Statisticsp-Values
IEOIEO10.7010.1433.7430.000
IEO20.8380.05119.9810.000
IEO30.7740.04917.0030.000
IEO40.8130.03427.7710.000
IEO50.7070.04816.1360.000
EEOEEO10.6980.0677.9270.000
EEO20.7220.0878.4710.000
EEO30.9040.02636.7380.000
EEO40.7030.0978.2180.000
EEO50.8020.0917.5180.000
IPCIPC10.7790.1047.4090.000
IPC20.7560.1117.4120.000
IPC30.7810.0998.1430.000
IPC40.7830.05416.1210.000
IPNIPN10.7270.07113.0030.000
IPN20.7620.03918.6280.000
IPN30.8890.03436.4610.000
IPN40.8020.03920.0040.000
IPMIPM10.7020.06710.1240.000
IPM20.8350.02927.0020.000
IPM30.9120.01657.0030.000
SECSEC10.7030.1053.7440.000
SEC20.8410.04919.9820.000
SEC30.7770.04617.0120.000
SEC40.8160.03127.7720.000
SEC50.7100.04616.1370.000
CECCEC20.7020.0648.9280.000
CEC30.7250.0819.4720.000
CEC40.9070.02738.7390.000
CEC60.7060.0929.2190.000
CEC70.8050.0898.5190.000
IEMIEM10.7820.0998.4110.000
IEM70.7590.1088.4130.000
IEM80.7840.0968.1450.000
IEM90.7870.05017.1240.000
IEM110.7310.06914.0040.000
IEM130.7650.03719.6290.000
IEM160.8920.03237.4620.000
ECDECD10.8120.03621.0100.000
ECD20.7050.06311.1250.000
ECD30.8380.02728.0010.000
ECD50.9150.01449.0040.000
ECD60.7140.1014.7130.000
RLGRLG10.8410.04718.9750.000
RLG30.7810.04318.0120.000
RLG40.8210.02828.7720.000
RLG80.7150.03917.1370.000
INRINR10.7110.05810.9280.000
INR20.7310.07911.4720.000
INR30.9140.02440.7390.000
GITSGITS10.7170.08911.2190.000
GITS20.8200.0829.5190.000
GITS40.7910.0939.4110.000
GITS50.7650.09810.4130.000
GCMGCM20.7910.0899.1450.000
GCM30.7940.04319.1240.000
GCM50.7420.05917.0040.000
GCM60.7720.03121.6290.000
GPRGPR10.8920.02742.4620.000
GPR20.8230.03226.0100.000
GPR30.7160.05719.1250.000
GPR60.8470.02434.0010.000
GPR80.9230.01252.0040.000
GMFGMF20.7250.0994.7150.000
GMF30.8520.04618.9770.000
GMF50.7920.04218.0140.000
GMF60.8320.02728.7740.000
GMF90.7260.03817.1390.000
GLGGLG20.7220.05710.9310.000
GLG30.7420.07811.4740.000
GLG40.9250.02340.7410.000
En. PerfE. Perf10.7280.08811.2210.000
E. Perf20.8310.0819.5210.000
E. Perf30.8010.0929.4220.000
E. Perf40.7760.09710.4240.000
E. Perf50.8020.0889.1560.000
O. PerfO. Perf30.8050.04219.1350.000
O. Perf50.7530.05817.0070.000
O. Perf70.7830.03021.6310.000
O. Perf90.9030.02642.4640.000
O. Perf100.8340.03126.0120.000
O. Perf110.7270.05619.1270.000
Ec. PerfE. Perf40.8580.02334.0030.000
E. Perf50.9340.01152.0060.000
E. Perf60.8070.08711.0190.000
E. Perf80.8560.03921.8640.000
E. Perf90.8810.03822.1170.000
E. Perf130.8340.02429.6740.000
Source: Authors’ preparation.
Table A3. Cross loadings.
Const.ItemsIEOEEOIPCIPNIPMSECCECIEMECDRLGINRGITSGCMGPRGMFGLGEn. PerfO. PerfEc. Perf
IEOIEO10.7010.1110.3180.1990.0860.0460.1780.1050.2720.0240.1240.3290.2030.0970.0560.1890.1160.2830.124
IEO20.8380.1480.4660.2120.1190.3260.4390.2620.3650.2030.1590.4770.2230.1310.3370.4520.2730.3790.301
IEO30.7740.1350.1270.2750.4210.3360.2270.3830.3460.4190.1460.1380.2860.4320.3470.2380.3940.3580.399
IEO40.8130.1890.0630.2130.3250.3370.1830.2420.2200.2500.2000.0740.2310.3360.3480.1940.2530.2330.353
IEO50.7070.1140.0960.2470.3390.1760.3490.1240.3780.0790.0630.1050.2580.3500.1880.4610.1350.3670.179
EEOEEO10.2140.6980.0340.1550.3050.1170.2390.3370.3000.1810.0440.1660.3380.1370.2870.3040.2730.1520.047
EEO20.2290.7220.2160.0540.0330.1320.1290.0570.3220.1350.2270.0650.0430.1490.1400.0180.3190.1120.186
EEO30.5130.9040.1010.0610.2510.2970.4530.3930.4020.2890.1080.0730.2630.3330.4490.4000.4170.2560.132
EEO40.3260.7030.0130.3470.0930.0960.1870.0580.3140.0220.0240.3360.1070.1180.2090.0390.2840.0720.031
EEO50.0650.8020.0820.3360.1820.1410.0720.1430.0910.1470.0930.3250.1950.1620.0930.1170.1110.1200.056
IPCIPC10.0410.2780.7790.0940.1060.2930.0420.1760.1610.3030.0870.1210.3070.0560.1910.1750.3180.1100.061
IPC20.0900.1270.7560.1870.1590.2510.1170.1330.0630.3450.1770.1740.2650.1320.1470.0780.3600.2010.114
IPC30.2740.2230.7810.1040.2060.2420.2010.1920.1960.2380.1150.2210.2570.2140.2090.2110.2530.1190.161
IPC40.0310.4140.7830.1540.1670.2310.0530.1070.4370.3250.1740.1820.2460.0530.1320.3970.3400.1690.112
IPNIPN10.1450.2220.1270.7270.1880.4870.1260.2820.3560.3660.1580.4570.0930.2710.3410.3510.1330.4320.151
IPN20.1620.4230.1560.7620.1410.4240.3660.3710.4360.4650.1110.3940.3360.4620.4210.4400.1210.3690.391
IPN30.3480.1880.2030.8890.3990.2550.3680.2590.2880.2170.3690.2250.3380.2470.2730.2020.3340.2110.373
IPN40.1460.4020.1370.8020.4410.3300.1640.2790.3870.9920.4100.3010.1370.2940.2770.2710.3950.2870.189
IPMIPM10.1410.2050.1570.0760.7020.3050.2480.1930.1950.2530.2920.2350.1810.1820.2580.3000.2530.1980.201
IPM20.4680.2330.4160.0370.8350.2980.2450.4190.4740.3750.2850.2320.4060.4610.3810.3030.2500.4240.479
IPM30.2580.3670.2660.1240.9120.2590.1140.5460.3420.2830.2460.1010.4330.3300.2870.2640.1160.5510.347
SECSEC10.2830.3420.3180.0170.2440.7030.2010.2320.4920.0370.2500.3110.3230.0130.2210.2900.3490.3250.023
SEC20.2200.3670.2210.2130.2490.8410.3920.2730.2180.1770.2170.3230.2260.1870.2270.2270.3740.2280.217
SEC30.1030.4210.2120.1530.2330.7770.4390.2650.2530.2960.1110.3030.2310.1280.2110.1140.4270.2190.159
SEC40.2380.1150.3490.1220.3770.8160.4190.2710.4380.3230.2150.1120.3290.0910.3550.2450.1220.3560.111
SEC50.0140.2520.2740.1590.3930.7100.3120.2630.2390.4270.0110.2190.2590.1370.3710.0410.2590.2810.166
CECCEC20.2790.1980.3980.0620.4740.2540.7020.3010.3680.2870.2640.1830.3830.0470.4580.2390.2190.1280.364
CEC30.3770.2480.3580.0960.4950.3820.7250.2330.4980.3080.3620.2330.3430.0810.4850.3670.3170.1880.329
CEC40.2940.4660.2810.4540.3950.3200.9070.2310.3460.3630.2790.4510.2660.4040.3800.3040.2340.3910.263
CEC60.1250.5080.4390.0740.5910.2050.7060.3430.3950.3350.1110.4110.4240.0590.5760.1910.1450.3820.419
CEC70.3610.0950.4060.0340.3340.2550.8050.2180.3410.2260.3360.0810.3910.0190.3190.2400.3010.1040.427
IEMIEM10.0670.1710.1180.0590.2910.2430.3780.7820.2260.4130.0930.1850.1330.0740.3060.2680.4120.1130.205
IEM70.1920.3380.2530.3810.3230.3270.2140.7590.4240.2970.2030.3730.2680.3950.5730.3420.2140.2230.373
IEM80.2940.2130.3130.0760.3740.2690.2940.7840.0780.1720.2090.2280.4270.0920.4740.2840.3090.3290.248
IEM90.3920.2630.3730.1110.3950.3970.3930.7870.1880.3390.3070.2780.3880.1240.4950.4120.4070.4270.298
IEM110.3090.4810.2950.3690.4110.3350.3110.7310.2960.2170.3270.4990.3120.3840.4250.3500.3170.3440.417
IEM130.1410.3230.3540.0890.4910.2210.1390.7650.3920.2630.1550.4840.4690.1040.4970.2350.1410.1750.493
IEM160.3760.0100.4210.0490.3460.2710.3760.8920.3180.4810.4110.1250.4360.0740.3640.2850.3310.4110.145
ECDECD10.3070.1880.0750.0340.1670.0940.2610.0130.8120.3680.2580.1340.0950.2280.1550.3220.0730.2080.087
ECD20.4550.2010.1080.3150.4280.2510.3550.1920.7050.4660.2610.1680.3760.4890.3120.4160.2530.3540.103
ECD30.1160.2640.4100.3250.2160.3720.3350.4080.8380.1770.3240.4700.3860.2770.4330.3960.4670.0190.165
ECD50.0520.2020.3140.3260.1720.2310.2090.2390.9150.1220.2620.3740.3870.2330.2620.2710.2980.1120.103
ECD60.0850.2360.3280.1650.4380.1130.3670.0680.7140.1450.2960.3880.2250.4990.1790.4260.1320.0270.134
RLGRLG10.1460.3180.1020.2280.3280.2910.1720.0140.3090.8410.3070.1900.0770.0360.1690.0970.2640.0170.294
RLG30.0450.0240.1220.1180.0420.3130.1260.2070.4570.7810.4550.2030.1120.3170.4310.2540.3580.1960.342
RLG40.0520.2410.3110.4720.4580.4110.2810.0920.1180.8210.1160.2660.4120.3270.2180.3740.3380.4120.103
RLG80.3590.0840.0870.1760.0490.3070.0120.0110.0540.7150.0520.2040.3160.3280.1740.2330.2130.2430.068
INRINR10.3270.1910.1100.0810.1120.0990.1160.0910.1040.2870.7110.2040.1990.0860.0470.1780.1070.2730.111
INR20.3270.1680.0950.0140.1870.0740.2810.0430.1240.4750.7310.3410.2210.1170.3270.4390.2630.3680.211
INR30.4350.2210.0880.3350.4080.2710.3250.1720.0730.0970.9140.2040.2750.4220.3330.2290.3830.3470.411
GITSGITS10.2160.0870.1070.1360.2690.1960.3630.1150.4090.2890.1770.7170.3280.2190.0970.0460.1890.1160.287
GITS20.3240.1120.1080.4170.4290.3530.4570.2940.4570.3030.2110.8200.4760.2220.1310.3370.4510.2730.377
GITS40.1120.1530.3090.4270.3180.4740.4370.4130.2180.3660.4120.7910.1370.2850.4320.3470.2380.3940.358
GITS50.1630.0990.2130.4280.2740.3330.3160.3410.1540.3040.4160.7650.0730.2240.3360.3480.1940.2540.232
GCMGCM20.1210.2710.3630.2010.4730.1480.4020.0830.1000.2710.3630.2110.7910.3110.2230.1120.0690.2070.134
GCM30.1790.3510.1350.2630.3610.3240.2050.0270.1690.3530.1650.3660.7940.4590.2370.1440.3610.4670.297
GCM50.0780.0570.1560.1530.0750.3460.1590.2420.0680.0670.1570.2470.7420.1210.2990.4440.3710.2610.417
GCM60.0850.2740.3430.3940.4610.4440.2930.1260.0950.2740.3440.1430.7720.0630.2380.3390.3660.2210.277
GPRGPR10.4690.1930.1960.2870.0470.4140.1210.1130.3690.1930.2940.1110.4010.8920.2140.0190.1500.1030.229
GPR20.4580.2820.2410.1720.1320.1890.2470.1820.4570.2680.3420.1490.4090.8230.3210.0370.2000.3330.338
GPR30.4180.2990.1860.1450.2780.2050.3720.1240.3270.2760.2640.1100.2280.7160.3470.1750.3870.2130.226
GPR60.4180.2480.1630.1240.2670.1940.2930.0790.4180.2390.2130.1260.2270.8470.2990.3280.1580.1160.247
GPR80.4150.3120.2190.3150.3280.2510.4110.2930.3170.2010.3190.2720.3780.9230.3920.3280.2150.2270.334
GMFGMF20.2170.3630.4190.4230.4150.3720.3350.3910.1490.2970.4430.3580.2490.3280.7250.2210.2280.1170.078
GMF30.1530.3010.4130.4240.3710.2310.2090.2390.0850.2450.3470.3590.2050.4740.8520.3210.2410.1480.353
GMF50.1860.3350.4270.2630.4370.2130.3670.0680.1180.2690.3620.1980.4720.2270.7920.2270.3040.4400.362
GMF60.2450.4150.2090.2260.4250.2890.2700.0220.1770.3490.1340.2630.3590.1230.8320.1440.2420.3540.367
GMF90.1440.1210.2200.2160.2490.3110.1240.2150.0760.0560.1540.1510.0760.1510.7260.1390.2760.3680.224
GLGGLG20.0830.2830.3520.3720.3570.4070.3120.1340.0930.2730.3540.4460.3510.1870.3320.7220.3290.3330.117
GLG30.4020.1240.1430.2110.0920.3470.0540.0460.4010.1220.1540.2310.0970.0890.3470.7420.3920.3100.156
GLG40.3910.2150.1740.1070.1790.1230.1810.1110.3900.2330.1880.1110.1840.0930.2610.9250.2690.2970.377
En. PerfE. Perf10.2970.2110.1870.1120.2260.1230.2730.1100.3210.3210.2310.1140.2230.3570.1270.4010.7280.3330.461
E. Perf20.3410.2340.2190.3320.3370.2340.3680.2430.4120.3020.2470.4010.3420.3360.1390.4130.8310.3120.431
E. Perf30.2270.2670.3820.3170.2340.3450.3470.2370.2220.2970.3160.3250.3610.4110.1490.3290.8010.2870.398
E. Perf40.1720.2970.3240.3160.1990.3670.2220.2010.1530.2630.3010.3020.2950.3420.0770.2480.7760.1350.294
E. Perf50.1390.3240.3110.2270.1780.2170.3770.1590.1760.2110.2910.2930.0920.2640.0510.1190.8020.1020.311
O. PerfO. Perf30.1550.3250.1190.2370.3350.3120.2110.3150.1660.3380.1210.2500.3480.1520.3800.2310.2060.8050.127
O. Perf50.0540.0310.1300.1270.0590.2970.1340.2660.0650.0440.1430.1400.0620.1830.3680.1720.1950.7530.273
O. Perf70.0620.2480.3160.4630.4650.4280.2970.0960.0720.2620.3310.4940.4780.2340.3290.1240.2520.7830.359
O. Perf90.3680.0730.0940.1850.0560.3420.0080.1290.3800.1030.1020.1980.0690.1920.4790.2170.3730.9030.313
O. Perf100.3560.1800.1410.0700.1430.1890.1720.2940.3690.1930.1520.0830.1540.1070.1390.3830.2320.8340.199
O. Perf110.3160.1970.0850.0430.1760.2010.2920.3060.3290.2110.0970.0560.1890.2930.1210.3430.2140.7270.264
Ec. PerfE. Perf40.3970.2340.1420.3470.4610.3040.3510.2340.4110.2530.2340.3720.3980.3940.2170.4000.0760.3730.858
E. Perf50.2370.2970.3970.3390.2750.4230.3320.3870.2200.2380.3870.3690.3480.3730.2190.3840.0970.3990.934
E. Perf60.2530.2350.3670.3610.2310.2860.2770.3360.1370.2990.3580.3610.3010.4170.2480.0610.2470.3020.807
E. Perf80.1740.2690.3350.2060.4010.1680.3040.3200.1790.2830.3320.3420.2790.3080.1980.3180.3280.0920.856
E. Perf90.2310.3480.1120.2630.3720.3460.2340.0620.2350.2100.2900.2870.3310.2680.3140.2430.3010.1370.881
E. Perf130.0970.0570.1770.1520.1280.3680.2180.2950.1250.0070.1990.1830.2740.0870.0070.1760.0550.0910.834
Source: Authors’ preparation.

References

  1. Menon, A.; Menon, A. Enviropreneurial marketing strategy: The emergence of corporate environmentalism as market strategy. J. Mark. 1997, 61, 51–67. [Google Scholar] [CrossRef] [Green Version]
  2. Zailani, S.; Jeyaraman, K.; Vengadasan, G.; Premkumar, R. Sustainable supply chain management (SSCM) in Malaysia: A survey. Int. J. Prod. Econ. 2012, 140, 330–340. [Google Scholar] [CrossRef]
  3. Wu, G.-C.; Ding, J.-H.; Chen, P.-S. The effects of GSCM drivers and institutional pressures on GSCM practices in Taiwan’s textile and apparel industry. Int. J. Prod. Econ. 2012, 135, 618–636. [Google Scholar] [CrossRef]
  4. Pinto, L. Green supply chain practices and company performance in Portuguese manufacturing sector. Bus. Strat. Environ. 2020, 29, 1832–1849. [Google Scholar] [CrossRef]
  5. Wong, L. Corporate social responsibility in China: Between the market and the search for a sustainable growth development. Asian Bus. Manag. 2009, 8, 129–148. [Google Scholar] [CrossRef]
  6. Savita, K.; Dominic, P.; Ramayah, T. The adoption of green information technologies and systems as a driver within green SCM. In Proceedings of the Computer and Information Sciences (ICCOINS), Kuala Lumpur, Malaysia, 3–5 June 2014. [Google Scholar]
  7. Huang, X.; Yang, S.; Shi, X. How Corporate Social Responsibility and External Stakeholder Concerns Affect Green Supply Chain Cooperation among Manufacturers: An Interpretive Structural Modeling Analysis. Sustainability 2021, 13, 2518. [Google Scholar] [CrossRef]
  8. Zhu, Q.; Sarkis, J.; Lai, K.-H. Institutional-based antecedents and performance outcomes of internal and external green supply chain management practices. J. Purch. Supply Manag. 2013, 19, 106–117. [Google Scholar] [CrossRef]
  9. Vanalle, R.M.; Ganga, G.M.D.; Filho, M.G.; Lucato, W. Green supply chain management: An investigation of pressures, practices, and performance within the Brazilian automotive supply chain. J. Clean. Prod. 2017, 151, 250–259. [Google Scholar] [CrossRef]
  10. Choi, D.; Hwang, T. The impact of green supply chain management practices on firm performance: The role of collaborative capability. Oper. Manag. Res. 2015, 8, 69–83. [Google Scholar] [CrossRef]
  11. Ahmed, W.; Najmi, A.; Arif, M.; Younus, M. Exploring firm performance by institutional pressures driven green supply chain management practices. Smart Sustain. Built Environ. 2019, 8, 415–437. [Google Scholar] [CrossRef]
  12. Azevedo, S.G.; Carvalho, H.; Machado, V. The influence of green practices on supply chain performance: A case study approach. Transp. Res. Part. E Logist. Transp. Rev. 2011, 47, 850–871. [Google Scholar] [CrossRef]
  13. Dai, J.; Montabon, F.L.; Cantor, D.E. Linking rival and stakeholder pressure to green supply management: Mediating role of top management support. Transp. Res. Part E Logist. Transp. Rev. 2014, 71, 173–187. [Google Scholar] [CrossRef]
  14. Huang, Y.-C.; Huang, C.-H.; Yang, M.-L. Drivers of green supply chain initiatives and performance. Int. J. Phys. Distrib. Logist. Manag. 2017, 47, 796–819. [Google Scholar] [CrossRef]
  15. Huang, Y.-C.; Huang, C.-H. Research on Relationships Among Institutional Pressure, Stewardship Behavior, Green Supply Chain Management, and Organizational Performance: The Case of Electrical and Electronics Industries in Taiwan. J. Comput. Inf. Sci. Eng. 2016, 16, 041010. [Google Scholar] [CrossRef]
  16. Yang, C.-S.; Lu, C.-S.; Haider, J.J.; Marlow, P.B. The effect of green supply chain management on green performance and firm competitiveness in the context of container shipping in Taiwan. Transp. Res. Part E Logist. Transp. Rev. 2013, 55, 55–73. [Google Scholar] [CrossRef]
  17. Lo, S.M.; Shiah, Y.-A. Associating the motivation with the practices of firms going green: The moderator role of environmental uncertainty. Supply Chain Manag. Int. J. 2016, 21, 485–498. [Google Scholar] [CrossRef]
  18. Ye, F.; Zhao, X.; Prahinski, C.; Li, Y. The impact of institutional pressures, top managers’ posture and reverse logistics on performance—Evidence from China. Int. J. Prod. Econ. 2013, 143, 132–143. [Google Scholar] [CrossRef]
  19. Chan, R.Y.K.; He, H.; Chan, H.K.; Wang, W.Y. Environmental orientation and corporate performance: The mediation mechanism of green supply chain management and moderating effect of competitive intensity. Ind. Mark. Manag. 2012, 41, 621–630. [Google Scholar] [CrossRef]
  20. Zhou, K.Z.; Li, J.J.; Zhou, N.; Su, C. Market orientation, job satisfaction, product quality, and firm performance: Evidence from China. Strateg. Manag. J. 2008, 29, 985–1000. [Google Scholar] [CrossRef]
  21. Yu, Y.; Huo, B. The impact of environmental orientation on supplier green management and financial performance: The moderating role of relational capital. J. Clean. Prod. 2019, 211, 628–639. [Google Scholar] [CrossRef]
  22. Li, S.; Jayaraman, V.; Paulraj, A.; Shang, K.-C. Proactive environmental strategies and performance: Role of green supply chain processes and green product design in the Chinese high-tech industry. Int. J. Prod. Res. 2015, 54, 2136–2151. [Google Scholar] [CrossRef]
  23. Younis, H.; Sundarakani, B.; Vel, P. The impact of implementing green supply chain management practices on corporate performance. Compet. Rev. 2016, 26, 216–245. [Google Scholar] [CrossRef]
  24. Kung, F.; Huang, C.; Cheng, C. Assessing the green value chain to improve environmental performance: Evidence from Taiwan’s manufacturing industry. Int. J. Dev. Issues 2012, 11, 111–128. [Google Scholar] [CrossRef]
  25. Eltayeb, T.K.; Zailani, S.; Ramayah, T. Green supply chain initiatives among certified companies in Malaysia and environmental sustainability: Investigating the outcomes. Resour. Conserv. Recycl. 2011, 55, 495–506. [Google Scholar] [CrossRef]
  26. Yang, M.G.; Hong, P.; Modi, S.B. Impact of lean manufacturing and environmental management on business performance: An empirical study of manufacturing firms. Int. J. Prod. Econ. 2011, 129, 251–261. [Google Scholar] [CrossRef]
  27. Wu, K.-J.; Liao, C.-J.; Tseng, M.-L.; Chiu, A.S.F. Exploring decisive factors in green supply chain practices under uncertainty. Int. J. Prod. Econ. 2015, 159, 147–157. [Google Scholar] [CrossRef]
  28. Vijayvargy, L.; Thakkar, J.; Agarwal, G. Green supply chain management practices and performance. J. Manuf. Technol. Manag. 2017, 28, 299–323. [Google Scholar] [CrossRef]
  29. Ahmed, S.S.; Akter, T.; Ma, Y. Green Supply Chain Management (GSCM) Performance Implemented by the Textile Industry of Gazipur District, Dhaka. Logistics. 2018, 2, 21. [Google Scholar] [CrossRef] [Green Version]
  30. Mumtaz, U.; Ali, Y.; Petrillo, A. A linear regression approach to evaluate the green supply chain management impact on industrial organizational performance. Sci. Total Environ. 2018, 624, 162–169. [Google Scholar] [CrossRef]
  31. Teixeira, A.A.; Jabbour, C.J.C.; Jabbour, A.B.L.D.S.; Latan, H.; Oliveira, J. Green training and green supply chain management: Evidence from Brazilian firms. J. Clean. Prod. 2016, 116, 170–176. [Google Scholar] [CrossRef]
  32. Geng, R.; Mansouri, S.A.; Aktas, E. The relationship between green supply chain management and performance: A meta-analysis of empirical evidences in Asian emerging economies. Int. J. Prod. Econ. 2017, 183, 245–258. [Google Scholar] [CrossRef] [Green Version]
  33. Agarwal, A.; Giraud-Carrier, F.C.; Li, Y. A mediation model of green supply chain management adoption: The role of internal impetus. Int. J. Prod. Econ. 2018, 205, 342–358. [Google Scholar] [CrossRef]
  34. DiMaggio, P.J.; Powell, W.W. The iron cage revisited: Institutional isomorphism and collective rationality in organizational fields. Am. Sociol. Rev. 1983, 48, 147–160. [Google Scholar] [CrossRef] [Green Version]
  35. Yang, C.-S. An analysis of institutional pressures, green supply chain management, and green performance in the container shipping context. Transp. Res. Part D Transp. Environ. 2018, 61, 246–260. [Google Scholar] [CrossRef]
  36. Rivera, J. Institutional Pressures and Voluntary Environmental Behavior in Developing Countries: Evidence from the Costa Rican Hotel Industry. Soc. Nat. Resour. 2004, 17, 779–797. [Google Scholar] [CrossRef]
  37. Wernerfelt, B. A resource-based view of the firm. Strateg. Manag. J. 1984, 5, 171–180. [Google Scholar] [CrossRef]
  38. Choi, S.-B.; Min, H.; Joo, H.-Y. Examining the inter-relationship among competitive market environments, green supply chain practices, and firm performance. Int. J. Logist. Manag. 2018, 29, 1025–1048. [Google Scholar] [CrossRef]
  39. Assumpção, J.J.; Campos, L.M.D.S.; Jabbour, A.B.L.D.S.; Jabbour, C.J.C.; Vazquez-Brust, D.A. Green Supply Chain Practices: A comprehensive and theoretically multidimensional framework for categorization. Production. 2019, 29, 20190047. [Google Scholar] [CrossRef]
  40. Younis, H.; Sundarakani, B. The impact of firm size, firm age and environmental management certification on the relationship between green supply chain practices and corporate performance. Benchmarking Int. J. 2020, 27, 319–346. [Google Scholar] [CrossRef]
  41. Barney, J.B. Strategic Factor Markets: Expectations, Luck, and Business Strategy. Manag. Sci. 1986, 32, 1231–1241. [Google Scholar] [CrossRef]
  42. Conner, K.R. A Historical Comparison of Resource-Based Theory and Five Schools of Thought Within Industrial Organization Economics: Do We Have a New Theory of the Firm? J. Manag. 1991, 17, 121–154. [Google Scholar] [CrossRef]
  43. Boiral, O. Corporate Greening Through ISO 14001: A Rational Myth? Organ. Sci. 2007, 18, 127–146. [Google Scholar] [CrossRef]
  44. Miemczyk, J. An exploration of institutional constraints on developing end-of-life product recovery capabilities. Int. J. Prod. Econ. 2008, 115, 272–282. [Google Scholar] [CrossRef] [Green Version]
  45. Su-Yol, L. Drivers for the participation of small and medium-sized suppliers in green supply chain initiatives. Supply Chain. Manag. 2008, 13, 185–198. [Google Scholar]
  46. Mathiyazhagan, K.; Diabat, A.; Al-Refaie, A.; Xu, L. Application of analytical hierarchy process to evaluate pressures to implement green supply chain management. J. Clean. Prod. 2015, 107, 229–236. [Google Scholar] [CrossRef]
  47. Chavez, R.; Yu, W.; Feng, M.; Wiengarten, F. The Effect of Customer-Centric Green Supply Chain Management on Operational Performance and Customer Satisfaction: Green Supply Chain Management and Performance. Bus. Strat. Environ. 2014, 25, 205–220. [Google Scholar] [CrossRef]
  48. Huang, Y.-C.; Wong, Y.-J.; Yang, M.-L. Proactive environmental management and performance by a controlling family. Manag. Res. Rev. 2014, 37, 210–240. [Google Scholar] [CrossRef]
  49. Saeed, A.; Jun, Y.; Nubuor, S.A.; Priyankara, H.P.R.; Jayasuriya, M.P.F. Institutional Pressures, Green Supply Chain Management Practices on Environmental and Economic Performance: A Two Theory View. Sustainability 2018, 10, 1517. [Google Scholar] [CrossRef] [Green Version]
  50. Grant, R.M. The Resource-Based Theory of Competitive Advantage: Implications for Strategy Formulation. Calif. Manag. Rev. 1991, 33, 114–135. [Google Scholar] [CrossRef] [Green Version]
  51. Murray, J.Y.; Gao, G.Y.; Kotabe, M. Market orientation and performance of export ventures: The process through marketing capabilities and competitive advantages. J. Acad. Mark. Sci. 2011, 39, 252–269. [Google Scholar] [CrossRef]
  52. Habib, M.; Bao, Y.; Nabi, N.; Dulal, M.; Asha, A.A.; Islam, M. Impact of Strategic Orientations on the Implementation of Green Supply Chain Management Practices and Sustainable Firm Performance. Sustainability 2021, 13, 340. [Google Scholar] [CrossRef]
  53. Qu, Y.; Yu, Y.; Appolloni, A.; Li, M.; Liu, Y. Measuring green growth efficiency for Chinese manufacturing industries. Sustainability 2017, 9, 637. [Google Scholar] [CrossRef] [Green Version]
  54. Hervani, A.A.; Helms, M.M.; Sarkis, J. Performance measurement for green supply chain management. Benchmarking Int. J. 2005, 12, 330–353. [Google Scholar] [CrossRef] [Green Version]
  55. Lambert, D. Supply Chain Management—Processes, Partnerships, Performance, 3rd ed.; Supply Chain Management Institute: Sarasota, FL, USA, 2008. [Google Scholar]
  56. Younis, H.; Sundarakani, B.; O’Mahony, B. Investigating the relationship between green supply chain management and corporate performance using a mixed method approach: Developing a roadmap for future research. IIMB Manag. Rev. 2019, 29, 1832–1849. [Google Scholar] [CrossRef]
  57. Xie, X.; Zang, Z.; Qi, G. Assessing the environmental management efficiency of manufacturing sectors: Evidence from emerging economies. J. Clean. Prod. 2016, 112, 1422–1431. [Google Scholar] [CrossRef]
  58. Muñoz-Villamizar, A.; Santos, J.; Viles, E.; Ormazábal, M. Manufacturing and environmental practices in the Spanish context. J. Clean. Prod. 2018, 178, 268–275. [Google Scholar] [CrossRef]
  59. Hair, J.F.; Ringle, C.M.; Sarstedt, M. PLS-SEM: Indeed a Silver Bullet. J. Mark. Theory Pract. 2011, 19, 139–152. [Google Scholar] [CrossRef]
  60. MacKenzie, S.B.; Podsakoff, P.M. Common Method Bias in Marketing: Causes, Mechanisms, and Procedural Remedies. J. Retail. 2012, 88, 542–555. [Google Scholar] [CrossRef]
  61. Hair, J.F.; Hult, G.T.M.; Ringle, C.M.; Sarstedt, M. Primer on Partial Least Squares Structural Equation Modeling (PLS-SEM), 2nd ed.; Sage: Thousand Oaks, CA, USA, 2017. [Google Scholar]
  62. Fornell, C.; Larcker, D.F. Evaluating structural equation models with unobservable variables and measurement error. J. Mark. Res. 1981, 18, 39–50. [Google Scholar] [CrossRef]
  63. Gefen, D.; Straub, D. A practical guide to factorial validity using PLS-Graph: Tutorial and annotated example. Commun. Assoc. Inf. Syst. 2005, 16, 91–109. [Google Scholar] [CrossRef] [Green Version]
  64. Cohen, J. Statistical Power Analysis for the Behavioral Sciences, 2nd ed.; Academic Press: New York, NY, USA, 1988. [Google Scholar]
  65. Kirchoff, J.F.; Tate, W.L.; Mollenkopf, D.A. The impact of strategic organizational orientations on green supply chain management and firm performance. Int. J. Phys. Distrib. Logist. Manag. 2016, 46, 269–292. [Google Scholar] [CrossRef]
Figure 1. Study framework and the relationship between the model constructs.
Sustainability 14 01523 g001
Table 1. The demographic profiles of the respondents.
Item DescriptionFrequency(%)
Business Type
Chemical, fabric, plastic4212
Pharmaceutical5515.7
Fabric, leather, fur, shoes339.4
Paper, pulp195.4
Metal material329.1
Assembled metal products164.6
Electronics and communication equipment5315.0
Electric, mechanical, appliance3510.0
Automobile and automotive parts246.8
Ship machinery equipment, precision machinery205.7
Others226.3
Total351100.0
Participants position in the organization
Top management (i.e., President, CEO, Vice President)349.7
Middle Management (i.e., Director, Senior Manager, Manager)28681.5
Supervisory level (i.e., senior officer, officer, coordinator)164.5
Non-managerial (i.e., accountant, assistant, specialist, etc.)154.3
Total351100.0
Location of responding firms in Saudi Arabia
Eastern Province 78 22.2
Central Province174 49.6
Western Province51 14.5
Northern Province36 10.3
Southern Province12 3.4
Total 351 100.0
Size of firms (Number of employees)
51–100 120 34.2
101–300 107 30.5
301–500 46 13.1
501–5000 71 20.2
More than 5000 7 2.0
Total 351 100.0
Number of years in business
1–5 17 4.8
6–10 58 16.5
11–20 105 29.9
21 or more 171 48.8
Total 351 100.0
Legal status and ownership
Government 16 4.6
Semi-government 14 4.0
Private company 289 82.3
Multinational Corporation (MNC) 32 9.1
Total 351 100.0
Table 2. The convergent validity analysis.
ConstructsItemsLoadingsCRAVE
IEOIEO10.7010.8010.676
IEO20.838
IEO30.774
IEO40.813
IEO50.707
EEOEEO10.6980.8280.552
EEO20.722
EEO30.904
EEO40.703
EEO50.802
IPCIPC10.7790.8310.630
IPC20.756
IPC30.781
IPC40.783
IPNIPN10.7270.8350.601
IPN20.762
IPN30.889
IPN40.802
IPMIPM10.7020.7970.611
IPM20.835
IPM30.912
SECSEC10.7030.8330.655
SEC20.841
SEC30.777
SEC40.816
SEC50.710
CECCEC20.7020.8620.589
CEC30.725
CEC40.907
CEC60.706
CEC70.805
IEMIEM10.7820.8210.661
IEM70.759
IEM80.784
IEM90.787
IEM110.731
IEM130.765
IEM160.892
ECDECD10.8120.8520.633
ECD20.705
ECD30.838
ECD50.915
ECD60.714
RLGRLG10.8410.8490.674
RLG30.781
RLG40.821
RLG80.715
INRINR10.7110.7960.622
INR20.731
INR30.914
GITSGITS10.7170.7830.606
GITS20.820
GITS40.791
GITS50.765
GCMGCM20.7910.8270.641
GCM30.794
GCM50.742
GCM60.772
GPUGPR10.8920.8190.587
GPR20.823
GPR30.716
GPR60.847
GPR80.923
GMFGMF20.7250.7420.592
GMF30.852
GMF50.792
GMF60.832
GMF90.726
GLGGLG20.7220.8410.619
GLG30.742
GLG40.925
En. PerfE. Perf10.7280.8270.677
E. Perf20.831
E. Perf30.801
E. Perf40.776
E. Perf50.802
O. PerfO. Perf30.8050.7940.681
O. Perf50.753
O. Perf70.783
O. Perf90.903
O. Perf100.834
O. Perf110.727
Ec. PerfE. Perf40.8580.7970.684
E. Perf50.934
E. Perf60.807
E. Perf80.856
E. Perf90.881
E. Perf130.834
Table 3. Fornell–Larcker criterion.
ConstructIEOEEOIPCIPNIPMSECCECITEMECDRLGINRGITSGCMGPUGMFGLGEn. PerfO. PerfEc. Perf
ICE0.822
EEO0.2590.743
IPC0.4910.1140.794
IPN0.2020.4110.1680.775
IPM0.2260.3910.2790.2000.782
SEC0.3780.4290.2990.3860.5030.809
CEC0.4110.4880.3970.1820.3250.4330.767
IEM0.2790.4730.4260.2980.4870.4360.5230.825
ECD0.3940.3210.4980.2580.5380.4960.5370.4560.796
RLG0.2710.4230.3370.4160.5040.4420.4740.4800.4230.821
INR0.3870.5060.3870.4410.3120.4020.2220.4350.1980.4510.789
GITS0.1830.3280.4210.5000.4090.1980.2460.4120.3090.4210.5430.778
GCM0.2990.4900.4350.3100.4990.4530.3980.4510.3290.2170.3650.3240.801
GPR0.2590.5410.5070.2700.5600.5120.4310.5130.4270.3330.5270.5320.4860.766
GMF0.4170.5070.3460.4280.5160.4680.2990.4980.4560.2930.5780.5730.5460.3390.769
GLG0.3870.5060.4060.1940.3370.4490.4140.3470.5270.4430.5440.5490.4920.5270.4960.787
E. Perf0.1830.3280.4340.3110.5090.4520.2910.4480.3670.3860.5430.3440.4340.5880.5680.3490.823
O. Perf0.2720.4260.3460.4280.4990.4580.4940.5050.4530.3240.2400.4420.2320.5540.5030.3610.2830.825
E. Perf0.3870.5060.3770.4410.3110.4030.2310.4330.2110.3440.4240.5320.4860.3490.4130.2780.4020.3310.837
Table 4. Heterotrait–Monotrait Ratio (HTMT).
Const.IEOEEOIPCIPNIPMSECCECITEMECDRLGINRGITSGCMGPUGMFGLGEn. PerfO. PerfEc. Perf
ICE
EEO0.321
IPC0.6310.368
IPN0.3650.5110.428
IPM0.2970.7240.4520.442
SEC0.3530.5980.4180.5030.771
CEC0.5910.6350.5730.2820.5480.573
IEM0.3450.5840.5020.3540.7040.5560.765
ECD0.5140.6480.7390.4060.8380.5340.8300.567
RLG0.3640.5450.3940.5400.8210.6260.6540.7180.651
INR0.3650.4350.6800.5020.5870.5540.7990.6190.7040.199
GITS0.6640.4030.6180.5550.3860.7920.8360.7740.4830.5090.246
GCM0.3980.5440.4610.6060.4360.5460.7850.7030.5550.2430.4230.306
GPR0.3310.7570.4850.4750.5100.7150.8490.8400.6070.2750.6020.3300.320
GMF0.3860.6310.4510.5360.8040.5650.7460.5950.7410.2310.4760.2980.3830.149
GLG0.6240.6680.6030.3150.5810.6060.5120.7330.7350.4690.5140.4510.1820.4260.451
En. Perf0.3780.6170.5350.3870.7370.5890.7980.4110.6860.2230.4620.4020.2320.5840.4340.643
O. Perf0.5470.6810.7820.4390.8720.5670.8630.6000.5740.4920.5260.5170.3060.7160.4120.7080.445
Ec. Perf0.3970.5770.4270.5730.8540.6590.6860.7510.6840.2420.4230.3720.4180.6990.5030.5320.5080.529
Table 5. The predictive power of the construct.
ConstructR2Q2
GSCM0.390.21
En. Perf0.210.12
O. Perf0.260.14
Ec. Perf0.340.23
Table 6. Hypotheses testing.
No.HypothesisEstimationSEt-Statisticsp-Valuesf2Remarks
(H1a)IPC → GSCM0.4250.0745.7310.0000.153Supported
(H1b)IPN → GSCM0.5210.0717.3520.0000.267Supported
(H1c)IPM → GSCM0.4100.0675.9860.0000.217Supported
(H2a)EEO → GSCM0.4760.0516.7710.0000.223Supported
(H2b)IEO → GSCM0.5070.0577.3830.0000.319Supported
(H3a)GSCM → En. Perf0.5430.07410.5510.0000.374Supported
(H3b)GSCM → O. Perf0.4830.0629.2410.0000.322Supported
(H3c)GSCM → Ec. Perf0.5270.06910.8750.0000.352Supported
Publisher’s Note: MDPI stays neutral with regard to jurisdictional claims in published maps and institutional affiliations.

