Article

Carbon Footprint Assessment of a Novel Bio-Based Composite for Building Insulation

1
Department of Architecture, Built Environment and Construction Engineering (ABC), Politecnico di Milano, Via G. Ponzio 31, 20133 Milano, Italy
2
Chair of Sustainable Construction, Eidgenössische Technische Hochschule (ETH) Zurich, Stefano Francini Platz 5, CH-8093 Zurich, Switzerland
3
Laboratory for Materials and Construction Works Durability (LMDC), Institut National des Sciences Appliquées de Toulouse, Avenue de Rangueil 135, 31077 Toulouse, France
*
Author to whom correspondence should be addressed.
Sustainability 2022, 14(3), 1384; https://doi.org/10.3390/su14031384
Submission received: 10 December 2021 / Revised: 10 January 2022 / Accepted: 20 January 2022 / Published: 26 January 2022

Abstract

:
This research explores the carbon removal of a novel bio-insulation composite, here called MycoBamboo, based on the combination of bamboo particles and mycelium as binder. First, an attributional life cycle assessment (LCA) was performed to define the carbon footprint of a European bamboo plantation and a bio-insulation composite, as well as its ability to remove CO2 along its lifecycle at a laboratory scale. Secondly, the Global Worming Potential (GWP) was estimated through a dynamic LCA with selected end-of-life and technical replacement scenarios. Finally, a building wall application was analyzed to measure the carbon saving potential of the MycoBamboo when compared with alternative insulation materials applied as an exterior thermal insulation composite system. The results demonstrate that despite the negative GWP values of the biogenic CO2, the final Net-GWP was positive. The technical replacement scenarios had an influence on the final Net-GWP values, and a longer storage period is preferred to more frequent insulation substitution. The type of energy source and the deactivation phase play important roles in the mitigation of climate change. Therefore, to make the MycoBamboo competitive as an insulation system at the industrial scale, it is fundamental to identify alternative low-energy deactivation modes and shift all energy-intensity activities during the production phase to renewable energy.

1. Introduction

Buildings are responsible for a consistent share of total greenhouse gas emissions (GHGs), and contribute massively to the consumption of natural resources [1,2,3]. While intense research has been conducted in the field of optimizing GHG emissions during building operations, the embodied emissions related to the materials used in buildings have gained attention only in the past few decades [4]. Embodied emissions are those considered in the lifespan of a material, which are linked to the material’s manufacture, transportation, construction and end-of-life disposal [5]. To mitigate the embodied emissions, recent studies have demonstrated the efficiency of substituting fossil-based materials with bio-based ones due to their carbon storage potential and reduced life-cycle emissions [6,7]. Among the different biogenic materials, the ones that come from biomass that grows back within 1–5 years, also called fast-growing or herbaceous biomass, are the most promising for use to mitigate climate change since they can store carbon much faster than trees [8]. Bamboo is one of the fastest-growing biomasses, and is characterized by a high carbon content [9]; however, this beneficial effect is limited if the bamboo is imported to Europe [10], since the mode of transport is relevant in terms of emissions [11]. To lower transportation emissions and to benefit from bamboo’s unique features, such as rapid growth, high productivity and rapid ripening from the shoot [12], the interest in bamboo cultivations of phyllostachys edulis has been growing in Europe [13,14]. The growth patterns of bamboo differ from those of traditional wood, and beside the possibility of substituting wooden panels with bamboo ones, the quantity of bamboo particles generated as waste throughout bamboo’s industrial chain can be consistent [15]. Typically, these particles exhibit good hygrothermal potentials that are linked to their natural fibrous structure [16]. By creating insulating materials out of this waste, from a circular economy perspective, one can address the need to lower the operational energy in buildings today while neutralizing the building’s embodied emissions. Reducing the use of non-renewable resources is a key strategy in a circular economy; nonetheless, to improve the dimensional stability, fire resistance, and biotic degradation resistance of these bamboo-based solutions [17], mycelium-based insulation materials are an emerging category of potentially useful bio-composites. Mycelium is the vegetative part and the root structure of fungal organisms [18], and it has attracted increasing academic and commercial interest over the past few decades as a new form of low-energy bio-fabrication and waste upcycling [19,20]. Waste and residues are thus valorized rather than discarded, while fungal mycelium acts as a reinforcement in the matrix structure, creating a 100% plastic-free and coherent material composite. Mycelium-based composites are noticeably less prone to ignition and flaming combustion, and therefore safer to use due to the high chitin/chitosan content and thermal stability, with degradation starting at temperatures greater than 220 °C [21]. Taking advantage of the characteristics discussed above, mycelium offers an alternative fabrication paradigm, acting as a self-assembling glue, based on the growth of materials rather than on extraction.
In addition, the choice to use biological substances, such as bamboo particles, allows us to consider the regenerative capacity of the environment, as well as to store CO2 within buildings’ skins. However, a considerable point of conflict within life-cycle assessment (LCA) is biogenic carbon accounting, used to quantify the carbon storage potential [22,23,24]. Carbon storage can be defined as the sequestration of carbon in products for a certain period, resulting in a temporary reduction in the CO2 concentration in the atmosphere [25]. The current LCA methodology does not consider when emissions occur, resulting in the impossibility of considering the temporary carbon storage and delayed emissions of bio-based products [7]. To overcome this simplification, several studies of bio-based materials have been carried out using the dynamic LCA (dLCA) approach, which is able to model different timing of emissions and sequestrations related to different boundaries and end-of-life options [7,24,26]. This model can also address the inconsistency between different time frames observed with traditional LCAs when replacing building assemblies and components during the life of buildings [4].
In this context, the goal of this study is to assess the carbon footprint of a novel bio-composite, MycoBamboo, as a novel insulation material for renovating building facades, and to analyze each process involved in its production. Despite their already established architectural potentials [27,28,29,30], the currently available literature and knowledge about the process efficiency and relative environmental impacts of these bio-based composites are very fragmented [31,32,33,34]. Indeed, the mycelium-based composites are new promising solutions for construction, and a deep understanding of their ability to mitigate the climate change over their life cycle is needed. Furthermore, when coupled with bamboo particles from phyllostachys edulis, the large carbon storage capacity of the involved fast-growing biomass contributes to reducing the Global Warming Potential (GWP). For this reason, a dLCA model was used to include biogenic CO2 in the assessment.

2. Materials and Methods

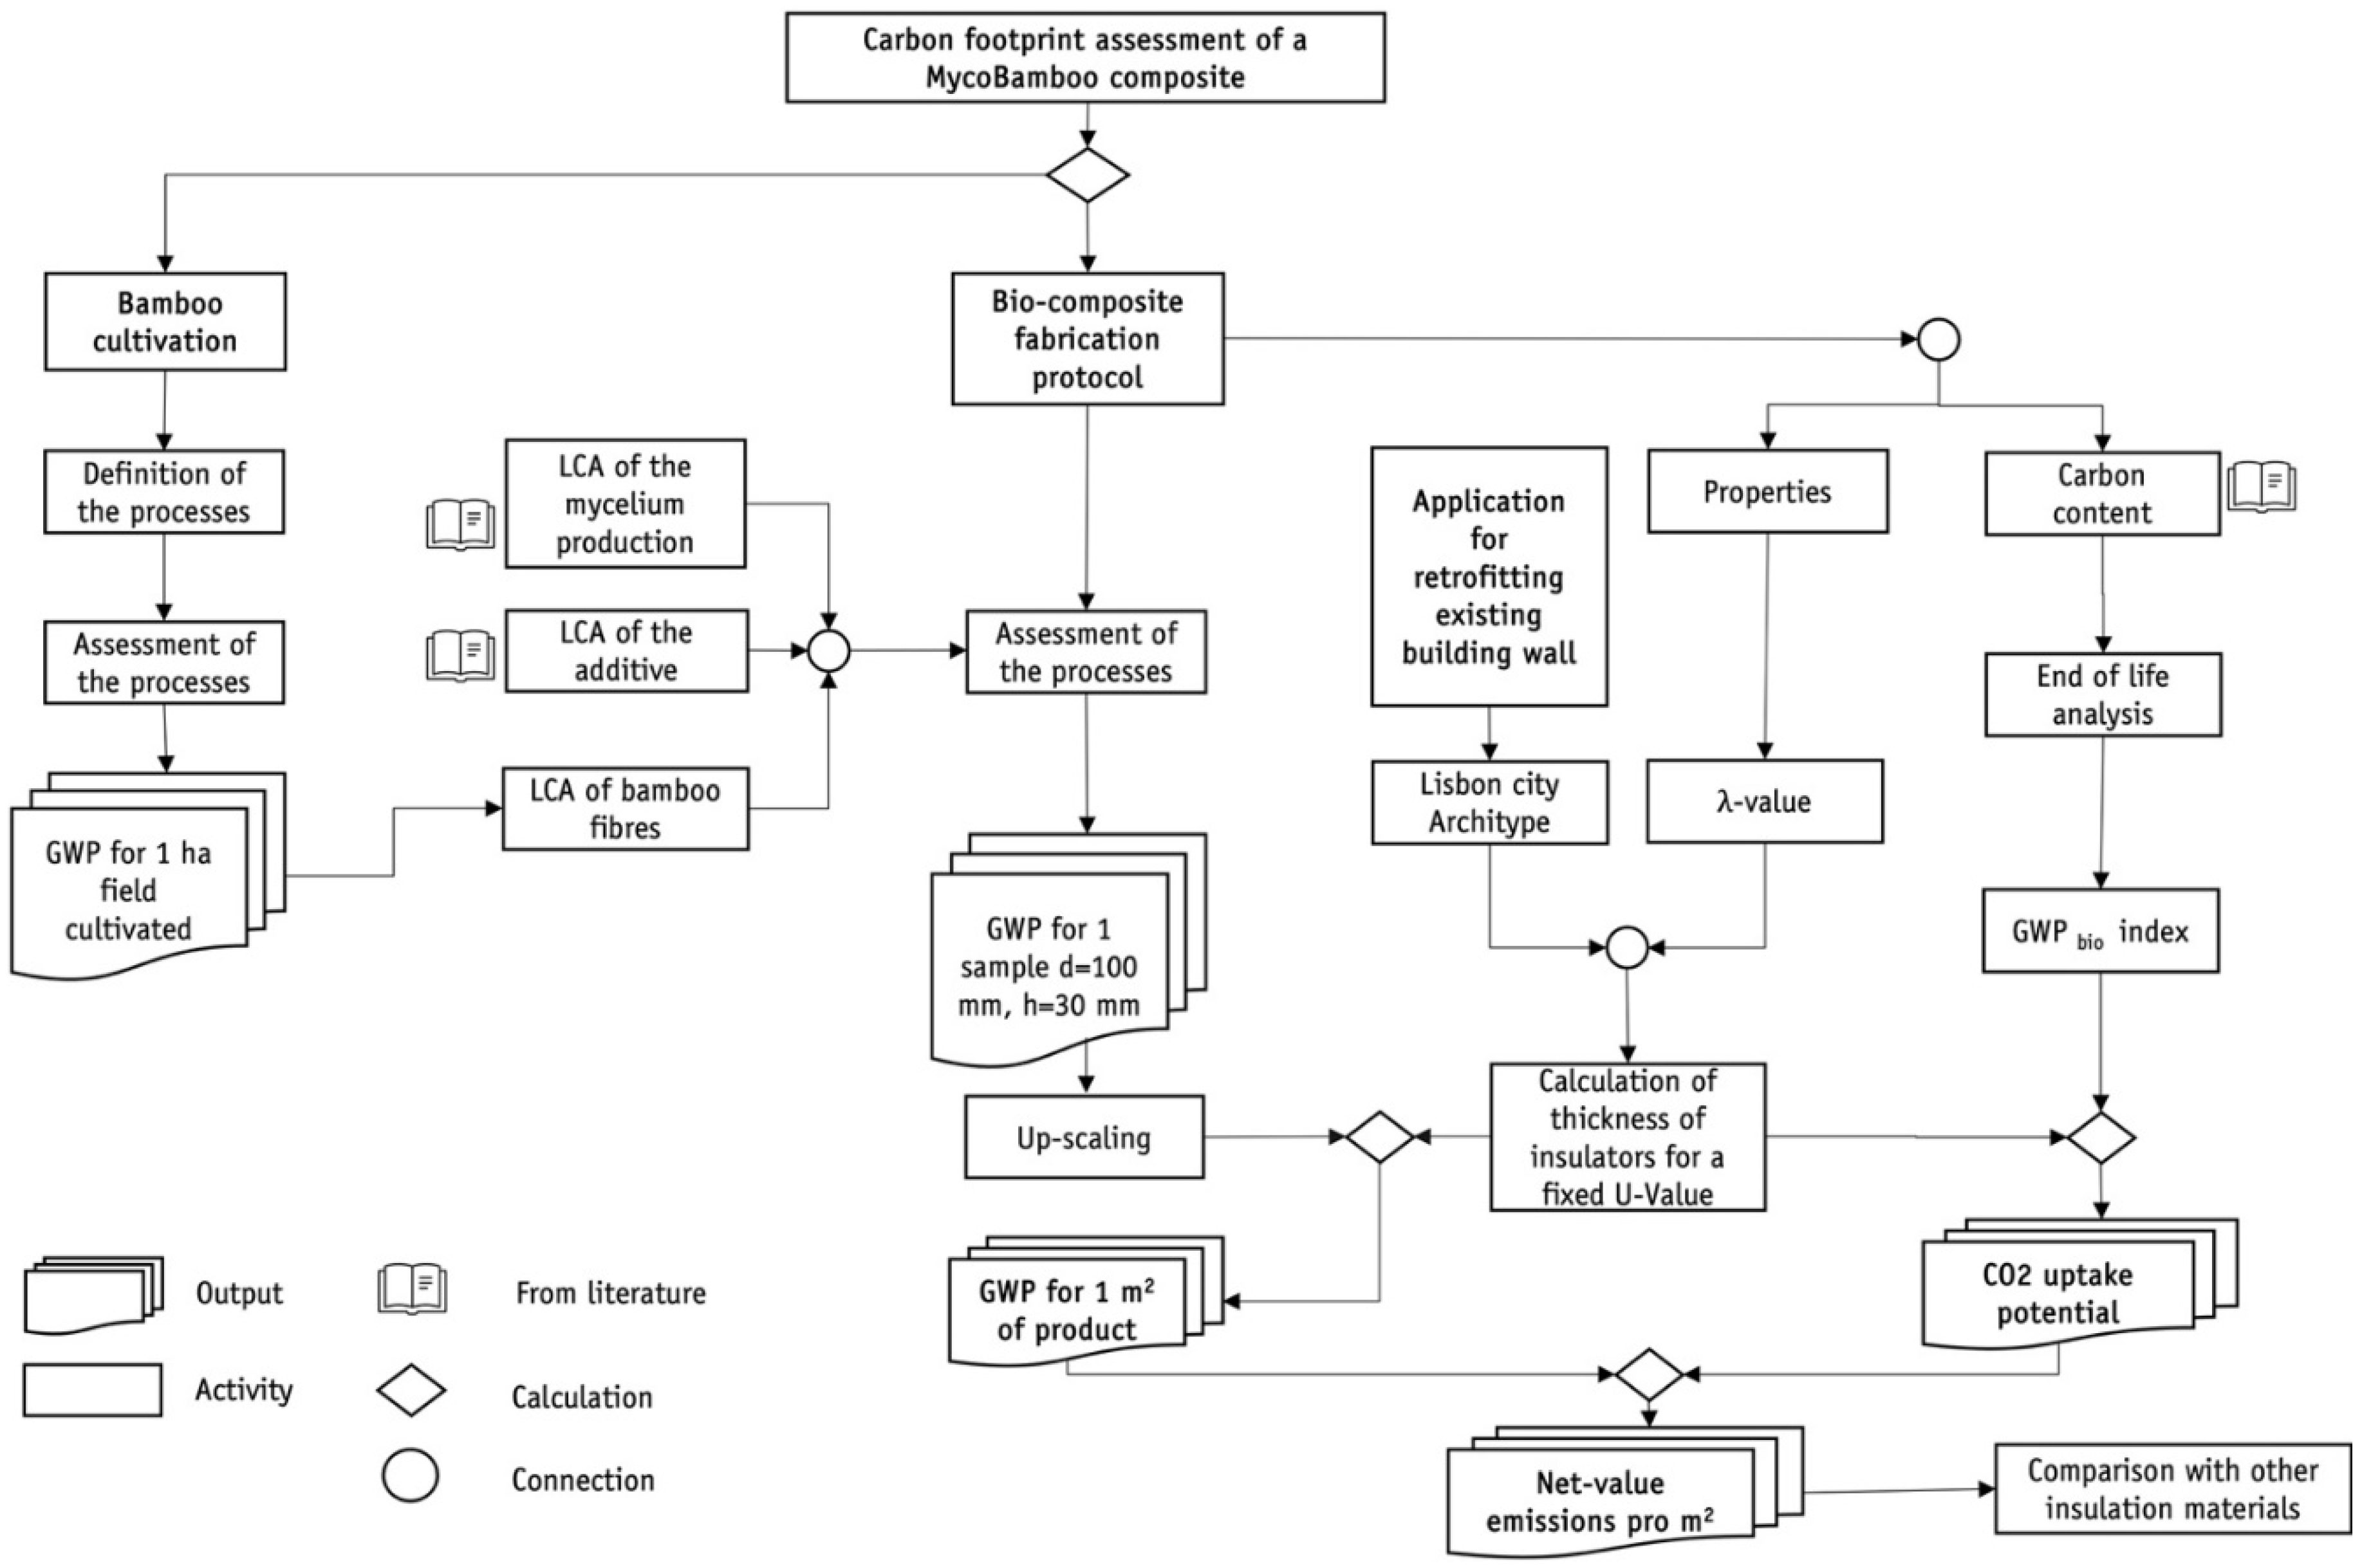
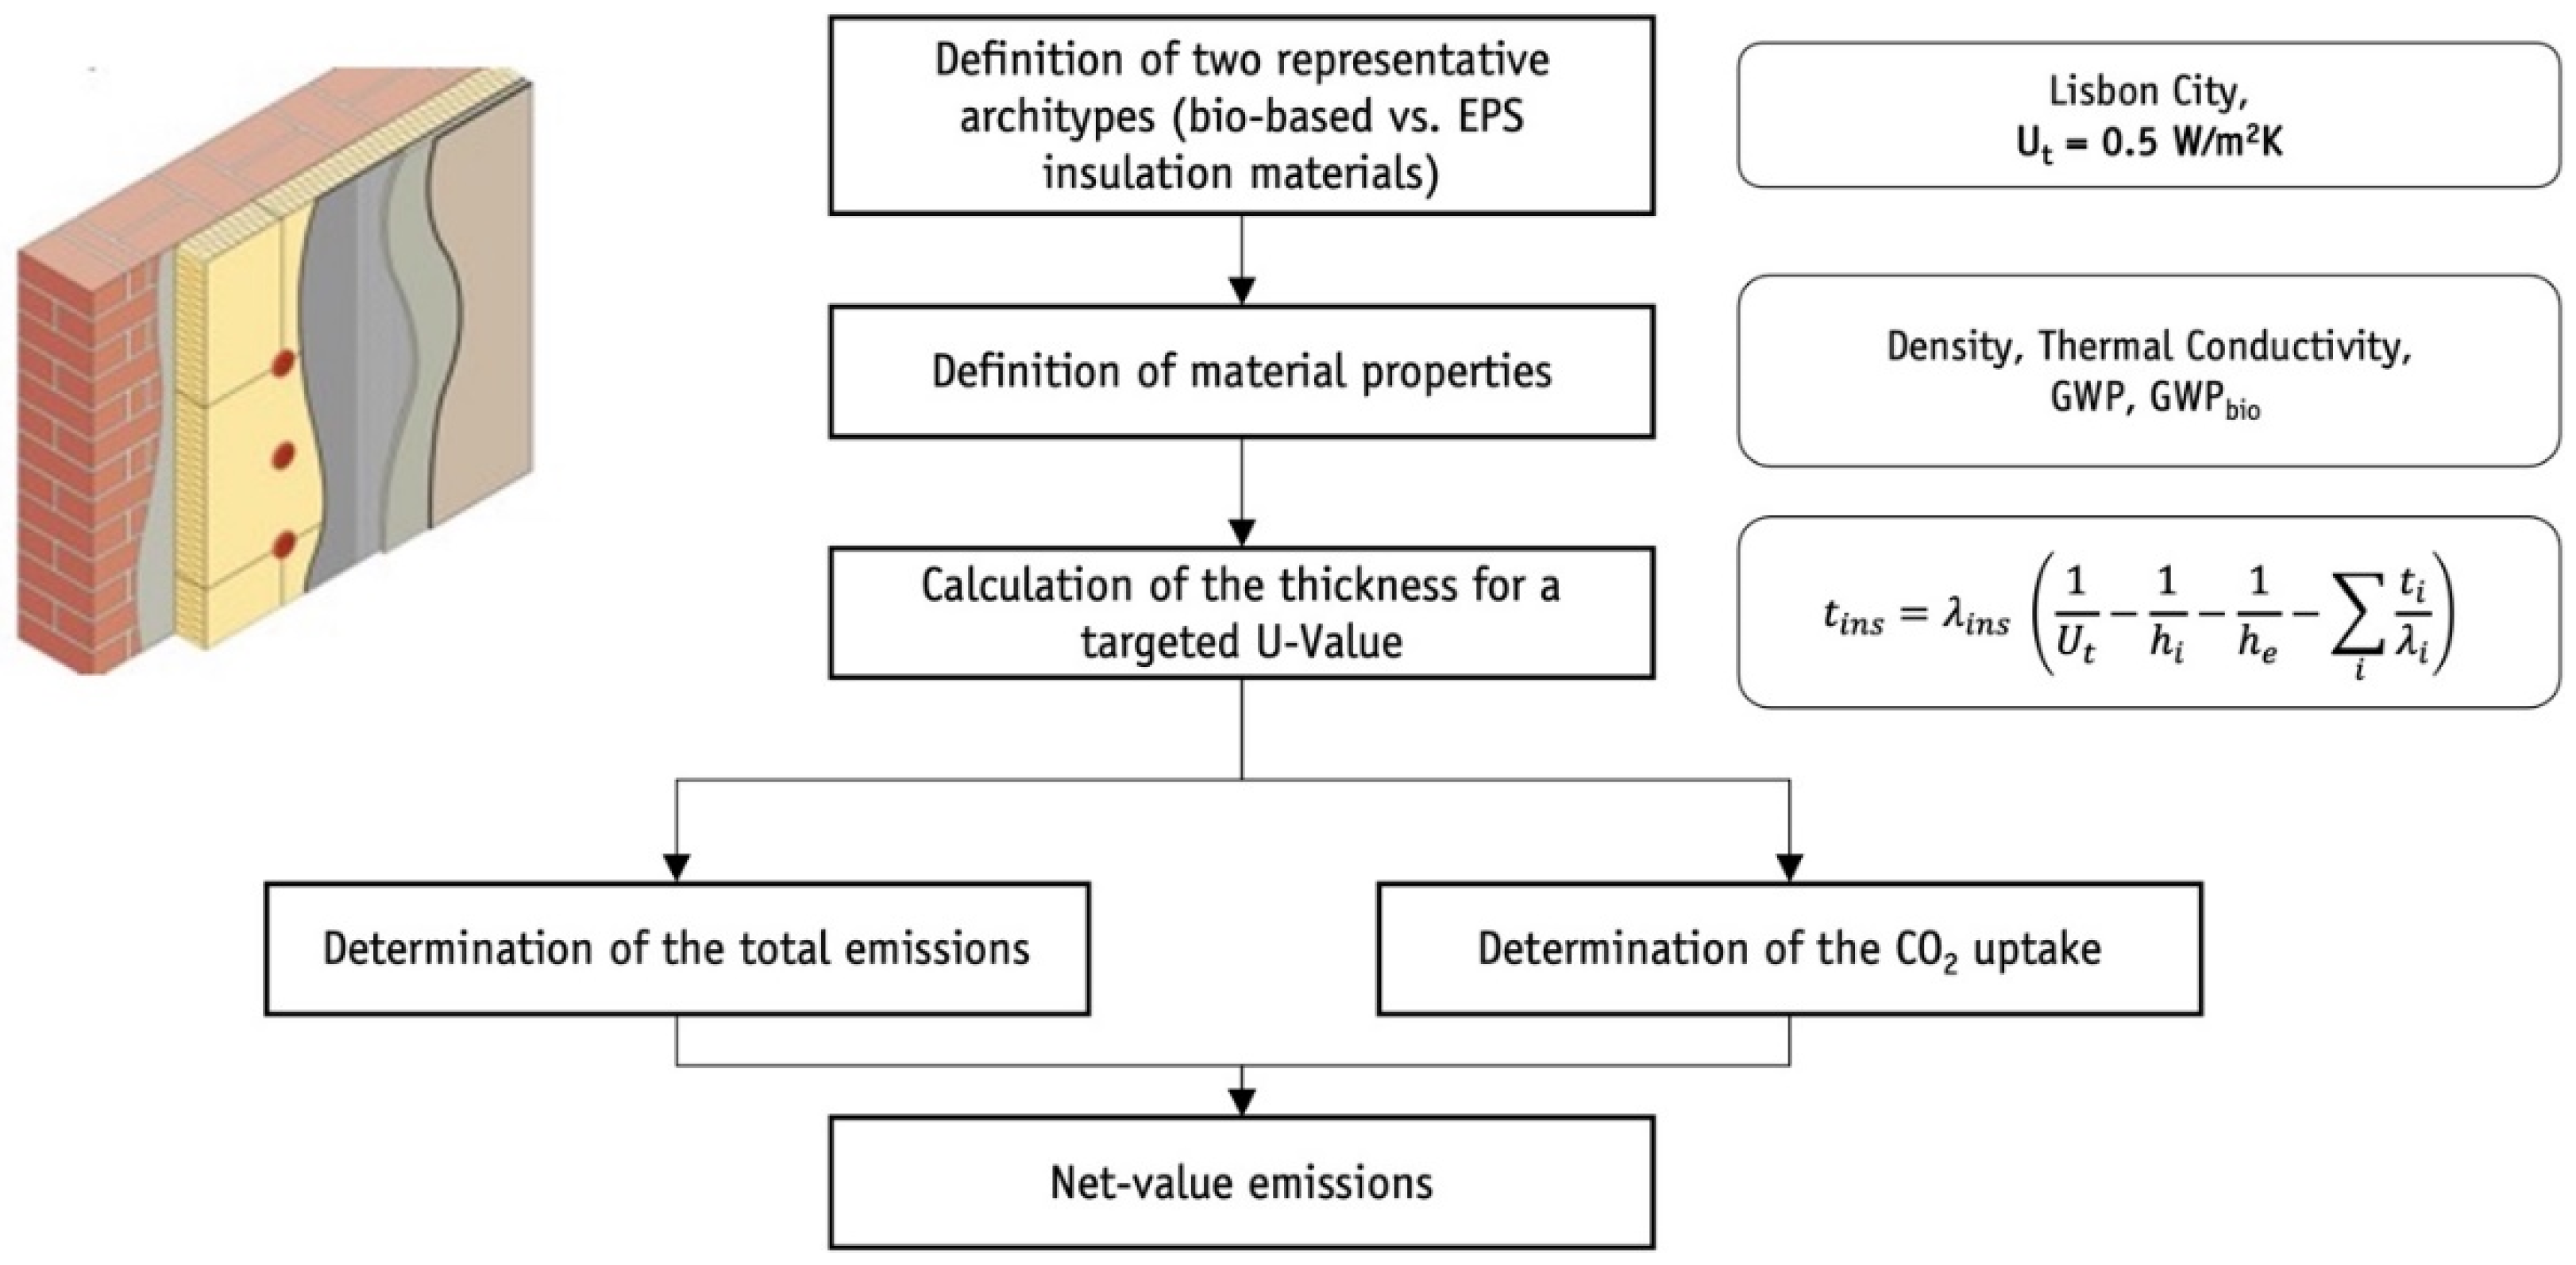
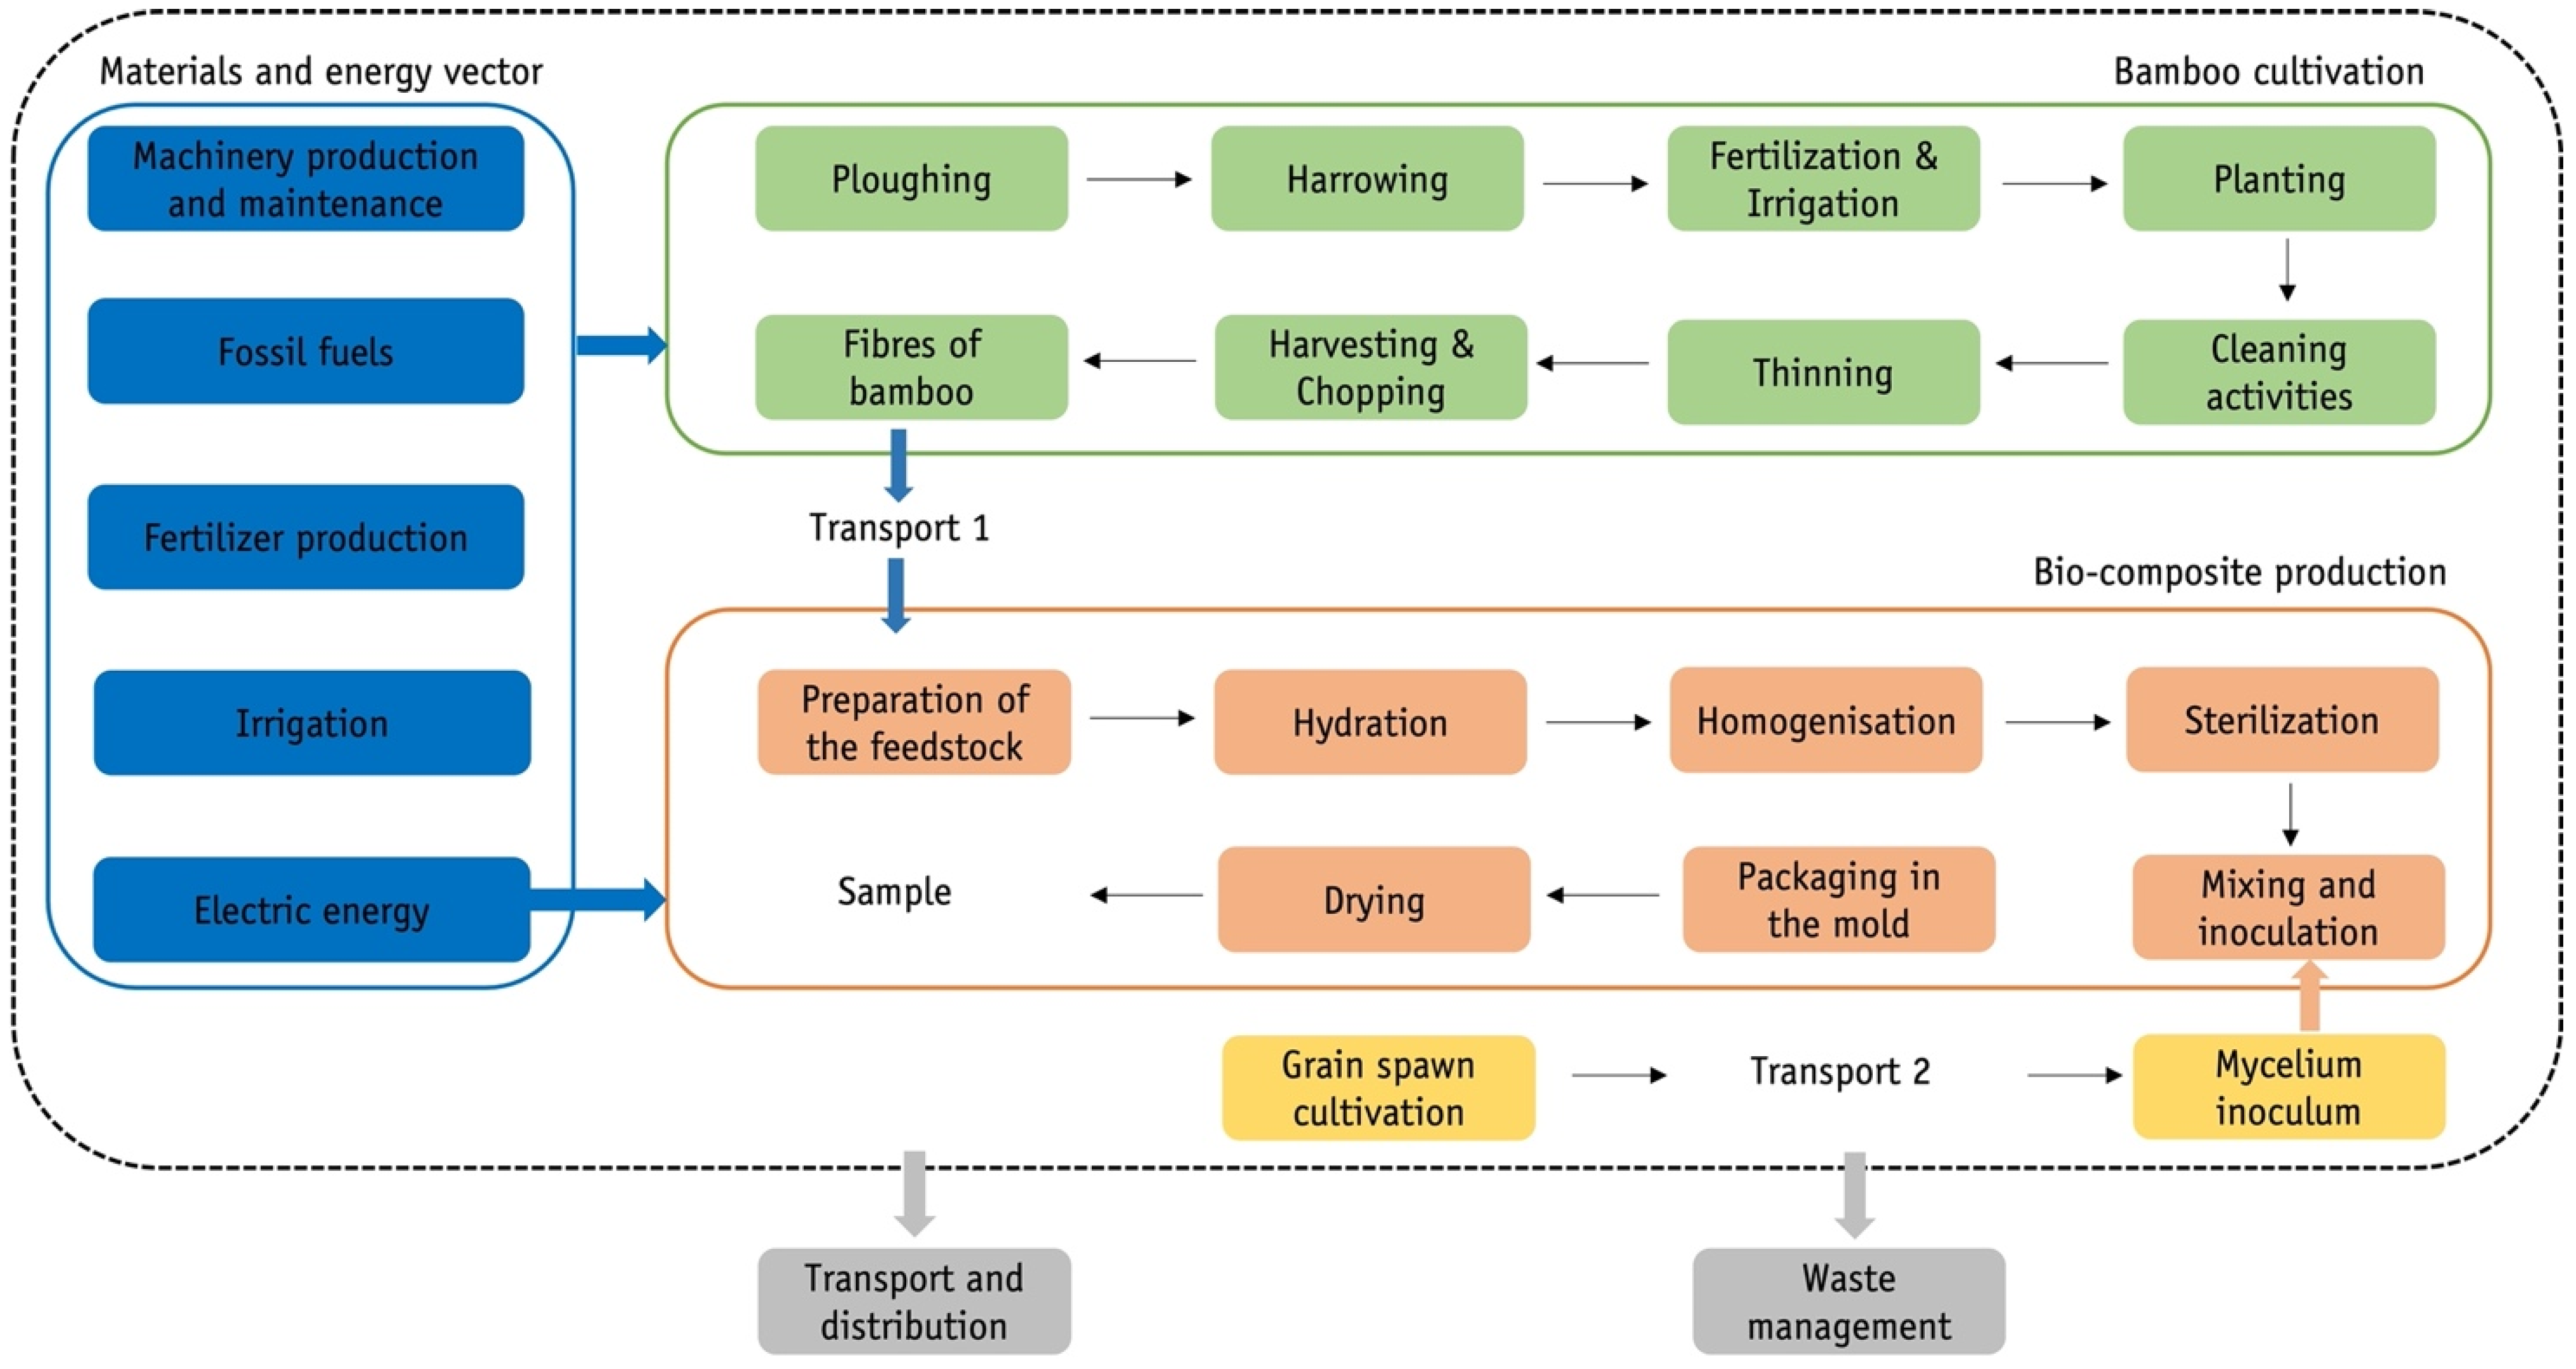
2.1. Methodological Framework

The carbon footprint of MycoBamboo composite fabricated at laboratory scale is here presented and the methodology adopted is represented as a schematic diagram in Figure 1.
The work was divided into four different phases. First, all the possible processes involved in selected bamboo cultivation were studied and analyzed through the guidelines of specialized bamboo farmers active in Italy [35]. Once all the inputs were collected and allocated, an LCA model was developed with the software SimaPro 9.2 [36] to analyze the GWP at 100 years (GWP-100) generated from 1 ha of bamboo cultivation. Data from the ecoinvent 3.8 database [37] were used for the definition of the Life Cycle Inventory (LCI) (see Table A1 in Appendix A). Secondly, the carbon emissions related to the fabrication of the MycoBamboo bio-composite were assessed according to the protocol developed at the laboratory scale. The input data flow for substrate preparation, as well as the output flow from the bamboo cultivation, with the addition of the transportation to the laboratory facilities, were included in the system’s boundaries. The functional unit (FU) assumed to model the production at lab-scale was 1 sample, a circular prism with ϕ = 100 mm and a thickness of 30 mm. In parallel, the bio-composite was tested to understand the thermal conductivity via the Transient Plane Source (TPS) method, which is based on the use of a disk placed between two samples, called a Hot Disk, that produces a thermal impulse on the material under examination and measures the change of thermal resistance, with the additional calculation of the thermal diffusivity and heat capacity. Thirdly, the carbon uptake potential of MycoBamboo was determined through a dLCA to evaluate anaerobic composting as an EOL scenario, and for two storage periods, namely, 30 and 60 years. The resulting GWP of biogenic CO2 was finally added to the fossil GWP to obtain the Net-GWP.
Finally, an up-scaling of the results for 1 m2 of MycoBamboo, installed onsite as the exterior thermal insulation composite system (ETICS) in the renovation of an existing reference façade, was proposed to compare the novel insulation system with alternative bio-based and non-bio-based solutions with identical U-values.

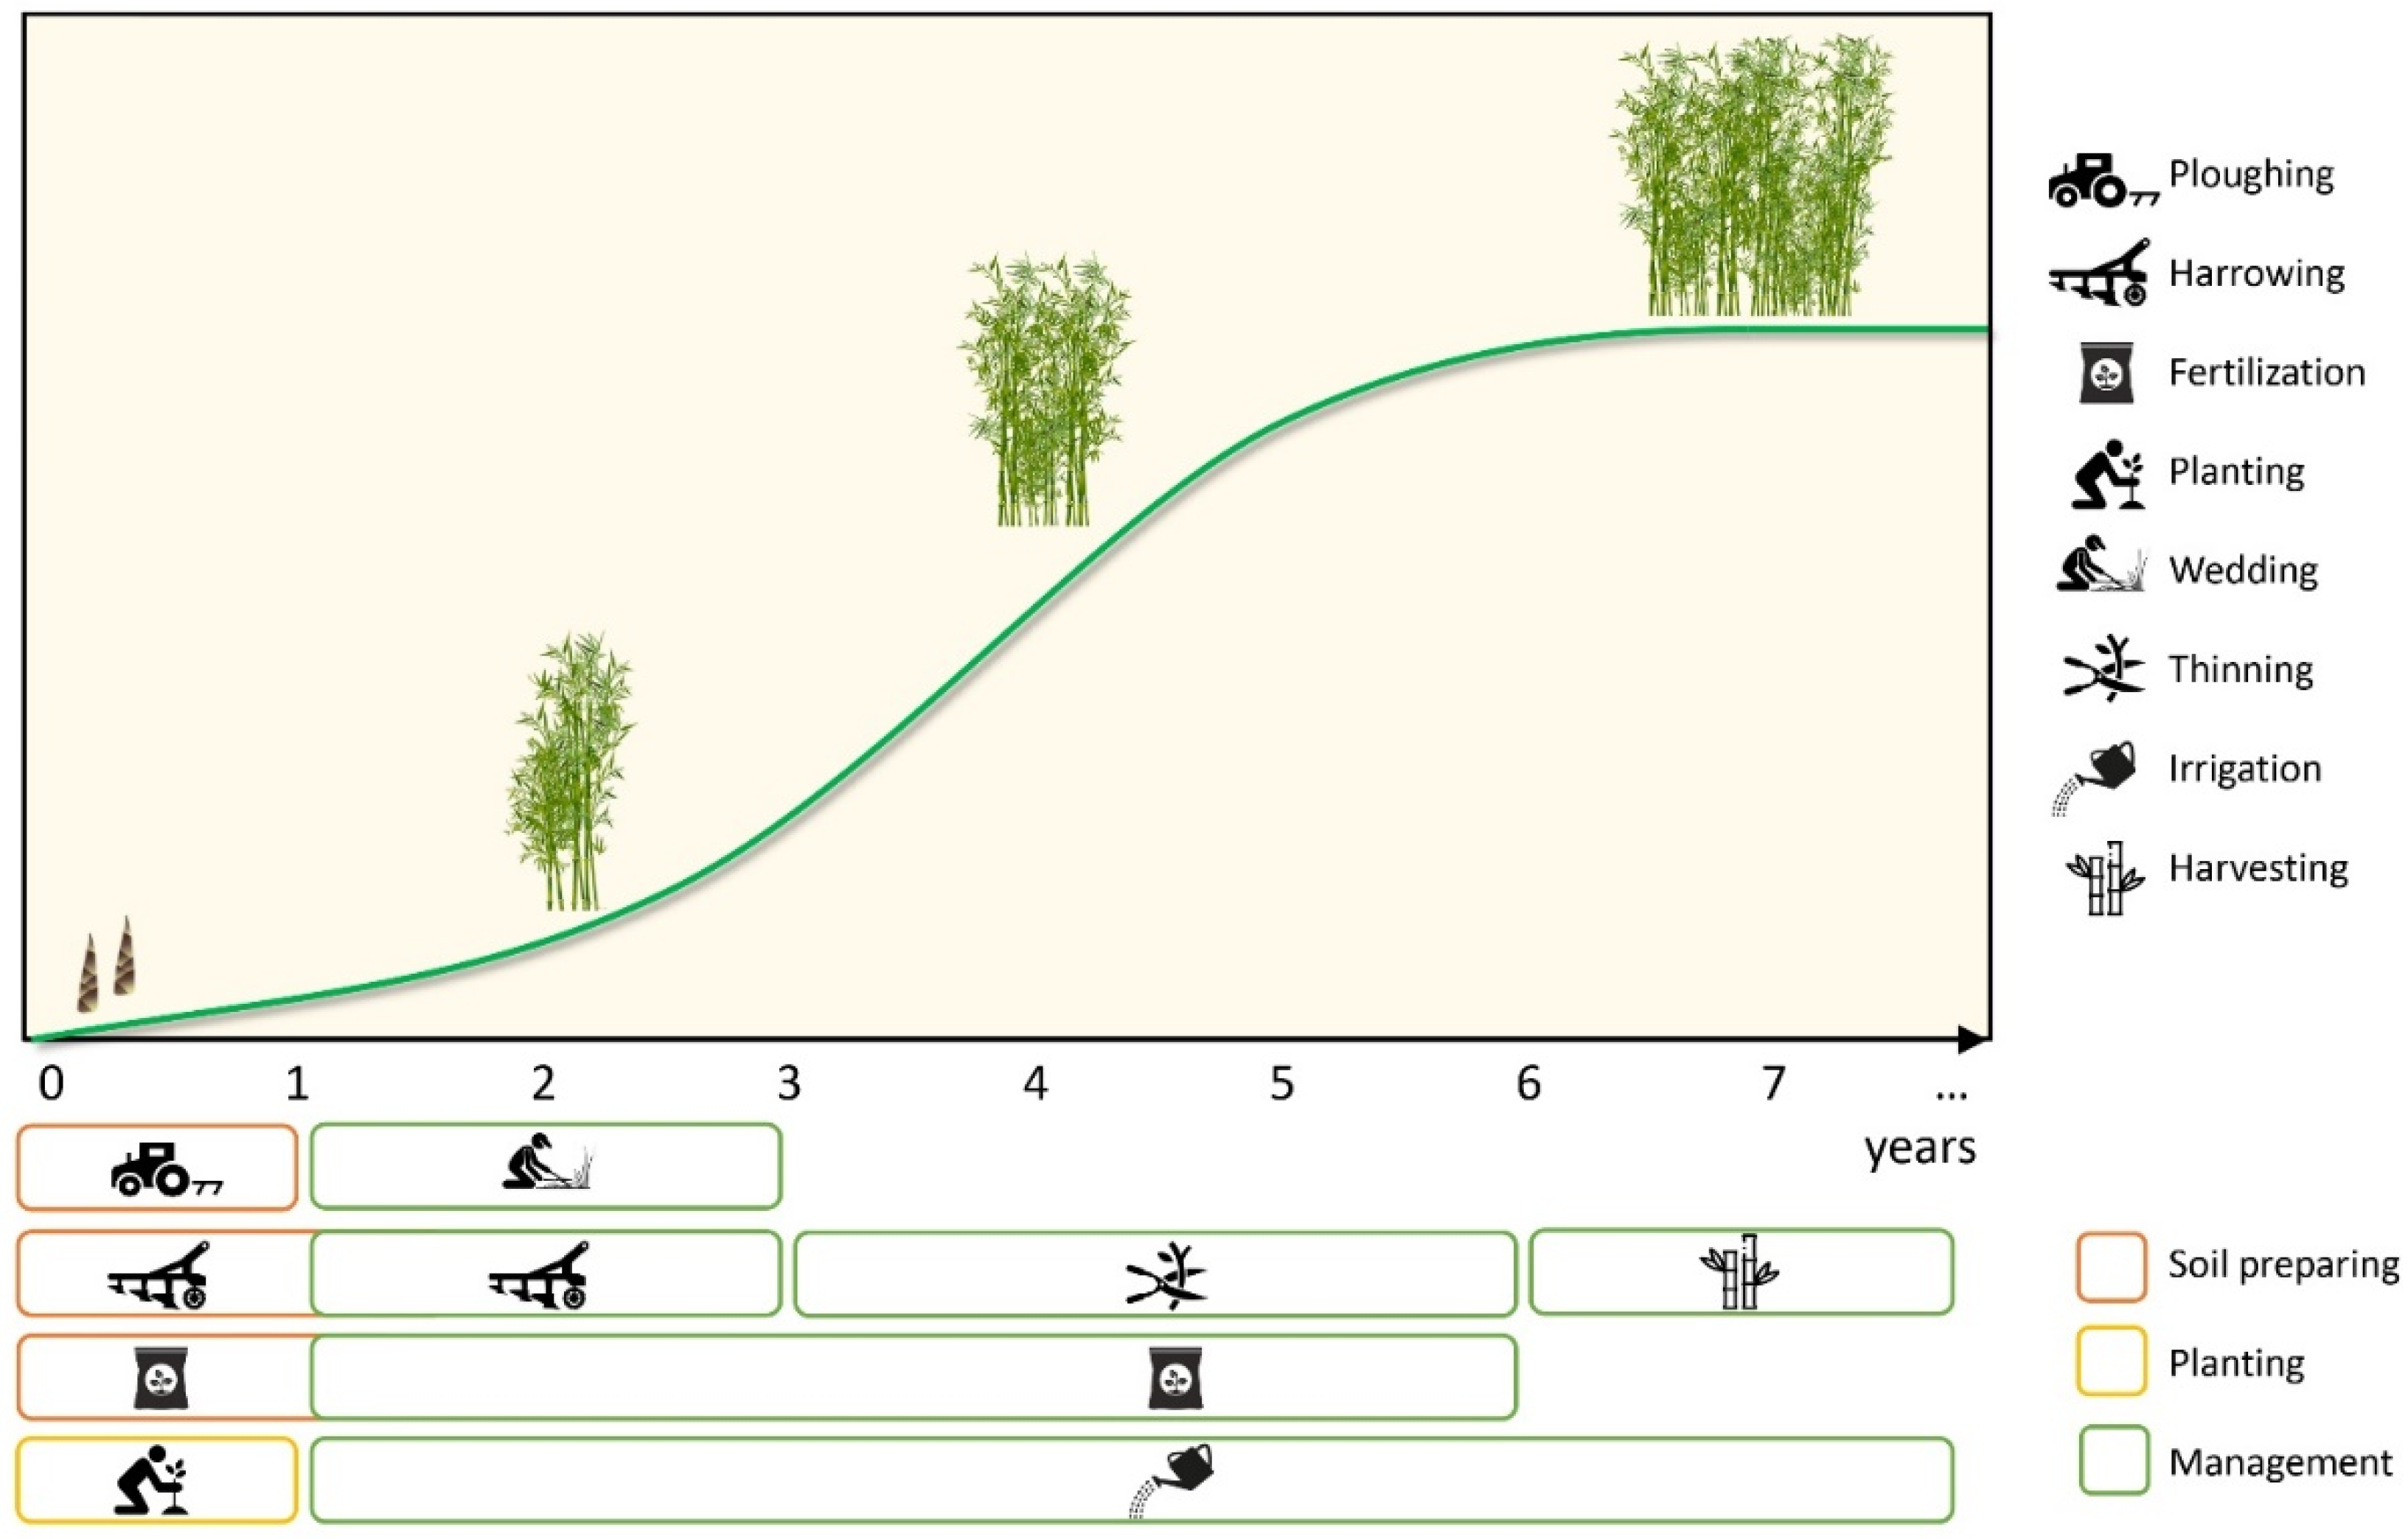
2.2. Bamboo Cultivation

A typical bamboo cultivation consists of three consequential phases, happening in different maturation periods of the plantation: (i) soil preparation, (ii) plantation, and (iii) cultivation management or maintenance. In Figure 2, the whole cultivation process, with agricultural activities, of bamboo growing is presented. The expected lifetime of a bamboo plantation under a continental climate is unknown. Moso bamboo is a perennial plant characterized by rapid growth and a long vegetative stage that lasts for decades or even longer before flowering. Recent studies have estimated that flowering, which causes the death of the plant, may take up to 100 years [38]. For this specific study, a reference service life of the plantation of 100 years was assumed.
The plants, usually supplied in plastic pots, were planted in rows about 3.5 m long and spaced 1.5 m from each other. Phillostachyis bamboo species are known to be invasive and this was thus an important aspect to consider when preparing the field, as the rhizomes could quickly invade neighboring lands. To address the problem of the invasiveness of bamboo, a perimeter trench 60 cm deep and 60 cm wide was needed to keep the ditch clean. The annual water requirement for irrigation is about 1000–2000 m3/ha and this is assumed to be a recurrent activity over the whole lifespan of the plantation.
Contrarily, fertilization for soil enrichment is a key input that is assumed to be performed over the first six years, during which the plantation grows to achieve full maturation. The last process, which is repeated yearly up to maturation, is thinning. Usually, a chainsaw or a disc brush cutter are used to clear-cut the base of the culms and remove the under-grown bamboo canes. Most of the energy-intensive processes are assumed to be performed during the first six years (maturation period), while harvesting takes place from full maturation to the end of life. All the specific processes used for the inventory in the ecoinvent dataset are reported in Table A1 in Appendix A.

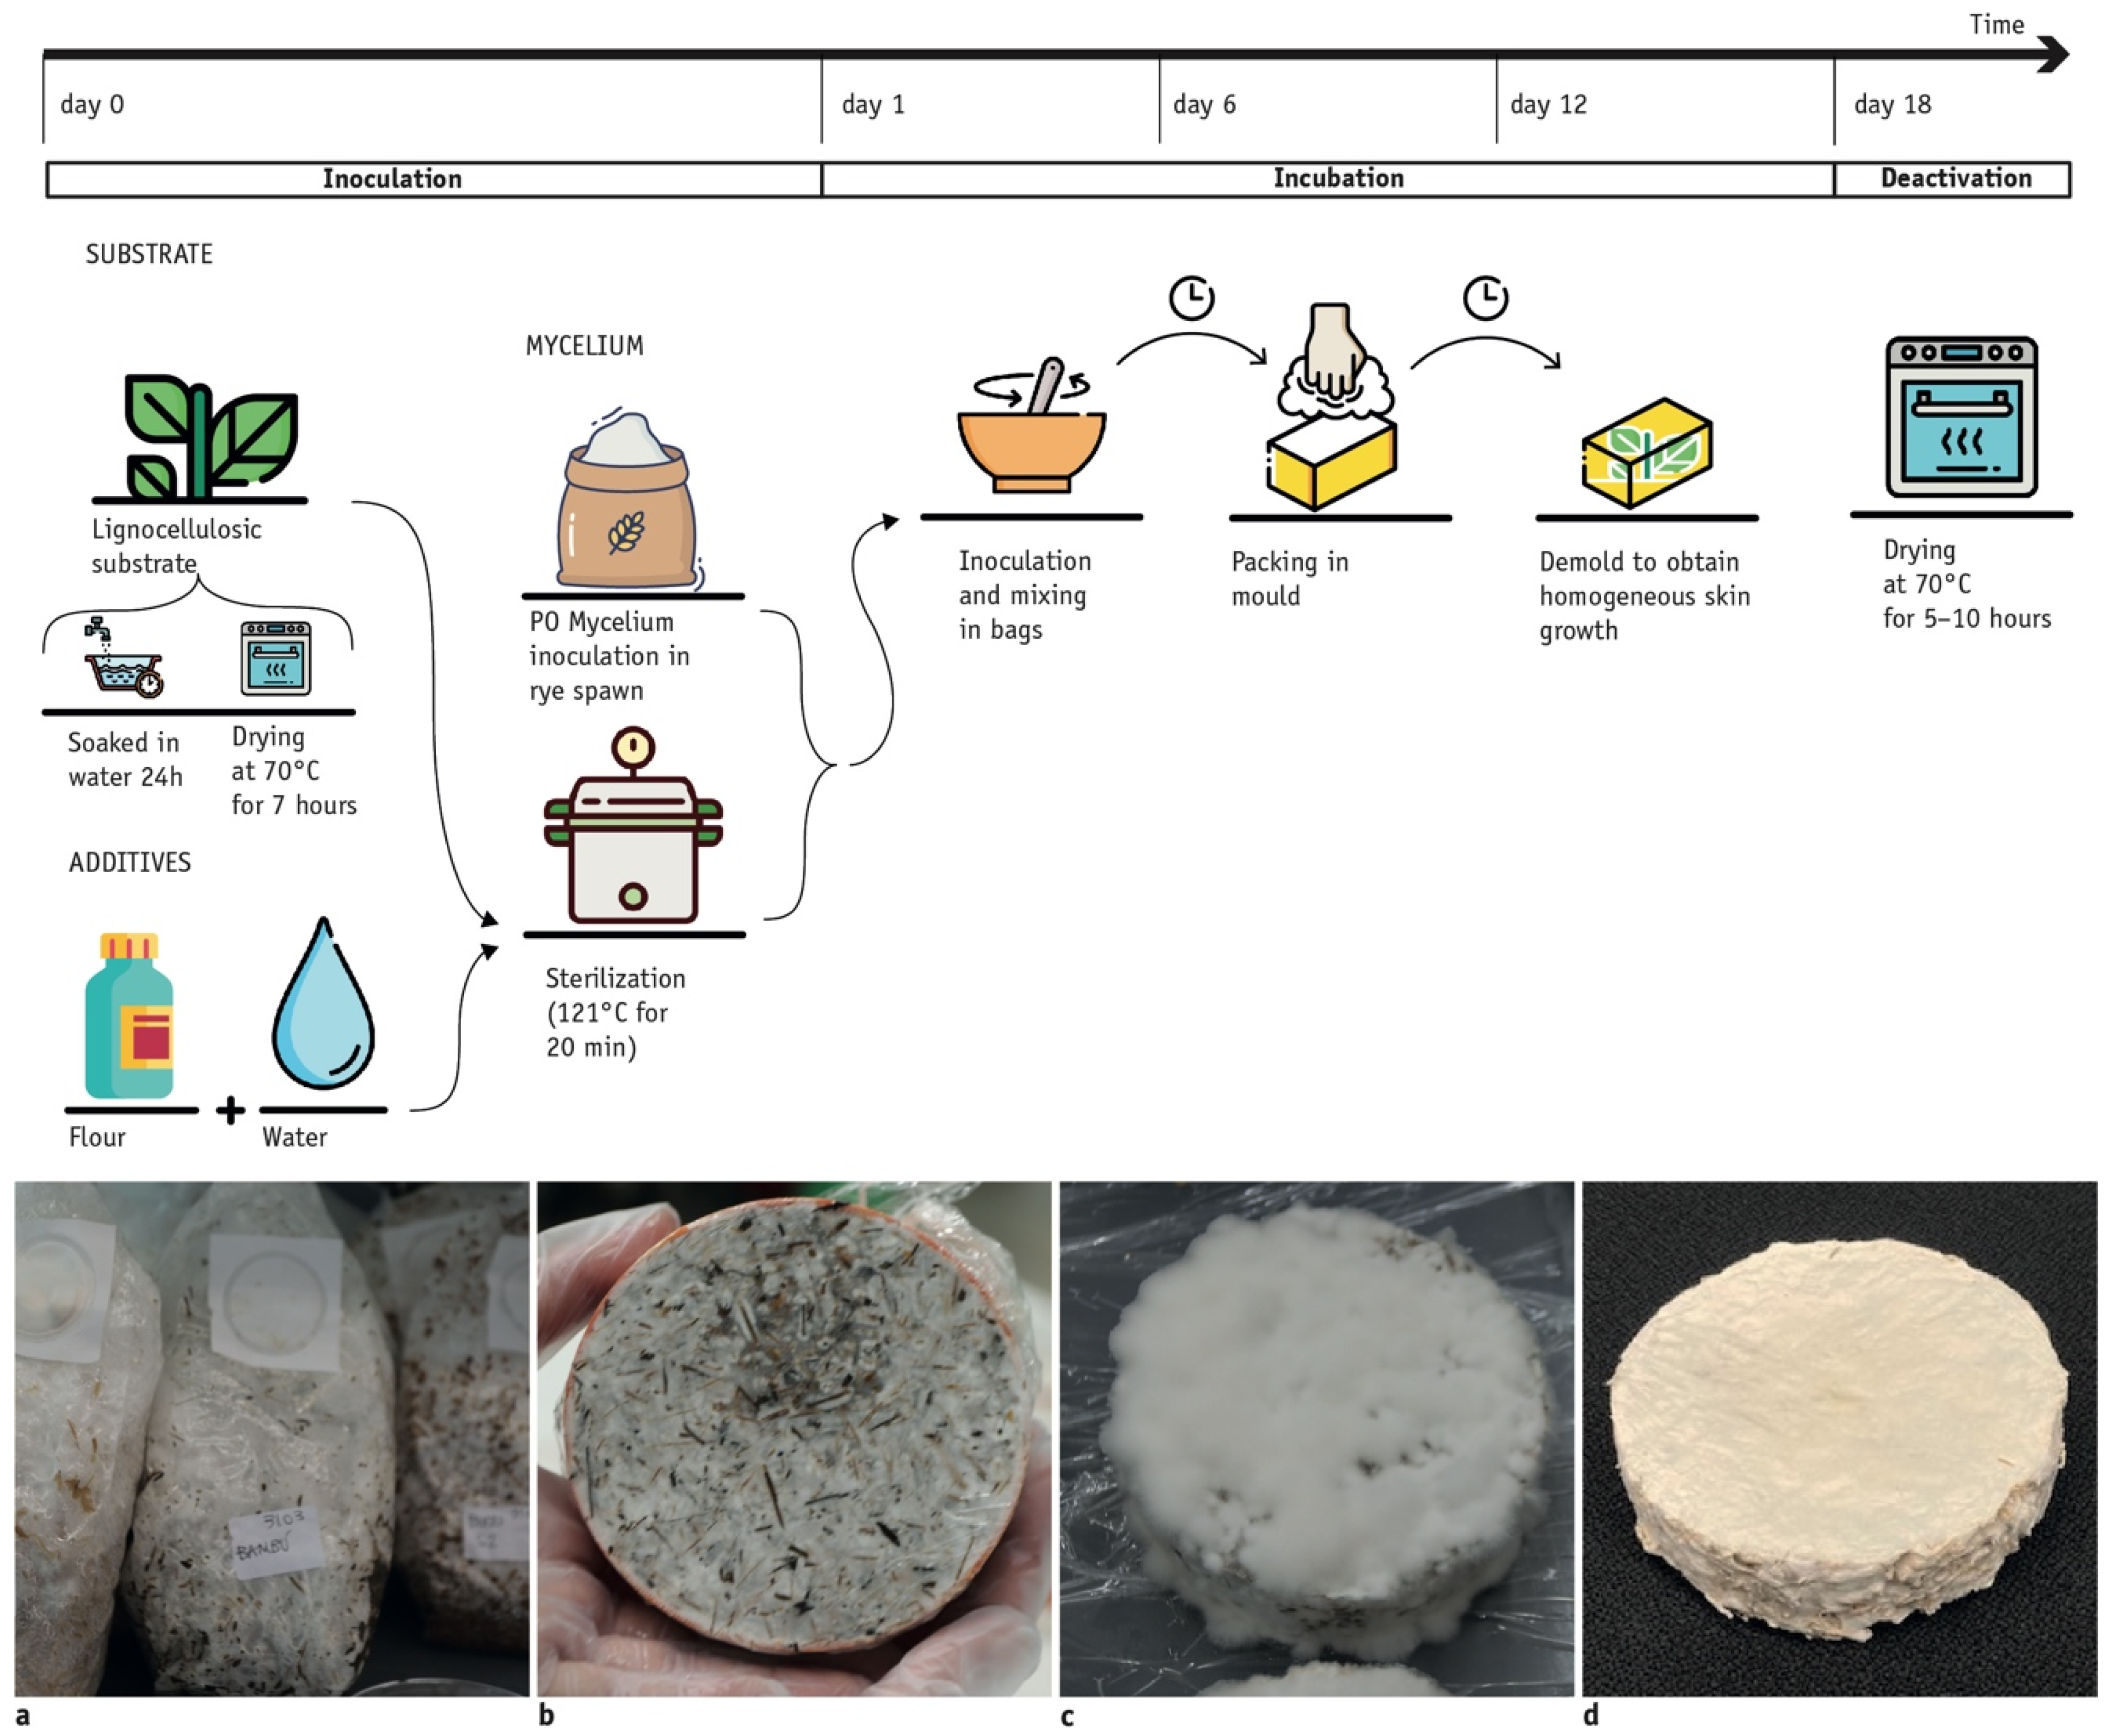
2.3. Bio-Composite Fabrication Protocol

The production process of MycoBamboo can be summarized in three different steps: (i) inoculation, (ii) incubation, and (iii) deactivation. There is no general agreement on the timings and actions of these main three steps [39,40]. Therefore, a specific protocol of growth was proposed at the lab scale, resulting from preliminary experiments, as the state of the art (Figure 3).
In the first step, the lignocellulosic substrate, a mix of bamboo (with particle sizes of 15 mm maximum) was prepared to guarantee the proper fabrication of the final product. Initially, the substrate was soaked in water for 24 h to be hydrated, and then dried for 7 h. Later, the bamboo particles were homogenized in terms of length with a kitchen blender for a duration of 20 s. Once the substrate was properly prepared, it was sterilized to remove the microbial competition of existing bacteria and microorganisms already present in the material. The sterilization was performed in a high-pressure autoclave up to a temperature of 121 °C and a pressure of 100 kPa for a duration of 20 min.
Then, it was possible to proceed with the mycelium inoculation by introducing and dispersing 15 wt.% of fungal biomass into the plastic bags containing the pressurized feedstock. A commercial rye spawn ready-mix with Pleurotus Ostreatus spores was used. The inoculated substrate was stored in a controlled dark environment for the incubation, with a constant temperature of 25 °C and 90% relative humidity. The incubation time depends on different factors, e.g., type of fungi, substrate, shape and size of the sample, application, etc. Here, three different phases were distinguished according to the growth of the mycelium: the first growing period, which took place in the plastic bag for 6 days; the second one, wherein the composite was placed in the mold for an additional 6 days to provide the desired shape to the material; the last phase, wherein the material was removed from the mold for the last 6 days to solidify the outer skin. To shape the samples, a PVC mold was selected with the assumption that it could be reused after a proper sterilization for 25 cycles. Finally, the sample was heat-treated in an electric oven at 70 °C for seven hours to stop the growing process and dehydrate the composite. The thermal conductivity of the dried samples was measured though the Transient Plane Source (TPS) dynamic technique, according to the ISO 22007-2:2015 [41] standard. All processes used in the ecoinvent dataset are reported in Table A1 in Appendix A.

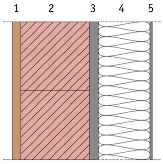
2.4. Application for Retrofitting Existing Building Wall

The MycoBamboo solution assessed at lab scale was finally up-scaled to a building component as a retrofitting solution for existing facades. For this specific application, 1 m2 of renovated façade was assumed as FU, and the context of a southern dry Mediterranean region was selected to investigate the climate mitigation potential. A targeted U-value of 0.5 W/m2K was considered [42] and the solution was compared with other bio-based and non-bio-bases retrofit alternatives. In Figure 4, the methodological steps for the comparison of the reference building wall applications and the outputs are depicted. A masonry wall composed of 20 cm of hollow clay bricks with ETICS was assumed as the representative archetype. Fossil-based and bio-based insulation typologies were assessed here, namely, five bio-based alternatives (straw fibers (STR), cotton stalks (COT), expanded cork (COR), kenaf fibers (KEN), and bamboo particles bonded with mycelium), and another fossil-based one, namely, EPS. With this information, it was possible to calculate the required thickness of the insulation composite to comply with the defined U-value and the related emissions and storage uptake for each layer of the two walls.

2.5. Life Cycle Assesment

2.5.1. System Boundaries and Functional Unit

Life-cycle assessment (LCA) is a well-established methodology for providing a comprehensive analysis of the environmental impacts of a product over its life cycle. In this study, a cradle-to-gate LCA (mod. A1-3) was performed according to EN 15804 and ISO 14067, with the exceptional inclusion of biogenic CO2 emissions to determine the benefit derived from carbon storage and delayed emissions at EoL. Two different functional units were defined for the two systems: 1 circular sample of MycoBamboo with ϕ = 100 mm, h = 30 mm, and 1 m2 of renovated wall with a U-value equal to 0.05 W/m²K. Concerning the cultivation of bamboo, the outputs refer to 1 hectare of cultivated land. The weight of each MycoBamboo sample was around 33 g, with a volumetric mass equal to 229 kg/m3. The boundaries of the system for MycoBamboo production are depicted in Figure 5.

2.5.2. Data Quality

The LCA distinguishes primary and secondary data. Primary data were used for inputs directly linked to bamboo cultivation and laboratory protocol. For the bamboo cultivation, data were sourced from a garden center Onlymoso [35], a farm dealing with the production of bamboo mother plants. For the production of MycoBamboo, data were collected at MaBa.SAPERLab [43]. Secondary data were taken from the ecoinvent dataset, and we referred to the literature for non-represented data.

2.5.3. Allocation Method

The cultivation of bamboo can generate different co-products and by-products. To maximize the environmental benefit, 90% of the yield was assumed to be used for suppling biomass for structural laminated products, while the remaining 10% was considered a by-product that can be chopped and used as a substrate for MycoBamboo production. Bamboo shoot harvesting for the food market was not considered as a business option since the aim of cultivation management is to maximize the carbon storage along the whole value chain. The total annual harvested biomass corresponds to 75 tons for the sixth and seventh years and 100 ton from eighth year on. An additional annual biomass flow of roughly 10 tons at years three, four and five is assumed as a result of thinning, since all removed non-developed culms can be chopped in the field and used to supply the substrate for MycoBamboo production.
According to ISO 14040 [44], a physical relationship should be preferred for impact allocation. However, when a physical relationship cannot be applied, an economic allocation can be used. Since the different co-products have very different market values, in this study, both mass and economic allocation were used. The variability in the co-products’ value is generally very high and difficult to predict. Concerning the bamboo products, economic value was assumed as the allocation driver, namely, 99% of the value for mature bamboo culms and 1% of the value for non-developed culms.

2.5.4. LCI Inventory Assessment

Inputs from bamboo cultivation, in particular fuel consumption during soil preparing and management, were estimated by direct site measurements. Particularly, for each unit process, the use of New Holland machinery (T5000 Tractor series) was considered. Then, depending on the type of equipment used for the required process and the duration of the process, the corresponding fuel consumption was calculated. Specific fuel consumptions for bamboo growing processes are summarized Table 1, while fertilizer consumption and planted seeds are collected in Table 2. All data used to model agriculture processes and the consumption of fertilizers were taken from the ecoinvent dataset. The data used to model transportation can be found in Table A2 in Appendix A.
Since not enough information was available for modeling the small bamboo plants supplied in the field for the planting phase, the direct plantation of the seeds was assumed, as well as the supply of plastic vases for transportation. The amount of seeds needed was assumed to be 50 kg per hectare of field. The water requirement for the bamboo plants varies during the life cycle of the plantation. In the first seven years, during maturation, it is around 1500 m3/ha. Then, from the eighth year, the required amount drops to around 750 m3/ha. These values were directly collected on site and are highly sensitive to monthly rainfall rates. A drip irrigation system was assumed with an average flow rate of 4 l l/h. Assuming 1200 plants per hectare, an average capacity of 4.8 m3/ha per hour was obtained. Depending on the dimension of the field and the sector that needs to be irrigated, a pump with a minimum power of 1 hp is needed. In this case, a pump with an average value of 4 hp (2.94 kW) was considered.
The energy consumption of the processes carried out in the laboratory was directly measured though an electricity meter. The resulting energy consumption and the duration of each unit process, as well as the reference quantity of material processed with such energy usage, are summarized in Table 3. Moreover, two hypotheses of energy sources were validated to estimate the sensitivity of the carbon footprint according to the type of energy used: (i) electricity fully supplied by the grid based on the IT energy mix, and (ii) electricity from 100% onsite renewable production.

2.5.5. Assessment Method for Carbon Footprint and Biogenic Carbon Accounting

The Net-GWP of construction materials is assumed as the sum of the GWP at 100 years, calculated according to the IPCC 2013 method, and the related GWP from biogenic CO2 emissions (GWPbio index) at the EoL of MycoBamboo, calculated though a dLCA for a fixed storage period (30 or 60 years), a rotation period of 6 years, and a horizon time of 100 years, according to Guest et al. [45].
The CO2 storage of this novel bio-based insulation composite was determined according to the following Equation (1):
CO 2 , s t o r a g e = ρ 0 · C C · B C · 3.67   [ kg   CO 2 / kg ]
where:
-
ρ0 is the dry density of the material in kg/m3, namely, 229 kg/m3;
-
CC is the carbon content of the bamboo particles, namely, 54% [9];
-
BC is the biomass content of the finished composite, which corresponds to 100%;
-
3.67 is the molar weight ratio between CO2 and C [11].
Besides the quantification of the CO2 content, it was also necessary to consider the biogenic CO2 emissions under the EoL scenario according to the different waste treatments. The CO2 emissions due to the selected waste treatments should be determined and included as input in the dynamic LCA model. As a matter of fact, three different EoL scenarios were first considered, namely, incineration, sanitary landfill, and anaerobic composting (Figure 6). Since waste treatment with sanitary landfill and incineration in the EU should be avoided [46,47,48], these options were discarded, and only anaerobic digestion with biogas production was taken into account.
To define the amount of biogenic CO2 emitted in the air during the anaerobic composting of MycoBamboo, the methane production of straw was taken as a reference [49] to determine the flow direction of the organic carbon in the anaerobic bio-conversion process. In this case, a high percentage of carbon (41.4%) is usually fully converted or degraded into inorganic carbon. In addition, most carbon is converted to CO2 and HCO3 (32.8%), followed by methane (18.6%), which is captured by a collecting infrastructure and its direct emission is avoided. These corresponding GHG emissions were first allocated to 1 sample and then converted to 1 kg of product. With the data collected for the CO2 storage and biogenic CO2 emissions at EoL, a specific GWPbio index for MycoBamboo was computed though the “DynCO2” calculation tool [50]. Time-dependent CO2 pulses are reported in Table A3 in Appendix A. The storage period for the calculation was assumed to be equal to the product’s service life. In this case, two values of reference service life were assumed for a typical installation of bio-based materials as ETICS, namely, 30 years [51] and 60 years [52].

3. Results

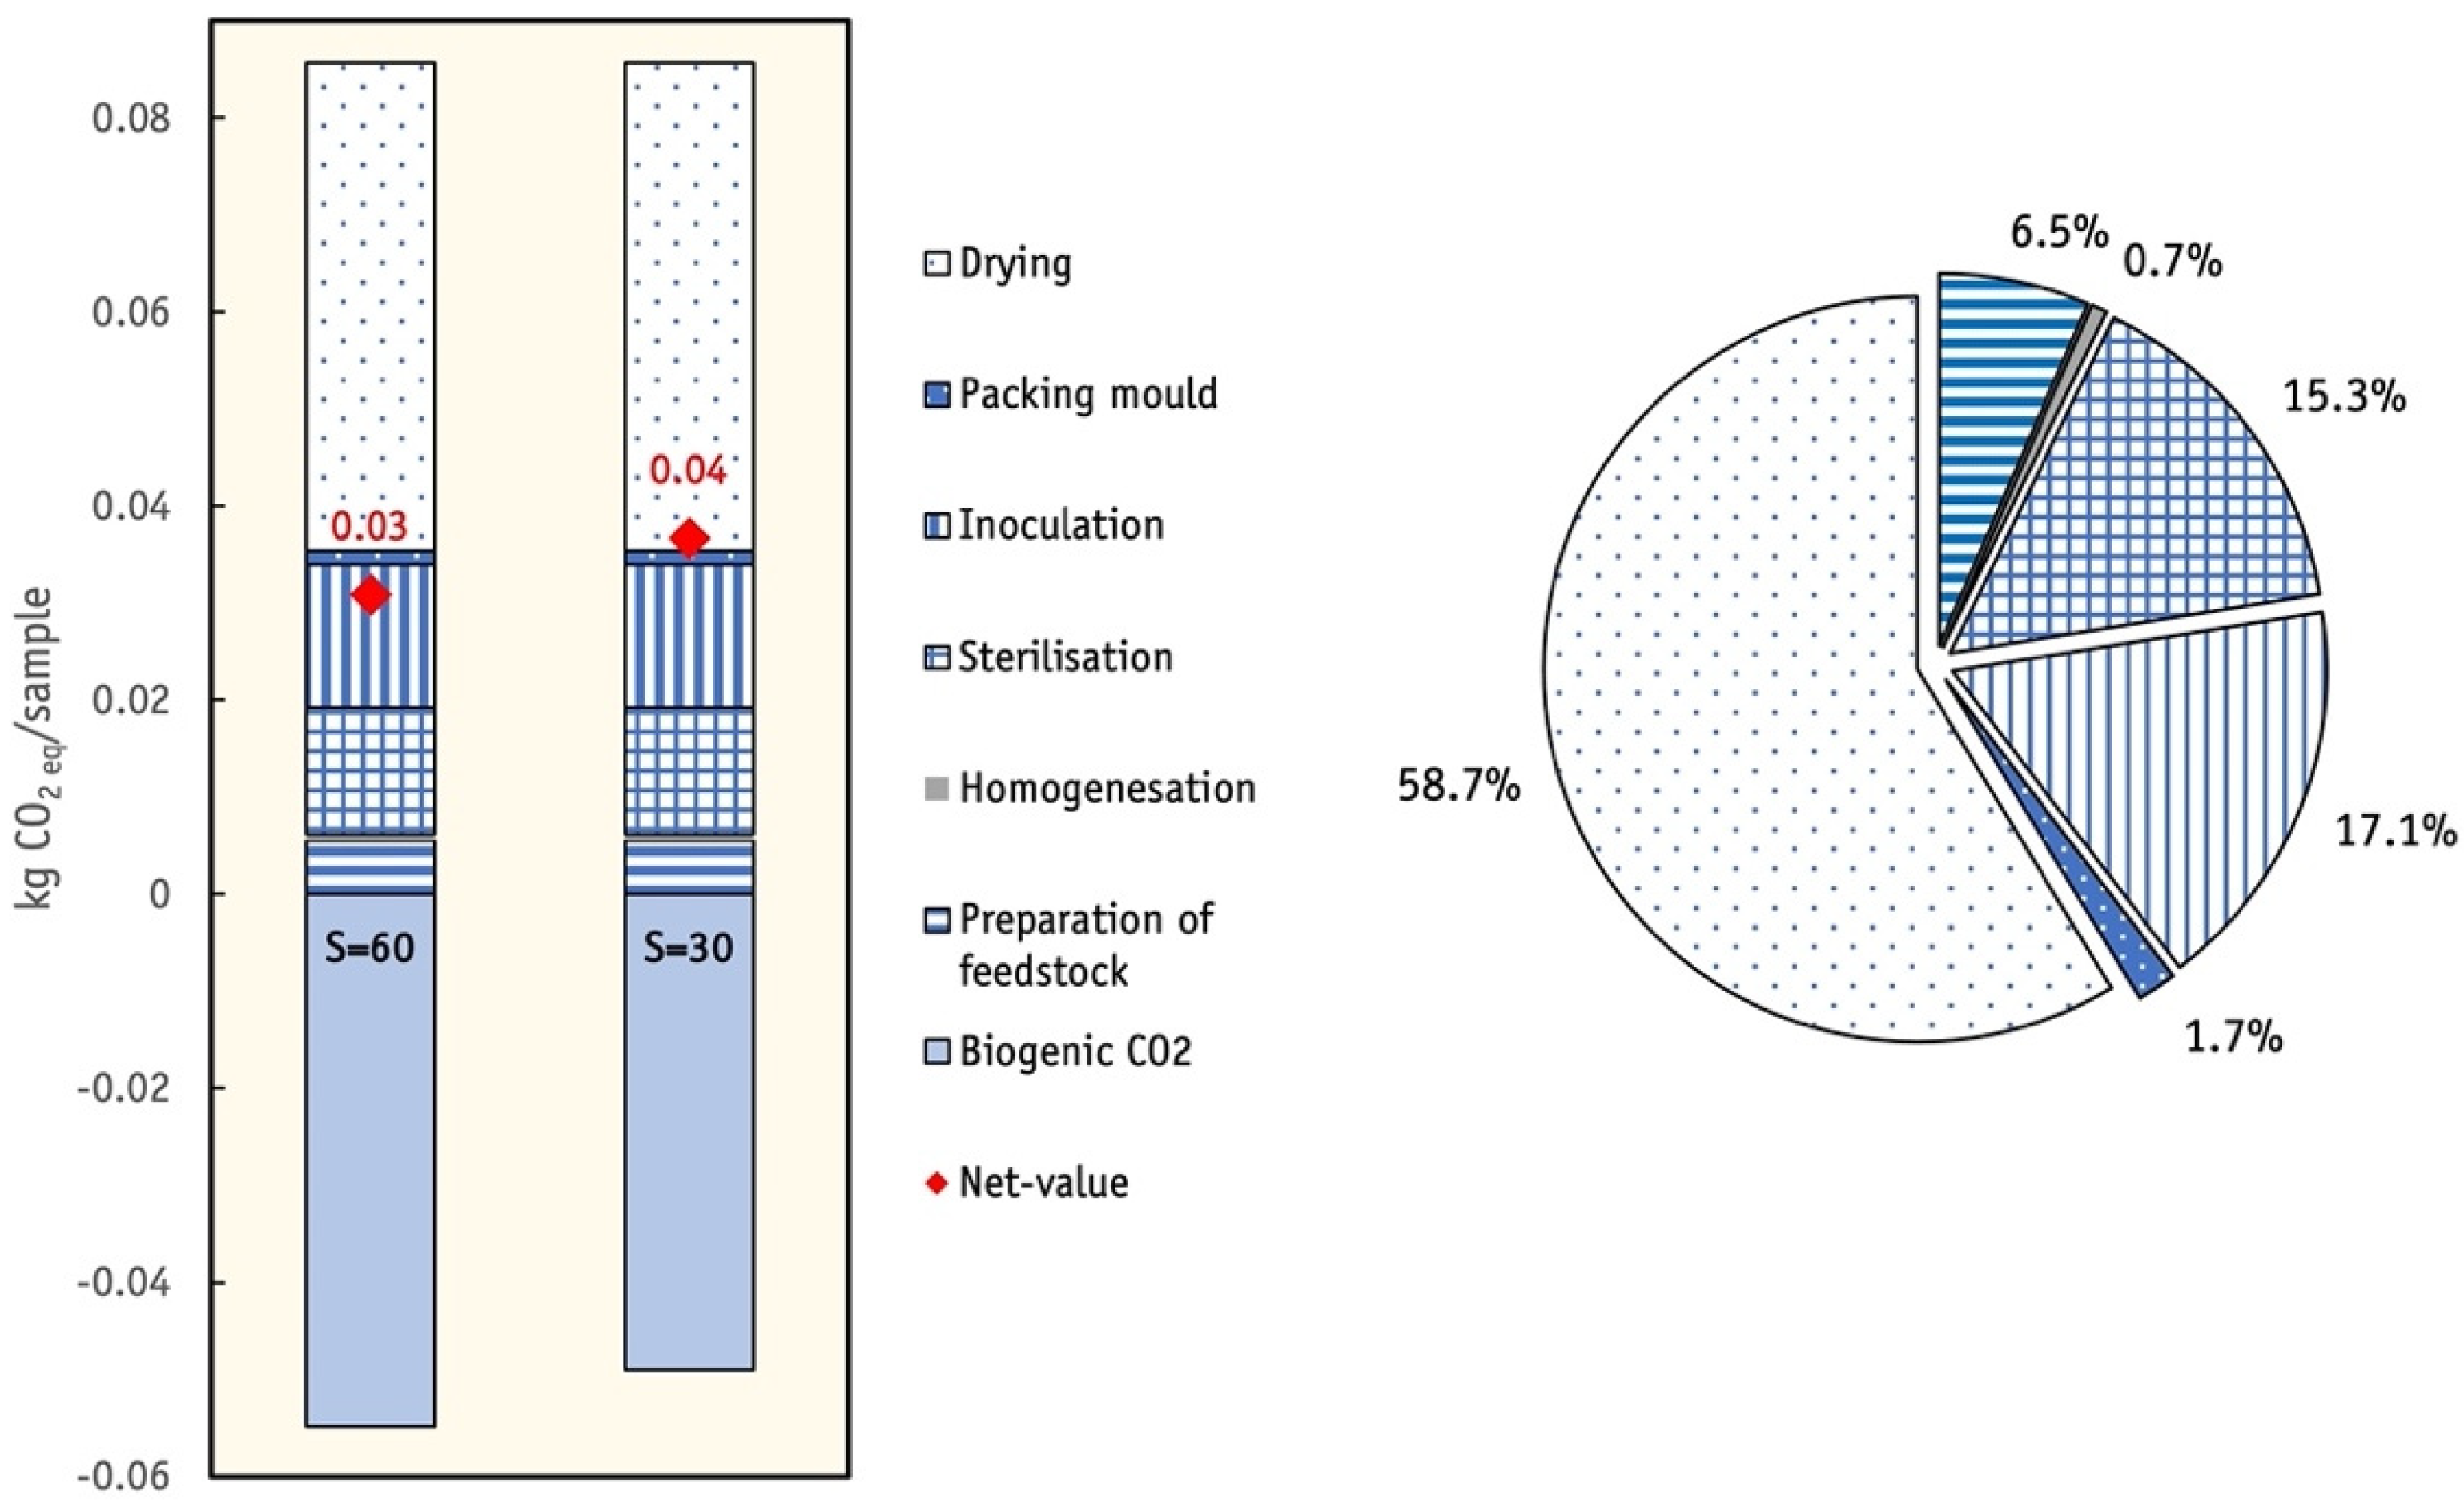
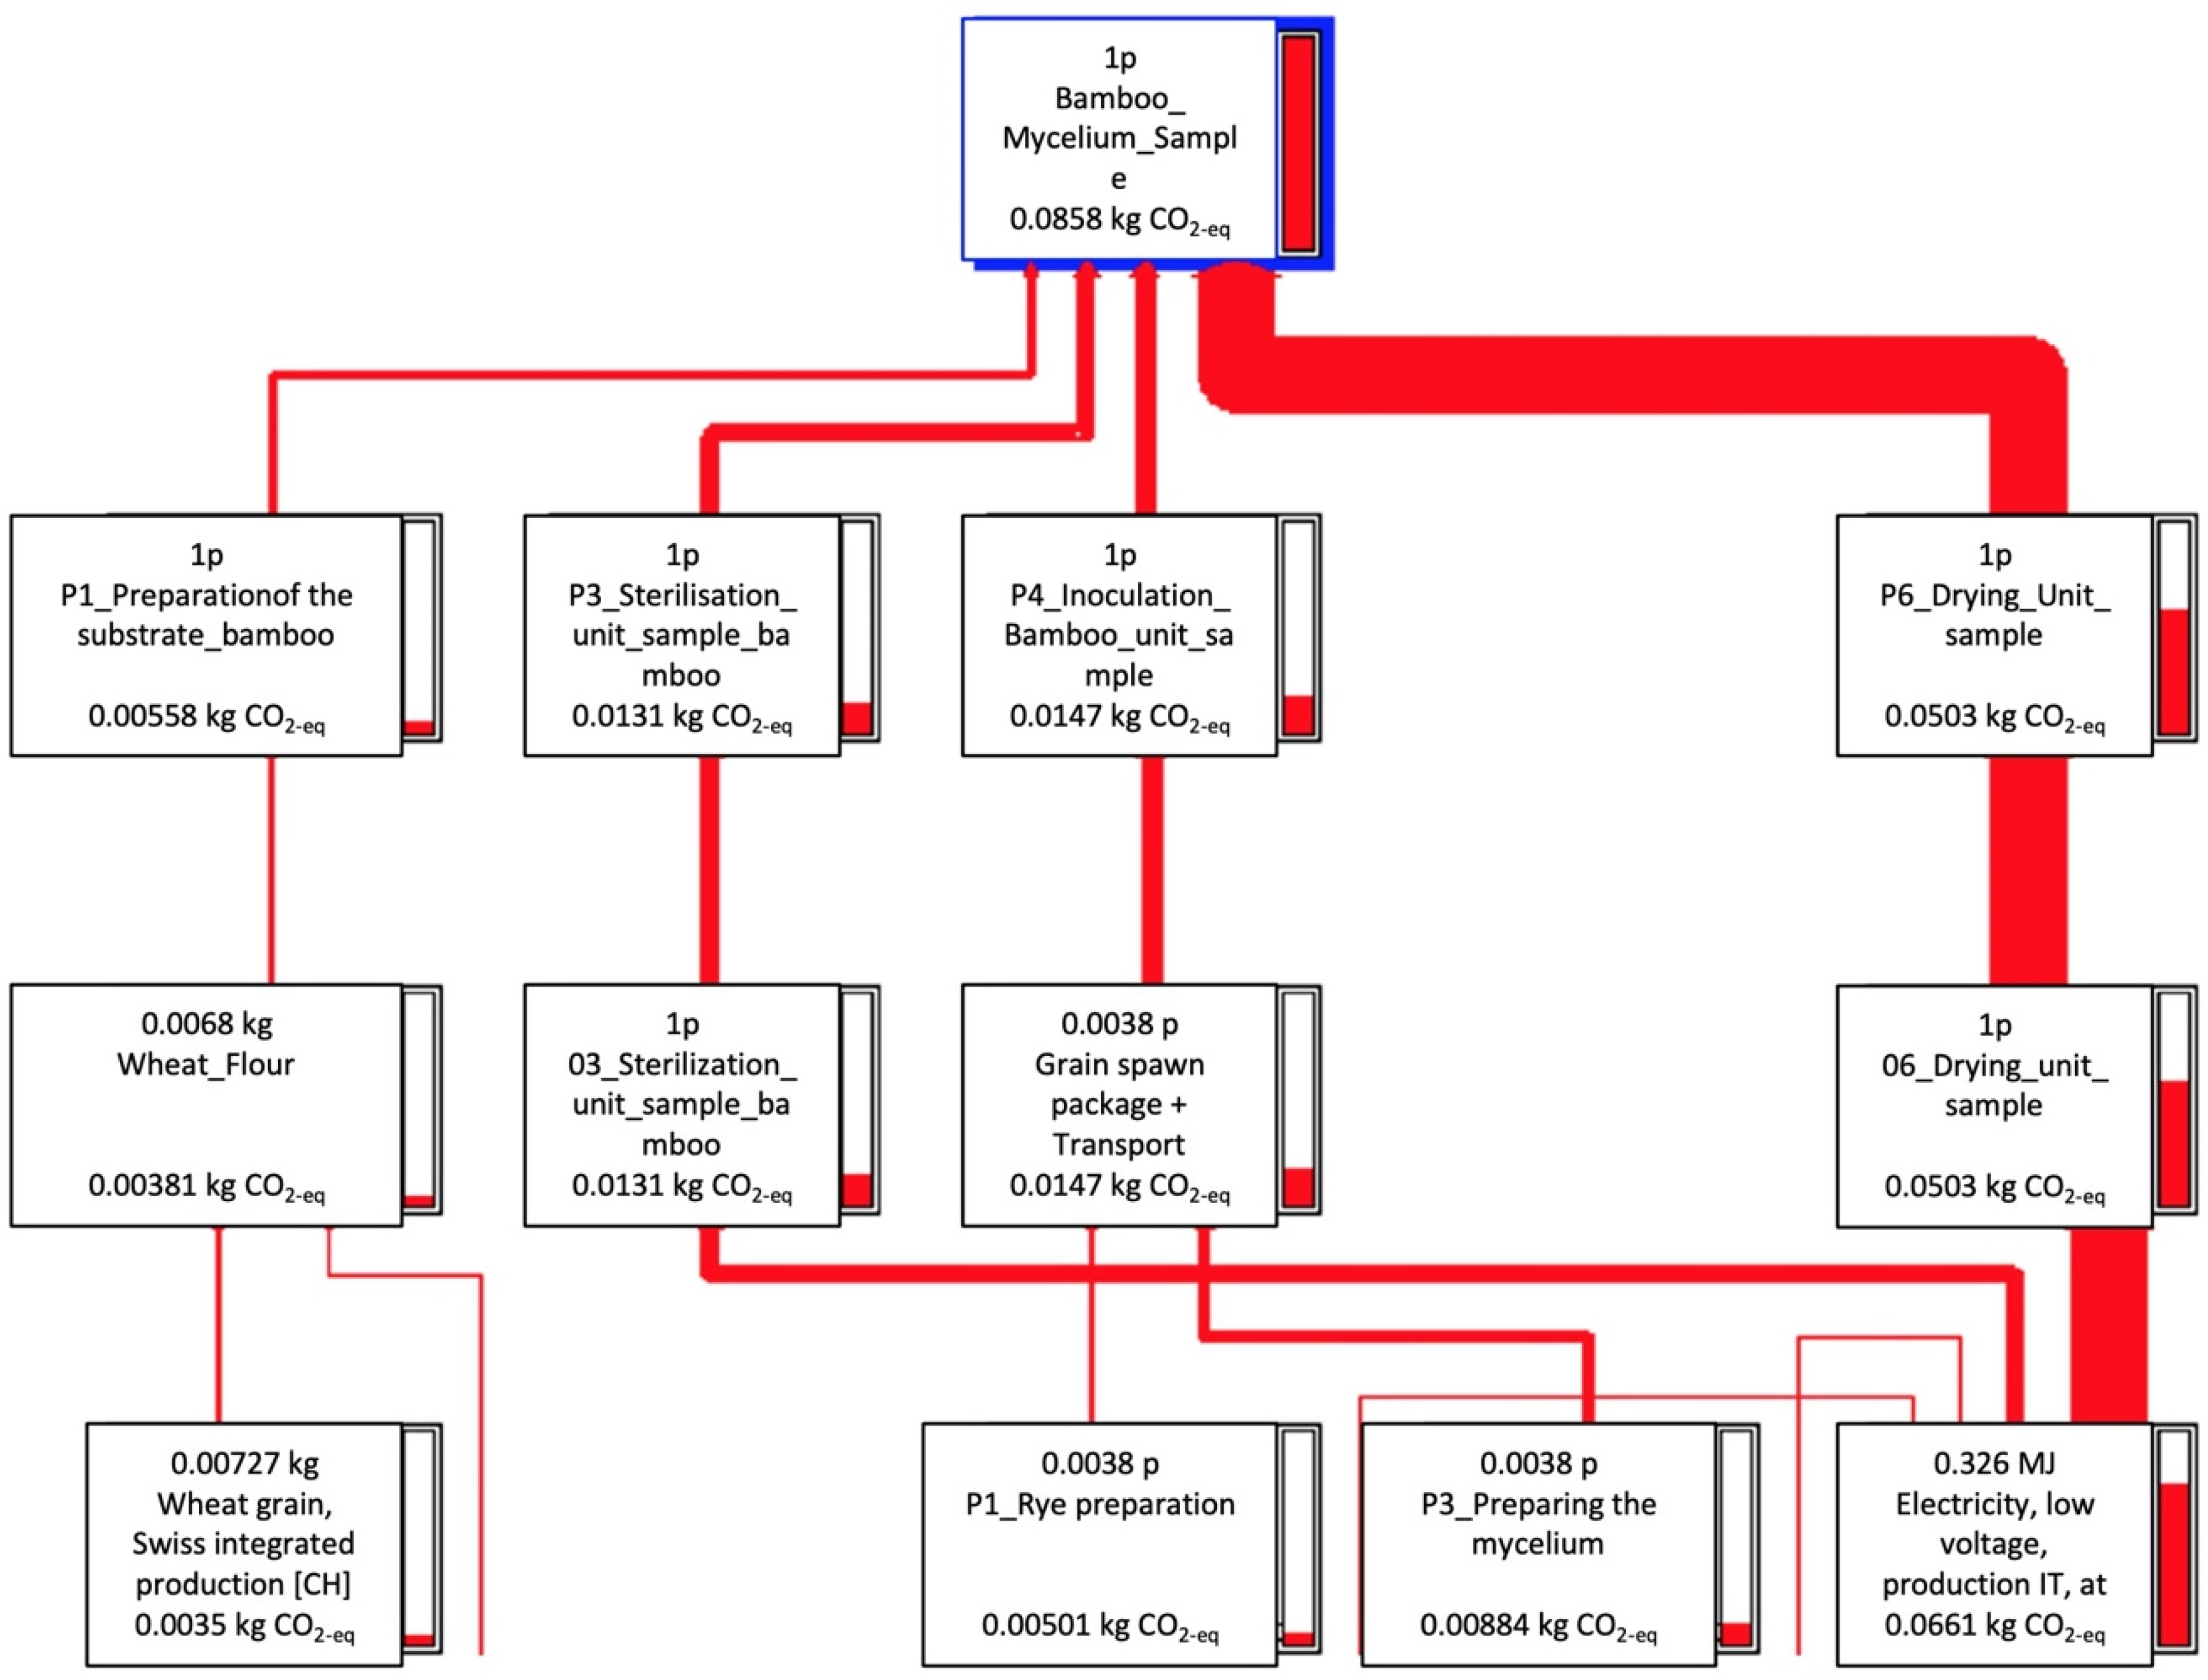
3.1. Carbon Footprint of One Sample of MycoBamboo

The results of the carbon footprint calculation were evaluated for the two alternative storage periods—30 years vs 60 years—according to the EoL scenario assumed. GWPbio is included as “Biogenic CO2” by assuming that the same amount of carbon stored in the bamboo particles used for MycoBamboo processing is regenerated within seven years after production in the bamboo plantation.
In the column chart of Figure 7, the resulting GWPs for the two reference service lives are compared. Despite the negative GWP values for biogenic CO2, 54 and 49 gCO2-eq/sample for the two reference scenarios, respectively, the resulting Net-GWP in both cases is positive, at respectively 30 and 36 gCO2-eq/sample with storage for 60 and 30 years. The GWP balance is negatively affected by laboratory-scale processes, which, contrarily to up-scaled industrial production, are not optimized to reduce electricity overloads.
In the pie chart of Figure 7, a detailed comparison of the incidence of each process for one MycoBamboo sample is shown. Drying is the process with the highest effect on GWP, at nearly 60% of the total, due to the high energy intensity of the oven and the duration of the deactivation process of mycelium. Inoculation affects the GWP process to the second highest degree (17%), wherein the production of the grain spawn plays an important role. The use of the autoclave for 20 min for the sterilization of the feedstock has a non-negligible impact on the GWP, with an incidence of around 15%. All other processes have a marginal influence, including feedstock preparation, where cultivation processes are considered for the substrate needed. A network flow representation of the process contributing to GWP is reported in Figure A1 in Appendix A.

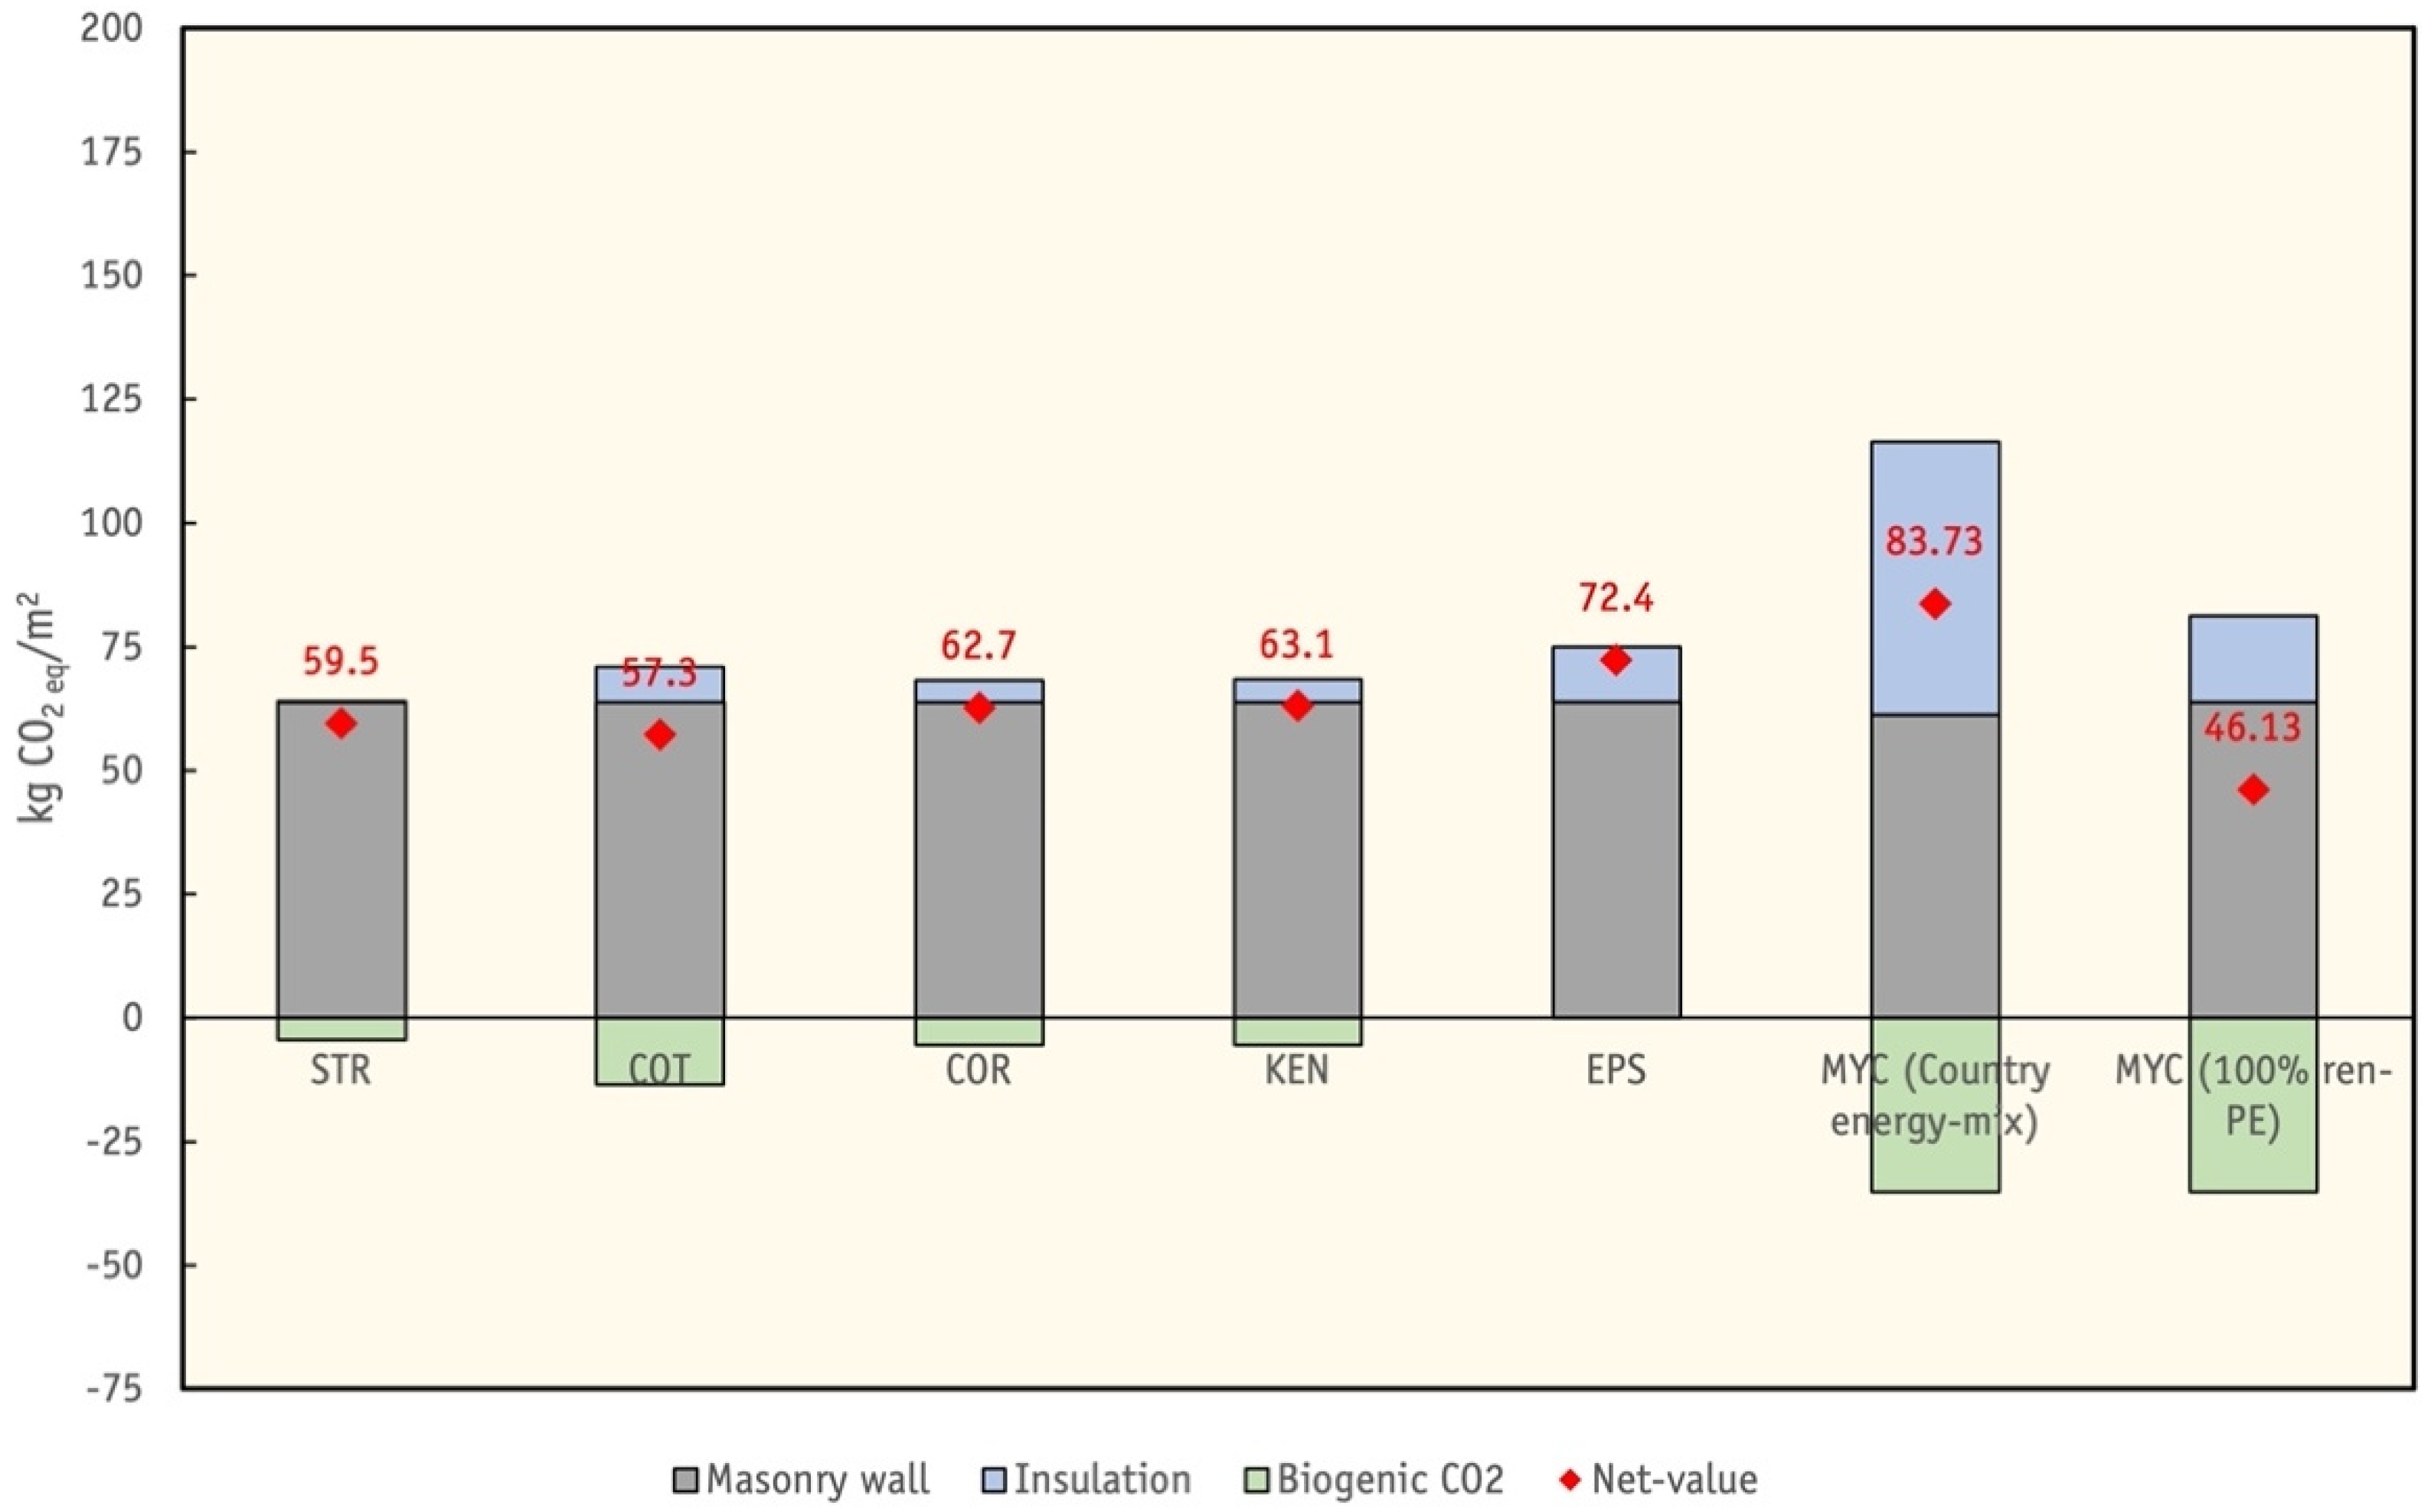
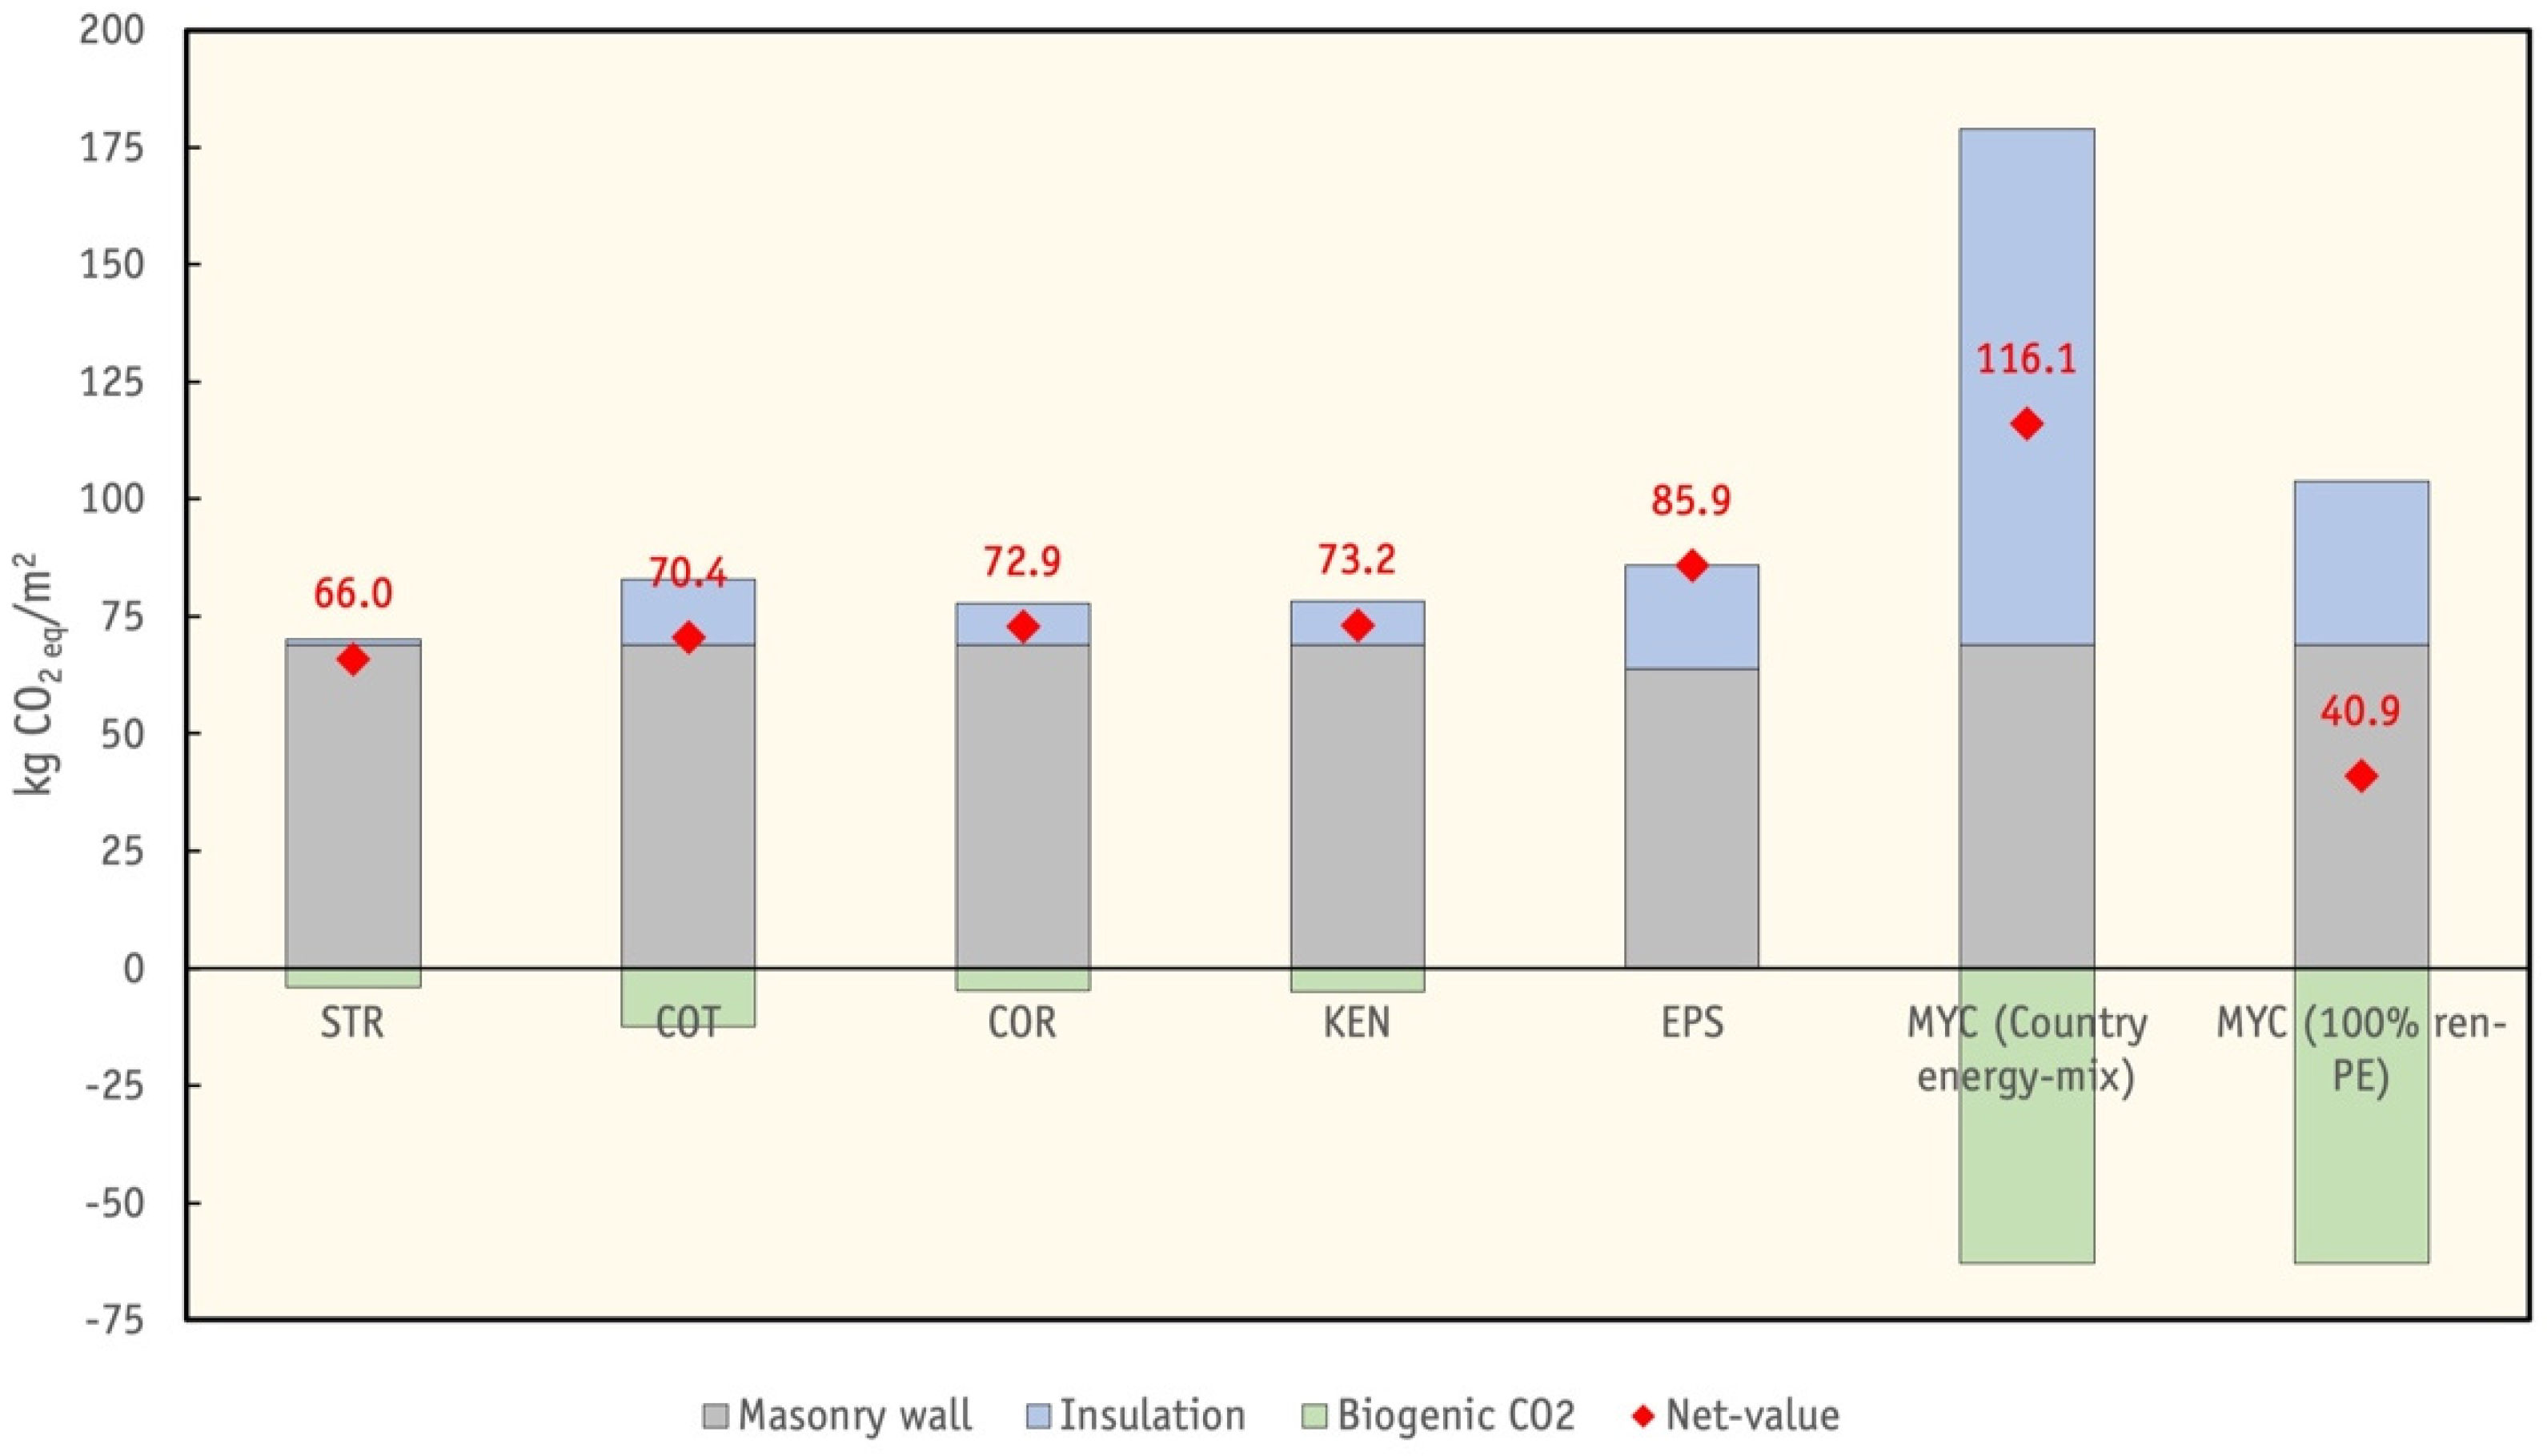
3.2. Carbon Footprint of 1 m2 of Renovated Wall

In this paragraph, the resulting GWPs of the building wall application are presented. In Table 4, the insulation thicknesses for six different categories of insulation used as ETICS, both bio-based and non-bio-based, are reported to comply with the targeted U-value for renovated walls in southern dry regions. The required thickness for the bio-composites is 9 cm for MycoBamboo (MYC), while a range between 5 and 6 cm is requested for alternative bio-based solutions, namely, straw (STR), cotton stalks (COT), expanded cork (COR) and kenaf (KEN), and 5 cm is required for expanded polystyrene (EPS). The resulting amount of material per m2 is much larger than with other bio-based alternatives, since the thermal conductivity measured on laboratory-scale samples is slightly higher than that of the alternatives.
The Net-GWP for each alternative solution, calculated for a storage period of 60 years (S = 60 years), is depicted in Figure 8, with the two alternative hypotheses for MycoBamboo regarding the electricity source. The achieved results show that when up-scaling the process from laboratory- to building component-scale, with electricity provided by the national grid, MycoBamboo accounted for a slightly higher GWP compared with other alternatives. Even if the high carbon storage contributes to a negative GWP, which is nearly 2.6 times that of COT due to the high volumetric mass and the extra material needed to provide the same U-value, it is not sufficient to compensate for the high fossil-driven GWP. Under these assumptions, the most promising bio-based alternative is COT, which accounted for a Net-GWP 32% lower than MYC. Contrarily, when the electricity is provided by a 100% renewable source, the fossil-driven GWP of MYC can be reduced by 45%, which is 20% lower than COT and 36% lower than EPS.
If a technical replacement of the ETICS after 30 years (S = 30) is considered for each alternative (Figure 9), with the substitution of the thermal insulation and the exterior mineral render, the incremental difference between the Net-GWP of MYC and its alternatives tends to increase compared to the first scenario with S = 60. Under this scenario, STR is the solution with the lowest Net-GWP due to its very low GHG emissions during manufacturing, which are 43% lower than those of MYC. Additionally, in this case, if a 100% renewable electricity source is considered, MYC achieves the lowest Net-GWP, with a reduction of 64% compared to the current option using an energy mix.

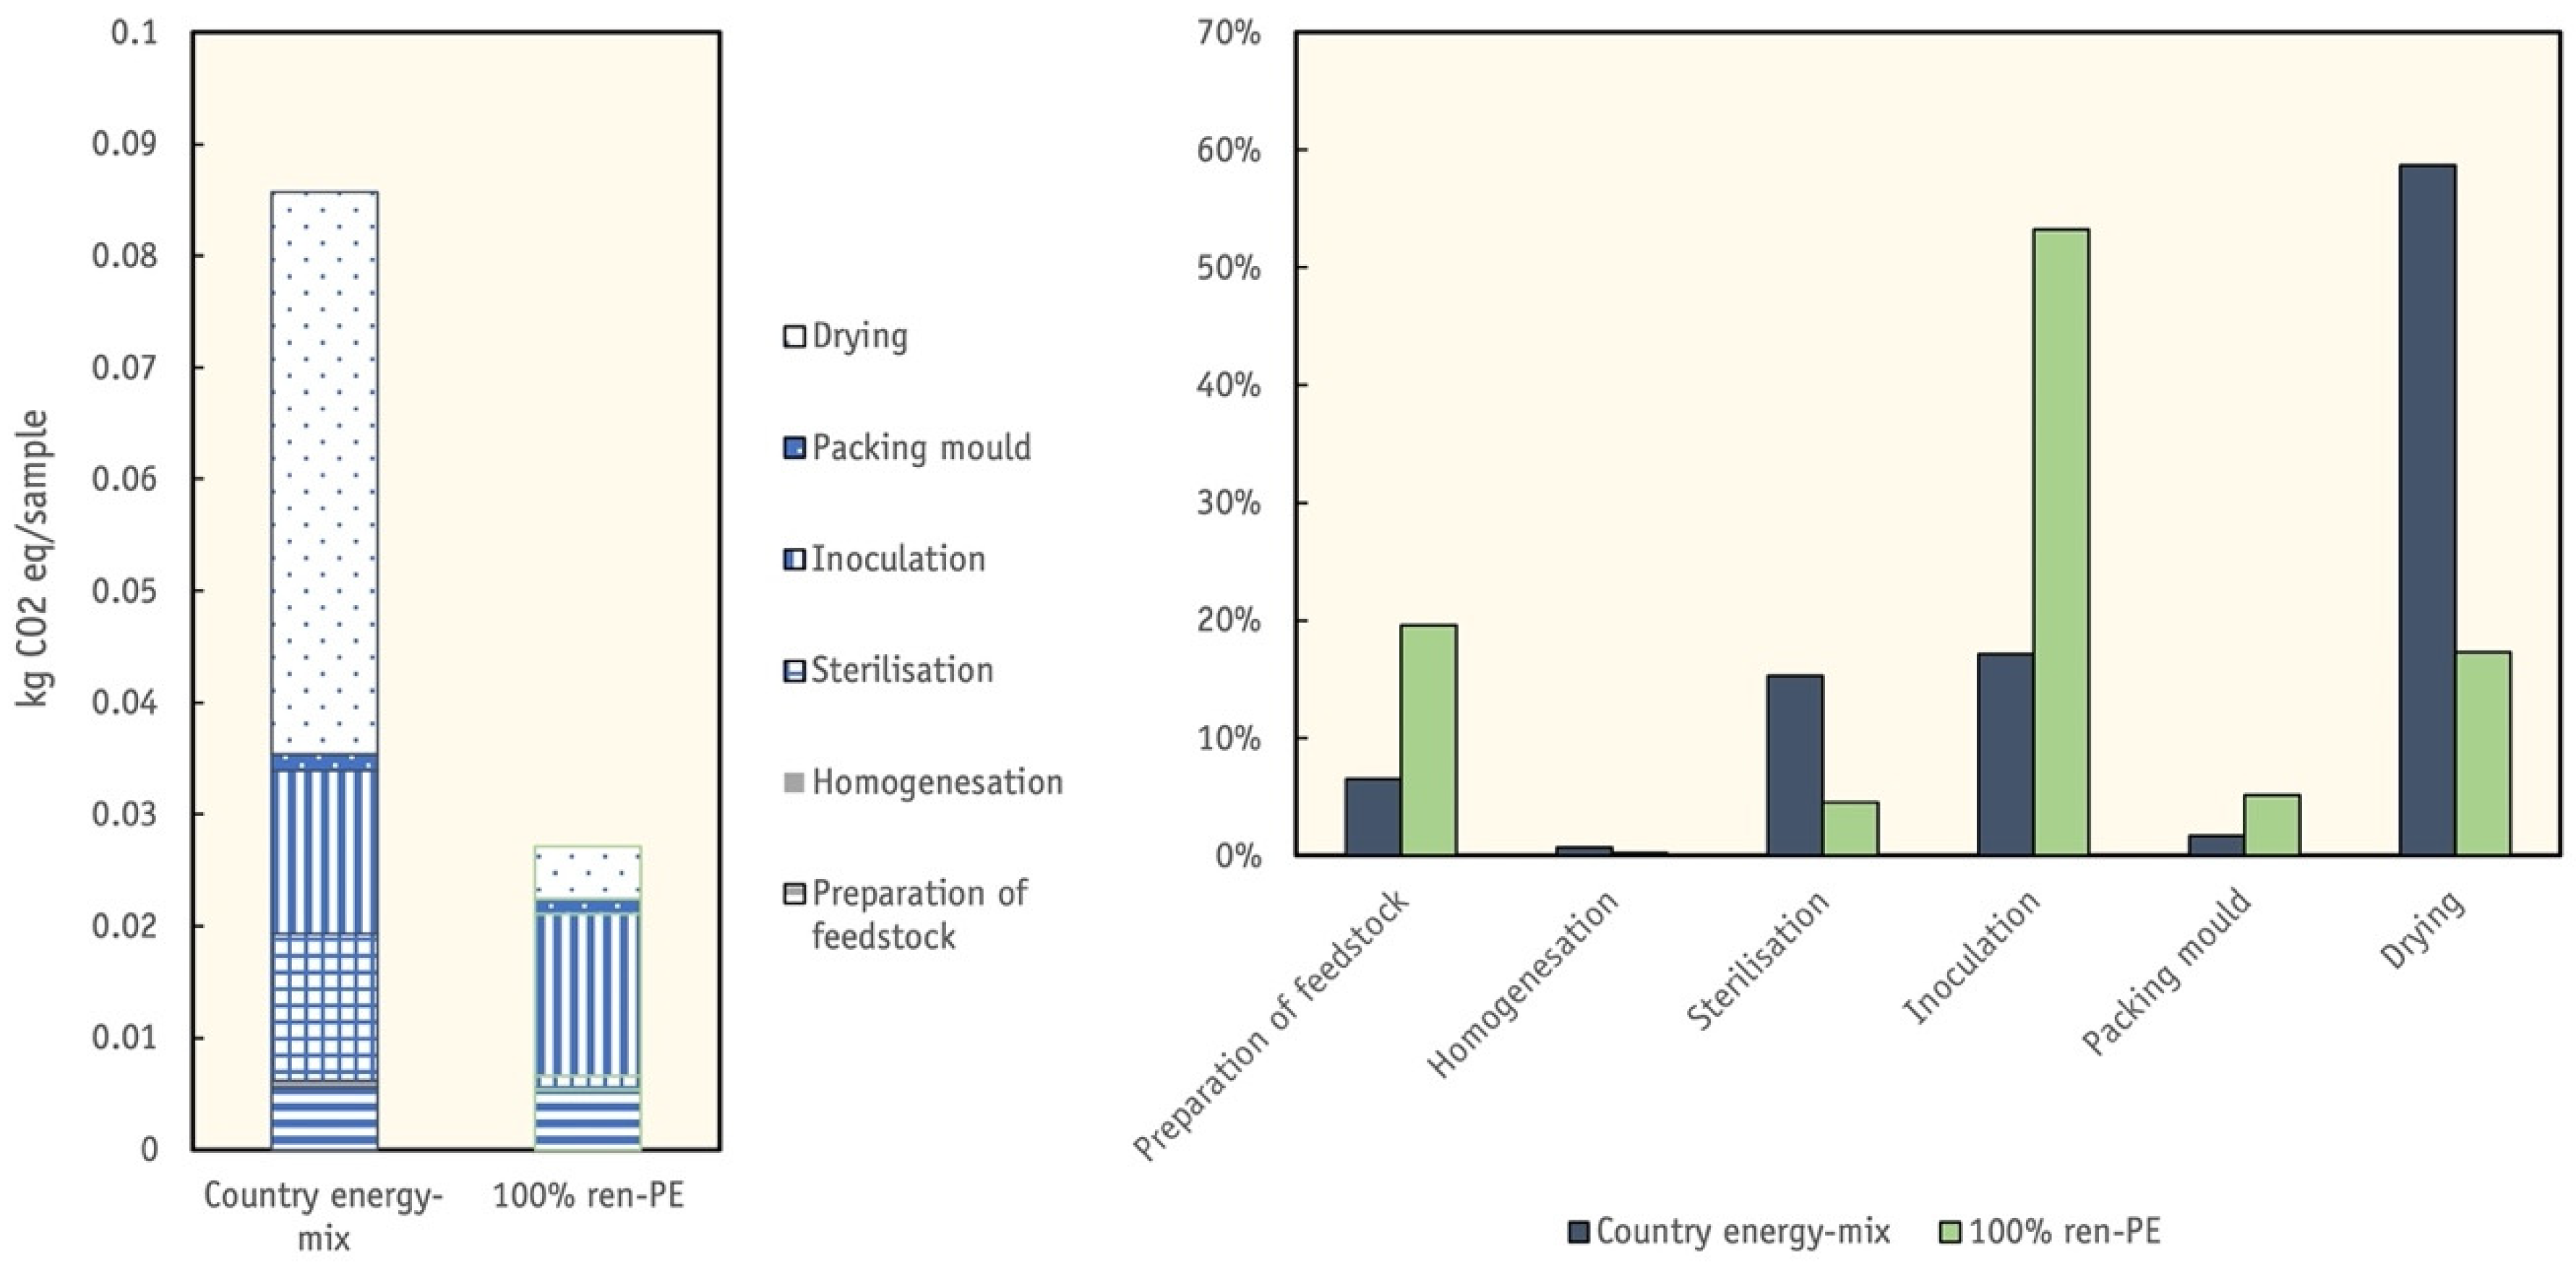
3.3. Processes Incidence and Alternative Energy Scenarios

The production of a sample of MycoBamboo contributes 86 gCO2-eq of emissions, which is mostly caused by the drying process (Figure 10). The deactivation of the fungus is the most energy-intensive activity, since it requires the continuous use of an electric oven over 7 h at 70 °C, with a consequential contribution of 58% to the total carbon emissions, which corresponds to 50 gCO2-eq. The other two processes that require the use of electric energy are sterilization and homogenization, which have a lower impact due to the minimal duration of the activities.
Figure 10 shows a comparison between the two electricity scenarios, IT energy mix and 100% renewable PE. When a fully renewable energy source is applied for electricity supply, the overall GWP per sample is three-fold lower than in the IT energy mix scenario, which corresponds to a total GWP of 27 kgCO2-eq. In this case, the most carbon-intensive processes are inoculation, with a 53% contribution, and the preparation of the feedstock, with a 20% contribution, while the deactivation drops with a contribution equal to 17%, which corresponds to 4.6 gCO2-eq. Therefore, for the sustainable development of the novel MycoBamboo under industrial up-scale, the energy source plays an important role in the mitigation of climate change.

4. Discussion

This study has investigated the carbon footprint of MycoBamboo, a novel product that can be used to insulate buildings. Considering the lack of information in the literature about the sustainability of mycelium composites, the analysis carried out at the laboratory scale allowed us to investigate the carbon emissions of the different production stages and determine the field of improvement for future carbon saving. However, as shown in the results section, the LCA performed at the laboratory scale for one sample may not be representative of large-scale industrial implementation for the manufacturing of building components. In fact, the use of energy, as well as the transportation of materials and equipment, is not optimized at laboratory scale, and the carbon emissions caused by material processing can be drastically reduced at industrial scale. However, in the results obtained, MycoBamboo showed relatively low carbon emissions compared to alternative bio-based insulation solutions due to its high content of biological wastes and the lack of synthetic binders. Even if the substrate has a low effect on the total carbon emissions, by using bamboo as a substrate, it can store a large amount of biogenic carbon and valorize agricultural wastes according to the principles of the circular economy. Despite these very promising and encouraging results, there are still some aspects that need to be further investigated, since they may affect the carbon footprint of the product at a large scale. In particular, the EoL requires additional investigation. For this study, the lignocellulose content was assumed from the literature to be identical to that of straw. However, a direct measurement would provide the actual carbon content in the product, and consequently the emissions at the EoL. Moreover, alternative solutions employed to reduce the energy intensity of drying are required, as its contribution to carbon emission is relevant when the current country-wide energy mix is considered for electricity supply. Besides the use of renewable energy, which share is assumed to drastically increase in the next few decades in EU, alternative low-energy technologies to quickly deactivate fungal growth are needed over the transition period until domestic electricity can become fully carbon-free. Lastly, fire safety should be further examined to understand the necessity of adding (or not) fire retardants/coatings, or of developing design strategies [17]. However, fire resistance is one of the main issues that is preventing the application of bio-based materials in ETICS or ventilated facades for multi-story buildings [53].

5. Conclusions

The lack of information on already-industrialized products led this investigation to assess the carbon footprint of the novel MycoBamboo composite fabricated at the laboratory scale. The focus of the analysis provides different levels of insight, from the carbon storage potential and the effects of the origin of the electricity used in the process, up to a comparison with alternative insulation solutions.
The findings demonstrate that:
  • Despite the negative GWP values of biogenic CO2—respectively, 54 and 49 gCO2-eq/sample for the two reference scenarios—the final Net-GWP is positive for both replacement scenarios—respectively 30 and 36 gCO2-eq/sample—for storage for 60 and 30 years;
  • the technical replacement scenarios have an influence on the final Net-GWP values, and a longer storage period should be preferred to more frequent insulation substitutions to maximize carbon sequestration in building facades;
  • even if laboratory-scale processes are not optimized to reduce electricity overloads, contrarily to an up-scaled industrial production, this work provides useful insight into the carbon emissions of the different production stages, and determines the sphere of influence for future carbon saving;
  • to achieve the targeted U-value for renovated walls in southern dry regions, the thicknesses required for MycoBamboo are higher (9 cm) with respect to alternative bio-based and non-bio-based solution, which range from 5 to 6 cm;
  • to compete with alternative insulation solutions and for a sustainable industrial up-scaling of the novel MycoBamboo material, the energy source and the deactivation strategy play important roles in lowering the Net-GWP values;
  • future studies should be focused on creating a specific EoL for these bio-composites, finding alternative drying solutions and addressing the fire safety requirements.

Author Contributions

Conceptualization, F.P. and O.B.C.; methodology, P.M.; software, P.M.; validation, G.H., F.P., I.P. and S.C.; formal analysis, G.H.; investigation, P.M.; resources, I.P.; data curation, P.M.; writing—original draft preparation, O.B.C.; writing—review and editing, F.P.; visualization, O.B.C.; supervision, G.H.; project administration, F.P. All authors have read and agreed to the published version of the manuscript.

Funding

This research received no external funding.

Institutional Review Board Statement

Not applicable.

Informed Consent Statement

Not applicable.

Acknowledgments

The authors would like to thank the Consorzio Bambù Italia soc. consortile a.r.l. and OnlyMoso for the technical support provided for data collection and knowledge on bamboo cultivation processes. Particular gratitude is expressed to Fabrizio Pecci, CEO of the consortium, and Damiano Pagnini for the constant support during the project development and laboratory activities. Moreover, we want to acknowledge the master’s students of Politecnico di Milano Luca Ficarelli and Marco Lenzi for their precious contribution during the mycelium fabrication protocol definition stage.

Conflicts of Interest

The authors declare no conflict of interest.

Appendix A

Table A1. Ecoinvent processes used for the GWP calculation of each material in the SimaPro software.
ProcessMaterial and FuelsEnergy ConsumptionNatural ResourcesAmountUnit
Bamboo Cultivation for ha and 100 Years
Ploughing 1ha
Tractor 1.55kg
Agricultural machinery 2.16kg
Shed 0.00801kg
Diesel 73.13kg
Harrowing 1ha
Tractor 0.617kg
Agricultural machinery 3.29kg
Shed 0.0053kg
Diesel 43.79kg
Fertilizing 1ha
Tractor 0.687kg
Agricultural machinery 0.241kg
Shed 0.00171kg
Diesel 136.32kg
Ammonium nitrate 1120kg
Potassium chloride 560kg
Phosphor 80kg
Cow dung manure 1500kg
Planting 1ha
Maize seed production 50kg
Polyethlene, HDPE 140kg
Extrusion, pipe 140kg
Irrigating 1ha
Polyethlene, HDPE 23.1kg
Extrusion, plastic film 24.2kg
Excavation, hydraulic digger 4m3
Cast iron 4.27kg
Polyvinylchloride 1.12kg
Electricity Medium voltage 6042kWh
Water, river10.500m3
Occupation6.67m2a
Thinning 1ha
Petrol, two-stroke blend 30kg
Wood chipping 7.5h
Harvesting 1ha
Wood chipping 189h
Petrol, two-stroke blend 4183kg
Grain Spawn Production
Rye preparation 1p (package)
Rye 1.9kg
Chalk 0.247kg
Calcium carbonate 0.0632kg
Diesel 0.192l
Bags 1.29units
Electricity Low voltage 0.311kWh
Water0.00597m3
Creation of the inoculum 1p (package)
Disinfectant 0.000447l
Malt extract 1culture medium
Agar 1culture medium
Glucose 0.00124g
Mycological peptone 0.0000621g
Petri dishes 0.00124dishes
Plastic containers 0.000179units
Electricity Low voltage 0.0375kWh
Water0.000213m3
Preparing the mycelium 1p (package)
Disinfectant 0.000447l
Cardboard boxes 0.0351units
Plastic warp 0.0486units
Pallets 0.000204units
Film stretch 0.000149units
Transparent tape 0.000983units
Electricity Low voltage 0.407kWh
Water0.00213m3
Bio-Composite
Preparation of the substrate 1p (sample)
Fiber of bamboo 27.03g
Water 41.35g
Flour 6.76g
Hemp shives 21.28g
Water 32.55g
Flour 5.32g
Homogenization 1p (sample)
Electricity Low voltage 0.000756757kWh
Sterilization 1p (sample)
Plastic bag 2.16g
Electricity Low voltage 0.018kWh
Plastic bag 1.70g
Electricity Low voltage 0.015kWh
Inoculation/incubation 1p (sample)
Mycelium–bamboo 11.35g
Mycelium–hemp 8.94g
Packing in the mold 1p (sample)
PVC 0.26g
Extrusion plastic pipe 0.26g
Drying 1p (sample)
Electricity Low voltage 0.06913679kWh
Table A2. Transports included in the LCA.
MaterialLocationDistance
(km)
Laboratory (arrival)Milan (IT)/
Bamboo particlesTavullia (IT)350
Grain spawnTreviso (IT)300
Table A3. Dynamic LCA inputs in the DynCO2 calculation tool.
S = 60; CH4 CapturedS = 30; CH4 Captured
YearRelativeRelative
impactimpact
kg CO2−eqkg CO2−eq
000
1−1−1
2−1−1
3−1−1
4−1−1
5−1−1
6−1−1
7−1−1
8−1−1
9−1−1
10−1−1
11−1−1
12−1−1
13−1−1
14−1−1
15−1−1
16−1−1
17−1−1
18−1−1
19−1−1
20−1−1
21−1−1
22−1−1
23−1−1
24−1−1
25−1−1
26−1−1
27−1−1
28−1−1
29−1−1
30−1−0.984135429
31−1−0.970064173
32−1−0.957470336
33−1−0.946105234
34−1−0.935771881
35−1−0.926313222
36−1−0.917603177
37−1−0.909539802
38−1−0.902040038
39−1−0.89503569
40−1−0.888470305
41−1−0.882296767
42−1−0.876475425
43−1−0.870972627
44−1−0.865759583
45−1−0.860811455
46−1−0.856106656
47−1−0.851626277
48−1−0.847353643
49−1−0.84327395
50−1−0.839373972
51−1−0.83564183
52−1−0.832066796
53−1−0.828639137
54−1−0.825349984
55−1−0.822191223
56−1−0.819155408
57−1−0.816235679
58−1−0.813425704
59−1−0.810719616
60−0.990958362−0.808111974
61−0.982699712−0.805597713
62−0.975093938−0.803172118
63−0.968037611−0.800830783
64−0.961448205−0.798569592
65−0.955259588−0.796384689
66−0.949418508−0.794272459
67−0.943881847−0.792229507
68−0.938614477−0.790252645
69−0.933587589−0.788338869
70−0.928777373−0.786485353
71−0.924163996−0.784689431
72−0.919730797−0.782948587
73−0.91546365−0.781260445
74−0.911350467−0.77962276
75−0.907380808−0.778033407
76−0.90354557−0.776490374
77−0.899836742−0.774991756
78−0.896247212−0.773535747
79−0.892770612−0.772120632
80−0.889401195−0.770744786
81−0.886133735−0.769406662
82−0.882963452−0.768104793
83−0.879885944−0.766837781
84−0.876897138−0.765604299
85−0.873993246−0.76440308
86−0.871170731−0.763232921
87−0.86842628−0.762092672
88−0.865756777−0.76098124
89−0.863159285−0.75989758
90−0.860631031−0.758840694
91−0.858169388−0.757809633
92−0.855771865−0.756803485
93−0.853436094−0.755821384
94−0.851159826−0.754862497
95−0.848940916−0.753926031
96−0.846777321−0.753011226
97−0.844667091−0.752117353
98−0.842608363−0.751243716
99−0.840599357−0.750389648
100−0.838638373−0.749554508
101−0.83672378−0.748737684
102−0.83485402−0.747938586
103−0.833027598−0.747156651
104−0.831243084−0.746391337
105−0.829499105−0.745642124
106−0.827794343−0.744908513
107−0.826127535−0.744190023
108−0.82449747−0.743486194
109−0.822902981−0.742796582
110−0.82134295−0.742120762
111−0.819816303−0.741458322
112−0.818322005−0.74080887
113−0.816859063−0.740172024
114−0.815426522−0.73954742
115−0.814023462−0.738934705
116−0.812648998−0.73833354
117−0.811302278−0.737743599
118−0.809982483−0.737164566
119−0.808688821−0.736596138
120−0.807420533−0.736038022
121−0.806176884−0.735489935
122−0.804957169−0.734951605
123−0.803760705−0.734422769
124−0.802586835−0.733903172
125−0.801434925−0.73339257
126−0.800304364−0.732890726
127−0.799194561−0.732397411
128−0.798104947−0.731912403
129−0.797034972−0.73143549
130−0.795984104−0.730966465
131−0.794951831−0.730505127
132−0.793937656−0.730051284
133−0.792941101−0.729604749
134−0.791961703−0.729165341
135−0.790999015−0.728732884
136−0.790052603−0.72830721
137−0.78912205−0.727888154
138−0.78820695−0.727475558
139−0.787306912−0.727069268
140−0.786421557−0.726669134
141−0.785550518−0.726275012
142−0.784693441−0.725886762
143−0.78384998−0.725504249
144−0.783019804−0.725127339
145−0.78220259−0.724755907
146−0.781398026−0.724389828
147−0.780605808−0.724028982
148−0.779825644−0.723673253
149−0.779057249−0.723322526
150−0.778300347−0.722976693
151−0.777554671−0.722635647
152−0.776819962−0.722299283
153−0.776095968−0.721967503
154−0.775382445−0.721640207
155−0.774679157−0.721317301
156−0.773985874−0.720998693
157−0.773302372−0.720684293
158−0.772628436−0.720374014
159−0.771963854−0.72006777
160−0.771308424−0.719765481
161−0.770661945−0.719467064
162−0.770024227−0.719172444
163−0.769395081−0.718881542
164−0.768774326−0.718594287
165−0.768161785−0.718310605
166−0.767557285−0.718030427
167−0.766960661−0.717753685
168−0.766371749−0.717480313
169−0.765790391−0.717210245
170−0.765216434−0.716943419
171−0.764649728−0.716679774
172−0.764090127−0.71641925
173−0.763537491−0.716161789
174−0.76299168−0.715907333
175−0.762452562−0.715655829
176−0.761920004−0.715407221
177−0.761393881−0.715161457
178−0.760874068−0.714918486
179−0.760360444−0.714678259
180−0.759852893−0.714440725
181−0.759351299−0.714205838
182−0.758855551−0.713973551
183−0.75836554−0.713743819
184−0.75788116−0.713516598
185−0.757402308−0.713291844
186−0.756928883−0.713069515
187−0.756460787−0.71284957
188−0.755997923−0.712631969
189−0.755540199−0.712416673
190−0.755087524−0.712203643
191−0.754639807−0.711992841
192−0.754196963−0.711784231
193−0.753758907−0.711577778
194−0.753325555−0.711373446
195−0.752896828−0.711171201
196−0.752472647−0.710971009
197−0.752052934−0.710772839
198−0.751637614−0.710576657
199−0.751226613−0.710382433
200−0.750819861−0.710190135
Figure A1. Network flow representation of process contribution to GWP.
Sustainability 14 01384 g0a1

References

  1. Anderson, J.E.; Wulfhorst, G.; Lang, W. Energy analysis of the built environment—A review and outlook. Renew. Sustain. Energy Rev. 2015, 44, 149–158. [Google Scholar] [CrossRef]
  2. Junnila, S.I. Empirical comparison of process and economic input-output life cycle assessment in service industries. Environ. Sci. Technol. 2006, 40, 7070–7076. [Google Scholar] [CrossRef] [PubMed]
  3. Schandl, H.; Fischer-Kowalski, M.; West, J.; Giljum, S.; Dittrich, M.; Eisenmenger, N.; Geschke, A.; Lieber, M.; Wieland, H.; Schaffartzik, A.; et al. Global material flows and resource productivity forty years of evidence. J. Ind. Ecol. 2018, 22, 827–838. [Google Scholar] [CrossRef]
  4. Röck, M.; Saade, M.R.M.; Balouktsi, M.; Rasmussen, F.N.; Birgisdottir, H.; Frischknecht, R.; Habert, G.; Lützkendorf, T.; Passer, A. Embodied GHG emissions of buildings—The hidden challenge for effective climate change mitigation. Appl. Energy 2020, 258, 114107. [Google Scholar] [CrossRef]
  5. Amiri, A.; Emami, N.; Ottelin, J.; Sorvari, J.; Marteinsson, B.; Heinonen, J.; Junnila, S. Embodied emissions of buildings—A forgotten factor in green building certificates. Energy Build. 2021, 241, 110962. [Google Scholar] [CrossRef]
  6. Churkina, G.; Organschi, A.; Reyer, C.P.O.; Ruff, A.; Vinke, K.; Liu, Z.; Reck, B.K.; Graedel, T.E.; Schellnhuber, H.J. Buildings as a global carbon sink. Nat. Sustain. 2020, 3, 269–276. [Google Scholar] [CrossRef]
  7. Pittau, F.; Krause, F.; Lumia, G.; Habert, G. Fast-growing bio-based materials as an opportunity for storing carbon in exterior walls. Build. Environ. 2018, 129, 117–129. [Google Scholar] [CrossRef]
  8. Göswein, V.; Reichmann, J.; Habert, G.; Pittau, F. Land availability in Europe for a radical shift toward bio-based construction. Sustain. Cities Soc. 2021, 70, 102929. [Google Scholar] [CrossRef]
  9. Pongon, R.S.; Aranico, E.C.; Dagoc, F.L.S.; Amparado, R.F., Jr. Carbon Stock Assessment of Bamboo Plantations in Northern Mindanao, Philippines. J. Biodivers. Environ. Sci. 2016, 9, 97–112. [Google Scholar]
  10. Liese, W. Bamboo as carbon sink-fact or fiction? J. Bamboo Ratt. 2009, 8, 103–114. [Google Scholar]
  11. Vogtländer, J.G.; van der Lugt, P. The Environmental Impact of Industrial Bamboo Products: Life Cycle Assessment and Carbon Sequestration. 2015. Available online: https://www.inbar.int/resources/inbar_publications/the-environmental-impact-of-industrial-bamboo-products-life-cycle-assessment-and-carbon-sequestration/ (accessed on 10 March 2021).
  12. Scurlock, J.M.O.; Dayton, D.C.; Hames, B. Bamboo: An overlooked biomass resource? Biomass Bioenergy 2000, 19, 229–244. [Google Scholar] [CrossRef] [Green Version]
  13. Depuydt, D.E.C.; Billington, L.; Fuentes, C.; Sweygers, N.; Dupont, C.; Appels, L.; Ivens, J.; van Vuure, A.W. European bamboo fibres for composites applications, study on the seasonal influence. Ind. Crops Prod. 2019, 133, 304–316. [Google Scholar] [CrossRef]
  14. Van Wassenhove, R.; De Laet, L.; Vassilopoulos, A.P. A 3D printed bio-composite removable connection system for bamboo spatial structures. Compos. Struct. 2021, 269, 114047. [Google Scholar] [CrossRef]
  15. Caldas, L.; Pittau, F.; Andreola, V.; Habert, G.; Saraiva, A.; Filho, R.T. Dynamic life cyle carbon assessment of three bamboo bio-concretes in Brazil. Acad. J. Civ. Eng. 2019, 37, 593–599. [Google Scholar]
  16. Liu, L.; Li, H.; Lazzaretto, A.; Manente, G.; Tong, C.; Liu, Q.; Li, N. The development history and prospects of biomass-based insulation materials for buildings. Renew. Sustain. Energy Rev. 2017, 69, 912–932. [Google Scholar] [CrossRef]
  17. Sandak, A.; Sandak, J.; Brzezicki, M.; Kutnar, A. Bio-Based Building Skin; Environmental Footprints and Eco-Design of Products and Processes; Springer: Singapore, 2019. [Google Scholar]
  18. Haneef, M.; Ceseracciu, L.; Canale, C.; Bayer, I.S.; Heredia-Guerrero, J.A.; Athanassiou, A. Advanced Materials from Fungal Mycelium: Fabrication and Tuning of Physical Properties. Sci. Rep. 2017, 7, 41292. [Google Scholar] [CrossRef]
  19. Attias, N.; Danai, O.; Abitbol, T.; Tarazi, E.; Ezov, N.; Pereman, I.; Grobman, Y.J. Mycelium bio-composites in industrial design and architecture: Comparative review and experimental analysis. J. Clean. Prod. 2020, 246, 119037. [Google Scholar] [CrossRef]
  20. Lelivelt, R. The Mechanical Possibilities of Mycelium Materials—Eindhoven University of Technology Research Portal. 2015. Available online: https://pure.tue.nl/ws/portalfiles/portal/47018924/793800-1.pdf (accessed on 24 August 2021).
  21. Jones, M.; Bhat, T.; Kandare, E.; Thomas, A.; Joseph, P.; Dekiwadia, C.; Yuen, R.; John, S.; Ma, J.; Wang, C.H. Thermal Degradation and Fire Properties of Fungal Mycelium and Mycelium-Biomass Composite Materials. Sci. Rep. 2018, 8, 17583. [Google Scholar] [CrossRef]
  22. Breton, C.; Blanchet, P.; Amor, B.; Beauregard, R.; Chang, W.S. Assessing the climate change impacts of biogenic carbon in buildings: A critical review of two main dynamic approaches. Sustainability 2018, 10, 20. [Google Scholar] [CrossRef] [Green Version]
  23. Hoxha, E.; Passer, A.; Saade, M.R.M.; Trigaux, D.; Shuttleworth, A.; Pittau, F.; Allacker, K.; Habert, G. Biogenic carbon in buildings: A critical overview of LCA methods. Build. Cities 2020, 1, 504–524. [Google Scholar] [CrossRef]
  24. Levasseur, A.; Lesage, P.; Margni, M.; Samson, R. Biogenic Carbon and Temporary Storage Addressed with Dynamic Life Cycle Assessment. J. Ind. Ecol. 2013, 17, 117–128. [Google Scholar] [CrossRef]
  25. Brandão, M.; Levasseur, A.; Kirschbaum, M.U.F.; Weidema, B.P.; Cowie, A.L.; Jørgensen, S.V.; Hauschild, M.Z.; Pennington, D.W.; Chomkhamsri, K. Key issues and options in accounting for carbon sequestration and temporary storage in life cycle assessment and carbon footprinting. Int. J. Life Cycle Assess. 2013, 18, 230–240. [Google Scholar] [CrossRef]
  26. Correia, M.; Dipasquale, L.; Mecca, S. Heritage for Tomorrow; Firenze University Press: Firenze, Italy, 2014. [Google Scholar]
  27. Camere, S.; Karana, E. Fabricating materials from living organisms: An emerging design practice. J. Clean. Prod. 2018, 186, 570–584. [Google Scholar] [CrossRef]
  28. Çimen, Ö. Construction and built environment in circular economy: A comprehensive literature review. J. Clean. Prod. 2021, 305, 127180. [Google Scholar] [CrossRef]
  29. Elsacker, E.; Vandelook, S.; Brancart, J.; Peeters, E.; De Laet, L. Mechanical, physical and chemical characterisation of mycelium-based composites with different types of lignocellulosic substrates. PLoS ONE 2019, 14, e0213954. [Google Scholar] [CrossRef] [Green Version]
  30. Jones, M.; Mautner, A.; Luenco, S.; Bismarck, A.; John, S. Engineered mycelium composite construction materials from fungal biorefineries: A critical review. Mater. Des. 2020, 187, 108397. [Google Scholar] [CrossRef]
  31. Design Ecovative. Ecovative Design Mushroom Packaging Life Cycle Assessment. 2016. Available online: https://www.rit.edu/affiliate/nysp2i/sites/rit.edu.affiliate.nysp2i/files/docs/resources/Ecovative_Design_Compares_Environmental_Impact_of_Packaging_Materials.pdf (accessed on 11 September 2021).
  32. Girometta, C.; Picco, A.M.; Baiguera, R.M.; Dondi, D.; Babbini, S.; Cartabia, M.; Pellegrini, M.; Savino, E. Physico-mechanical and thermodynamic properties of mycelium-based biocomposites: A review. Sustainability 2019, 11, 281. [Google Scholar] [CrossRef] [Green Version]
  33. Hilton, B. Using LCA to Prioritize Process Changes: A Mushroom Packaging LCA Case Study. Available online: https://studylib.net/doc/18078297/remanufacturing-lca (accessed on 1 September 2021).
  34. Jones, M.; Gandia, A.; John, S.; Bismarck, A. Leather-like material biofabrication using fungi. Nat. Sustain. 2021, 4, 9–16. [Google Scholar] [CrossRef]
  35. Vivai OnlyMoso di Fabrizio Pecci, 2021. Onlymoso [WWW Document]. Available online: https://onlymoso.it/ (accessed on 26 November 2021).
  36. PRé, 2021. SimaPro 9.2. Available online: https://simapro.com/wp-content/uploads/2021/07/SimaPro920WhatIsNew.pdf (accessed on 1 July 2021).
  37. Moreno Ruiz, E.; Valsasina, L.; Fitzgerald, D.; Brunner, F.; Vadenbo, C.; Bauer, C.; Bourgault, G.; Symeonidis, A.; Wernet, G. Documentation of Changes Implemented in the Ecoinvent Database v3. 4. Ecoinvent. Zürich 2017, Switzerland 8. Available online: https://ecoinvent.org/wp-content/uploads/2021/09/Change-Report-v3.8.pdf (accessed on 27 July 2021).
  38. Lin, X.C.; Chow, T.Y.; Chen, H.H.; Liu, C.C.; Chou, S.J.; Huang, B.L.; Kuo, C.I.; Wen, C.K.; Huang, L.C.; Fang, W. Understanding bamboo flowering based on large-scale analysis of expressed sequence tags. Genet. Mol. Res. 2010, 9, 1085–1093. [Google Scholar] [CrossRef]
  39. Appels, F.V.W.; Camere, S.; Montalti, M.; Karana, E.; Jansen, K.M.B.; Dijksterhuis, J.; Krijgsheld, P.; Wösten, H.A.B. Fabrication factors influencing mechanical, moisture- and water-related properties of mycelium-based composites. Mater. Des. 2019, 161, 64–71. [Google Scholar] [CrossRef]
  40. Elsacker, E.; Vandelook, S.; Van Wylick, A.; Ruytinx, J.; De Laet, L.; Peeters, E. A comprehensive framework for the production of mycelium-based lignocellulosic composites. Sci. Total Environ. 2020, 725, 138431. [Google Scholar] [CrossRef] [PubMed]
  41. ISO 22007-2; Plastics—Determination of Thermal Conductivity and Thermal Diffusivity—Part 2: Transient Plane Heat Source (Hot Disc) Method. ISO: Genève, Switzerland, 2015.
  42. Atanasiu, B.; Maio, J.; Staniaszek, D.; Kouloumpi, I.; Kenkmann, T. Overview of the EU-27 Building Policies and Programs. Factsheets on the Nine Entranze Target Countries. 2014. Available online: https://www.entranze.eu/files/downloads/D5_1_3/ENTRANZE_Integration_of_report_D5.1_D5.2_D5.3_final.pdf (accessed on 10 October 2021).
  43. Di Milano, P. MaBa.SAPERlab [WWW Document]. 2020. Available online: https://www.dabc.polimi.it/en/abclab/le-unita/mabasaperlab/ (accessed on 26 November 2021).
  44. ISO 14040; Environmental Management—Life Cycle Assessment—Principles and Framework. ISO: Genève, Switzerland, 2006.
  45. Guest, G.; Cherubini, F.; Strømman, A.H. Global Warming Potential of Carbon Dioxide Emissions from Biomass Stored in the Anthroposphere and Used for Bioenergy at End of Life. J. Ind. Ecol. 2013, 17, 20–30. [Google Scholar] [CrossRef]
  46. European Commission, Official Journal of EU, L 312, 19.11.2008. Directive 2008/98/EC of the European Parliament and of the Council of 19 November 2008 on Waste and Repealing Certain Directives. Available online: http://eur-lex.europa.eu/LexUriServ/LexUriServ.do?uri¼OJ:L:2008:312:0003:0030:en:PDF (accessed on 5 August 2021).
  47. Stoeva, K.; Alriksson, S. Influence of recycling programmes on waste separation behaviour. Waste Manag. 2017, 68, 732–741. [Google Scholar] [CrossRef] [PubMed]
  48. Vaverková, M.D. Landfill impacts on the environment—Review. Geosciences 2019, 9, 431. [Google Scholar] [CrossRef] [Green Version]
  49. Dai, X.; Hua, Y.; Liu, R.; Chen, S.; Li, H.; Dai, L.; Cai, C. Biomethane production by typical straw anaerobic digestion: Deep insights of material compositions and surface properties. Bioresour. Technol. 2020, 313, 123643. [Google Scholar] [CrossRef]
  50. Levasseur, A. 2010. New Generation Carbon Footprinting, CIRAIG [WWW Document]. Available online: https://ciraig.org/pdf/DYNCO2_InstructionManual.pdf (accessed on 4 July 2021).
  51. Sébastien, L.; Goulouti, K.; Favre, D.; Giorgi, M.; Padey, P.; Volland, B.; Farsi, M.; Habert, G.; Galimshina, A. Analysis of Lifetimes of Building Elements in the Literature and in Renovation Practices and Sensitivity Analyses on Building LCA & LCC. Erneuern! Sanierungsstrategien Für den Gebäudepark. 2020. Available online: https://www.researchgate.net/publication/349139276_Analysis_of_lifetimes_of_building_elements_in_the_literature_and_in_renovation_practices_and_sensitivity_analyses_on_building_LCA_LCC#fullTextFileContent (accessed on 2 November 2021).
  52. Göswein, V.; Silvestre, J.D.; Sousa Monteiro, C.; Habert, G.; Freire, F.; Pittau, F. Influence of material choice, renovation rate, and electricity grid to achieve a Paris Agreement-compatible building stock: A Portuguese case study. Build. Environ. 2021, 195, 107773. [Google Scholar] [CrossRef]
  53. Yadav, M.; Agarwal, M. Bio-based building materials for sustainable future: An overview. Mater. Today Proc. 2021, 43, 2895–2902. [Google Scholar] [CrossRef]
Figure 1. Schematic diagram of the performed LCA methodology.
Sustainability 14 01384 g001
Figure 2. Time allocation of processes and agricultural activities in the field for Moso bamboo cultivations.
Sustainability 14 01384 g002
Figure 3. Schematic diagram of the production process of the mycelium bio-composite (MycoBamboo). (a) The starting of the incubation period after the inoculation and mixing steps; (b) shows the bio-composite once packed in molds; (c) the bio-composite that has been demolded; (d) the MycoBamboo once deactivated.
Sustainability 14 01384 g003
Figure 4. Methodological approach for the comparative carbon footprint assessment of a 1 m2 renovated wall.
Sustainability 14 01384 g004
Figure 5. Flowchart of the bamboo–mycelium composite and system boundaries.
Sustainability 14 01384 g005
Figure 6. End-of-life scenarios for the bio-composite.
Sustainability 14 01384 g006
Figure 7. Global Warming Potential (GWP) of MycoBamboo for each production process (A1-3). On the left, a comparison of results for the two storage scenarios, 60 and 30 years. On the right, the percentage contribution of each production process to the GWP.
Sustainability 14 01384 g007
Figure 8. GWP of a renovated wall with six insulation alternatives and a storage period (S) of 60 years. The emissions of the existing masonry wall are shown in gray. The emissions of the production of the insulating materials are shown in blue. In green: the stored biogenic CO2. The red indicator represents the Net-GWP.
Sustainability 14 01384 g008
Figure 9. Net-value emissions of the wall for the 30-year storage period.
Sustainability 14 01384 g009
Figure 10. Processes’ contribution to GWP for the laboratory fabrication of one MycoBamboo sample under the two alternative energy scenarios. On the left, comparison between IT energy mix and a 100% renewable PE. On the right, percentage of incidence of the main processes under the two energy scenarios.
Sustainability 14 01384 g010
Table 1. Fuel consumptions during the different processes for bamboo cultivation.
Process UnitFuelTractor UseTractor Consumption
(kg/h)(h/ha)(kg)
Ploughing14.635
Harrowing-114.632.536.56
Fertilization-18.7818.78
Harrowing-214.63229.26
Thinning1.001010
Harvesting1.0536/4237.80/44.10
Table 2. Amounts of fertilizers and seed needed for the cultivation of 1 ha of field.
InputQuantity
(kg)
Ammonium nitrate phosphate160
Potassium chloride80
Phosphor60
Seeds50
Table 3. Amount of energy consumption during the bio-composite production.
Process UnitQuantityDurationEnergy Consumption
(h)(kWh)
Homogenization0.2 bags0.00560.0056
Sterilization3 bags0.66700.205
Drying15 samples71.037
Table 4. Material inventory for the six insulation alternatives for exterior wall renovation—five bio-based and one non-bio-based.
n.Cod.StratigraphyThicknessDensityThermal Conductivity (λ)
(m)(kg/m3)(W/m K)
1GYPGypsum–lime plaster0.0259250.70
2BRIBrick0.2009000.36
3CEMCement plaster0.02515500.80
Bio-based alternatives
4MYCMycelium–bamboo composite0.0922290.08
4STRStraw0.063950.05
4COTCotton stalk0.048427.50.04
4CORCork0.0481140.04
4KENKenaf0.0461710.04
5LIMLime plaster0.00813590.67
Fossil-based alternative
4EPSEPS0.048300.04
5CEMCement Plaster0.00615500.80
Sustainability 14 01384 i001
Publisher’s Note: MDPI stays neutral with regard to jurisdictional claims in published maps and institutional affiliations.

