Abstract
The effect of urbanization on the urban thermal environment (UTE) has attracted increasing research attention because its significant effects on local weather and climate, and serious consequences for people. However, systematic study of the relationship between urbanization and UTE has been undertaken only to a limited extent. Using quantitative thermal remote sensing and multi-buffer ring method and multiple spatial scales method, here we analyze Landsat TM/ETM+ images of Zhengzhou in Central China acquired on four different dates in 2017 to investigate the spatiotemporal variations, trends, and driving force in the land surface temperature (LST). Our results showed that LST generally increased with urbanization intensity. This trend was extremely obvious in spring and summer, weak in winter, and slightly downward in autumn. Moreover, PLAND (e.g., percentage of impervious surface in a landscape) has the most significant effect on urban LST, and generally increases as the spatial scale becomes larger. In conclusion, the study recommends that urban planning in Zhengzhou should prioritize PLAND, especially at large spatial scales. These results provide a scientific reference for urban planners who are committed to the sustainable development of Zhengzhou City.
1. Introduction
With socio-economic development, urbanization has led to the gradual replacement of natural ground surfaces with impervious surfaces such as concrete, asphalt, and cement [1,2,3]. This massive shift in the Earth’s surface has resulted in a variety of extreme climate phenomena, one of which is the urban heat island(UHI) phenomenon that describes the temperature difference between urban and rural areas [4].The UHI effect not only changes global regional climate and urban atmospheric patterns, but also poses many problems for urban development and human habitation, such as triggering extreme urban weather events and accelerating the risk of heat-related deaths [5,6,7,8,9]. Against the backdrop of an irreversible global urbanization trend, with 790,000 km2 of global urban land in 2018, urban areas are expected to house 68% of the world’s population by 2050 [10]. China has also been undergoing a rapid urbanization process in recent decades, with an annual expansion rate and average annual growth rate of 1869.8 km2 and 4.8% of urban building land, respectively. It has become the world’s largest country in terms of artificial impervious areas after 2015 [11,12]. This phenomenon has created a serious UHI effect in Chinese cities [13].
Currently, the impact of urbanization on LST has received widespread attention, but research conclusions vary from city to city [14,15,16,17,18,19]. The spatial heterogeneity of the landscape, climatic characteristics, different analytical methods and data selection in each study area may be the reasons for the differences in urbanization impacts [20,21,22]. Therefore, it is necessary to further investigate the impact of urbanization on LST based on relevant urbanization models, background environment and other factors [8,23,24]. However, although there are many studies related to urbanization and LST, the focus has tended to be on the most developed regions or urban agglomerations in China [22,24,25,26]. Research on the impact of urbanization on LST has been neglected in middle China, such as Zhengzhou, the capital of Henan Province (a well-known agricultural center) and the largest city in the Central Plains Economic Region (CPER). Over the past few decades, Zhengzhou has experienced rapid urbanization. The population of Zhengzhou has increased from 4.2 million to 9.9 million from 1978 to 2017, an increase of more than 100% in 40 years [27]. Meanwhile, Zhengzhou was identified as the core city of the Central Plains City Cluster and was officially named the eighth national central city by the central government in 2016. Along with the rapid development, the average LST of Zhengzhou City increased by 2.94 °C from 1996 to 2014 [28]. In summary, Zhengzhou is an ideal sample to understand the relationship between urbanization and LST in central Chinese cities. In this sense, it is necessary to explore the impact and drivers of urbanization trends on urban LST in Zhengzhou.
Moreover, the optimal scale for the study is difficult to determine due to the different natural and socioeconomic conditions in different study areas. A study in Indianapolis showed that 90 m is the best spatial resolution to assess the relationship between the LULC and LST models [29]. Nevertheless, it has been pointed out that the multiple spatial scales method ignores physical distance within the city, which is another important indicator influencing the urban thermal environment [30]. Hence, this study used the multi-buffer ring method and multiple spatial scales method in this study to enhance the accuracy and validity of the study’s findings. In addition, most early studies on the UHI effect relied on meteorological observation methods to conduct experiments [31]. It is difficult to conduct comprehensive experiments on urban temperature due to the limited number and location of meteorological observation sites. With the rapid advancement of satellite technology in recent years, it has been widely used in the study of LST inversion by satellite images [31,32,33,34,35].
In summary, the specific objectives of this study were (1) to summarize the spatial and temporal characteristics of LST in Zhengzhou; (2) to explore the trends of LST with urbanization in Zhengzhou; and (3) to investigate the driving factors of the changing trends of LST in Zhengzhou.
In more detail, this study uses Landsat 8 and GF-2 satellite remote sensing images to quantify the relationship between urbanization and LST in Zhengzhou City from different spatial scales and different distance perspectives. Regression models were then used to identify the driving factors. The results of this study will help urban land developers and planners to standardize urban thermal environment planning and provide decision support for mitigating UHI effect.
2. Materials and Methods
2.1. Study Area
The study was conducted in Zhengzhou (112°42′–114°14′ E, 34°16′–34°58′ N) (Figure 1), which is the capital of Henan province and a typical Chinese megacity covering 7567 km2 and housing 12.74 million people [36]. It is dominated by a continental monsoon climate of the north temperate zone with the obvious variation of four seasons. The total annual rainfall averages 542.15 mm, and the annual average temperature of the cold winter is 2.15 °C. The hot summer’s annual average temperature is 25.9 °C. The total sunshine is 2400 h [37]. Over the years, the city has gradually become a densely populated and economically developed megacity in middle-China. However, the city’s urban thermal environment has worsened as a result of the obvious UHI phenomenon due to the rapid urbanization in Zhengzhou, which endangers city dwellers’ health and regional sustainable development. As a result, this study will focus on the central districts of Zhengzhou, including the five districts of Jinshui, Zhongyuan, Erqi, Guanzu, and Huiji.
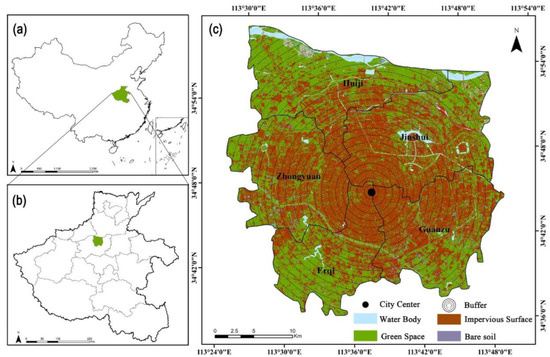
Figure 1.
The study area’s location with a background map displaying land cover data. (a): China, (b): Henan Province, (c): Zhengzhou.
2.2. Retrieving Land-Surface Temperature
The workflow steps of this study are shown in Figure 2. For the LST data, this study used Landsat-8 OLI/TIRS images with a spatial resolution of 30 m × 30 m that were obtained around 11 AM local time in 2017. Detailed image information is shown in Table 1. If no cloudless images were available in 2017, images from July 2015 or 2018 were used instead. Due to its superior higher than a single channel approach and the split-window algorithm [38]. LST was calculated from the Landsat-8 Thermal Infrared Sensor (TIRS)’s infrared band 10 (TIRS) using the classical radiative transfer equation (RTE).
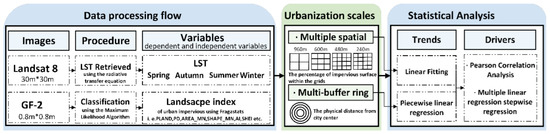
Figure 2.
The workflow steps of this study.

Table 1.
Landsat-8 OLI/TIRS images descriptions used in this study.
First, the absolute radiation brightness of TIRS band 10 was converted to a digital number (DN), and then the RTE transformation was applied to determine black-body radiation brightness as follows:
In Equation (1), TS is the black-body radiation, Lλ is the spectral radiation brightness of band 10, τ is the transmittance of thermal infrared bands in the atmosphere, L↑ and L↓ are the brightness of upward and downward radiation in the atmosphere, respectively (http://atmcorr.gsfc.nasa.gov, accessed on 2 August 2021). The term ε is land surface emissivity calculated from vegetation proportion (Pv) [39]:
Then, the Plank function was used to compute LST from black-body radiation brightness.
In Equation (3) T is land surface temperature (°C), K1 = 774.89 W/(m2·μm·sr), K2 = 1321.08 K (values came from the metadata file).
2.3. Land Cover Data
For the land cover data, this study used the GF-2 images (0.8 m × 0.8 m) acquired in 16 April 2017 and re-projected into the World Geodetic System (WGS)1984_UTM_49N coordinates. Using a DEM image (30 m) downloaded from the Geospatial Data Cloud, images were corrected for atmospheric radiation and topography (www.gscloud.cn). To interpret and classify the images, this study used a combination of supervised classification and manual interpretation. To generate the primary classification raster file in ENVI 5.3 Classification Workflow tool, training data were selected for each class using the Maximum Likelihood Algorithm. This study’s land covers were divided into four categories (i.e., vegetation, impervious surface, water body, and bare soil). The images explicitly demonstrate the distribution of Surface information in Zhengzhou and can thus be used to map urban classification effectively. Vegetation included all vegetated areas, also known as green space. Impervious surfaces included transportation, industrial, commercial, and residential space. Lakes and rivers were the most common types of water bodies. Bare soil referred to construction sites and non-vegetative areas. The accuracy of the land cover classification was evaluated. The accuracy of the land cover classification was evaluated. The overall accuracy was 97.7552% and the kappa coefficient was 0.9519.
2.4. Two Urbanization Intensity Scales
There are two scales to be used in defining urbanization intensity. One is multiple spatial scales with four grid cell sizes, which was used to analyze the relationships between land cover and LST. Specifically, the urbanization intensity was defined as the percentage of impervious surface within the four grid cell sizes (i.e.,240 m, 360 m, 480 m, 960 m), which is a multiple of the spatial resolution of the GF-2 and Landsat satellite images. Then this scale was calculated as:
where is the urbanization intensity, is the area of impervious surface, and is the total area of the ith four grid cell sizes (i.e.,240 m, 360 m, 480 m, 960 m).
Therefore, the four-season average LST was calculated for each grid cell from 0% to 100%, with an interval of 1%. This method omitted the physical locations of the pixels, allowing for continuous measurement.
Another indicator of urbanization intensity is multi-buffer rings method. In this study, the concentric ring partitioning was used to define the intensity of urbanization over physical distances. The1-km buffer zone was created in increments, with Erqi Square in Zhengzhou City as the central point. Thus, Zhengzhou City was divided into a series of 1 km rings radiating from the center. Then, the average LST values were calculated for each ring and the thresholds for urban LST changes, and the intensity of urbanization development were calculated using segmented regression.
2.5. Driving Forces and Statistical Analysis
This study uses landscape structure (composition and configuration) of built-up land as a potential driver of LST and employs the landscape pattern index method to quantitatively analyze the spatial structural characteristics of landscape patterns. A total of 12 indicators were selected at two levels, landscape scale and patch type, to investigate the impact of landscape structure on LST at various levels of urbanization (Table 2). These landscape indices are Number of patches (NP), Patch density (PD), Mean patch area (AREA_MN), Mean shape index (SHAPE_MN), Mean perimeter-area (PARA_MN), aggregation index (AI), Interspersion and Juxtaposition index (IJI), Contagion index (CONTAG), Shannon’s diversity index (SHDI), Shannon’s evenness index (SHEI), Percent of landscape (PLAND), and largest patch index (LPI). Then, this study uses Fragstats 4.2, based on the 8-unit neighborhood method, to calculate the landscape indices for each grid scale and Buffer separately.
Table 2.
Description of landscape indices used in this study.
To examine the connection between urbanization intensity and urban LST, as well as its impact, the correlation relationship between landscape pattern index and urban LST was first calculated using Pearson’s correlation coefficient in this study. Second, stepwise regression was used to extract the drivers of LST change trends in Zhengzhou city under different levels of urbanization. Due to the different units of the landscape pattern index, the independent variables were standardized before building the regression model to improve the accuracy of the regression model. In the multiple linear fit models, the explanatory rate of the selected variables on the trend of LST change in Zhengzhou city was analyzed using the coefficient of determination (R2). The calculation between LST and the selected variables is used to investigate the contribution of LST drivers in Zhengzhou city under different levels of urbanization. Quantifying the contribution of LST drivers in Zhengzhou City under different urbanization levels.
3. Results
3.1. LST Spatiotemporal Characteristics in Four Reasons
The high LST areas are mainly located in the center and southeast of the study area. The low LST is mainly located at the edge of the study area and near the rivers and lakes. From an administrative perspective, Low LST areas were mainly concentrated in Erqi district in the southwest, Huiji district in the north, and Jinshui district in the northeast. These areas are not suitable for building due to high elevation or close to water bodies. The high places are mostly forest and water bodies topography, causing LST in the surrounding areas, reflecting the good cooling effect of forest corner water (Figure 3).
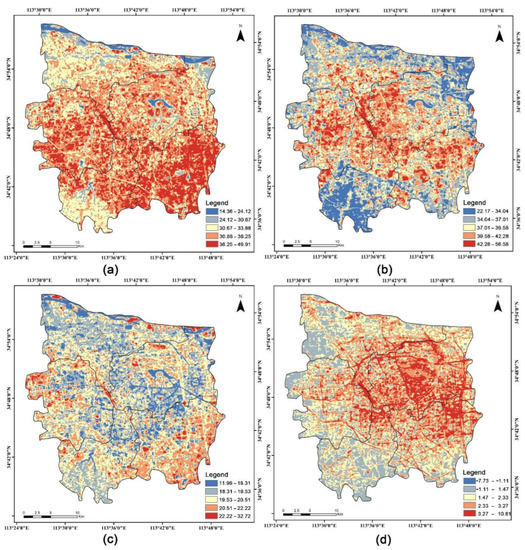
Figure 3.
The Four images represent the spatial distribution of land surface temperature (LST, °C) in (a) Spring, (b) Summer, (c) Autumn, and (d) winter, respectively.
In the spring, summer and autumn, Dragon Lake, and Yellow River, which were located in Jinshui district in the center part and Huiji district in the north respectively, also showed low LST. Zhengzhou north station in the east of the central study area, and factories in the southeast of the study area were hugely covered by impervious surface, leading to high LST areas. Therefore, impervious surfaces were more probable to warm up after solar radiation absorption comparing with forest and water land.
In summer, the highest LST was 56.58 °C, the mean LST was 38.12 °C, and the lowest LST was 22.17 °C. The maximum LST in the spring was 49.92 °C, which was close to the LST in summer. The mean LST in Spring was 34.22 °C, which was above 3.5 °C lower than in summer, and the lowest LST was 14. 37 °C. In autumn, the highest, average, and lowest LST was 32.56 °C, 19.8 °C, and 12 °C, separately. As for the winter, they are 9.96 °C, 2.3 °C, and −7.74 °C, respectively. Although the LST distribution varies somewhat by season, the overall spatial distribution pattern of LST is similar across seasons.
3.2. The Relationship between Urbanization and LST
3.2.1. Urbanization Intensity (Multi-Buffer Rings Method)
The general trend of LST change can be obtained by analyzing the graph of LST change versus distance from the city center. Plots of LST representing different seasons of Zhengzhou distance from the city center outwards are shown in Figure 4. LST generally decreases from the city center. This is in line with the traditional understanding of LST. For most cities, LST decline as moved outward from a central core. In summer and winter, the LST decreased evidently and rapidly with away from the center. The same trend in spring were slightly. By contrast, the trend between LST and distance from the city center was upward in autumn. Second, the piecewise linear regression was used to calculate the threshold of change in LST for each season. The results show that the location of the threshold varies from different seasons and its change trend is also different. In detail, the LST has been on a decreasing trend with increasing distance from the city center in spring and summer, and the decreasing trend is more dramatic when the thresholds of 15 km and 25 km are exceeded respectively. In autumn, the trend of LST changes from increasing to decreasing when the distance to the city exceeds 21 km. On the contrary, in winter, the trend of LST changes from decreasing to increasing when the distance from the city exceeds 20 km. Among the four seasonal thresholds, the summer threshold is the farthest from the city center and the spring threshold is the closest to the city center.
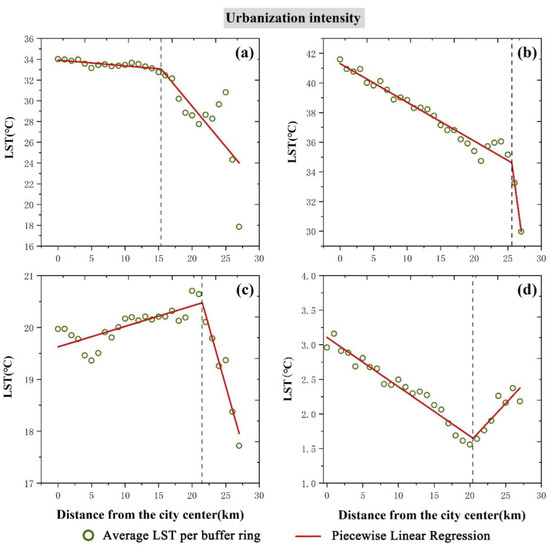
Figure 4.
Demonstrations of the relationship thresholds between the LST and urbanization intensity (km) in (a) Spring, (b) Summer, (c) Autumn, and (d) winter, respectively.
3.2.2. Urbanization Intensity (Multiple Spatial Scales Method)
The LST generally increased with urbanization intensity in different seasons. Within the same urbanization intensity, the range of LST variation was also large (difference between maximum and minimum values). The LST increased significantly (p < 0.01) with increasing urbanization intensity in spring, summer, and winter. The mean warming trend of LST with urbanization intensity at four scales in spring, summer, and winter in Zhengzhou was 0.06 °C, 0.07 °C, and 0.01 °C, with mean intercepts of 29.22 °C, 34.77 °C, and 1.88 °C, respectively. In contrast to autumn when LST increased with urbanization intensity showed a slight decreasing trend with a mean cooling trend of −0.038 °C and a mean intercept of 20.63 °C. In addition, different seasons showed different trends with increasing grid scale. In spring, R2 values increased with decreasing grid scale, reaching the highest value at 240 m (R2 = 0.76). In summer, unlike spring, the R2 values generally decrease with decreasing grid scale, and the 960 m grid instead becomes the highest value in summer (R2 = 0.85), which indicates that urbanization has the greatest effect on LST in summer at the 960 m grid, and this effect decreases with decreasing grid scale. In autumn and winter, the R2 values reach their maximum values at the 960 m and 600 m grid scales, respectively. According to the linear fitting results, the warming trend was significantly positively correlated in spring, summer, and winter (r = 0.85; r = 0.87; r = 0.66, p < 0.01), while autumn showed a significant negative correlation (r = −0.17, p < 0.01) at the four scales (Figure 5).
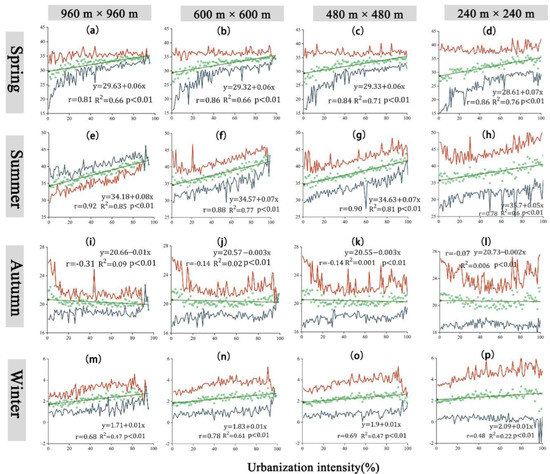
Figure 5.
The maximum (red line), average (green dot) and minimum (blue line) values of the four-season LST in Zhengzhou at different grid scales (i.e., 240 m, 360 m, 480 m, 960 m) along the urbanization intensity (0–100%). Spring (a–d), Summer (e–h), Autumn (I–l), and winter (m–p). 960 m × 960 m (a,e,i,m), 600 m × 600 m (b,f,j,n), 480 m × 480 m (c,g,k,o), 240 m × 240 m (d,h,l,p).
3.3. Correlations between LST and Landscape Index
The correlation analysis shows that the urban LST is closely correlated with the landscape pattern, and its significance varies with seasonal changes (Figure 6). Overall, the spring and summer seasons are more closely correlated with the landscape indices. The fall and winter seasons showed weaker correlations compared to them, but some landscape indices still showed high correlations.
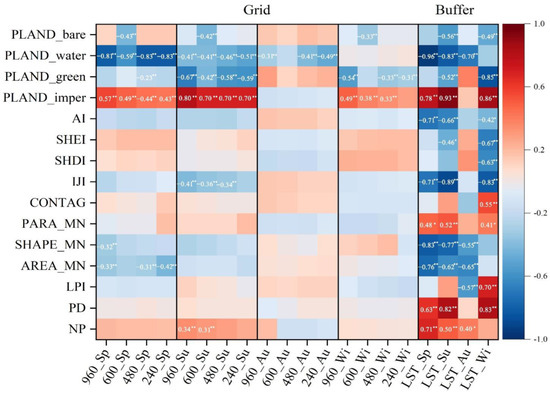
Figure 6.
Heat map of Pearson’s correlation coefficient between landscape index and LST in four seasons. The number and stars show the significance level of coefficient, ** p < 0.01, * p < 0.05.
In spring, the correlation analysis results of the multiple spatial scales showed that the most significantly correlated landscape indices with LST were PLAND_water (negative correlation), followed by PLAND_imper (positive correlation), and PLAND_bare. The PLAND_green, SHAPE_MN and AREA_MN indices were all significantly negatively correlated with LST. In the multi-buffer ring method correlation analysis, the landscape indices that showed significant correlation in the multiple spatial scales analysis were still significantly correlated with LST, and the correlation coefficients increased. In addition, AI and JJI indices were negatively correlated with LST, and PARA_MN, PD and NP indices were positively correlated with LST.
In summer, the correlation analysis results of the multiple spatial scales showed that the most significantly correlated landscape indices with LST were PLAND_imper (positive correlation), followed by PLAND_green and PLAND_water (negative correlation). In addition, PLAND_bare and IJI index were significantly negatively correlated with LST. The NP index was significantly positively correlated with LST. In the multi-buffer ring method correlation analysis, the landscape indices that showed significant correlation in the multiple spatial scales analysis were still significantly correlated with LST, and the correlation coefficients increased. Furthermore, PARA_MN, PD and NP indices were significantly and positively correlated with LST. AI, SHEI, SHAPE_MN and AREA_MN indices were significantly and negatively correlated with LST.
The results of the correlation analysis by multi-spatial scale method in autumn showed that only the PLAND_water was significantly correlated with LST (negative correlation). In the results of the multi-buffer ring method correlation analysis, SHAPE_MN, AR-EA_MN and LPI were significantly negatively correlated with LST, except for the PLAND_water, while thePLAND_green and NP index were significantly positively correlated with LST. In winter, the results of the multiple spatial scales correlation analysis showed that the PLAND_water and PLAND_bare were significantly negatively correlated with LST, while the PLAND_imper was significantly positively correlated with LST. In the multi-buffer ring method correlation analysis, the landscape indices that showed significant correlations in the multiple spatial scales analysis were still significantly correlated with LST, and the correlation coefficients increased. In addition, CONTAG, PARA_MN, PD and NP indices were significantly and positively correlated with LST, while AI, SHEI, SHDI and IJI indices were significantly and negatively correlated with LST. In general, different urbanization calculation methods also resulted in different correlation results. Among the multiple spatial scale method, LST in different seasons had the highest correlation with two landscape indices, PLAND_imper and PLAND_water, followed by PLAND_green and PLAND_bare. Among the landscape configuration indices, only IJI, AREA_MN, SHAPE_MN and NP have correlations with LST, but only at a few grid scales and not with regularity. However, in the multi-buffer ring method, the four seasons have significant correlations with a large number of landscape pattern indices, both in terms of landscape composition and landscape configuration.
Figure 7 shows the results of the stepwise regression analysis of LST and landscape pattern index for different seasons. In spring, PLAND_water is the main driver of the LST trend change in the city. In summer, the change in LST trend in Zhengzhou is mainly attributed to PLAND_imper, while in autumn and winter, the main drivers causing the change in LST are PLAND_water and PLAND_green, respectively. The regression results of the multi-buffer ring method analysis were mostly like the multi-spatial scale method, where the main drivers for spring, summer, and autumn were PLAND_water, PLAND_imper, and PLAND_water, with explanatory rates of 92.5%,86.5%, and 47%, respectively. The results of the multi-buffer ring method analysis in winter were PLAND_green as the main driver, with an explanation rate of 72.8% (Figure 7).
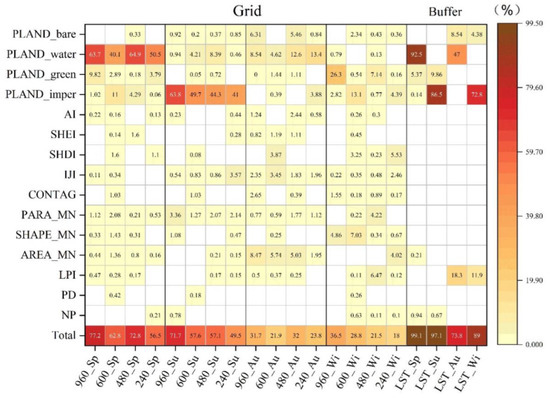
Figure 7.
Heat map of stepwise regression coefficients between landscape index and LST in four seasons.
In addition, the explanatory rates of the main driving forces differed significantly among seasons at different grid scales. Specifically, in spring, the explanation rate of PLAND_water decreased from 63.7% to 50.5% at the grid scales of 960m, 600m, 480m and 240 m. The interpretation rate of PLAND_water in spring also had the lowest interpretation rate at the 240 m grid scale.
In summer, the interpretation rate of PLAND_imper decreases from 63.8% to 41.0% from the grid scale of 960 m to 240 m. The interpretation rate of PLAND_imper for summer LST is highest at the scale of 960 m. In summer, the explanation rate of PLAND_imper decreases from 63.8% to 41.0% from the grid scale of 960 m to 240 m. In summer, the explanation rate of PLAND_imper decreases from 63.8% to 41.0% from the grid scale of 960 m to 240 m. The explanation rate of PLAND_imper decreases from 63.8% to 41.0% from the grid scale of 960 m to 240 m. In autumn, the interpretation rate of PLAND_water increased from 8.54% to 13.4% on the grid scale from 960 m to 240 m. This change was opposite to the other seasons. In winter, the interpretation rate of PLAND_green declined from 26.3% to 0.16% from the grid scale of 960 m to 240 m.
4. Discussion
4.1. Comparison with Previous Studies
Our results show that there is significant spatial heterogeneity in Zhengzhou LST, with high LST areas mainly distributed in the center and southeast of the study area. Low LST was mainly distributed at the edges of the study area and near rivers attached to lakes. This is consistent with the results of previous studies on LST in Zhengzhou city [28,40,41,42].
Firstly, the spatial heterogeneity of the LST described above is largely due to differences in the types of ground cover. While the impervious area is larger in the center and southeast of Zhengzhou, green space and water are mostly distributed at the urban edge. Previous study showed that the percentage of impermeable surfaces was positively correlated with LST values, and both showed an increasing trend [43]. Some studies on Zhengzhou City found that green space and water can effectively reduce LST and mitigate the UHI effect [28,44]. Albedo decrease due to urbanization leads to LST increase [45,46,47]. These findings strongly confirm the plausibility of the above spatial heterogeneity of LST.
4.2. Impact of Urbanization on LST
The results of the study show that the overall LST in Zhengzhou City increases with the intensity of the city, a result that has been confirmed by the results of many studies [15,16,43,48,49,50,51]. However, in further analysis, this study found significant seasonal differences in the effect of urbanization intensity on LST. This finding is opposite to the previous research idea that there is no clear seasonal pattern between LST and urbanization [14].
Firstly, the difference in research methods also accounts for a large part. Compared to the previous studies in which nine sample sites with different land use types were selected for analysis in Shanghai and Tokyo, this study uses the multiple spatial scales method and the multi-buffer ring method to conduct a city-wide study. With the rapid urban development and serious fragmentation of urban patches, only a more detailed and comprehensive approach can accurately analyze the urbanization-LST relationship. It has been shown that there is a significant scale effect in the relationship between urban land use types and LST, and multi-spatial scale studies are considered to be an important method to study urban and LST patterns [29]. Another study showed that the correlation between urbanization intensity and LST tends to increase with increasing scale [52]. Compared with the multiscale method based on dividing the grid by different pixel sizes, the multi-buffer ring method makes up for its shortcoming of ignoring the physical distance from the cities, making the study results more comprehensive and accurate [30].
It is noteworthy that in the autumn LST shows a slight downward trend with increasing urbanization. This is contrary to the results that indicate that urbanization has a significant impact on the average LST in the autumn [53]. This may be caused by changes in plant phenology due to urbanization. Phenology is the timing of periodic recurring events of an organism that accompany the seasonality of its habitat environment. It has been widely reported recently that urbanization has altered the timing of phenological events. Previous study have shown that the growing season of vegetation in urban areas in the northern hemisphere at mid to high latitudes started earlier (−5.6 ± 0.7 d), peaked earlier (−4.9 ± 0.9 d), and ended later (4.6 ± 0.8 d) than vegetation in rural areas [54]. Another study observed that urbanization in the eastern United States resulted in a 7.6 day extension of the growing season in deciduous broadleaf forests [55]. In addition, the vegetation growth start period was on average 4 to 9 days earlier and the end period was delayed by about 2 to 16 days at mid to high northern latitudes [56]. These results suggest that the delay in the end of vegetation period resulted in simultaneous differences in vegetation status between the urban center and urban fringe areas. These phenomena may have contributed to the slight weakening trend of urbanization-LST in autumn
4.3. Analysis of the Drivers of Urbanization on LST Trends
The results of this study indicate that the main drivers of LST in Zhengzhou are PLAND_imper, PLAND_water and PLAND_green. This is consistent with the previous research that for the average LST, PLAND has the largest explanatory role [57]. In summer, the landscape pattern index with the highest interpretation of LST was PLAND_imper, both in the multiple spatial scales and the multi-buffer rings approach. PLAND_imper can be a very useful predictor for understanding urban LST, which is in line with previous research [49,58]. Furthermore, the interpretation of LST by PLAND_imper, PLAND_water and PLAND_green generally tends to increase with increasing grid scale in spring, summer, and winter. This indicates that the effects of PLAND_imper, PLAND_water and PLAND_green on LST variability become stronger at larger spatial scales. This result is similar to other studies that used the same methodology. In a previous UHI study at Beijing, the correlation between impervious surface density and mean LST was found to increase as the grid size increased from 30 m to 960 m [59]. Another study in Bangkok, Jakarta and Manila showed that the correlation between impervious surface density and with mean LST increased with increasing grid size [52]. It has also been discovered that the impact of the building landscape index on LST grows with scale [60].
It is notable that the results of the stepwise regression analysis show that PLAND_imper has the greatest effect on the summer LST in Zhengzhou City at the spatial scale of 960 m × 960 m. This scale can be considered as an optimal characteristic area to mitigate the heat island effect in Zhengzhou City by changing the impervious surface. This result is different from some previous studies. A study of Phoenix, Arizona, concluded that the percentage of impervious surface has a direct effect on the maximum air temperature at 30 m space [61]. Another study in Bangkok, Jakarta and Manila considered for these studies that the optimal size for examining the best feature area for meteorological problems in urban areas is 210 m × 210 m [52]. We also recognize that the urban locations and climatic conditions of these studies are vastly different, for example, Zhengzhou in central China has a typical temperate continental monsoonal climate compared to Bangkok, Jakarta, Manila, which are located in coastal Southeast Asia with only wet and dry seasons throughout the year, and Phoenix, AZ, a desert city with long and extremely hot summers and short and mild winters. Another reason for this difference is the differing research methods, such as the use of maximum temperatures from different weather stations instead of LST for Phoenix, AZ.
4.4. Implication for the Future
Previous studies have shown that the observed temperature increase within cities has exceeded the predicted global temperature increase over the next few decades [62]. Urbanization has significantly influenced LST. While effective urban planning and landscape design can increase the resilience of cities to climate change to some extent [63,64,65]. Some studies have indicated that there is significant heterogeneity in the UHI effect within the same city and even between different cities [30,66]. This means that the city itself can provide an excellent natural laboratory for the study of the urban thermal environment. Therefore, this study analyzes the trend of urbanization in Zhengzhou city on urban LST and the driving factors behind the trend and provides effective ideas for the UHI effect from the perspective of landscape construction.
Reducing LST through landscape design has been proven to work well [67,68]. This study provides evidence for the influence of landscape composition and configuration on LST variability in Zhengzhou City. The results show that the main influences on LST in Zhengzhou are PLAND_imper, PLAND_water and PLAND_green, and their effects increase with the amount of urban spatial scale. This implies that spatial scale should receive greater attention if LST mitigation measures are developed, in addition to adjusting land cover types. In detail, urban planners and policy makers should consider the density of impervious surfaces, water bodies, and green spaces to mitigate Zhengzhou’s urban LST by reducing (or increasing), adjusting, and restructuring them. Since the impacts of PLAND_imper, PLAND_water, and PLAND_green on LST generally increase with spatial scale, we emphasize that Zhengzhou urban planning should also focus on larger spatial scales in order to maximize the cooling effect of land cover types and minimize their warming effects.
5. Conclusions
This study uses remote sensing satellite images to obtain land use and LST information, quantifies urbanization intensity based on the proportion of impervious surfaces in the grid and the distance to the urban center, and finally explores the relationship between urbanization and LST and the influencing factors through linear fitting and stepwise regression. First, we found that LST generally increased with urbanization intensity, which was extremely obvious in spring and summer, weak in winter, and followed a slight downward trend in autumn. Second, the PLAND index has the most significant effect on urban LST and varies significantly across spatial scales. At larger spatial scales, the effect of water bodies and impervious surface percentage on LST increases significantly in spring and summer, respectively. The same is the case for the effect of green space occupancy on winter LST. The results also suggest that large spatial scales (960 m × 960 m) are the most optimal characteristic areas for planning adjustments to urban land cover. Overall, this study explored the rule of LST variation with urbanization intensity, provided evidence of the influence of landscape pattern on LST in Zhengzhou city, and found differences in the influence of landscape structure on LST at different spatial scales. Therefore, by focusing on urbanization and LST, the results can provide important quantitative guidance and decision support for UHI mitigation and sustainable urban planning.
In addition, the study did not use perfectly timed satellite images due to weather and satellite imaging cycles, which may have affected the results to a certain extent. Meanwhile, this study only analyzed the influencing factors of urbanization-LST trends from the perspective of landscape structure. In fact, the urban environment is more complex. Urban natural factors and socio-economic factors can also have an impact on urbanization-LST trends. Therefore, in future studies, urbanization-LST trends can be analyzed with long time series and multi-temporal data, and attempts can be made to incorporate more influencing factors into the driver analysis and to analyze the impact of urbanization on LST more comprehensively and conclude practical measures to mitigate UHI.
Author Contributions
Conceptualization, C.D., P.S. and S.G.; methodology, P.S., S.G.; software, C.D., P.S., S.G.; validation, K.W., A.L. and Y.H.; formal analysis, K.Z., X.J.; investigation, C.D., X.J.; resources, S.G., P.S.; data curation, C.D.; writing—original draft preparation, C.D.; writing—review and editing, S.G., P.S., K.W., A.L. and Y.H.; visualization, C.D., K.Z. and Y.H.; supervision, S.G., K.W.; project administration, Y.F., M.W., K.Q. and Y.Z.; funding acquisition, S.G., K.W. All authors have read and agreed to the published version of the manuscript.
Funding
This study was supported by the National Natural Science Foundation of China (52208056), the Key Technology R&D Program of Henan Province (212102310838), and the Special Fund for Young Talents in Henan Agricultural University (30500930 and 30501053).
Institutional Review Board Statement
Not applicable.
Informed Consent Statement
Not applicable.
Data Availability Statement
The data presented in this study are available on request from the first author.
Acknowledgments
We would like to thank the education of the College of Landscape Architecture and Arts of Henan Agricultural University and the support of the International Joint Laboratory of Landscape Architecture, Henan Agricultural University. We also thank The US Geological Survey for sharing the data.
Conflicts of Interest
The authors declare no conflict of interest.
References
- Li, Y.; Zhao, M.; Motesharrei, S.; Mu, Q.; Kalnay, E.; Li, S. Local cooling and warming effects of forests based on satellite observations. Nat. Commun. 2015, 6, 6603. [Google Scholar] [CrossRef]
- Rhee, J.; Park, S.; Lu, Z. Relationship between land cover patterns and surface temperature in urban areas. GISci. Remote Sens. 2014, 51, 521–536. [Google Scholar] [CrossRef]
- Daba, M.H.; You, S. Quantitatively Assessing the Future Land-Use/Land-Cover Changes and Their Driving Factors in the Upper Stream of the Awash River Based on the CA–Markov Model and Their Implications for Water Resources Management. Sustainability 2022, 14, 1538. [Google Scholar] [CrossRef]
- Oke, T.R. The energetic basis of the urban heat island. Q.J. R. Met. Soc. 1982, 108, 1–24. [Google Scholar] [CrossRef]
- Merte, S. Estimating heat wave-related mortality in Europe using singular spectrum analysis. Clim. Change 2017, 142, 321–330. [Google Scholar] [CrossRef]
- Ning, G.; Luo, M.; Zhang, W.; Liu, Z.; Wang, S.; Gao, T. Rising risks of compound extreme heat-precipitation events in China. Int. J. Climatol. 2022, 42, 5785–5795. [Google Scholar] [CrossRef]
- Wang, D.; Lau, K.K.-L.; Ren, C.; Goggins, W.B.I.; Shi, Y.; Ho, H.C.; Lee, T.-C.; Lee, L.-S.; Woo, J.; Ng, E. The impact of extremely hot weather events on all-cause mortality in a highly urbanized and densely populated subtropical city: A 10-year time-series study (2006–2015). Sci. Total Environ. 2019, 690, 923–931. [Google Scholar] [CrossRef]
- Zhao, L.; Lee, X.; Smith, R.B.; Oleson, K. Strong contributions of local background climate to urban heat islands. Nature 2014, 511, 216–219. [Google Scholar] [CrossRef]
- Wang, J.; Yan, Z. Rapid rises in the magnitude and risk of extreme regional heat wave events in China. Weather Clim. Extrem. 2021, 34, 100379. [Google Scholar] [CrossRef]
- DESA/UN-WUP. World Urbanization Prospects: The 2018 Revision. Dep. Econ. Soc. Aff. 2018. Available online: https://population.un.org/wup/publications/Files/WUP2018-Report.pdf (accessed on 28 August 2022).
- Gong, P.; Li, X.; Wang, J.; Bai, Y.; Chen, B.; Hu, T.; Liu, X.; Xu, B.; Yang, J.; Zhang, W.; et al. Annual maps of global artificial impervious area (GAIA) between 1985 and 2018. Remote Sens. Environ. 2020, 236, 111510. [Google Scholar] [CrossRef]
- Huang, X.; Xia, J.; Xiao, R.; He, T. Urban expansion patterns of 291 Chinese cities, 1990–2015. Int. J. Digit. Earth 2019, 12, 62–77. [Google Scholar] [CrossRef]
- Sun, Y.; Zhang, X.; Ren, G.; Zwiers, F.W.; Hu, T. Contribution of urbanization to warming in China. Nat. Clim Change 2016, 6, 706–709. [Google Scholar] [CrossRef]
- Chao, Z.; Wang, L.; Che, M.; Hou, S. Effects of Different Urbanization Levels on Land Surface Temperature Change: Taking Tokyo and Shanghai for Example. Remote Sens. 2020, 12, 2022. [Google Scholar] [CrossRef]
- Chen, W.; Zhang, Y.; Pengwang, C.; Gao, W. Evaluation of Urbanization Dynamics and its Impacts on Surface Heat Islands: A Case Study of Beijing, China. Remote Sens. 2017, 9, 453. [Google Scholar] [CrossRef]
- Guo, Z.; Wang, S.D.; Cheng, M.M.; Shu, Y. Assess the effect of different degrees of urbanization on land surface temperature using remote sensing images. Procedia Environ. Sci. 2012, 13, 935–942. [Google Scholar] [CrossRef]
- Ren, G.; Zhou, Y.; Chu, Z.; Zhou, J.; Zhang, A.; Guo, J.; Liu, X. Urbanization Effects on Observed Surface Air Temperature Trends in North China. J. Clim. 2008, 21, 1333–1348. [Google Scholar] [CrossRef]
- Wu, K.; Yang, X. Urbanization and heterogeneous surface warming in eastern China. Chin. Sci. Bull. 2013, 58, 1363–1373. [Google Scholar] [CrossRef]
- Yu, W.; Shi, J.; Fang, Y.; Xiang, A.; Li, X.; Hu, C.; Ma, M. Exploration of urbanization characteristics and their effect on the urban thermal environment in Chengdu, China. Build. Environ. 2022, 219, 109150. [Google Scholar] [CrossRef]
- Jones, P.D.; Lister, D.H.; Li, Q. Urbanization effects in large-scale temperature records, with an emphasis on China. J. Geophys. Res. 2008, 113, D16122. [Google Scholar] [CrossRef]
- Jin, M.; Dickinson, R.E.; Zhang, D. The Footprint of Urban Areas on Global Climate as Characterized by MODIS. J. Clim. 2005, 18, 1551–1565. [Google Scholar] [CrossRef]
- Li, J.; Song, C.; Cao, L.; Zhu, F.; Meng, X.; Wu, J. Impacts of landscape structure on surface urban heat islands: A case study of Shanghai, China. Remote Sens. Environ. 2011, 115, 3249–3263. [Google Scholar] [CrossRef]
- Chapman, S.; Watson, J.E.M.; Salazar, A.; Thatcher, M.; McAlpine, C.A. The impact of urbanization and climate change on urban temperatures: A systematic review. Landsc. Ecol. 2017, 32, 1921–1935. [Google Scholar] [CrossRef]
- Du, H.; Wang, D.; Wang, Y.; Zhao, X.; Qin, F.; Jiang, H.; Cai, Y. Influences of land cover types, meteorological conditions, anthropogenic heat and urban area on surface urban heat island in the Yangtze River Delta Urban Agglomeration. Sci. Total Environ. 2016, 571, 461–470. [Google Scholar] [CrossRef] [PubMed]
- Yu, Z.; Guo, X.; Zeng, Y.; Koga, M.; Vejre, H. Variations in land surface temperature and cooling efficiency of green space in rapid urbanization: The case of Fuzhou city, China. Urban For. Urban Green. 2018, 29, 113–121. [Google Scholar] [CrossRef]
- Wang, X.; Sun, X.; Tang, J.; Yang, X. Urbanization-induced regional warming in Yangtze River Delta: Potential role of anthropogenic heat release: Anthropogenic heat-caused regional warming in yangtze river delta. Int. J. Climatol. 2015, 35, 4417–4430. [Google Scholar] [CrossRef]
- Mu, B.; Mayer, A.L.; He, R.; Tian, G. Land use dynamics and policy implications in Central China: A case study of Zhengzhou. Cities 2016, 58, 39–49. [Google Scholar] [CrossRef]
- Min, M.; Zhao, H.; Miao, C. Spatio-Temporal Evolution Analysis of the Urban Heat Island: A Case Study of Zhengzhou City, China. Sustainability 2018, 10, 1992. [Google Scholar] [CrossRef]
- Liu, H.; Weng, Q. Scaling Effect on the Relationship between Landscape Pattern and Land Surface Temperature: A Case Study of Indianapolis, United States. Photogramm. Photogramm. Eng. 2009, 14, 291–304. [Google Scholar] [CrossRef]
- Jia, W.; Zhao, S. Trends and drivers of land surface temperature along the urban-rural gradients in the largest urban agglomeration of China. Sci. Total Environ. 2020, 711, 134579. [Google Scholar] [CrossRef]
- Chow, W.T.L.; Roth, M. Temporal dynamics of the urban heat island of Singapore. Int. J. Climatol. 2006, 26, 2243–2260. [Google Scholar] [CrossRef]
- Li, H.; Wang, G.; Tian, G.; Jombach, S. Mapping and Analyzing the Park Cooling Effect on Urban Heat Island in an Expanding City: A Case Study in Zhengzhou City, China. Land 2020, 9, 57. [Google Scholar] [CrossRef]
- Li, S.; Qin, Z.; Zhao, S.; Gao, M.; Li, S.; Liao, Q.; Du, W. Spatiotemporal Variation of Land Surface Temperature in Henan Province of China from 2003 to 2021. Land 2022, 11, 1104. [Google Scholar] [CrossRef]
- Li, Y.; Zhao, Z.; Xin, Y.; Xu, A.; Xie, S.; Yan, Y.; Wang, L. How Are Land-Use/Land-Cover Indices and Daytime and Nighttime Land Surface Temperatures Related in Eleven Urban Centres in Different Global Climatic Zones? Land 2022, 11, 1312. [Google Scholar] [CrossRef]
- Shi, Y.; Liu, S.; Yan, W.; Zhao, S.; Ning, Y.; Peng, X.; Chen, W.; Chen, L.; Hu, X.; Fu, B.; et al. Influence of landscape features on urban land surface temperature: Scale and neighborhood effects. Sci. Total Environ. 2021, 771, 145381. [Google Scholar] [CrossRef] [PubMed]
- Zhengzhou City Population Development Report 2021—Zhengzhou Bureau of Statistics. Available online: http://tjj.zhengzhou.gov.cn/tjgb/6490689.jhtml (accessed on 28 August 2022).
- Henan Statistical Yearbook. 2021. Available online: https://oss.henan.gov.cn/sbgt-wztipt/attachment/hntjj/hntj/lib/tjnj/2021nj/zk/indexch.htm (accessed on 28 August 2022).
- Yu, X.; Guo, X.; Wu, Z. Land Surface Temperature Retrieval from Landsat 8 TIRS—Comparison between Radiative Transfer Equation-Based Method, Split Window Algorithm and Single Channel Method. Remote Sens. 2014, 6, 9829–9852. [Google Scholar] [CrossRef]
- Sobrino, J.A.; Jiménez-Muñoz, J.C.; Paolini, L. Land surface temperature retrieval from LANDSAT TM 5. Remote Sens. Environ. 2004, 90, 434–440. [Google Scholar] [CrossRef]
- Wang, Z.; Mao, P.; Yang, H.; Zhao, Y.; He, T.; Dawson, R.J.; Li, Z. Measuring the Urban Land Surface Temperature Variations in Zhengzhou City Using the Landsat-Like Data. Earth Sci. 2018, 2018090192. [Google Scholar] [CrossRef]
- Yang, H.; Xi, C.; Zhao, X.; Mao, P.; Wang, Z.; Shi, Y.; He, T.; Li, Z. Measuring the Urban Land Surface Temperature Variations Under Zhengzhou City Expansion Using Landsat-Like Data. Remote Sens. 2020, 12, 801. [Google Scholar] [CrossRef]
- Zhao, H.; Ren, Z.; Tan, J. The Spatial Patterns of Land Surface Temperature and Its Impact Factors: Spatial Non-Stationarity and Scale Effects Based on a Geographically-Weighted Regression Model. Sustainability 2018, 10, 2242. [Google Scholar] [CrossRef]
- Mathew, A.; Khandelwal, S.; Kaul, N. Spatial and temporal variations of urban heat island effect and the effect of percentage impervious surface area and elevation on land surface temperature: Study of Chandigarh city, India. Sustain. Cities Soc. 2016, 26, 264–277. [Google Scholar] [CrossRef]
- Cai, Q.; Li, E.; Jiang, R. Analysis of the Relationship Between Land Surface Temperature and Land Cover Changes Using Multi-temporal Satellite Data. Nat. Environ. Pollut. Technol. 2017, 16, 8. [Google Scholar]
- Ouyang, Z.; Sciusco, P.; Jiao, T.; Feron, S.; Lei, C.; Li, F.; John, R.; Fan, P.; Li, X.; Williams, C.A.; et al. Albedo changes caused by future urbanization contribute to global warming. Nat. Commun. 2022, 13, 3800. [Google Scholar] [CrossRef] [PubMed]
- Elshater, A.; Abusaada, H.; Alfiky, A.; El-Bardisy, N.; Elmarakby, E.; Grant, S. Workers’ Satisfaction vis-à-vis Environmental and Socio-Morphological Aspects for Sustainability and Decent Work. Sustainability 2022, 14, 1699. [Google Scholar] [CrossRef]
- Mokoena, R.; Mturi, G.; Maritz, J.; Mateyisi, M.; Klein, P. African Case Studies: Developing Pavement Temperature Maps for Performance-Graded Asphalt Bitumen Selection. Sustainability 2022, 14, 1048. [Google Scholar] [CrossRef]
- Fonseka, H.P.U.; Zhang, H.; Sun, Y.; Su, H.; Lin, H.; Lin, Y. Urbanization and Its Impacts on Land Surface Temperature in Colombo Metropolitan Area, Sri Lanka, from 1988 to 2016. Remote Sens. 2019, 11, 957. [Google Scholar] [CrossRef]
- Yuan, F.; Bauer, M.E. Comparison of impervious surface area and normalized difference vegetation index as indicators of surface urban heat island effects in Landsat imagery. Remote Sens. Environ. 2007, 106, 375–386. [Google Scholar] [CrossRef]
- Zhang, Y.; Odeh, I.O.A.; Han, C. Bi-temporal characterization of land surface temperature in relation to impervious surface area, NDVI and NDBI, using a sub-pixel image analysis. Int. J. Appl. Earth Obs. Geoinf. 2009, 11, 256–264. [Google Scholar] [CrossRef]
- Zhang, Z.; Ji, M.; Shu, J.; Deng, Z.; Wu, Y. Surface urban heat island in shanghai, china: Examining the relationship between land surface temperature and impervious surface fractions derived from landsat etm+ imagery. Remote Sens. Spat. Inf. Sci. 2008, 37, 601–606. [Google Scholar]
- Estoque, R.C.; Murayama, Y.; Myint, S.W. Effects of landscape composition and pattern on land surface temperature: An urban heat island study in the megacities of Southeast Asia. Sci. Total Environ. 2017, 577, 349–359. [Google Scholar] [CrossRef]
- Bian, T.; Ren, G.; Yue, Y. Effect of Urbanization on Land-Surface Temperature at an Urban Climate Station in North China. Bound. Layer Meteorol. 2017, 165, 553–567. [Google Scholar] [CrossRef]
- Wang, S.; Ju, W.; Peñuelas, J.; Cescatti, A.; Zhou, Y.; Fu, Y.; Huete, A.; Liu, M.; Zhang, Y. Urban−rural gradients reveal joint control of elevated CO2 and temperature on extended photosynthetic seasons. Nat. Ecol. Evol 2019, 3, 1076–1085. [Google Scholar] [CrossRef] [PubMed]
- White, M.A.; Nemani, R.R.; Thornton, P.E.; Running, S.W. Satellite Evidence of Phenological Differences Between Urbanized and Rural Areas of the Eastern United States Deciduous Broadleaf Forest. Ecosystems 2002, 5, 260–273. [Google Scholar] [CrossRef]
- Zhang, X.; Friedl, M.A.; Schaaf, C.B.; Strahler, A.H.; Schneider, A. The footprint of urban climates on vegetation phenology: Footprint of urban climates on vegetation. Geophys. Res. Lett. 2004, 31, 1–4. [Google Scholar] [CrossRef]
- Chen, A.; Yao, L.; Sun, R.; Chen, L. How many metrics are required to identify the effects of the landscape pattern on land surface temperature? Ecol. Indic. 2014, 45, 424–433. [Google Scholar] [CrossRef]
- Zhou, W.; Qian, Y.; Li, X.; Li, W.; Han, L. Relationships between land cover and the surface urban heat island: Seasonal variability and effects of spatial and thematic resolution of land cover data on predicting land surface temperatures. Landsc. Ecol. 2014, 29, 153–167. [Google Scholar] [CrossRef]
- Xiao, R.; Ouyang, Z.; Zheng, H.; Li, W.; Schienke, E.W.; Wang, X. Spatial pattern of impervious surfaces and their impacts on land surface temperature in Beijing, China. J. Environ. Sci. 2007, 19, 250–256. [Google Scholar] [CrossRef]
- Xiao, R.; Cao, W.; Liu, Y.; Lu, B. The impacts of landscape patterns spatio-temporal changes on land surface temperature from a multi-scale perspective: A case study of the Yangtze River Delta. Sci. Total Environ. 2022, 821, 153381. [Google Scholar] [CrossRef] [PubMed]
- Myint, S.W.; Brazel, A.; Okin, G.; Buyantuyev, A. Combined Effects of Impervious Surface and Vegetation Cover on Air Temperature Variations in a Rapidly Expanding Desert City. GISci. Remote Sens. 2010, 47, 301–320. [Google Scholar] [CrossRef]
- Grimm, N.B.; Faeth, S.H.; Golubiewski, N.E.; Redman, C.L.; Wu, J.; Bai, X.; Briggs, J.M. Global Change and the Ecology of Cities. Science 2008, 319, 756–760. [Google Scholar] [CrossRef]
- De Jong, M.; Joss, S.; Schraven, D.; Zhan, C.; Weijnen, M. Sustainable–smart–resilient–low carbon–eco–knowledge cities; making sense of a multitude of concepts promoting sustainable urbanization. J. Clean. Prod. 2015, 109, 25–38. [Google Scholar] [CrossRef]
- Leichenko, R. Climate change and urban resilience. Curr. Opin. Environ. Sustain. 2011, 3, 164–168. [Google Scholar] [CrossRef]
- Tyler, S.; Moench, M. A framework for urban climate resilience. Clim. Dev. 2012, 4, 311–326. [Google Scholar] [CrossRef]
- Zhou, D.; Bonafoni, S.; Zhang, L.; Wang, R. Remote sensing of the urban heat island effect in a highly populated urban agglomeration area in East China. Sci. Total Environ. 2018, 628–629, 415–429. [Google Scholar] [CrossRef] [PubMed]
- Hou, H.; Estoque, R.C. Detecting Cooling Effect of Landscape from Composition and Configuration: An Urban Heat Island Study on Hangzhou. Urban For. Urban Green. 2020, 53, 126719. [Google Scholar] [CrossRef]
- Yu, Z.; Yang, G.; Zuo, S.; Jørgensen, G.; Koga, M.; Vejre, H. Critical review on the cooling effect of urban blue-green space: A threshold-size perspective. Urban For. Urban Green. 2020, 49, 126630. [Google Scholar] [CrossRef]


Publisher’s Note: MDPI stays neutral with regard to jurisdictional claims in published maps and institutional affiliations. |
© 2022 by the authors. Licensee MDPI, Basel, Switzerland. This article is an open access article distributed under the terms and conditions of the Creative Commons Attribution (CC BY) license (https://creativecommons.org/licenses/by/4.0/).