


Exploring the Visual Guidance of Motor Imagery in Sustainable Brain–Computer Interfaces


Abstract
1. Introduction
- We demonstrate that the brain activity and mental load during MI have significant differences among the three levels of abstraction of visual guidance. Our results suggest that suitable visual guidance would help users to increase brain activity and reduce mental load during MI.
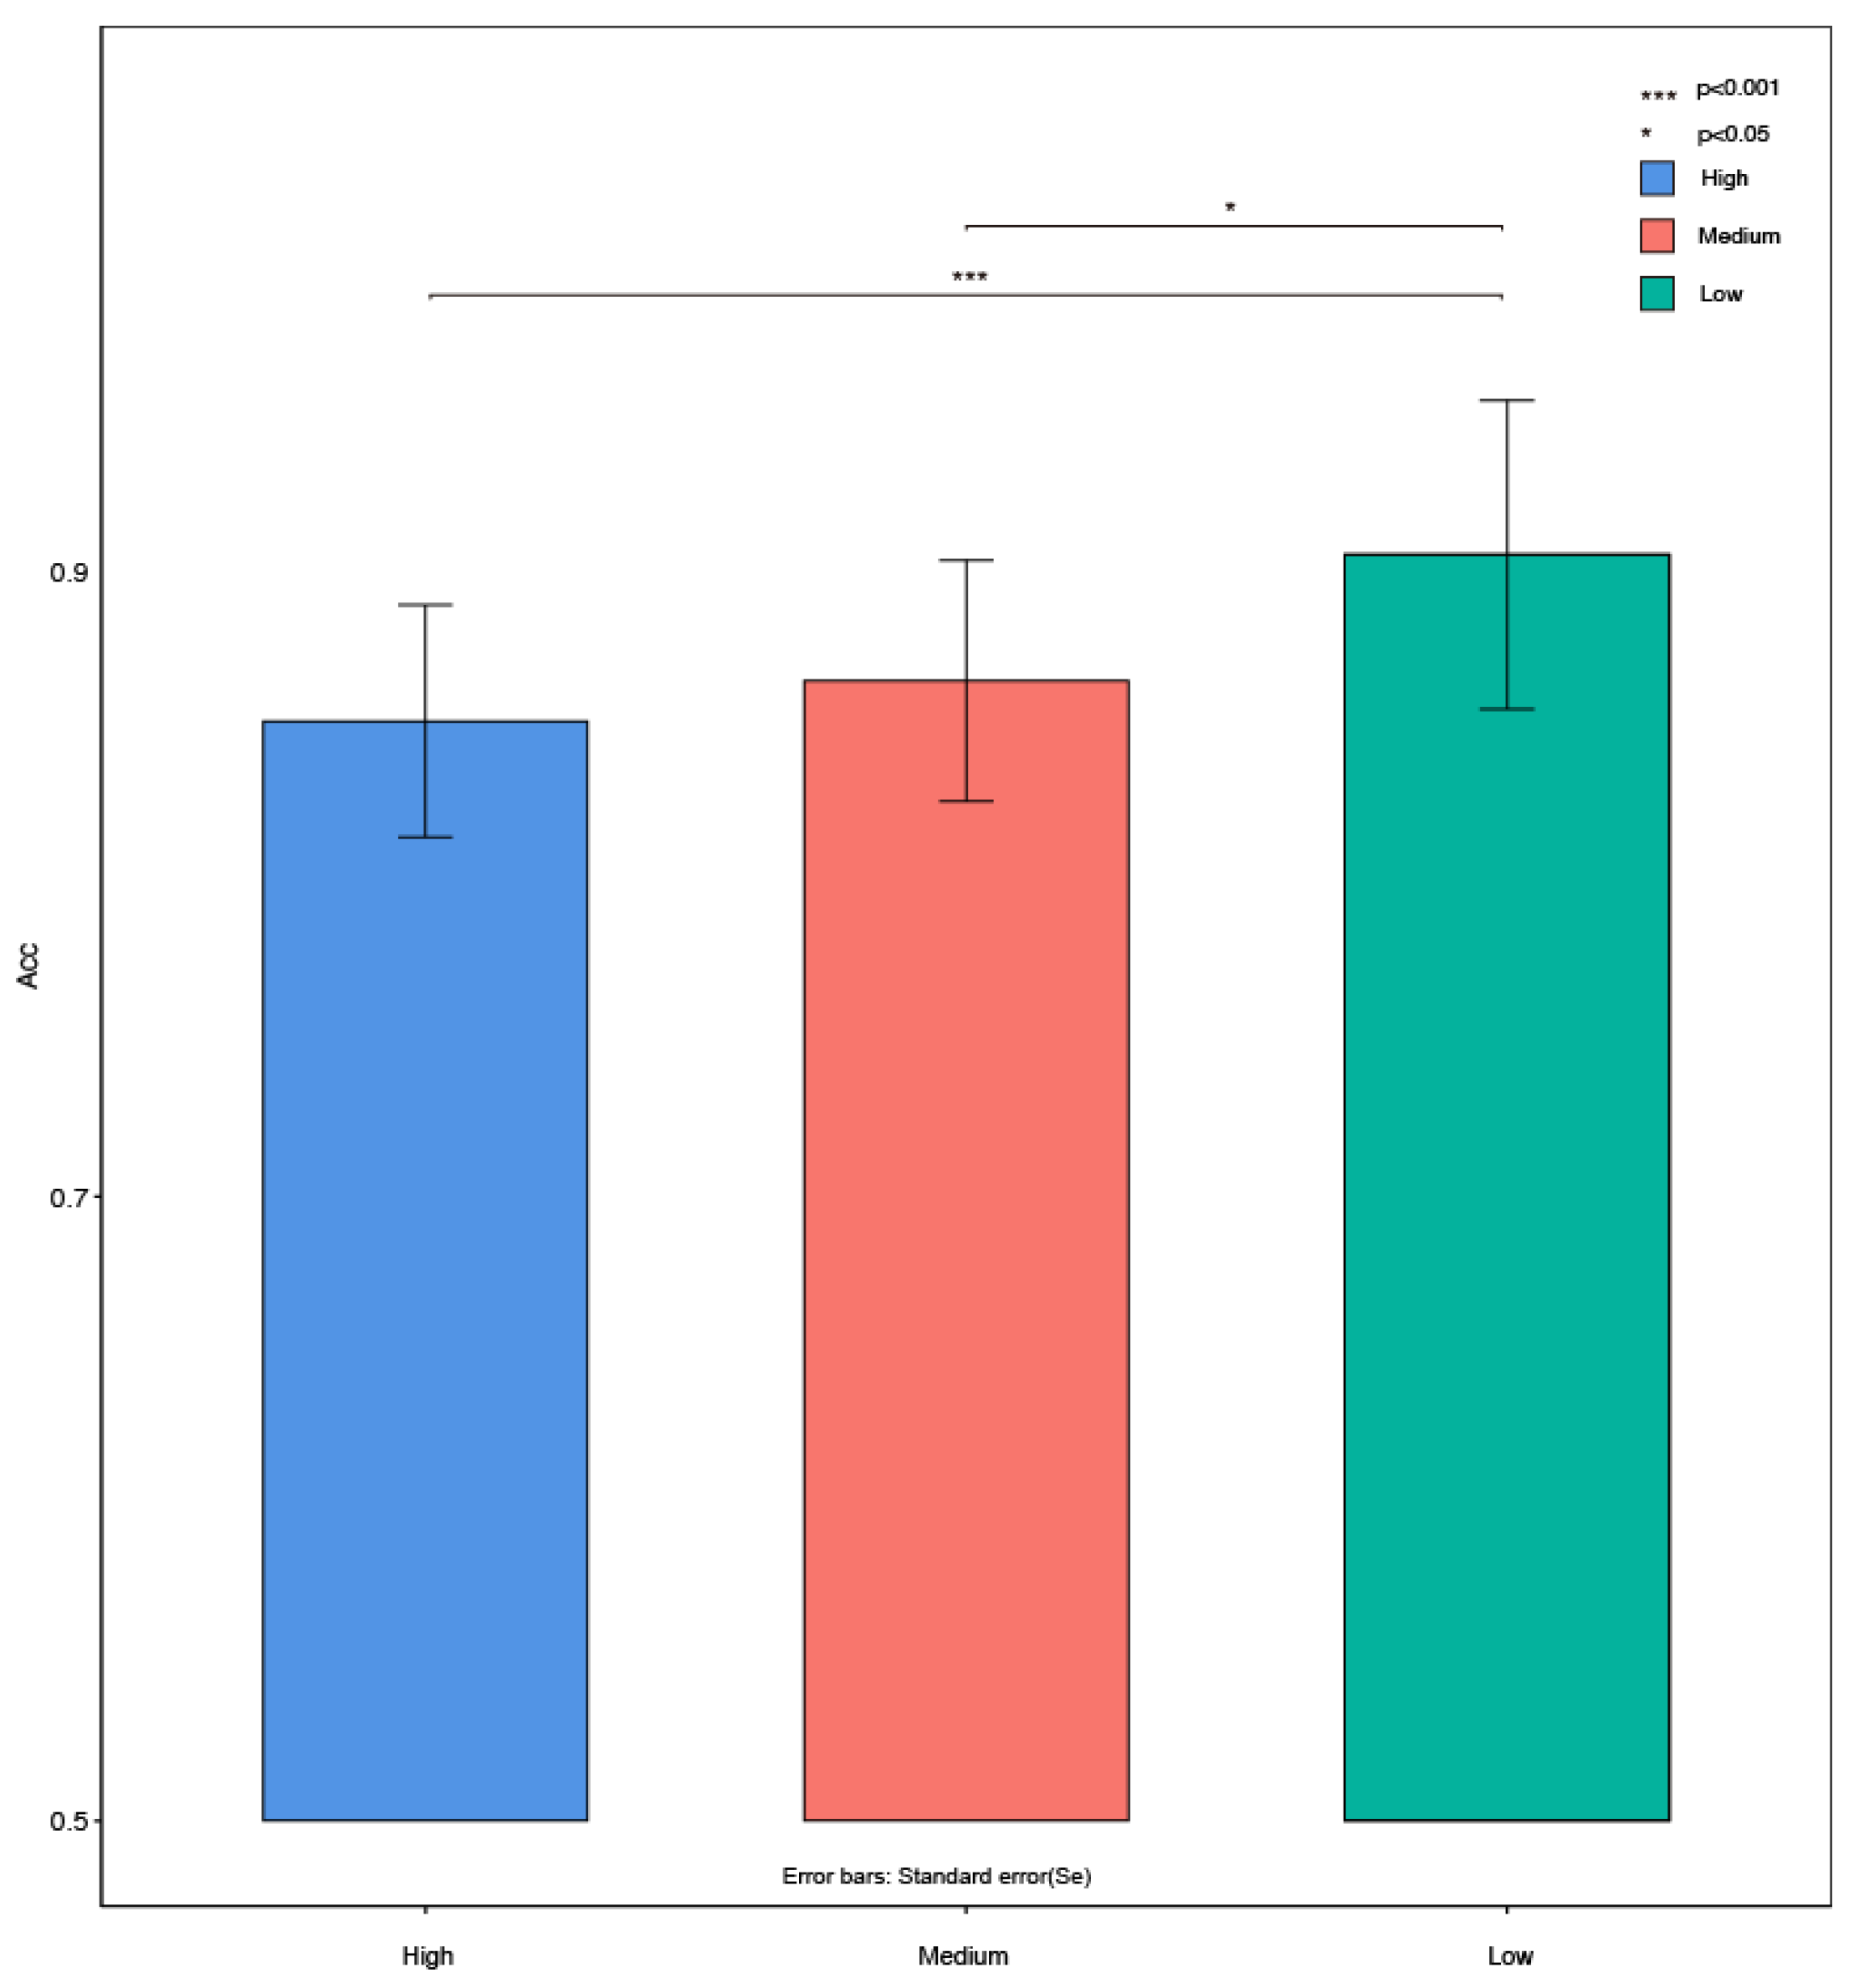
- We provide evidence that a low level of abstraction of visual guidance influences the classification accuracy of MI-BCI compared with the high-abstraction paradigm. Our findings suggest that suitable visual guidance would help users to achieve better classification performance on MI-BCI.
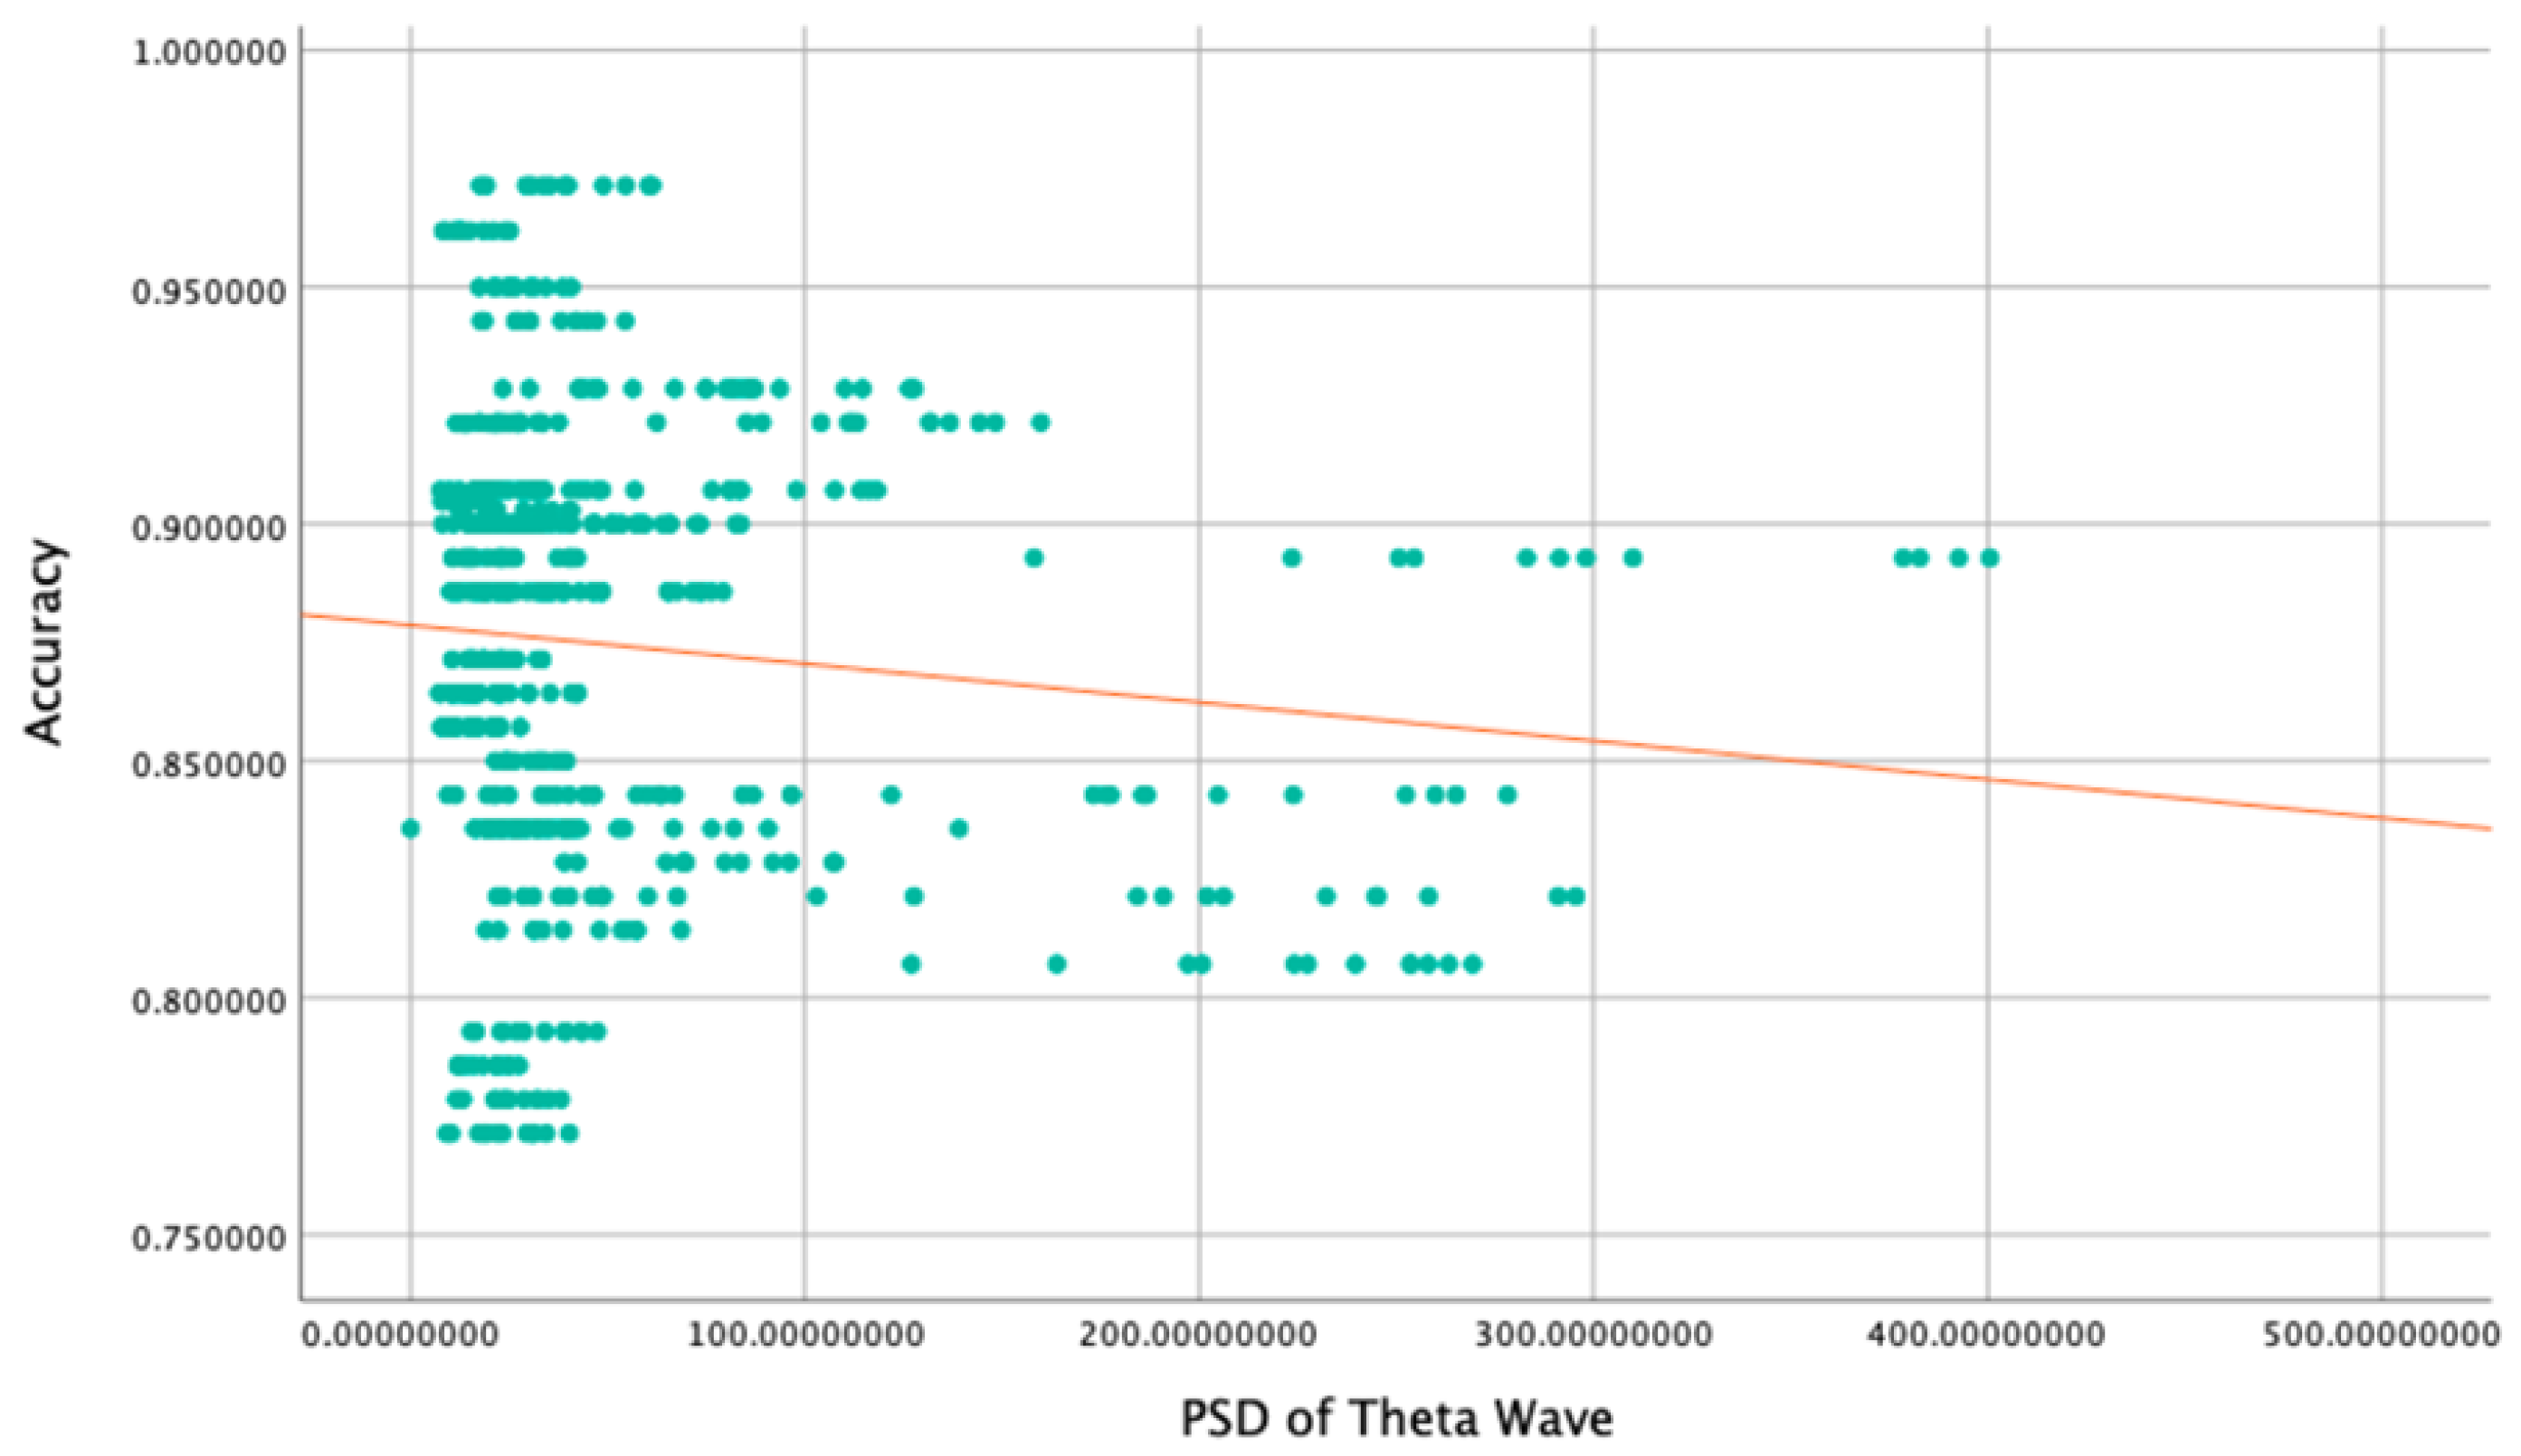
- We propose that brain activity and mental load correlate with the classification accuracy of MI-BCI. Our results suggest that suitable visual guidance would help both the user and the machine for sustainable system work.
2. Related Work
2.1. Related Work of MI-BCI
2.2. Related Work of Mental Load
3. Experiments
3.1. Research Objectives
3.2. Research Hypothesis
3.3. Subjects and Data Acquisition
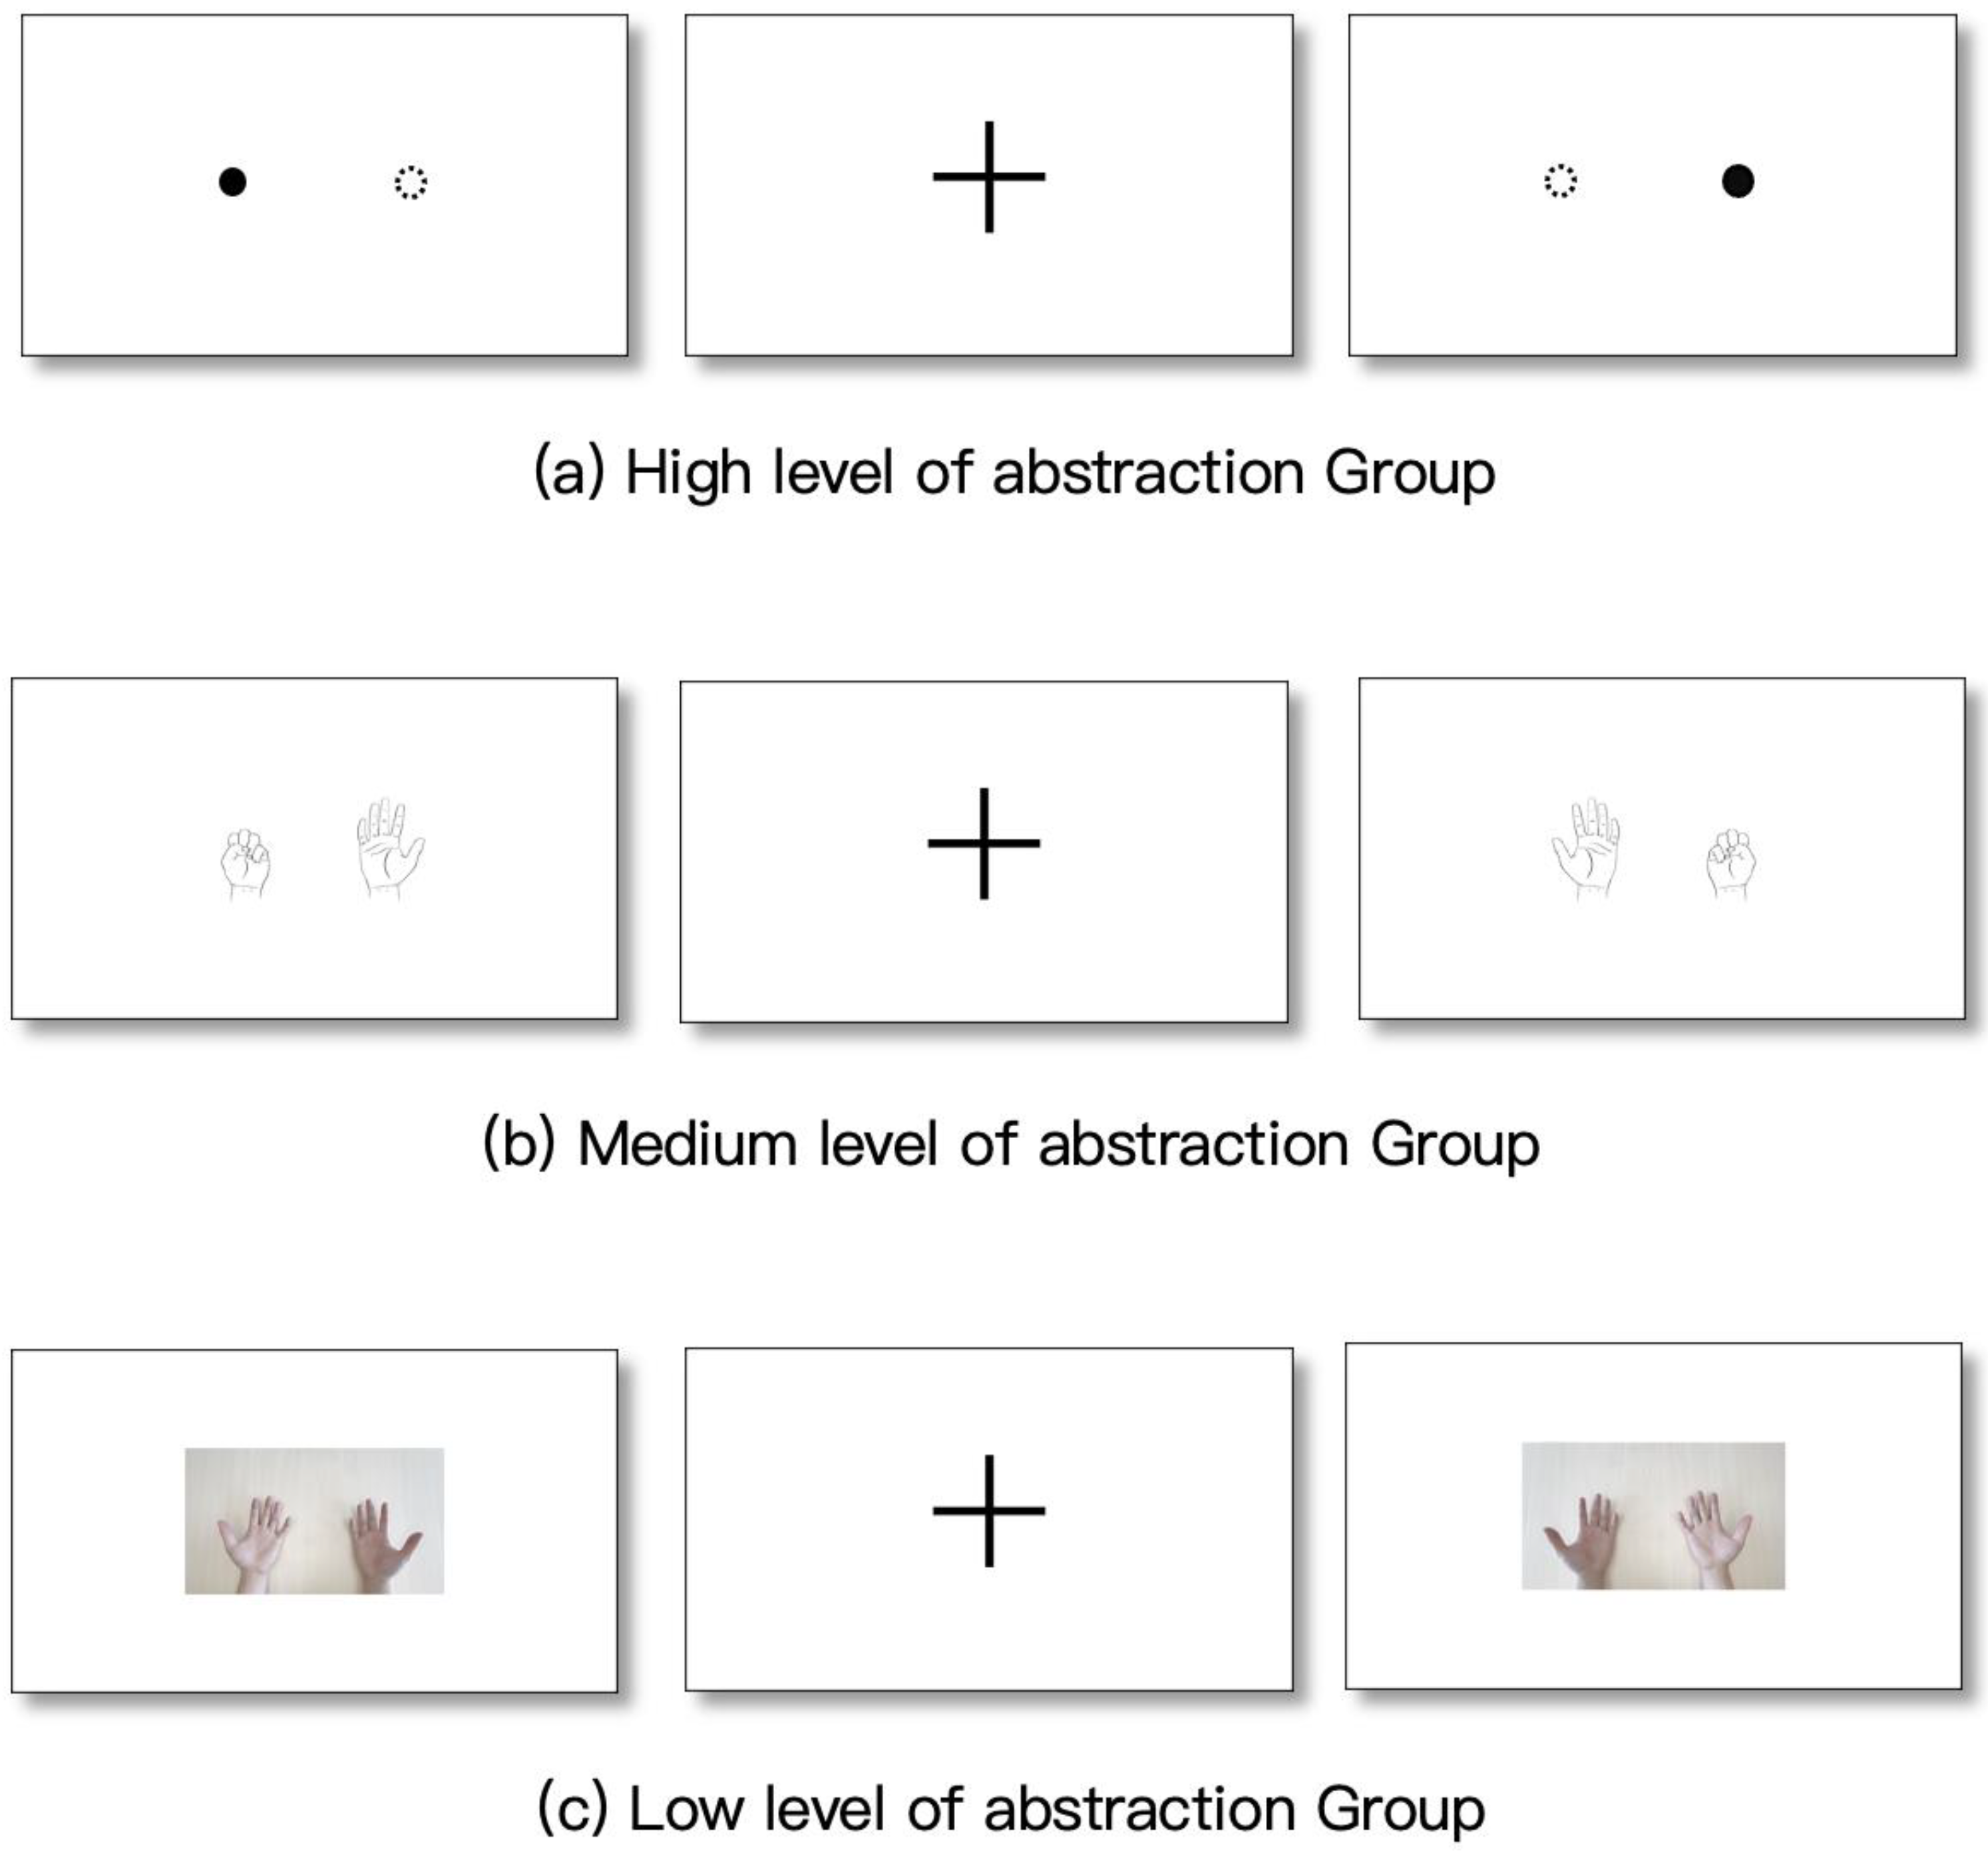
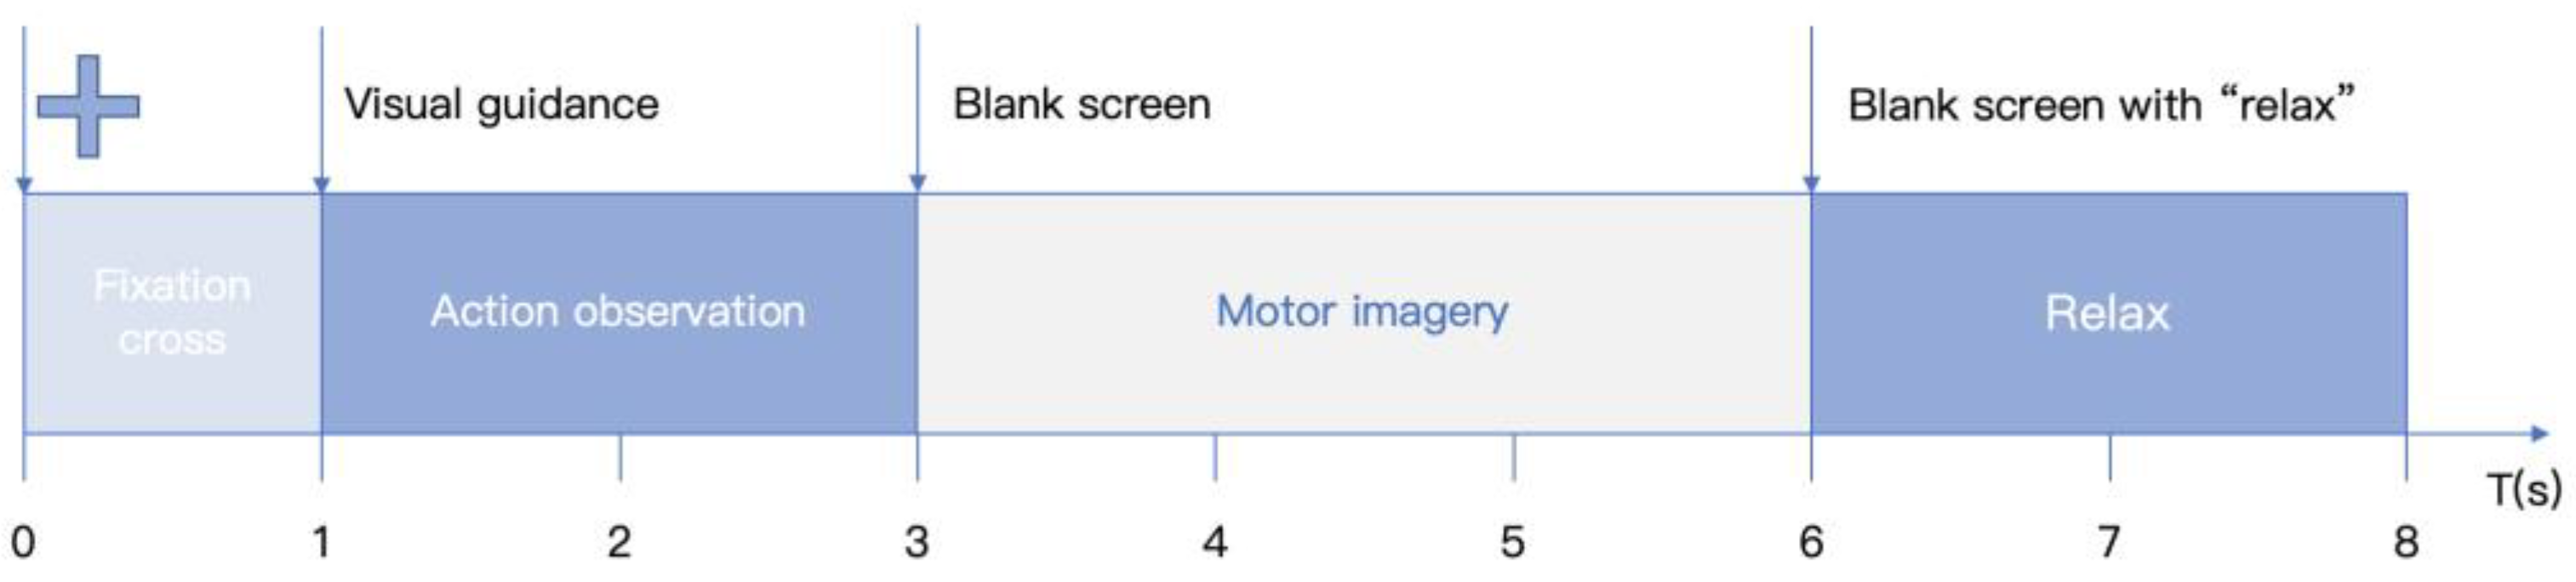
3.4. Experimental Procedure
3.5. EEG Signal Recording and Data Pre-Processing
3.6. Measurements
3.6.1. ERD Measurements
3.6.2. Mental Load Measurement
3.7. Classification and Data Analysis
3.7.1. SVM Classification
3.7.2. Statistical Analysis
4. Results
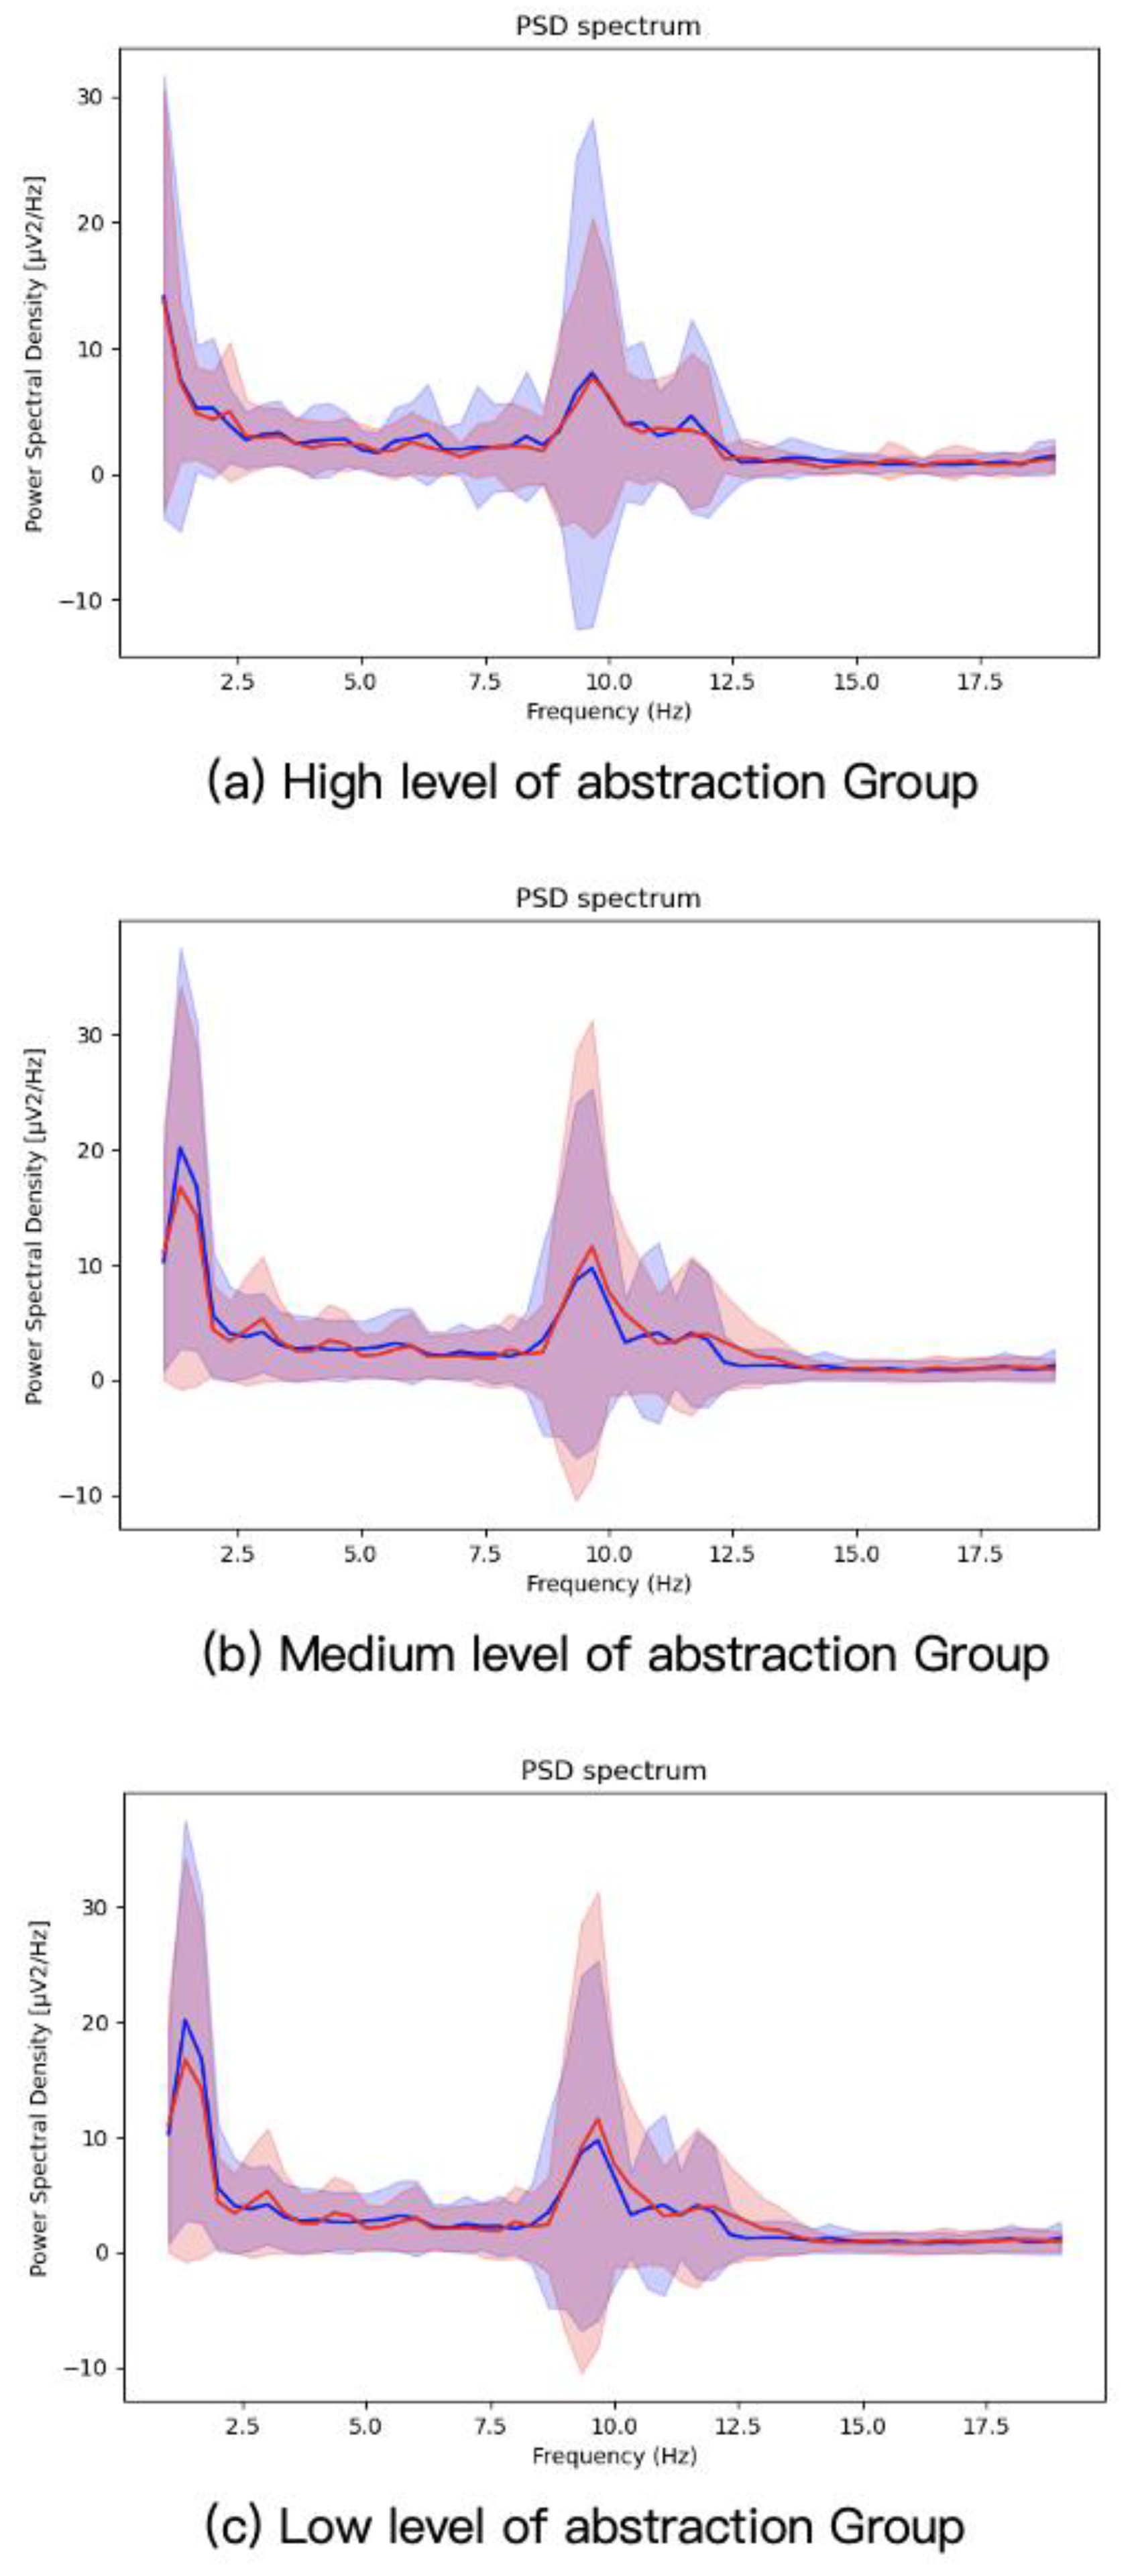
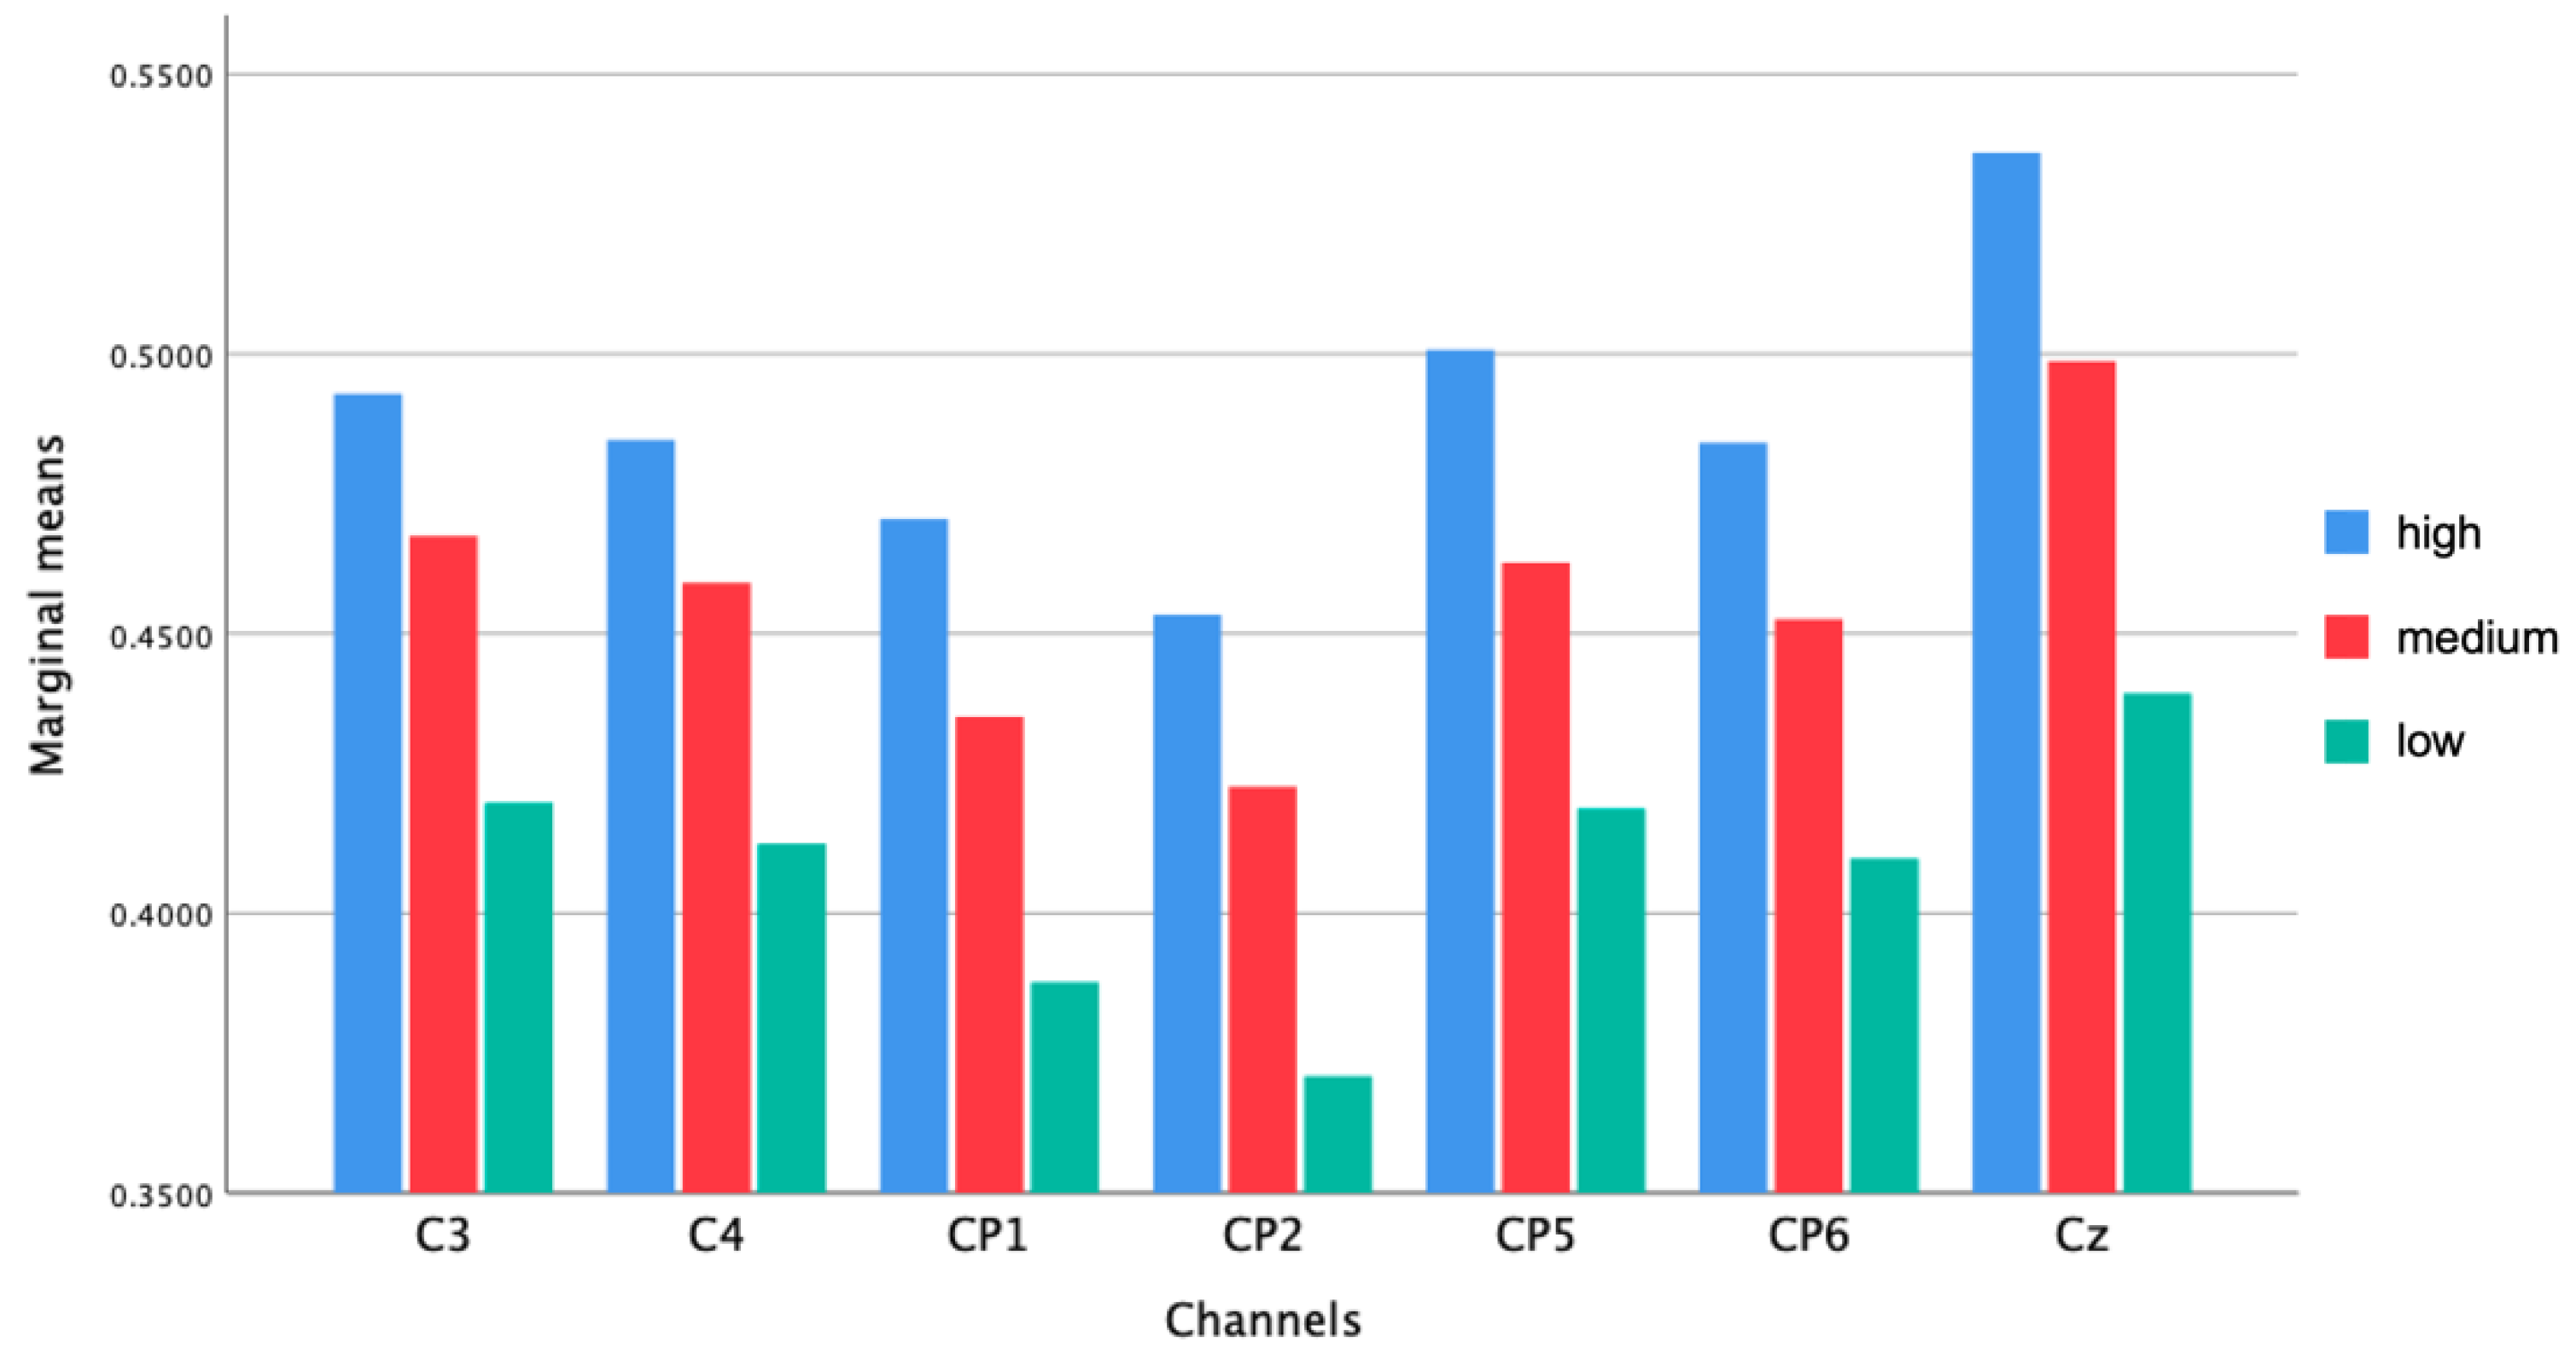
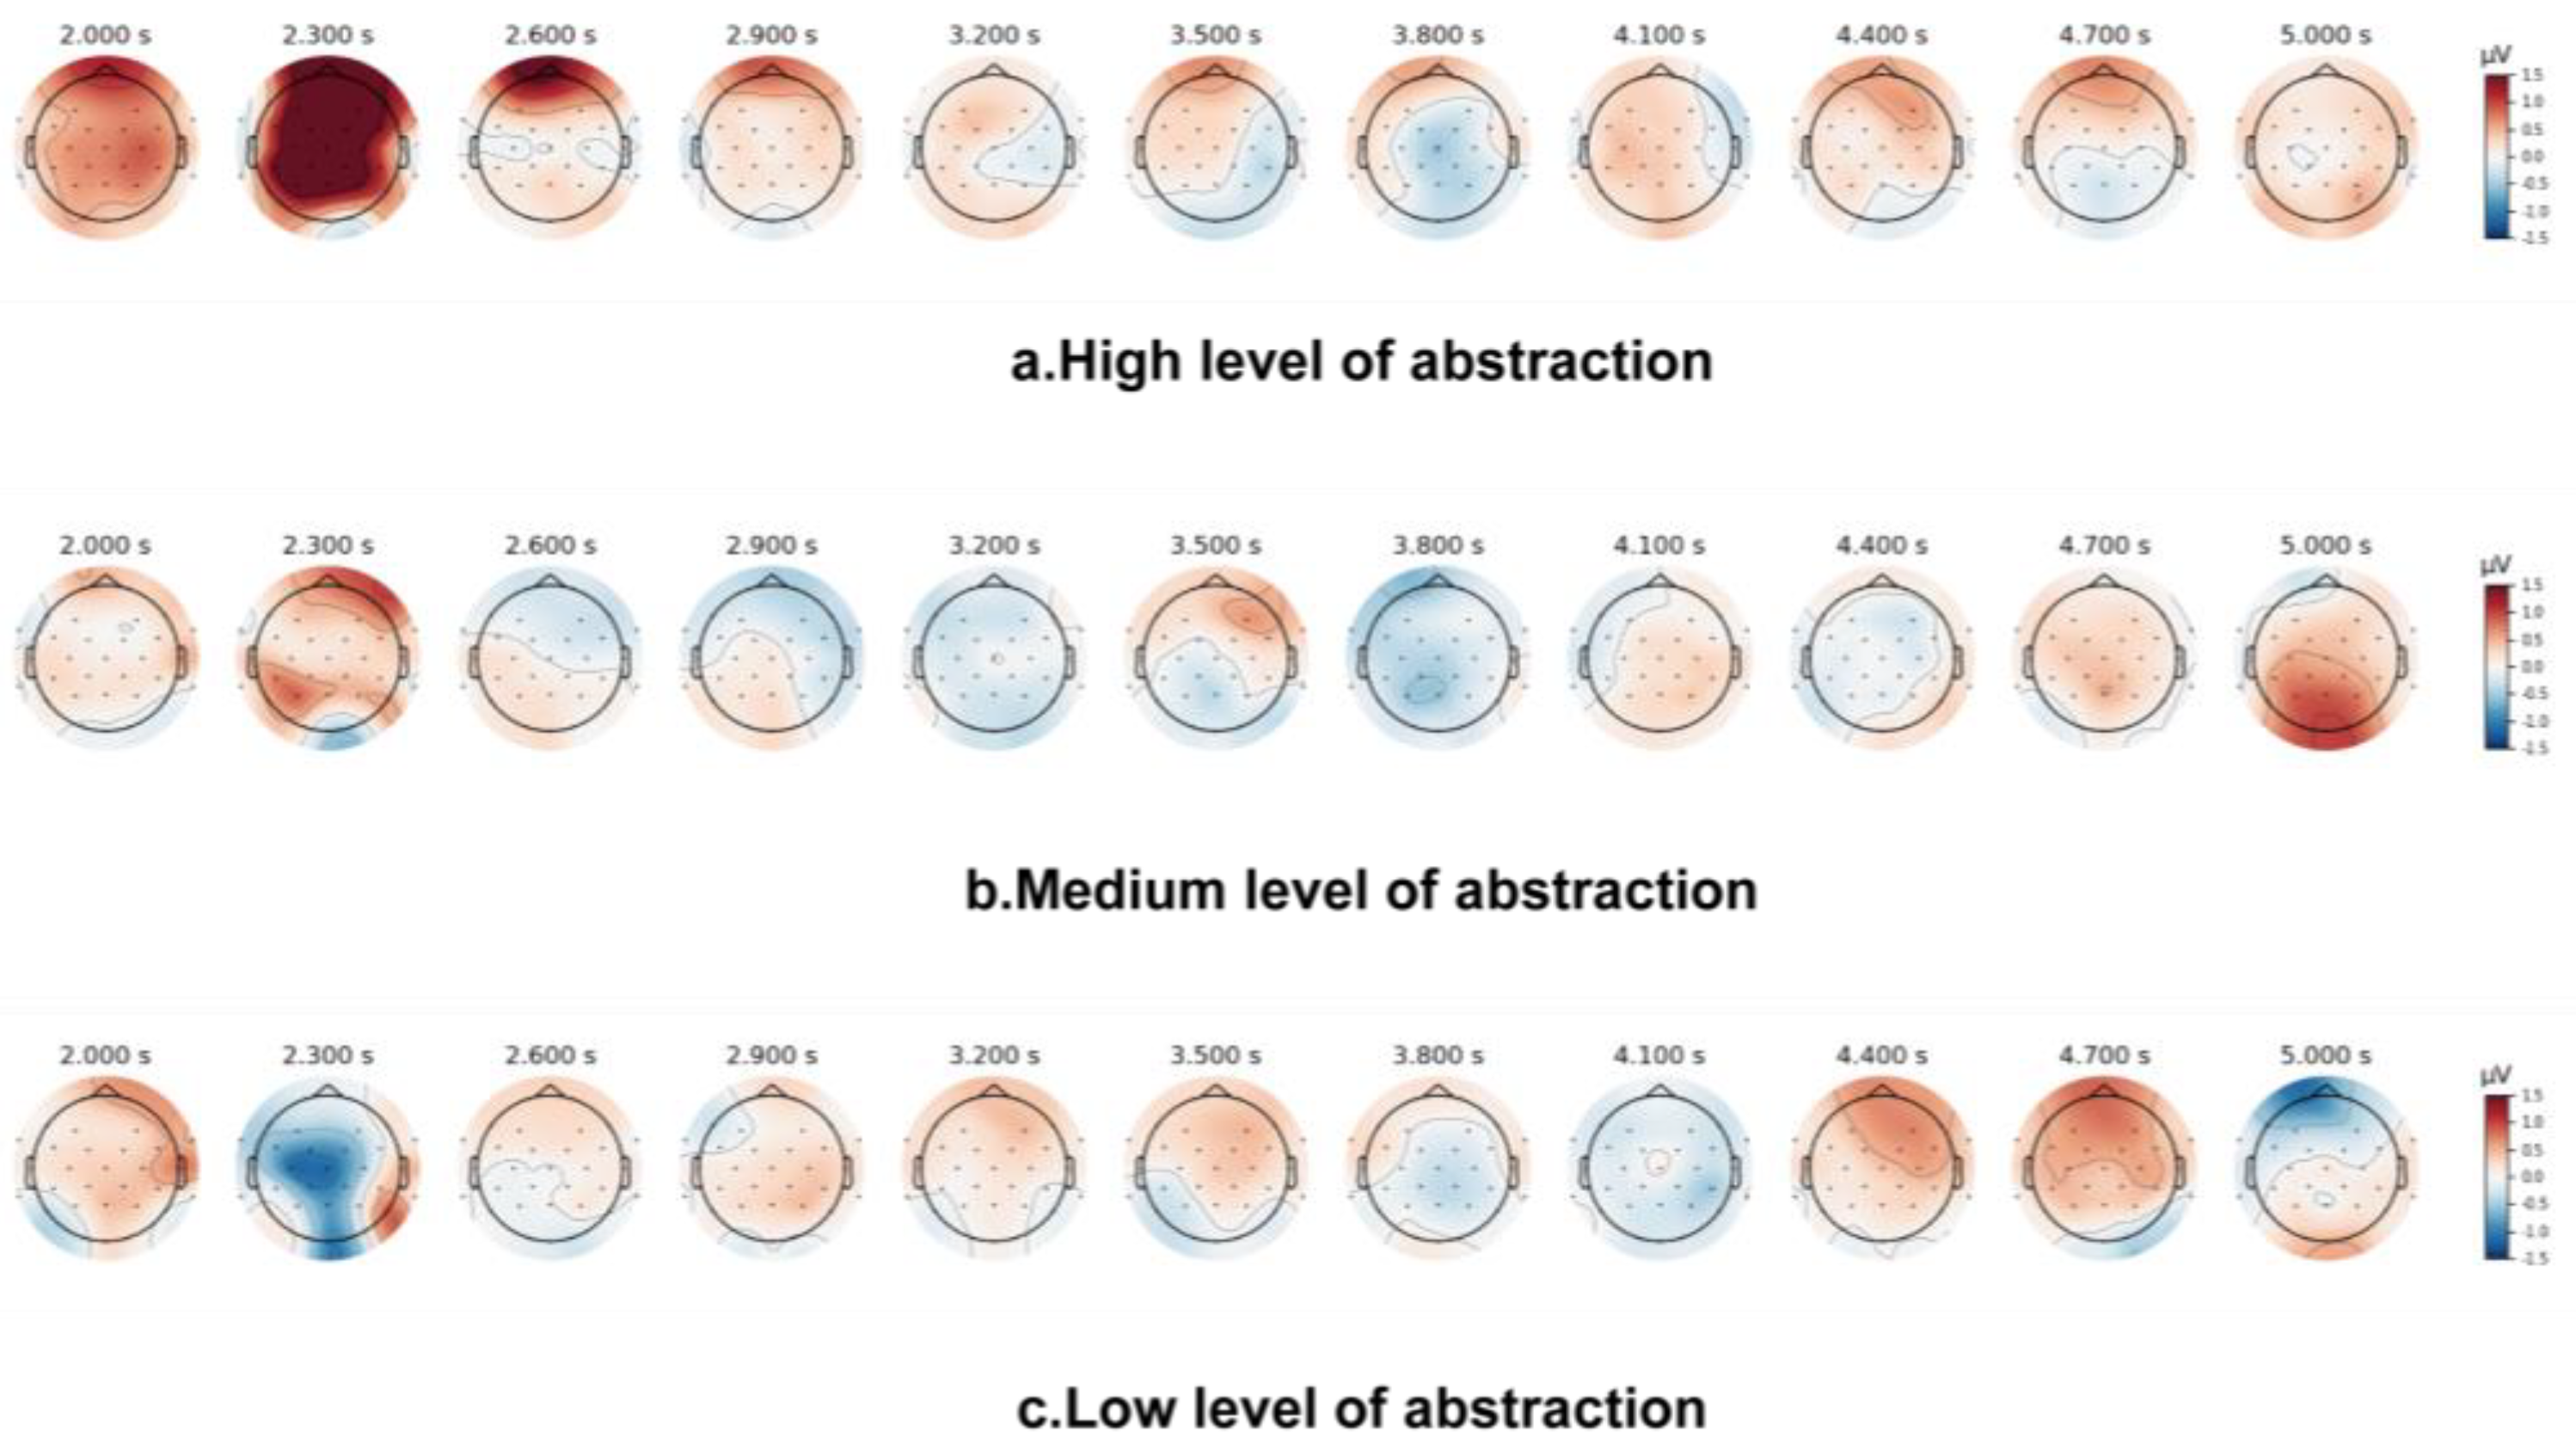
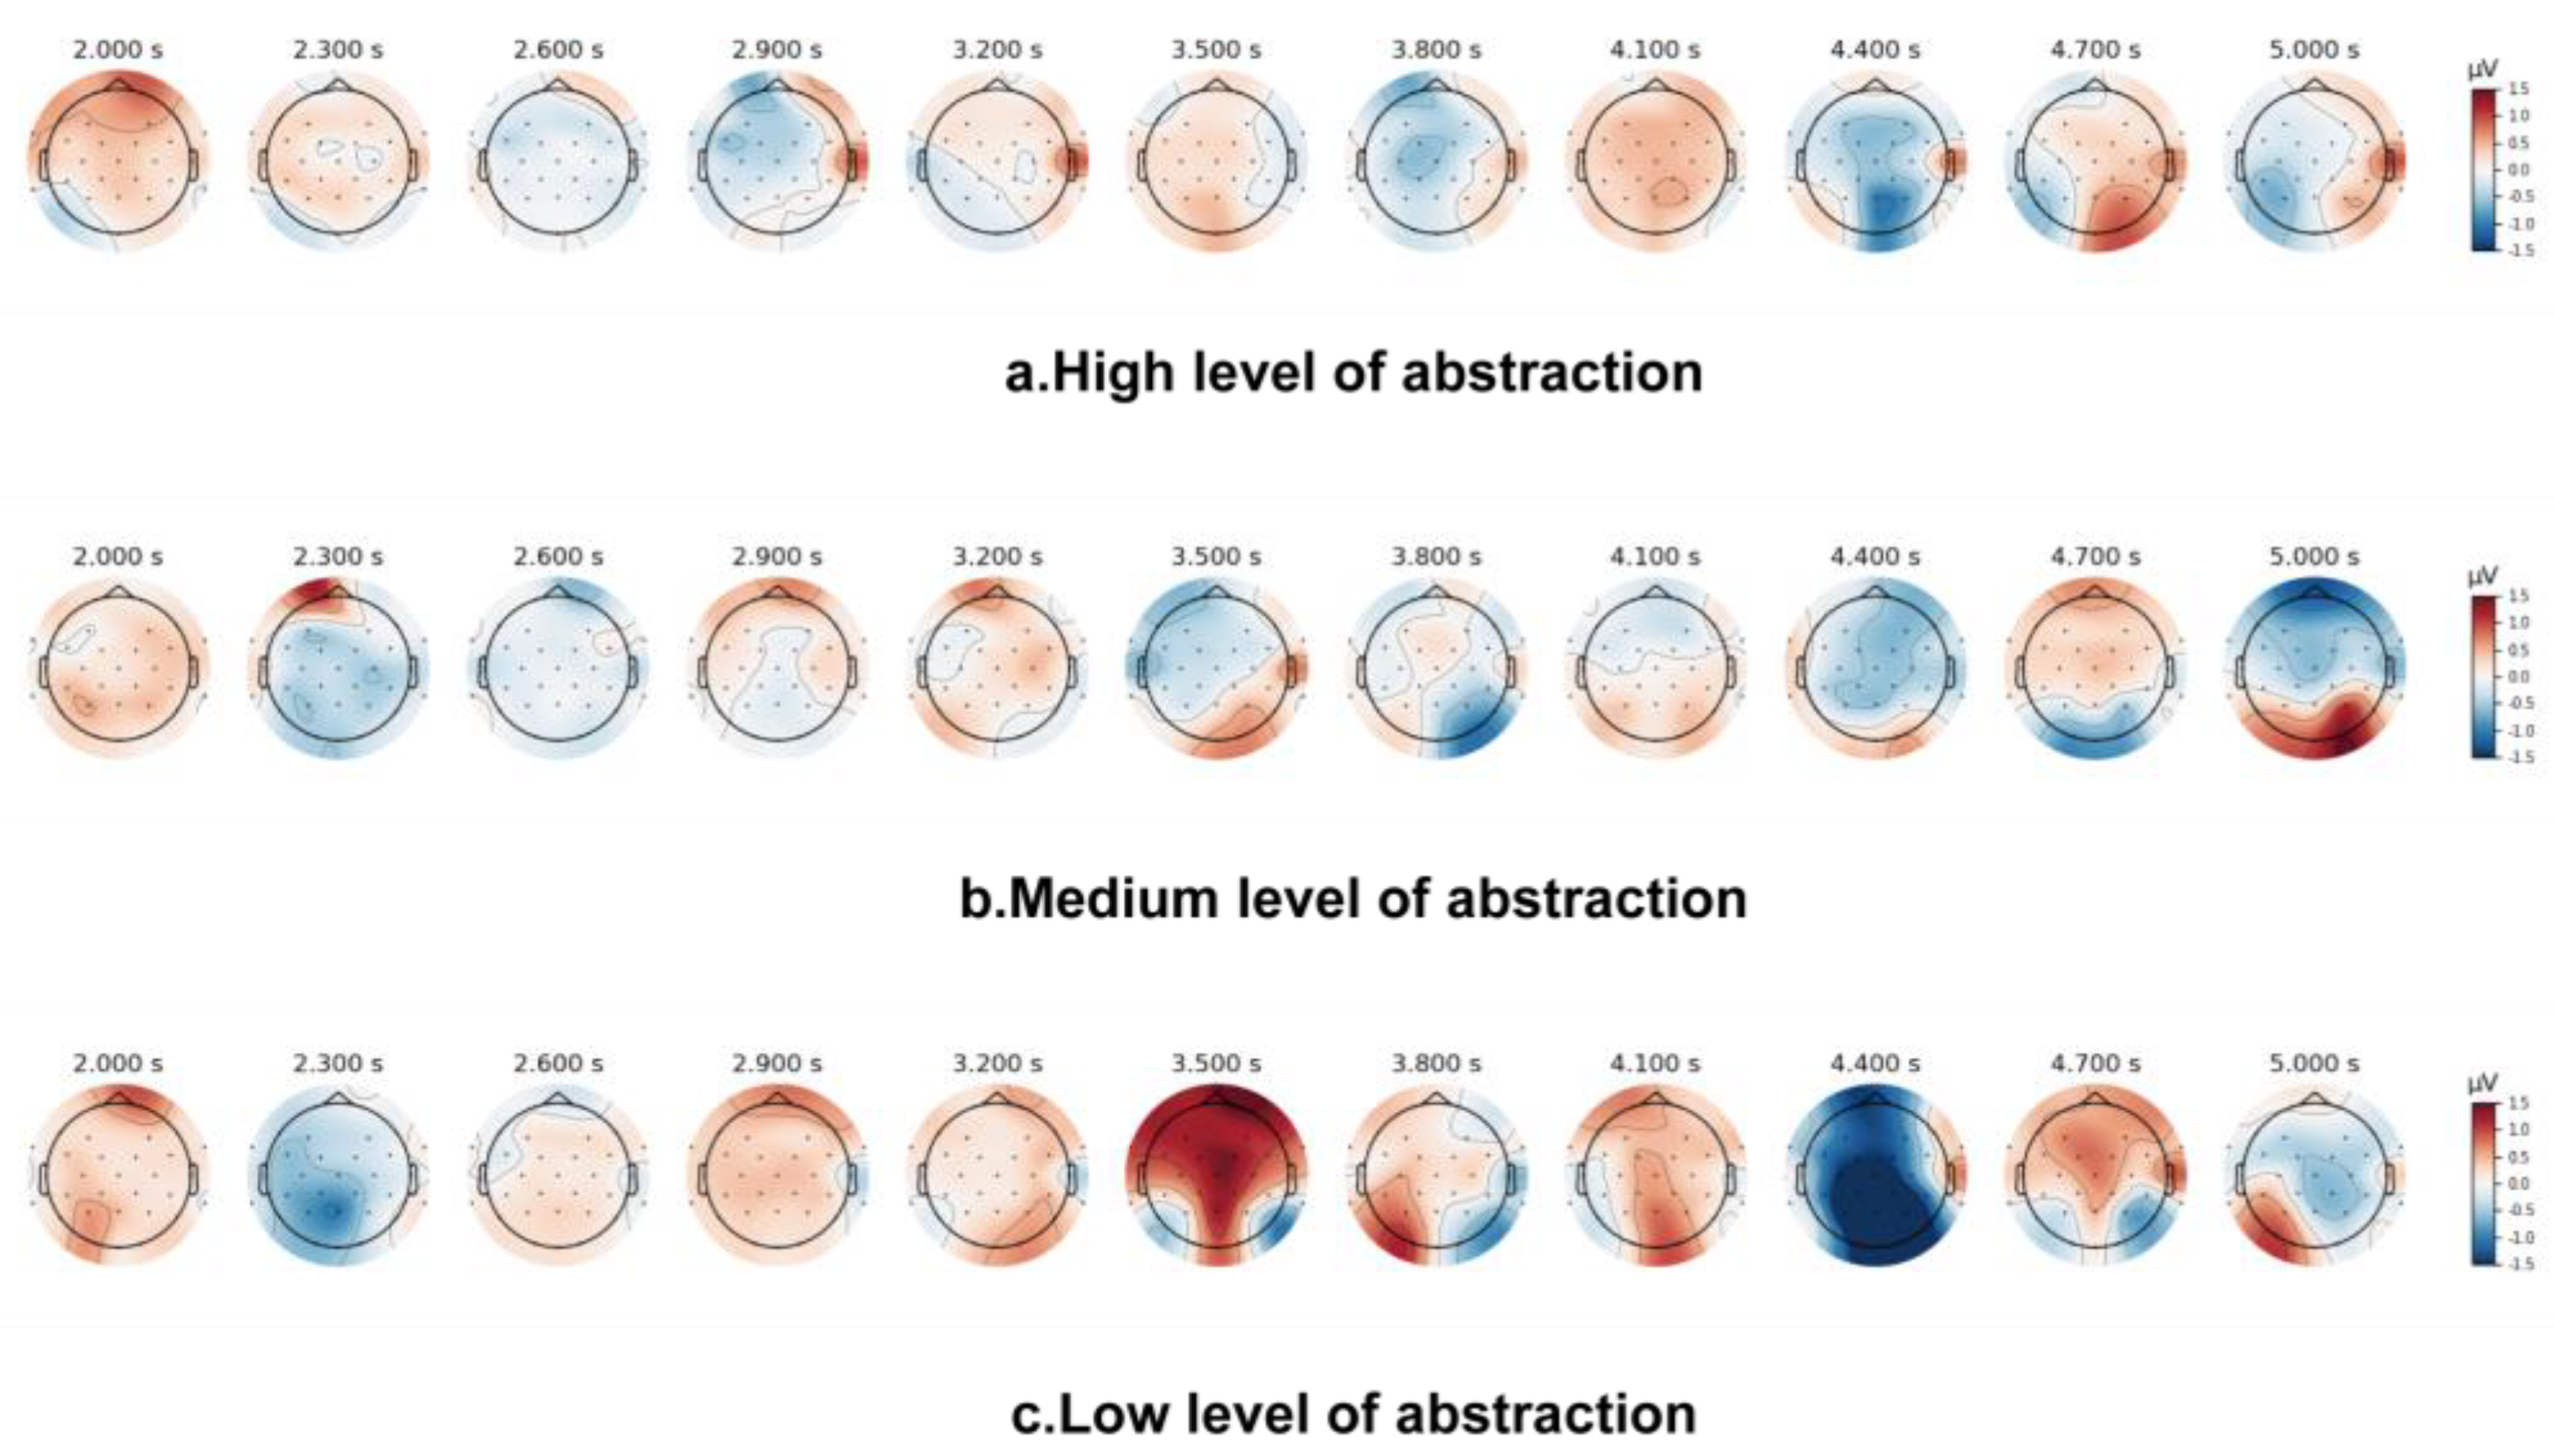
4.1. ERD Feature Extraction and Analysis
4.2. Mental Load Features and Analysis
4.2.1. Theta Band Energy Analysis
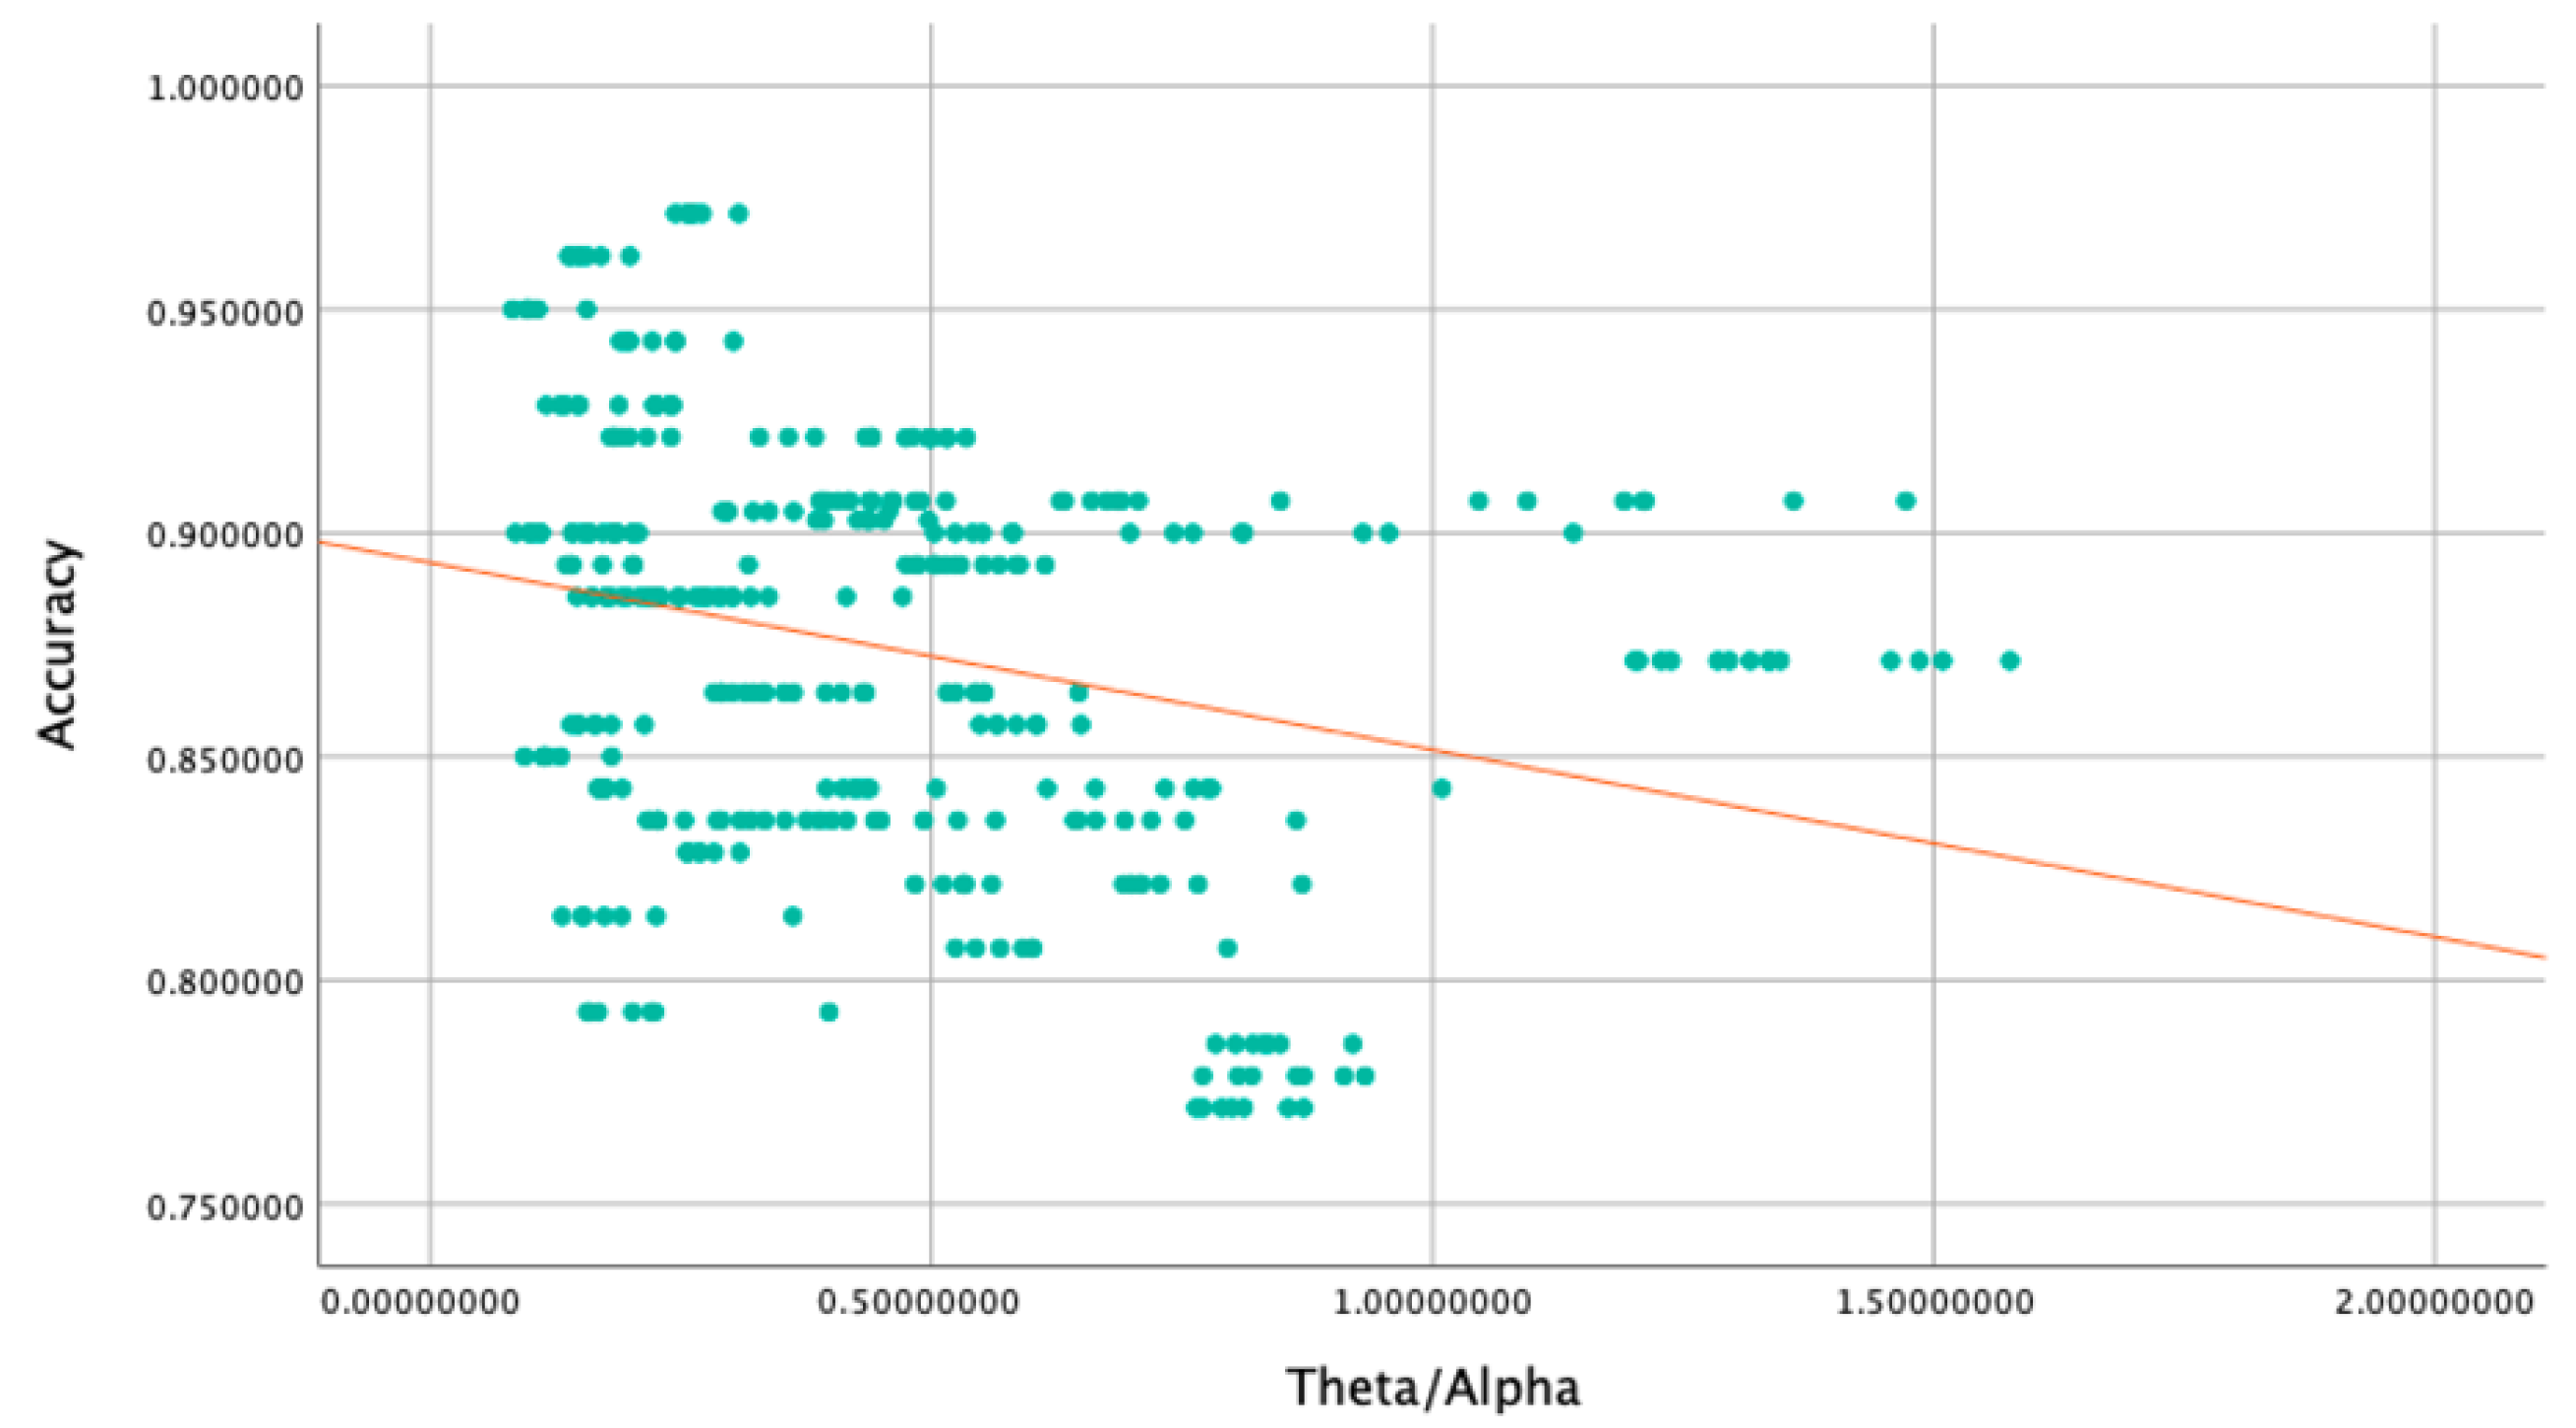
4.2.2. Theta/Alpha Band Energy Ratio Analysis
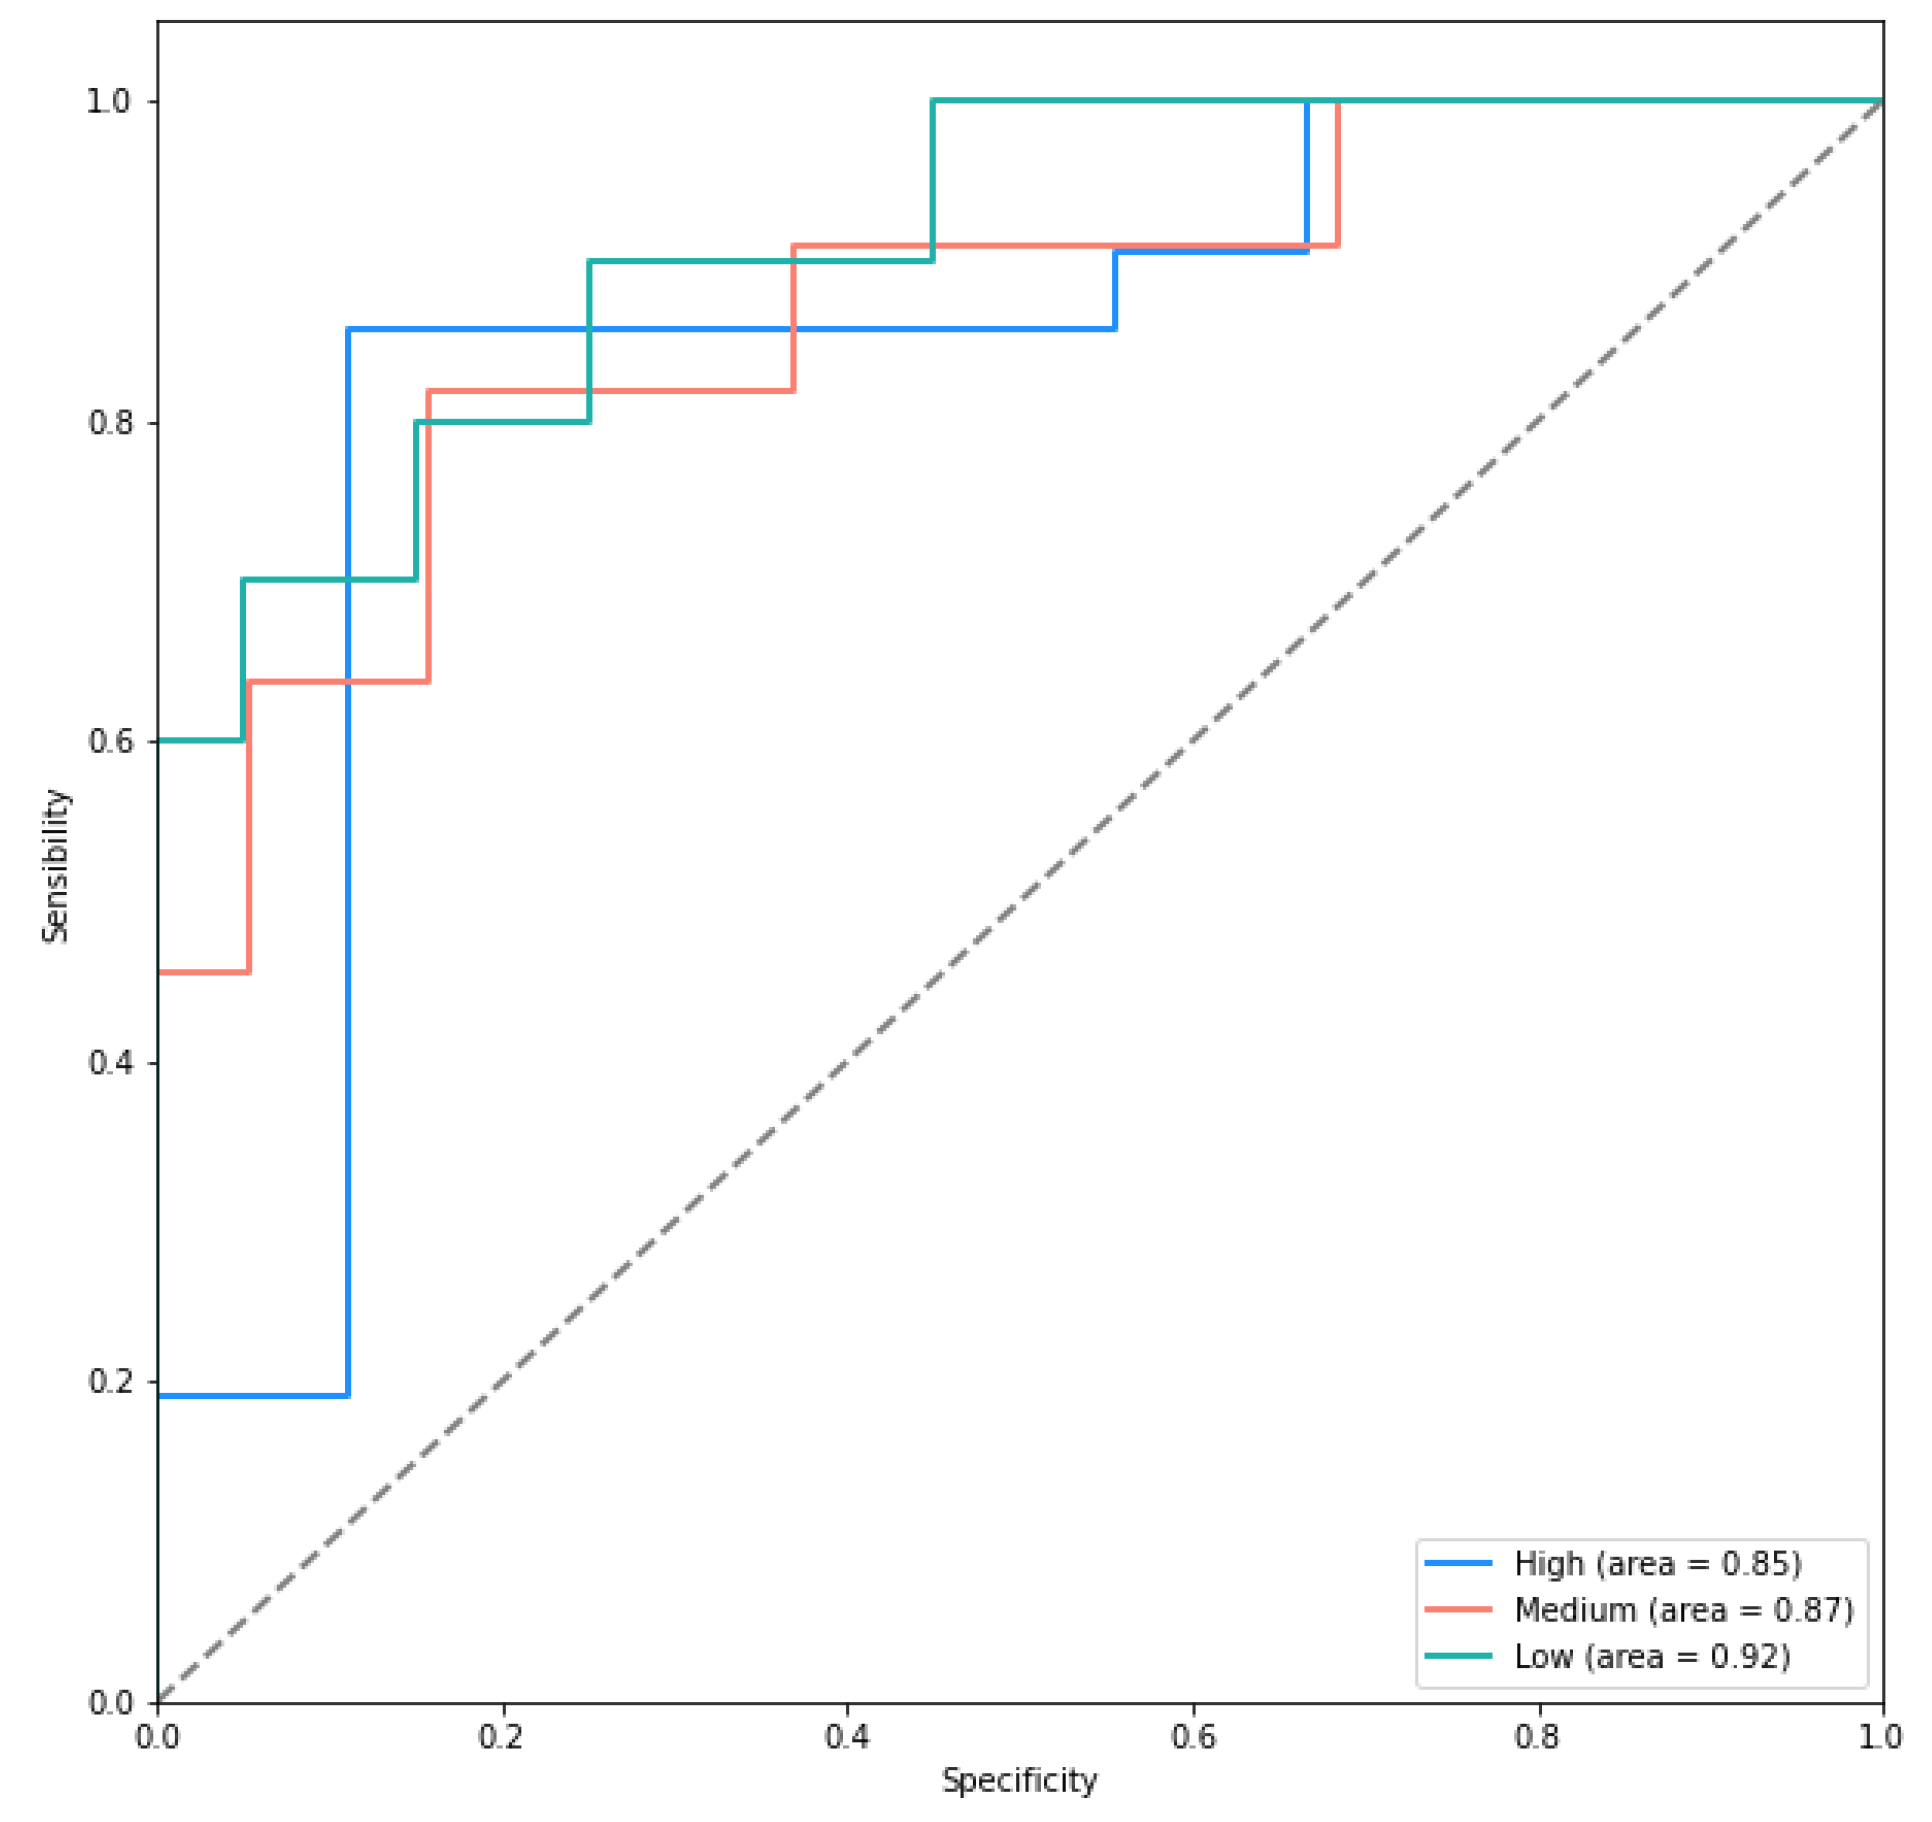
4.3. Classification Performance
4.4. Correlation between Brain Activity, Mental Load, and MI-BCI Performance
5. Discussion
5.1. Brain Activity
5.2. Mental Load
5.3. MI-BCI Performance
5.4. Correlations
5.5. Research Limitations and Future Work
6. Conclusions
Author Contributions
Funding
Institutional Review Board Statement
Informed Consent Statement
Data Availability Statement
Conflicts of Interest
References
- Casanova, G.; Lillini, R. Disability in Older People and Socio-Economic Deprivation in Italy: Effects on the Care Burden and System Resources. Sustainability 2022, 14, 205. [Google Scholar] [CrossRef]
- Soekadar, S.R.; Witkowski, M.; Vitiello, N.; Birbaumer, N. An EEG/EOG-Based Hybrid Brain-Neural Computer Interaction (BNCI) System to Control an Exoskeleton for the Paralyzed Hand. Biomed. Tech. 2015, 60, 199–205. [Google Scholar] [CrossRef]
- Nicolas-Alonso, L.F.; Gomez-Gil, J. Brain Computer Interfaces, a Review. Sensors 2012, 12, 1211–1279. [Google Scholar] [CrossRef] [PubMed]
- Kett, M.; Holloway, C.; Austin, V. Critical Junctures in Assistive Technology and Disability Inclusion. Sustainability 2021, 13, 12744. [Google Scholar] [CrossRef]
- Ramos-Murguialday, A.; Broetz, D.; Rea, M.; Läer, L.; Yilmaz, Ö.; Brasil, F.L.; Liberati, G.; Curado, M.R.; Garcia-Cossio, E.; Vyziotis, A.; et al. Brain-Machine Interface in Chronic Stroke Rehabilitation: A Controlled Study. Ann. Neurol. 2013, 74, 100–108. [Google Scholar] [CrossRef]
- Pichiorri, F.; Morone, G.; Petti, M.; Toppi, J.; Pisotta, I.; Molinari, M.; Paolucci, S.; Inghilleri, M.; Astolfi, L.; Cincotti, F.; et al. Brain-Computer Interface Boosts Motor Imagery Practice during Stroke Recovery. Ann. Neurol. 2015, 77, 851–865. [Google Scholar] [CrossRef]
- Pfurtscheller, G.; Neuper, C. Motor Imagery Activates Primary Sensorimotor Area in Humans. Neurosci. Lett. 1997, 239, 65–68. [Google Scholar] [CrossRef]
- Pfurtscheller, G.; Brunner, C.; Schlögl, A.; Lopes da Silva, F.H. Mu Rhythm (de)Synchronization and EEG Single-Trial Classification of Different Motor Imagery Tasks. Neuroimage 2006, 31, 153–159. [Google Scholar] [CrossRef]
- Pfurtscheller, G.; Lopes Da Silva, F.H. Event-Related EEG/MEG Synchronization and Desynchronization: Basic Principles. Clin. Neurophysiol. 1999, 110, 1842–1857. [Google Scholar] [CrossRef]
- Jia, X.; Song, Y.; Yang, L.; Xie, L. Joint Spatial and Temporal Features Extraction for Multi-Classification of Motor Imagery EEG. Biomed. Signal Process. Control 2022, 71, 103247. [Google Scholar] [CrossRef]
- Idowu, O.P.; Adelopo, O.; Ilesanmi, A.E.; Li, X.; Samuel, O.W.; Fang, P.; Li, G. Neuro-Evolutionary Approach for Optimal Selection of EEG Channels in Motor Imagery Based BCI Application. Biomed. Signal Process. Control 2021, 68, 102621. [Google Scholar] [CrossRef]
- Amin, S.U.; Alsulaiman, M.; Muhammad, G.; Mekhtiche, M.A.; Shamim Hossain, M. Deep Learning for EEG Motor Imagery Classification Based on Multi-Layer CNNs Feature Fusion. Future Gener. Comput. Syst. 2019, 101, 542–554. [Google Scholar] [CrossRef]
- Grychtol, B.; Lakany, H.; Valsan, G.; Conway, B.A. Human Behavior Integration Improves Classification Rates in Real-Time BCI. IEEE Trans. Neural Syst. Rehabil. Eng. 2010, 18, 362–368. [Google Scholar] [CrossRef]
- Miao, X.; Hou, W.J. Research on the Integration of Human-Computer Interaction and Cognitive Neuroscience. In Proceedings of the IFIP Working Conference on Human Work Interaction Design, Beijing, China, 15–16 May 2021; Springer International Publishing: New York, NY, USA, 2022; Volume 609, ISBN 9783031029035. [Google Scholar]
- Tremmel, C.; Herff, C.; Sato, T.; Rechowicz, K.; Yamani, Y.; Krusienski, D.J. Estimating Cognitive Workload in an Interactive Virtual Reality Environment Using EEG. Front. Hum. Neurosci. 2019, 13, 401. [Google Scholar] [CrossRef] [PubMed]
- Frey, J.; Daniel, M.; Castet, J.; Hachet, M.; Lotte, F. Framework for Electroencephalography-Based Evaluation of User Experience. In Proceedings of the 2016 CHI Conference on Human Factors in Computing Systems, San Jose, CA, USA, 7–12 May 2016; pp. 2283–2294. [Google Scholar] [CrossRef]
- Marchesotti, S.; Bassolino, M.; Serino, A.; Bleuler, H.; Blanke, O. Quantifying the Role of Motor Imagery in Brain-Machine Interfaces. Sci. Rep. 2016, 6, 24076. [Google Scholar] [CrossRef] [PubMed]
- Jeunet, C.; Nkaoua, B.; Subramanian, S.; Hachet, M.; Lotte, F. Predicting Mental Imagery-Based BCI Performance from Personality, Cognitive Profile and Neurophysiological Patterns. PLoS ONE 2015, 10, e0143962. [Google Scholar] [CrossRef]
- Lotte, F.; Jeunet, C. Defining and Quantifying Users’ Mental Imagery-Based BCI Skills: A First Step. J. Neural Eng. 2018, 15, 046030. [Google Scholar] [CrossRef]
- Roy, Y.; Banville, H.; Albuquerque, I.; Gramfort, A.; Falk, T.H.; Faubert, J. Deep Learning-Based Electroencephalography Analysis: A Systematic Review. J. Neural Eng. 2019, 16, 051001. [Google Scholar] [CrossRef]
- Roc, A.; Pillette, L.; Mladenovic, J.; Benaroch, C.; N’Kaoua, B.; Jeunet, C.; Lotte, F. A Review of User Training Methods in Brain Computer Interfaces Based on Mental Tasks. J. Neural Eng. 2021, 18, 011002. [Google Scholar] [CrossRef] [PubMed]
- Zhang, D.; Yao, L.; Chen, K.; Wang, S.; Haghighi, P.D.; Sullivan, C. A Graph-Based Hierarchical Attention Model for Movement Intention Detection from EEG Signals. IEEE Trans. Neural Syst. Rehabil. Eng. 2019, 27, 2247–2253. [Google Scholar] [CrossRef]
- Liang, S.; Choi, K.S.; Qin, J.; Pang, W.M.; Heng, P.A. Enhancing Training Performance for Brain–Computer Interface with Object-Directed 3D Visual Guidance. Int. J. Comput. Assist. Radiol. Surg. 2016, 11, 2129–2137. [Google Scholar] [CrossRef]
- Tang, Z.; Li, C.; Sun, S. Single-Trial EEG Classification of Motor Imagery Using Deep Convolutional Neural Networks. Optik 2017, 130, 11–18. [Google Scholar] [CrossRef]
- Cheng, S.W.; Zhou, T.C.; Tang, Z.C.; Fan, J.; Sun, L.Y.; Zhu, A.J. CNN Based Motor Imagery EEG Classification and Human-Robot Interaction. Ruan Jian Xue Bao/J. Softw. 2019, 30, 3005–3016. [Google Scholar] [CrossRef]
- Bimbi, M.; Festante, F.; Coudé, G.; Vanderwert, R.E.; Fox, N.A.; Ferrari, P.F. Simultaneous Scalp Recorded EEG and Local Field Potentials from Monkey Ventral Premotor Cortex during Action Observation and Execution Reveals the Contribution of Mirror and Motor Neurons to the Mu-Rhythm. Neuroimage 2018, 175, 22–31. [Google Scholar] [CrossRef] [PubMed]
- Liang, S.; Choi, K.S.; Qin, J.; Pang, W.M.; Wang, Q.; Heng, P.A. Improving the Discrimination of Hand Motor Imagery via Virtual Reality Based Visual Guidance. Comput. Methods Programs Biomed. 2016, 132, 63–74. [Google Scholar] [CrossRef]
- Sun, Y.; Wei, W.; Luo, Z.; Gan, H.; Hu, X. Improving Motor Imagery Practice with Synchronous Action Observation in Stroke Patients. Top. Stroke Rehabil. 2016, 23, 245–253. [Google Scholar] [CrossRef] [PubMed]
- Rusnock, C.F.; Borghetti, B.J. Workload Profiles: A Continuous Measure of Mental Workload. Int. J. Ind. Erg. 2018, 63, 49–64. [Google Scholar] [CrossRef]
- Xie, B.; Salvendy, G. Review and Reappraisal of Modelling and Predicting Mental Workload in Single- and Multi-Task Environments. Work Stress 2000, 14, 74–99. [Google Scholar] [CrossRef]
- Endsley, M.R. Toward a Theory of Situation Awareness in Dynamic Systems. Hum. Factors 1995, 37, 32–64. [Google Scholar] [CrossRef]
- Johnson, A.; Widyanti, A. Cultural Influences on the Measurement of Subjective Mental Workload. Ergonomics 2011, 54, 509–518. [Google Scholar] [CrossRef]
- Almogbel, M.A.; Dang, A.H.; Kameyama, W. Cognitive Workload Detection from Raw EEG-Signals of Vehicle Driver Using Deep Learning. In Proceedings of the 2019 21st International Conference on Advanced Communication Technology (ICACT), PyeongChang, Korea, 17–20 February 2019; pp. 1167–1172. [Google Scholar] [CrossRef]
- Craik, A.; He, Y.; Contreras-Vidal, J.L. Deep Learning for Electroencephalogram (EEG) Classification Tasks: A Review. J. Neural Eng. 2019, 16, 031001. [Google Scholar] [CrossRef] [PubMed]
- López-Núñez, M.I.; Rubio-Valdehita, S.; Diaz-Ramiro, E.M.; Aparicio-García, M.E. Psychological Capital, Workload, and Burnout: What’s New? The Impact of Personal Accomplishment to Promote Sustainableworking Conditions. Sustainability 2020, 12, 8124. [Google Scholar] [CrossRef]
- Borghini, G.; Astolfi, L.; Vecchiato, G.; Mattia, D.; Babiloni, F. Measuring Neurophysiological Signals in Aircraft Pilots and Car Drivers for the Assessment of Mental Workload, Fatigue and Drowsiness. Neurosci. Biobehav. Rev. 2014, 44, 58–75. [Google Scholar] [CrossRef] [PubMed]
- Chen, X.; Jin, R. Statistical Modeling for Visualization Evaluation through Data Fusion. Appl. Ergon. 2017, 65, 551–561. [Google Scholar] [CrossRef] [PubMed]
- Best, M.W.; Milanovic, M.; Shamblaw, A.L.; Muere, A.; Lambe, L.J.; Hong, I.K.; Haque, M.K.; Bowie, C.R. An Examination of the Moderating Effects of Neurophysiology on Treatment Outcomes from Cognitive Training in Schizophrenia-Spectrum Disorders. Int. J. Psychophysiol. 2020, 154, 59–66. [Google Scholar] [CrossRef]
- Kim, H.S.; Hwang, Y.; Yoon, D.; Choi, W.; Park, C.H. Driver Workload Characteristics Analysis Using EEG Data from an Urban Road. IEEE Trans. Intell. Transp. Syst. 2014, 15, 1844–1849. [Google Scholar] [CrossRef]
- Zammouri, A.; Ait Moussa, A.; Mebrouk, Y. Brain-Computer Interface for Workload Estimation: Assessment of Mental Efforts in Learning Processes. Expert Syst. Appl. 2018, 112, 138–147. [Google Scholar] [CrossRef]
- Kalcher, J.; Flotzinger, D.; Neuper, C.; Gölly, S.; Pfurtscheller, G. Graz Brain-Computer Interface II: Towards Communication between Humans and Computers Based on Online Classification of Three Different EEG Patterns. Med. Biol. Eng. Comput. 1996, 34, 382–388. [Google Scholar] [CrossRef]
- Viganò, S.; Borghesani, V.; Piazza, M. Symbolic Categorization of Novel Multisensory Stimuli in the Human Brain. Neuroimage 2021, 235, 118016. [Google Scholar] [CrossRef]
- Seidel Malkinson, T.; Pertzov, Y.; Zohary, E. Turning Symbolic: The Representation of Motion Direction in Working Memory. Front. Psychol. 2016, 7, 1–17. [Google Scholar] [CrossRef]
- Yao, D.; Qin, Y.; Hu, S.; Dong, L.; Bringas Vega, M.L.; Valdés Sosa, P.A. Which Reference Should We Use for EEG and ERP Practice? Brain Topogr. 2019, 32, 530–549. [Google Scholar] [CrossRef]
- Fox, N.A.; Yoo, K.H.; Bowman, L.C.; Cannon, E.N.; Ferrari, P.F.; Bakermans-Kranenburg, M.J.; Vanderwert, R.E.; Van IJzendoorn, M.H. Assessing Human Mirror Activity with EEG Mu Rhythm: A Meta-Analysis. Psychol. Bull. 2016, 142, 291–313. [Google Scholar] [CrossRef]
- Paas, F.; Tuovinen, J.E.; Tabbers, H.; van Gerven, P.W.M. Cognitive Load Measurement as a Means to Advance Cognitive Load Theory. Educ. Psychol. 2003, 38, 63–71. [Google Scholar] [CrossRef]
- Rubio, S.; Díaz, E.; Martín, J.; Puente, J.M. Evaluation of Subjective Mental Workload: A Comparison of SWAT, NASA-TLX, and Workload Profile Methods. Appl. Psychol. 2004, 53, 61–86. [Google Scholar] [CrossRef]
- Kok, A. On the Utility of P3 Amplitude as a Measure of Processing Capacity. Psychophysiology 2001, 38, 557–577. [Google Scholar] [CrossRef] [PubMed]
- Brouwer, A.M.; Hogervorst, M.A.; Van Erp, J.B.F.; Heffelaar, T.; Zimmerman, P.H.; Oostenveld, R. Estimating Workload Using EEG Spectral Power and ERPs in the N-Back Task. J. Neural Eng. 2012, 9, 045008. [Google Scholar] [CrossRef]
- Dehais, F.; Duprès, A.; Blum, S.; Drougard, N.; Scannella, S.; Roy, R.N.; Lotte, F. Monitoring Pilot’s Mental Workload Using Erps and Spectral Power with a Six-Dry-Electrode EEG System in Real Flight Conditions. Sensors 2019, 19, 1324. [Google Scholar] [CrossRef]
- Zhou, Y.; Huang, S.; Xu, Z.; Wang, P.; Wu, X.; Zhang, D. Cognitive Workload Recognition Using EEG Signals and Machine Learning: A Review. IEEE Trans. Cogn. Dev. Syst. 2021, 14, 799–818. [Google Scholar] [CrossRef]
- Ke, Y.; Qi, H.; Zhang, L.; Chen, S.; Jiao, X.; Zhou, P.; Zhao, X.; Wan, B.; Ming, D. Towards an Effective Cross-Task Mental Workload Recognition Model Using Electroencephalography Based on Feature Selection and Support Vector Machine Regression. Int. J. Psychophysiol. 2015, 98, 157–166. [Google Scholar] [CrossRef]


| Channel | Level of Abstraction | M ± SD (N = 17) | Median |
|---|---|---|---|
| C3 | High | 0.8732 ± 0.5671 | 0.8990 |
| Medium | 0.9563 ± 0.7157 | 0.7897 | |
| Low | 1.3026 ± 1.1994 | 1.0092 | |
| C4 | High | 0.9799 ± 1.0466 | 0.7855 |
| Medium | 1.1164 ± 0.9910 | 0.8905 | |
| Low | 1.2976 ± 1.1627 | 1.1872 |
| Channel | Level of Abstraction | M ± SD (N = 17) |
|---|---|---|
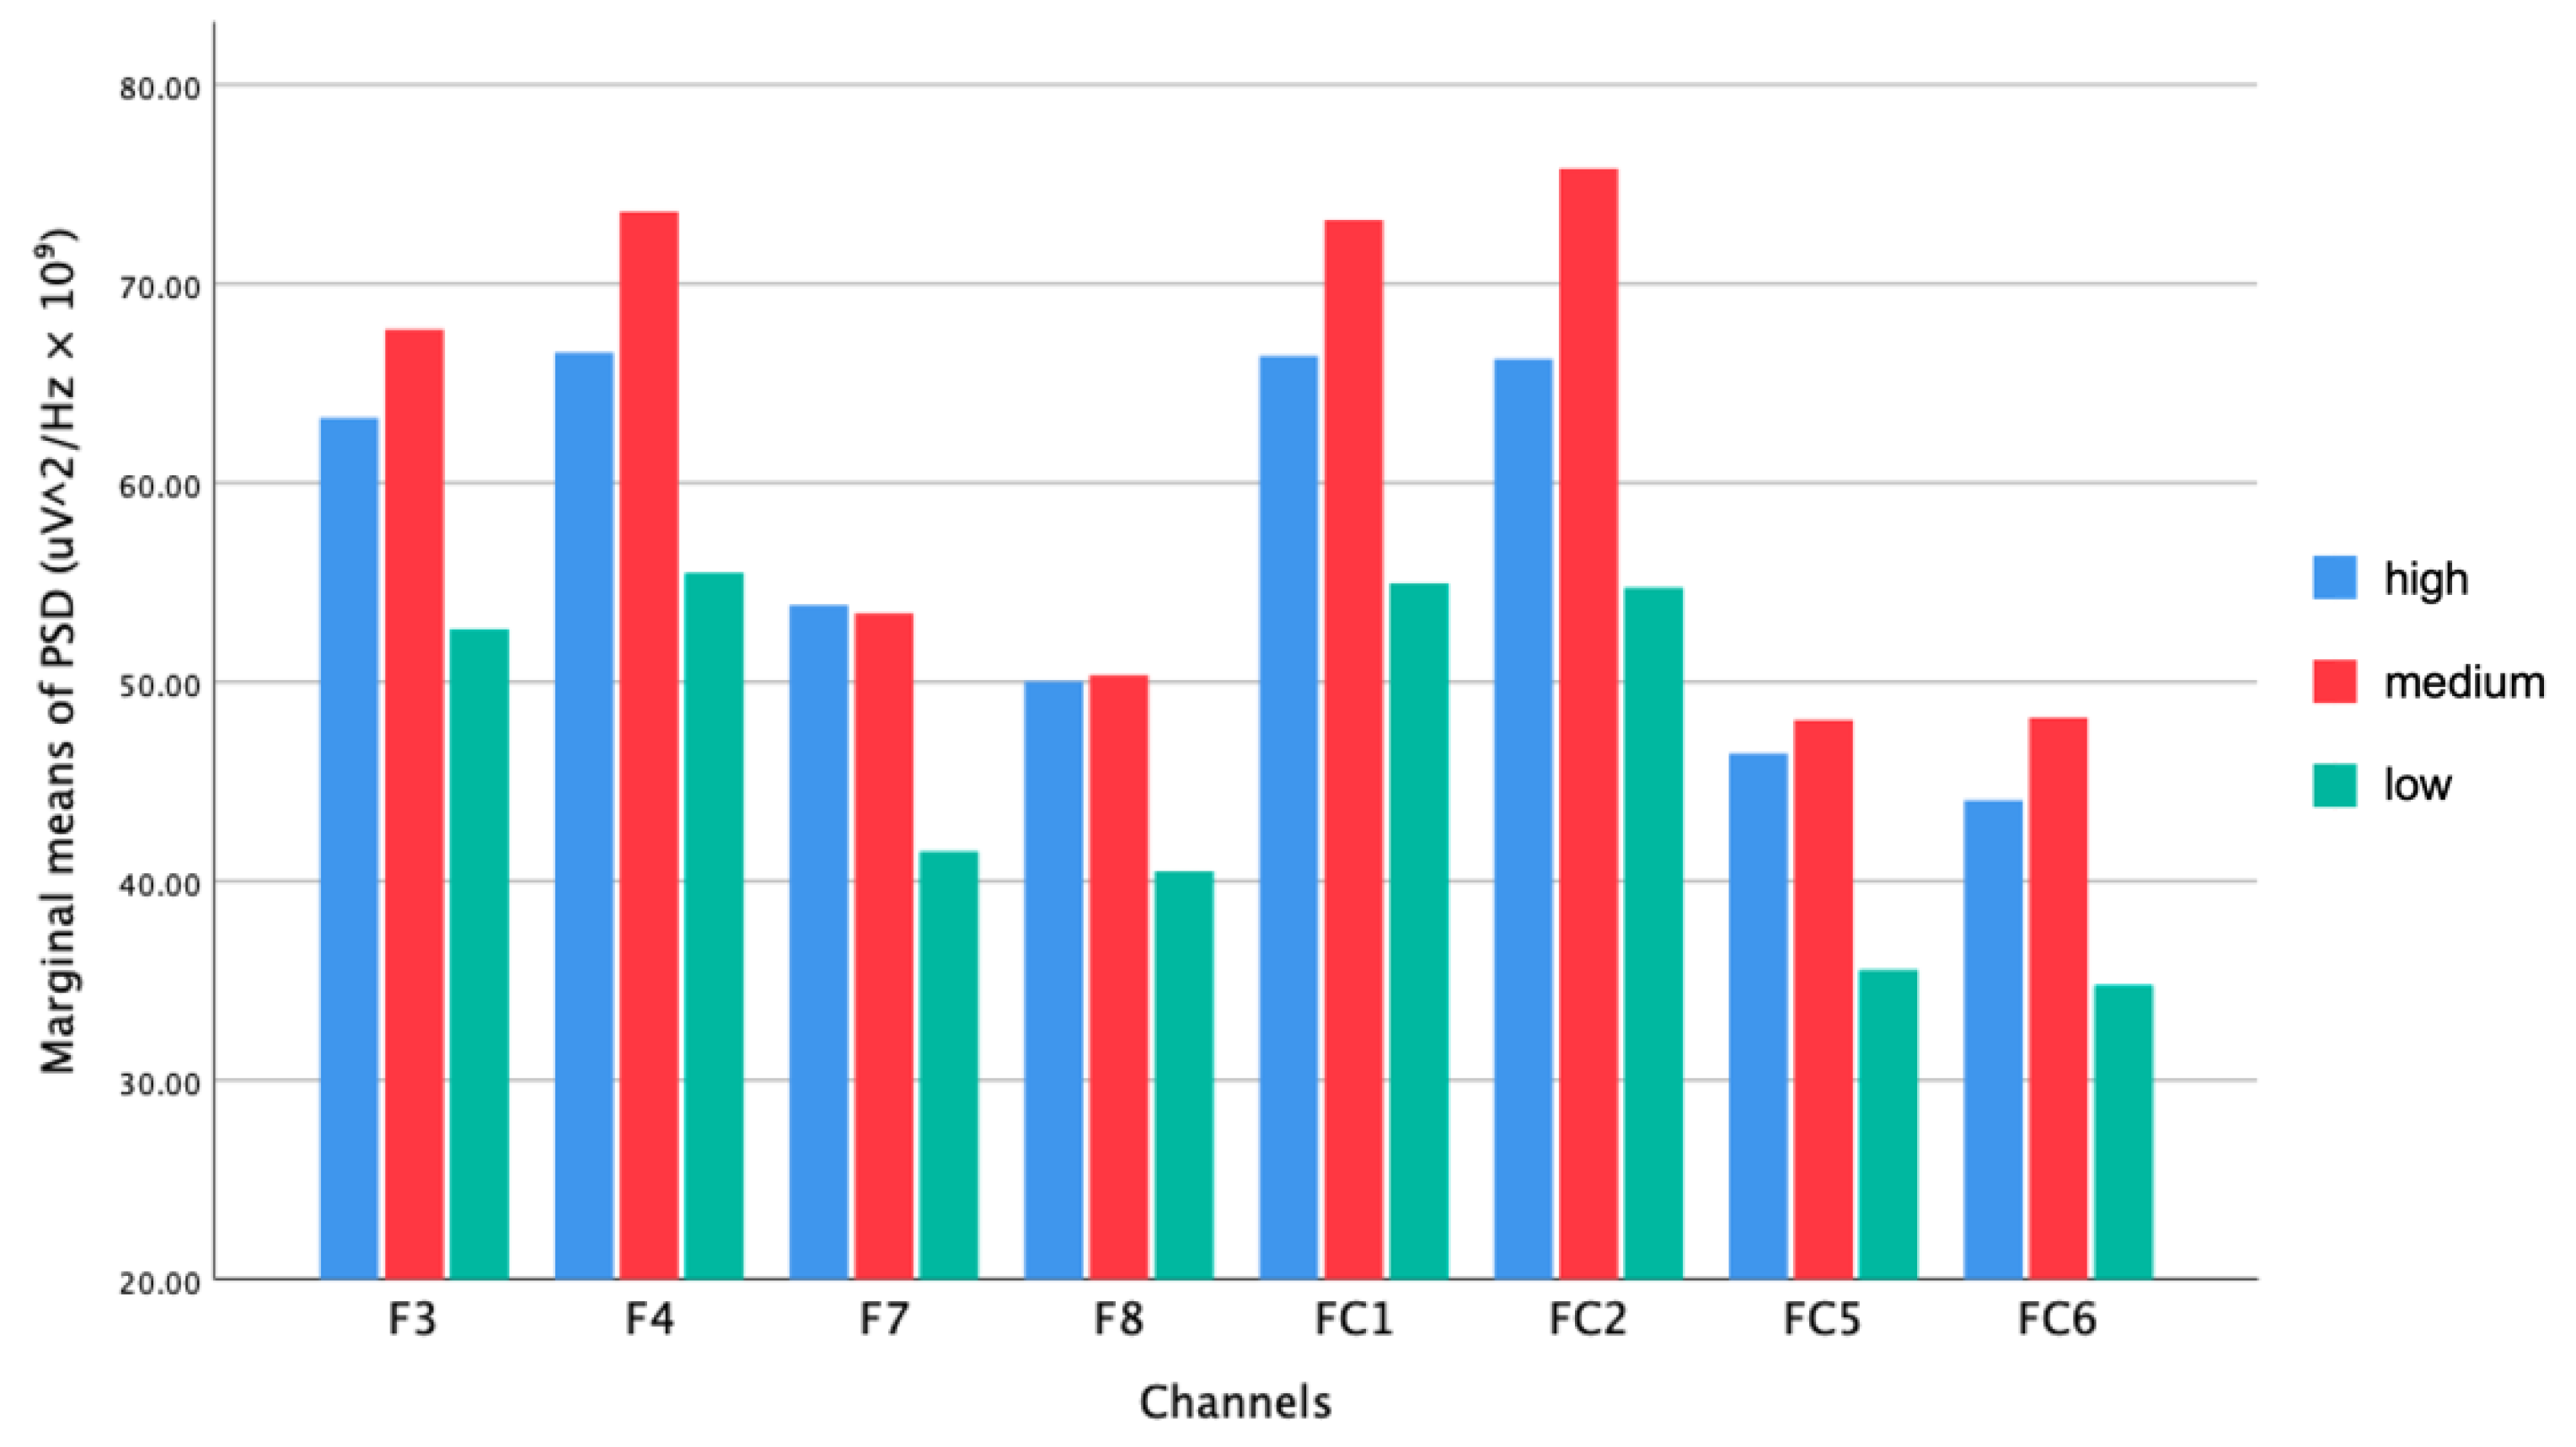
| F3 | High | 63.28 ± 76.51 |
| Medium | 67.71 ± 96.97 | |
| Low | 52.64 ± 35.81 | |
| F4 | High | 66.55 ± 77.96 |
| Medium | 73.64 ± 106.11 | |
| Low | 55.49 ± 36.02 | |
| F7 | High | 53.86 ± 69.95 |
| Medium | 53.45 ± 79.77 | |
| Low | 41.50 ± 34.23 | |
| F8 | High | 50.05 ± 55.37 |
| Medium | 50.34 ± 67.23 | |
| Low | 40.51 ± 27.19 | |
| FC1 | High | 66.38 ± 77.74 |
| Medium | 73.21 ± 98.11 | |
| Low | 54.96 ± 34.74 | |
| FC2 | High | 66.38 ± 77.74 |
| Medium | 75.80 ± 104.67 | |
| Low | 54.74 ± 34.94 | |
| FC5 | High | 46.42 ± 64.64 |
| Medium | 48.10 ± 73.28 | |
| Low | 35.54 ± 34.94 | |
| FC6 | High | 44.07 ± 55.94 |
| Medium | 48.23 ± 69.58 | |
| Low | 34.78 ± 23.41 |
| Channel | Level of Abstraction | M ± SD (N = 17) |
|---|---|---|
| C3 | High | 0.4928 ± 0.3311 |
| Medium | 0.4674 ± 0.3432 | |
| Low | 0.4198 ± 0.3505 | |
| C4 | High | 0.4846 ± 0.3054 |
| Medium | 0.4591 ± 0.3048 | |
| Low | 0.4125 ± 0.3170 | |
| CP1 | High | 0.4705 ± 0.3048 |
| Medium | 0.4351 ± 0.3013 | |
| Low | 0.3876 ± 0.3182 | |
| CP2 | High | 0.4534 ± 0.2851 |
| Medium | 0.4227 ± 0.2824 | |
| Low | 0.3709 ± 0.2922 | |
| CP5 | High | 0.5007 ± 0.3118 |
| Medium | 0.4626 ± 0.2965 | |
| Low | 0.4187 ± 0.3158 | |
| CP6 | High | 0.4841 ± 0.2970 |
| Medium | 0.4526 ± 0.2809 | |
| Low | 0.4098 ± 0.3026 | |
| Cz | High | 0.5360 ± 0.3674 |
| Medium | 0.4987 ± 0.3717 | |
| Low | 0.4393 ± 0.3568 |
| Level of Abstraction | M ± SD (N = 17) | Min | Max |
|---|---|---|---|
| High | 0.8524 ± 0.0372 | 0.7857 | 0.9071 |
| Medium | 0.8653 ± 0.0386 | 0.7714 | 0.9071 |
| Low | 0.9057 ± 0.0495 | 0.7786 | 0.9714 |
Publisher’s Note: MDPI stays neutral with regard to jurisdictional claims in published maps and institutional affiliations. |
© 2022 by the authors. Licensee MDPI, Basel, Switzerland. This article is an open access article distributed under the terms and conditions of the Creative Commons Attribution (CC BY) license (https://creativecommons.org/licenses/by/4.0/).
Share and Cite
Yang, C.; Kong, L.; Zhang, Z.; Tao, Y.; Chen, X. Exploring the Visual Guidance of Motor Imagery in Sustainable Brain–Computer Interfaces. Sustainability 2022, 14, 13844. https://doi.org/10.3390/su142113844
Yang C, Kong L, Zhang Z, Tao Y, Chen X. Exploring the Visual Guidance of Motor Imagery in Sustainable Brain–Computer Interfaces. Sustainability. 2022; 14(21):13844. https://doi.org/10.3390/su142113844
Chicago/Turabian StyleYang, Cheng, Lei Kong, Zhichao Zhang, Ye Tao, and Xiaoyu Chen. 2022. "Exploring the Visual Guidance of Motor Imagery in Sustainable Brain–Computer Interfaces" Sustainability 14, no. 21: 13844. https://doi.org/10.3390/su142113844
APA StyleYang, C., Kong, L., Zhang, Z., Tao, Y., & Chen, X. (2022). Exploring the Visual Guidance of Motor Imagery in Sustainable Brain–Computer Interfaces. Sustainability, 14(21), 13844. https://doi.org/10.3390/su142113844