Abstract
Ports are of great strategic importance for a country. Nowadays, compliance with environmental requirements is required, forcing the migration towards clean energies. Therefore, it is necessary for emerging ports, as those in developed countries, to incorporate in their policies the use of electric power in the machinery that moves containers in the terminals. To learn how the problem is addressed in other countries, an extensive bibliographic review is presented. Then, the energy policies and criteria of a group of ports in an emerging country and a European port are studied. Subsequently, in order to determine the gaps between the ports investigated, the layout of the cargo yard of each of the terminals is optimized; the emissions of Carbon Dioxide (CO2) and other Greenhouse Gases (GHG) gases are calculated; and finally, the decrease in emissions when switching from diesel to electricity is estimated. The strategic and operational gaps related to energy management between the emerging and developed countries are discussed. It is concluded that research is needed to investigate how these initiatives impact the city and improve other sustainable aspects.
1. Introduction
The globalization has increased exports and imports in the country, which have generated more container traffic in port terminals [1]. The implementation of strategic sustainable actions is a relevant factor for business models, especially for the implementation and development of good practices related to automation in port enclosures to optimize the functioning of their operations and improve the quality of service [2,3].
On the other hand, ports are considered logistic centers in which economic, human, infrastructural and technological resources are required to carry out their activities [4]. In terminals, it is necessary to optimize the planning of the design of the facilities in order to have an efficient layout that minimizes the costs of cargo movements, energy consumption of equipment, etc. [5,6].
Containers loaded with perishable and non-perishable products are transported daily in the ports during import and export activities. These land and maritime operations generate pollution due to the emission of Greenhouse Gases (GHG) such as Carbon Dioxide (CO2) from different sources—namely, (1) main and/or auxiliary ships engines and boilers; (2) trucks arriving at the port for loading and unloading of goods; and (3) the use of fuels by the equipment operating in the port [7,8,9].
Currently, it is a priority for port authorities to include in their planning actions that reduce energy consumption and GHG emissions generated by climate change [9,10]. To improve energy management, research has optimized the planning of port operations with mathematical models that have an objective function related to energy consumption in ship loading and unloading yards [11,12].
Although Chile is considered efficient in its logistics management, it is just beginning the energy transition, as noted in the use of fossil-fuel-based material handling equipment at terminals [13]. Significant gaps exist between developed and developing countries, as investing in cleaner energy requires high investments and further technological development [7,14].
In green ports, the need to reduce emissions in order to achieve energy efficiency has been studied; thus, the use of fossil fuels has been reduced and the use of electrical energy has been increased [11,15]. Technology advances have generated a positive relationship between operational efficiency and energy efficiency, in which fifth-generation ports manage energy with significant cost savings by electrifying equipment and its components (batteries, distributors and converters) [16,17,18].
The energy consumption and CO2 emissions of the Port of Valencia in Spain have been investigated, where it was identified that the main equipment responsible for emissions correspond to the terminal tractors and the gantry cranes with tires, Rubber Tyred Gantry (RTG); the authors proposed a solution to change the equipment for others that use liquefied natural gas [10].
Due to the strategic importance of this environmental issue for a country’s public policies, a detailed study is needed on the energy consumption of terminals that are major energy consumers and, therefore, CO2 emitters [10,15].
Unlike the traditional semi-automated systems of Latin American countries in which containers are located in parallel, in developed countries the layout is optimized by locating the blocks perpendicularly depending on their dimensions (length, width and height) [19]. Examples of block distribution in green ports include the Maasvlakte II terminals in Rotterdam, Long Beach in the US and the ACT Yangshan IV in China [6].
Motivation
In Latin American countries, the generation of more strategic policies and business objectives that increase levels of sustainability, investment in technology and operational efficiency are required in port areas, in order to reduce energy consumption in container yards and reduce costs [13,20]. Therefore, the motivation of this study is to determine which are the main sources that generate greenhouse gas pollution in fifth-generation ports, in order to create a method able to optimize the energy management of port operators and their terminals in three ports in Chile.
Chilean ports in recent years are beginning to implement aspects of sustainability as those of green ports to reduce fuel consumption, and emissions are being handled to obtain the European EcoPorts certification [7]. Chilean ports can be classified as part of Industry 3.0 but with some characteristics of Industry 4.0 [21]. They are automated and most of the cargo in port facilities is moved using fossil fuels (diesel, gasoline, liquefied natural gas and liquefied petroleum gas) [20]. According to the results of the Energy Consumption and Emissions Survey carried out in the State Port Companies for the operation of the year 2020, the largest amount of CO2 emissions are generated in the terminals by the use of both fuels and the handling of the load by the equipment (cranes, stackers, trucks, etc.), and the fact that only a third of the energy consumption of the four terminals that have a greater movement of cargo is by electricity [22].
Due to the importance of reducing CO2 emissions and using cleaner technologies in publicly owned ports conceded to private companies [23], this research aims to identify the current port situation and show the need to carry out more investigation in this field to improve port sustainability.
In addition, in order to establish the gaps that are present in the terminals with more cargo transfer such as the small Chilean Port of Arica and a large semi-automated European port, a case study was included in which the CO2 emission parameters for diesel and electricity shown in the Section 4.1 below will be used.
Finally, the current investigation aims to assess the relevance of saving on energy consumption by optimizing the movement of cargo in container yards when moving from a diesel matrix to an electric matrix in Chilean ports with more cargo transfer, which are the medium-sized operators located in the Valparaiso Region: Port of Valparaíso and Port of San Antonio [24].
2. Energy Management in Ports
2.1. Location Ports
Figure 1 shows the locations of the ports of Valencia in Spain, and of Valparaiso, of San Antonio and Arica in Chile.
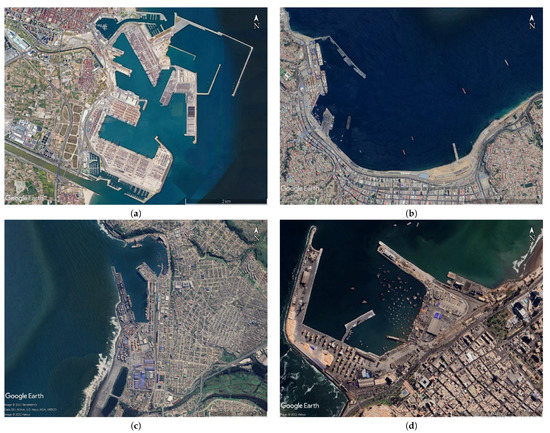
Figure 1.
Location port in Google Earth: (a) Port of Valencia, https://shorturl.at/hilrY, accessed on 20 September 2022; (b) Port of Valparaíso https://shorturl.at/dyENV, accessed on 20 September 2022; (c) Port of San Antonio https://shorturl.at/ASW37, accessed on 20 September 2022; (d) Port of Arica, https://shorturl.at/hkqz4, accessed on 20 September 2022.
2.2. Literature Review
The literature is reviewed in the WOS and SCOPUS databases on topics related to the improvements that maritime ports have made to their layouts to reduce the greenhouse effect.
To determine the effects of greenhouse gases on port facilities, as shown in Table 1, keywords are used to search the repositories of the WOS and Scopus databases. Table 2 summarizes the information obtained in Table 1.

Table 1.
Search summary.
Table 2.
Summary of optimization applications in ports.
Table 2 shows that almost all research has case studies on fifth-generation ports and that there is a lack of publications related to ports in developing countries.
2.3. Strategic Gaps between Chilean and Spanish Ports
In order to study the strategic gaps in the sustainable aspects in the ports of Valparaíso, San Antonio, Arica and Valencia, the environmental and energy policies were reviewed based on the documentation available on their corresponding port websites.
Based on the strategic actions defined by each company on their website, the following Table 3 was created, which shows the key strategic criteria to assess port sustainability. In parallel, with the information of the repositories of each port and the evaluation of two experts in port issues, the degree of compliance with environmental and energy policies was evaluated with the Likert scale [35,36], wherein 1 is non-compliance, 2 is low compliance, 3 refers to medium, high (4) and very high (5) compliance. It is noted that those responses greater than 1 were justified in order to identify the relevant aspects that have been executed.
Table 3.
Environmental and energy policies of ports.
From Table 3, it can be noted that Chilean ports have a low compliance level when compared with the Port of Valencia. This is observed in the results of the application of the Likert scale, where the Port of Valencia has approximately double the scores of each Chilean port.
This is explained due to the fact that the ports of Valparaíso, San Antonio and Arica are beginning to define actions to improve environmental and energy policies, which is observed in the existing instruments and collaboration agreements between the State, trade associations and port companies, related to clean production (NAMA, CPA), territorial dialogues, subsidies to implement best practices in clean production, technical advice and technology transfer [37].
It should be noted that the agreements are voluntary and that the Chilean ports have reduced the fuel burning, the consumption of electricity and the waste that is sent to landfills [38].
On the other hand, the Port of Valencia is a large, fifth-generation port. It has the Ecoport seal and defines as objectives for the year 2030 to have zero emissions and to be fully electrified. It is also developing the Wave Energy Converter project to generate green energy [39].
3. Materials and Methods
The methodology begins with a literature review to explain the context and identify the differences in the methods used to study different port cases worldwide. Then, the criteria of the sustainable strategic policies defined by the three Chilean ports and the Spanish port are evaluated using the Likert scale in order to assess the gaps that exist between the ports of a developing country and a developed country.
On the basis of [5,40], the optimization equations and their restrictions are proposed to determine the greenhouse gas emissions in the port terminals studied. With the method obtained in this section and discussed in Section 4, the parameters and GHG emissions in the ports of Valparaíso, San Antonio, Arica and Valencia are calculated. Finally, a conceptual evaluation of the strategies and sustainable operational aspects is carried out.
The development of the optimization method is shown below:
It is considered as the path of a 20 foot container in the Terminal Port to the following transport flows:
- In the loading process, the flow is divided into two sections: (1) the truck transports it to the yard where it is stored for an interval of time; (2) transport from the loading yard to the ship by a crane.
- In the unloading process, the flow is divided into two sections: (1) from the ship, it is transferred to the yard by a crane; (2) transport from the yard to the truck.
The flows are considered to be continuous. As shown in Figure 2, the dimensions of a 20-foot container are defined as X, Y and Z. The 20 feet correspond to the longest dimension of the container, which is the X in Figure 2. The other dimensions of the container are 8 feet on each side, corresponding to the Y and Z axes in Figure 2.
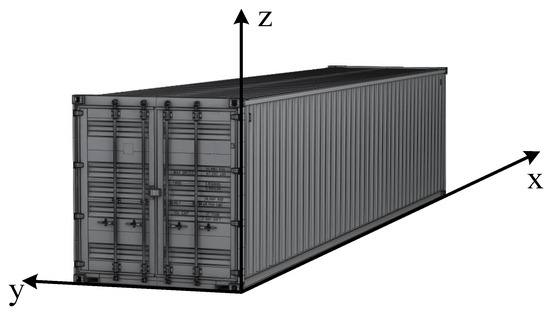
Figure 2.
Dimensions of a 20-foot container: m, m, m.
With the results of (1), (2) and (3), the total movement of a container is calculated:
with the following:
N: number of containers at dimension x;
a: container width;
v: space between containers at dimension x;
M: number of containers at dimension y;
l: container length;
u: space between containers at dimension y;
H: height of containers at dimension z in meters;
T: the average distance traveled by a container.

Figure 3.
Layout of the container yard.
We consider the assumptions that parameters A (length of the yard), B (width of the yard) and K (height of the yard) are known (Figure 3).
Then, an optimization model is proposed that seeks to determine the number of containers that should be stored in the loading yard. It is worth mentioning that the formulas proposed are based on research related to the design of industrial type rectangular warehouses in Chile [5] and in other industries [40].
The objective function is to minimize the total distance that a container travels in the cargo yard, whether it comes from a ship or a truck.
subject to
wherein,
K: height of the yard measured in meters;
S: height restriction adjustment in meters;
c: constant that indicates between how many containers an aisle of v width is created in direction y;
s: constant that indicates between how many containers an aisle of u width is created in direction x;
V: ideal volume of the loading yard.
The objective function shown in expression 10 describes the Total Carbon Dioxide (TCO2) emissions in tons generated by the average travel of the containers that are mobilized in the loading and unloading yard in a year. By minimizing it, the optimized ideal values of M, N and H are obtained, which are used in the calculations of the emissions in Section 4.
d: cargo moved at the terminal in one year, in Twenty-foot Equivalent Unit (TEU).
By calculating the partial derivatives with respect to each variable, the following is obtained:
and the following results are achieved:
The values are not relevant since the values of N, M and H do not depend on them and are only calculated to check for global coherence. For simplicity, is set, obtaining the expressions as shown below:
4. Estimation of GHG Emissions for Port Terminals
4.1. Calculation of CO2 Emission
In the present work, Table 4, Table 5 and Table 6 show the emission of CO2 in the terminals of the ports of Valparaíso, San Antonio, Arica and Valencia. For the calculations, the parameters mentioned in Table 7 were used, which are based on the method of energy efficiency in ports [41], the technical report of the Port of Valencia [42], the ISO 668:2020 standard [43] and the information prepared by McKinsey [44], in which it is shown that at a global level for 2021 the relationship between consumption of electricity and fossil fuel were 36% and 64%, respectively.
Table 4.
Emission of CO2 in the Port of Valparaiso in 2021.
Table 5.
Emission of CO2 in the Port of Arica and Port of San Antonio in 2021.
Table 6.
Emission of CO2 in the Port of Valencia in 2021.
Table 7.
Parameters of CO2 emissions by 2021.
The year 2021 is considered as representative since the previous periods were the years of pandemic, in which there were lower CO2 emissions. It should be noted that during COVID there were logistic problems at a global level that had not been seen before; in this new scenario, the movement of cargo in the terminals decreased, logistic times increased and, therefore, less equipment was used to move containers in the ports [45,46,47].
The following Table 4, Table 5 and Table 6 show the CO2 estimation of the port sites based on the information obtained from the document of the Inter-American Commission of the Port of Valencia [41], the optimized Formulas (5)–(10) and (18)–(20), the results of Table 7 and the data of the cargo transferred during the year 2021 in the loading and unloading yards of containers of the three Chilean ports that are analyzed in this research [42,48,49].
It is considered that the height of a crane is standard and the height of the yard is N = K = 10 (m), and it is assumed that cranes and other equipment pass from diesel to electricity for the calculation of the decrease in CO2 emission.
It is observed in Table 4, Table 5 and Table 6 that the ports of San Antonio and Valparaíso together moved approximately 25 million tonnes in 2021, an amount very similar to the cargo transferred by the Port of Valencia in the same period. These results show that it is possible to compare the gaps between the two Chilean medium-sized ports of the Valparaíso region and the second largest port in Spain [7,50].
4.2. Calculation of Emission of GHG
With the results obtained in Table 4, Table 5 and Table 6, it is possible to obtain the levels of emissions of the main GHG, which correspond to CO2, Methane (CH4), Nitrous Oxide (N2O), Hydrofluorocarbons (HFCs), Perfluorocarbons (PFCs) and Sulfur Hexafluoride (SF6) [51] in the Ports of Valparaíso, San Antonio and Valencia.
For the estimates shown in Table 8, Table 9 and Table 10, the percentages of greenhouse gas emissions CO2, CH4, N2O and other gases (HFCs + PFCs + SF6) that were registered in Spain during the year 2021 were used, which were 75.5%, 15.08%, 7.27% and 2.13%, respectively [52].
Table 8.
Emission of GHG in the Port of Valparaíso in 2021.
Table 9.
Emission of GHG in the Port of San Antonio in 2021.
Table 10.
Emission of GHG in the Port of Valencia in 2021.
5. Discussion
5.1. Global Energy Strategies
Due to the concern about climate change and dependence on fossil fuels, the sustainable use of energy has become a priority of the national strategy, involving the State, companies and people. It requires political will, innovation and large investments in technological development projects to comply with the international commitments that require the supply to be sustainable over time [53,54].
There has been a worldwide tendency to increase the use of different types of energy during 1990–2019; in the period of the pandemic, the consumption pattern of people and companies changed due to the decrease in commercial, industrial and transport activity in the domestic sphere [55,56]. In addition, it can be noted that there is a propensity for the need of using cleaner fuels by 2050 and that total consumption tends to stabilize.
Figure 4 is created with Chilean port data from the energy consumption and emissions survey [22]. It is based on the representation of global energy consumption from [44], since it is similar to that of Chilean port operators at the country level. It is observed that in the long term, the consumption of oil decreases and the use of electricity increases. This situation is not only due to environmental care but to macroeconomic conditions and international relations between producers and consumers of crude oil. For example, currently, less oil is consumed due to an increase in inflation, the possibility for a recession for next year and the restrictions on supply capacity, among other factors.
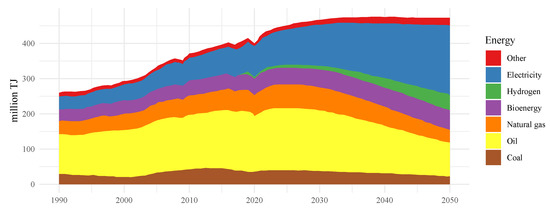
Figure 4.
Final energy consumption per fuel based on [22,44].
In relation to the port industry, energy efficiency is a priority in the decision-making of the Port Authority, which is why in business policies sustainable and eco-efficient aspects that seek new business opportunities are increasingly being included, so as to integrate clean technologies that are more responsible with the environment and that reduce greenhouse gas emissions [57,58].
As shown in Table 3 and Ref. [7], in the Chilean ports of Valparaíso, San Antonio and Arica, some sustainable aspects that seek to reduce emissions of CO2 and increase energy efficiency have been included in business policies and strategic definitions.
5.2. Energy Management in Port Terminals
The analysis of the results of Table 4, Table 5 and Table 6 allows to verify that the amount of cargo transferred (Ton-year) and the CO2 emissions are much lower in the Port of Arica (small size) than in the medium-sized ports that are located in the Valparaíso Region (Port of Valparaíso and Port of San Antonio). In addition, as the sum of the cargo transferred in the two medium-sized Chilean ports is similar to the movement of cargo in the Port of Valencia (large-sized port), in the present work the gaps existing between the two public terminal ports of the Valparaíso Region and the Spanish terminal were compared.
In the tables of Section 4.1, it is observed that in 2021 the ports of the Valparaíso Region moved 10% more cargo and containers than the Spanish port but they emitted approximately a third of the CO2 as that of the Port of Valencia. Then, if in the terminals the use of diesel was stopped and 100% electricity was used, Chilean ports would still pollute less than the Spanish port.
In relation to the emissions of GHG gases, as shown in Table 8, Table 9 and Table 10, the percentages of emissions that occurred in Spain during the year 2021 [52] were used to compare the ports of the Valparaíso Region with the Port of Valencia. The results obtained in Section 4.2 show that the ports of Valparaíso and San Antonio together emit an amount equivalent to 33% of the GHG of the Port of Valencia; this proportion is maintained if CH4, N2O, CO2 and the other gases are analyzed.
On the other hand, to analyze the energy consumption, the efficiency in its use and the associated costs, the Ministry of Transport and Telecommunications of Chile carried out a survey during the year 2020 in 11 public ports, in which the emissions of CO2 were measured with indicators as produced by the cargo handling equipment; the refrigerated platforms (storage in warehouses or collection centers); and the connections of refrigerated containers, transport, offices, and ships and tugboats [59]. In the results, it was appreciated that the ports studied have different degrees of maturity in the management of energy consumption, mainly due to operators being of different sizes and having different levels of technological and infrastructural development [11,22]. In addition, it was obtained that the emissions of CO2 from electric generators and diesel cargo handling machinery were higher in Chilean ports than in the Port of Barcelona despite the fact that they consume the same amount of energy [22,60].
If the results obtained in Section 4 and those delivered in the survey carried out by the State of Chile [22] are compared, it can be seen that different conclusions are obtained. Among the possible reasons, this could be due to the fact that the present study used the two public ports that have the highest cargo movement and the highest technological development; instead, the survey included the ports of the Valparaíso Region and nine public ports, the latter being terminals that move less cargo and have less infrastructure and equipment. On the other hand, the present study compared two Chilean ports, with the Port of Valencia that moves more cargo than the Port of Barcelona; for example, in 2020, the Port of Valencia had 36% more traffic than the Port of Barcelona.
It is worth mentioning that it is important to investigate more in this topic in order to improve energy management to reduce the emission of CO2 in port terminals. In the fifth-generation ports, with the purpose of reducing GHG, gantry cranes equipped with tires RTG are used as the main storage equipment in the cargo yard; as a variant, gantry cranes on electric rails (Rail Mounted Gantry (RMG)) [61,62,63,64] are used. Other solutions proposed for RTG in automated and electrified ports are conductive bars, cable reels and the use of hybrid systems (battery-diesel) [65,66]. Among the advantages, the cost of operation and maintenance are lower due to lower fuel consumption, as well as the reduction in emissions and noise levels [65]. The economic profitability of electrifying the RTGs of a terminal is conditioned by the number of load transfers made by each crane [66].
6. Conclusions
Since there is a lack of research to calculate for Chilean ports how much greenhouse gas emissions would be reduced if 100% electricity were used, a conceptual evaluation was carried out in this work.
A bibliographic review was performed to determine which are the methods or methodologies that are currently used to measure greenhouse gas emissions in port terminals. It was determined that most of the ports that are committed to comply with sustainability correspond to smart ports that are geographically located in developed countries having a high Gross Domestic Production (GDP) per capita. As these ports possess public funds, they can make large investments in infrastructure and machinery [62]. These countries have regulatory frameworks that promote the incorporation of sustainability into port protocols and business models [67,68].
In the case of the ports of Valparaiso, San Antonio and Arica, it is difficult to implement sustainable practices that promote the use of clean energy in developing countries as they are companies that can be classified as Industry 3.0 [23]. On the other hand, as they are public ports contracted to private companies, they are not autonomous and investments depend on the approval of the annual State budget [7]. The annual public allocation for port investment is very low, for example, for the year 2022 an amount of less than 0.02% was allocated for the three ports under study [69].
On the other hand, from the analysis of port policies related to energy and environmental management shown in Table 3, it is possible to observe the gaps between the strategic actions that are developed in Chilean ports and in the Port of Valencia. In the analyzed Chilean ports, energy efficiency criterion is becoming incorporated, as observed in the policies, since ports are in a diagnostic stage in which the identification of sustainable opportunities is sought. It is worth mentioning that among those strategies, only the ISO 14000 quality standard, clean production agreements in waste management and partial compliance with the objectives of the United Nations are included. In relation to the Spanish Port, as it is a large and highly developed port, its strategic and operational efforts are directed to improve energy management; currently, large investment projects are being developed to ensure that the terminals are 100% electrified [39].
In Section 4, the emissions of CO2 and other greenhouse gases in the ports of Valparaiso and San Antonio and in the Port of Valencia were calculated, and it was determined that Chilean ports emit a third of the greenhouse gases in the terminals when compared with the Port of Valencia. This is explained since the Spanish port is larger, which is why logistics are more complex as there is a greater number of equipment and workers, and the distance traveled by cargo movement is greater, thus requiring more logistic coordination and transport management. As Chilean ports are smaller, they move cargo in less time and distance and, therefore, they have fewer logistical difficulties; despite this, they have higher greenhouse gas emissions as they use fossil fuel equipment.
Further research is needed to investigate how public policies and the strategies of port managers impact decision-making and the allocation of resources, such as to reduce the amount of greenhouse gas emissions. A more detailed study is required to determine the technical and economic feasibility of migration, in which it is known which equipment can be optimized and which can be replaced.
It should be noted that these projects require large investments, which is why these transformations have been generated in smart ports and not in the terminals of developing countries [70,71]. The electrical power installation has many cables; so, the layout of the terminals has to be redesigned and the layout of the energization system of the equipment has to be evaluated, especially if it is mobile. On the other hand, it is possible to automate the movement of cargo with a computerized logistics process that optimizes times and identifies the traceability of the containers in real time in order to be clear about their location and generate optimal routes. This saves electricity by reducing storage transfer times [72].
Finally, a possible topic to study would be to analyze if a reduction in gas emissions replaced by the use of electricity in port terminals would improve the port–city relationship, since the negative externalities that are generated for the inhabitants of the port city could be reduced. On the other hand, it is necessary to analyze new variables that improve the degree of sustainability in the terminals.
Author Contributions
Conceptualization, C.D., I.D. and R.C.; Data curation, C.D. and I.D.; Formal analysis, C.D., I.D. and R.C.; Funding acquisition, I.D.; Investigation, C.D., I.D. and R.C.; Methodology, C.D., I.D. and R.C.; Project administration, C.D. and I.D.; Resources, C.D. and I.D.; Software, R.C.; Supervision, C.D.; Validation, C.D., I.D. and R.C.; Visualization, R.C.; Writing—original draft, C.D., I.D. and R.C.; Writing—review and editing, C.D., I.D. and R.C. All authors have read and agreed to the published version of the manuscript.
Funding
DICYT-USACH, Grant No. 062117DC.
Institutional Review Board Statement
Not applicable.
Informed Consent Statement
Not applicable.
Data Availability Statement
Not applicable.
Acknowledgments
The authors gratefully acknowledge the support of the Department of Industrial Engineering of the University of Santiago, Chile and to the Center of Operations management and operations research CIGOMM; the Competition for Research Regular Projects, year 2019, code LPR19-19, Universidad Tecnológica Metropolitana and Universidad de Las Américas DI-38/22.
Conflicts of Interest
The authors declare that there is no conflict of interest in the publication of this paper.
Abbreviations
The following abbreviations are used in this manuscript:
| CH4 | Methane |
| CO2 | Carbon Dioxide |
| GDP | Gross Domestic Production |
| GHG | Greenhouse Gases |
| HDI | Human Development Index |
| HFCs | Hydrofluorocarbons |
| N2O | Nitrous Oxide |
| PFCs | Perfluorocarbons |
| RMG | Rail Mounted Gantry |
| RTG | Rubber Tyred Gantry |
| SF6 | Sulfur Hexafluoride |
| TCO2 | Total Carbon Dioxide |
| TEU | Twenty-foot Equivalent Unit |
References
- García Bernal, N. Matriz Energética y Eléctrica en Chile; Technical Report; Biblioteca del Congreso Nacional de Chile: Valparaíso, Chile, 2021. [Google Scholar]
- Vejvar, M.; Lai, K.H.; Lo, C.K.Y.; Fürst, E.W.M. Strategic responses to institutional forces pressuring sustainability practice adoption: Case-based evidence from inland port operations. Transp. Res. Part D Transp. Environ. 2018, 61, 274–288. [Google Scholar] [CrossRef]
- Hossain, T.; Adams, M.; Walker, T.R. Sustainability initiatives in Canadian ports. Mar. Policy 2019, 106, 103519. [Google Scholar] [CrossRef]
- Durán, C.; Carrasco, R.; Sepúlveda, J.M. Model of decision for the management of technology and risk in a port community. Decis. Sci. Lett. 2018, 7, 211–224. [Google Scholar] [CrossRef]
- Derpich, I.; Sepúlveda, J.M.; Barraza, R.; Castro, F. Warehouse Optimization: Energy Efficient Layout and Design. Mathematics 2022, 10, 1705. [Google Scholar] [CrossRef]
- Li, X.; Peng, Y.; Huang, J.; Wang, W.; Song, X. Simulation study on terminal layout in automated container terminals from efficiency, economic and environment perspectives. Ocean Coast. Manag. 2021, 213, 105882. [Google Scholar] [CrossRef]
- Duran, C.; Palominos, F.; Carrasco, R.; Carrillo, E. Influence of Strategic Interrelationships and Decision-Making in Chilean Port Networks on Their Degree of Sustainability. Sustainability 2021, 13, 3959. [Google Scholar] [CrossRef]
- Teerawattana, R.; Yang, Y.C. Environmental Performance Indicators for Green Port Policy Evaluation: Case Study of Laem Chabang Port. Asian J. Shipp. Logist. 2019, 35, 63–69. [Google Scholar] [CrossRef]
- Papaefthimiou, S.; Sitzimis, I.; Andriosopoulos, K. A methodological approach for environmental characterization of ports. Marit. Policy Manag. 2017, 44, 81–93. [Google Scholar] [CrossRef]
- Martínez-Moya, J.; Vazquez-Paja, B.; Gimenez Maldonado, J.A. Energy efficiency and CO2 emissions of port container terminal equipment: Evidence from the Port of Valencia. Energy Policy 2019, 131, 312–319. [Google Scholar] [CrossRef]
- Iris, Ç.; Lee Lam, J.S. A review of energy efficiency in ports: Operational strategies, technologies and energy management systems. Renew. Sustain. Energy Rev. 2019, 112, 170–182. [Google Scholar] [CrossRef]
- Tan, C.; Yan, W.; Yue, J. Quay crane scheduling in automated container terminal for the trade-off between operation efficiency and energy consumption. Adv. Eng. Inform. 2021, 48, 101285. [Google Scholar] [CrossRef]
- Wilmsmeier, G.; Spengler, T. Consumo de Energía y Eficiencia en las Terminales de Contenedores; Boletín FAL; CEPAL: Santiago, Chile, 2016; Volume 350, pp. 1–11. [Google Scholar]
- Popkova, E.G.; Sergi, B.S. Energy efficiency in leading emerging and developed countries. Energy 2021, 221, 119730. [Google Scholar] [CrossRef]
- Geerlings, H.; van Duin, R. A new method for assessing CO2-emissions from container terminals: A promising approach applied in Rotterdam. J. Clean. Prod. 2011, 19, 657–666. [Google Scholar] [CrossRef]
- Woo, J.K.; Moon, D.S.H.; Lam, J.S.L. The impact of environmental policy on ports and the associated economic opportunities. Transp. Res. Part A Policy Pract. 2018, 110, 234–242. [Google Scholar] [CrossRef]
- Kermani, M.; Shirdare, E.; Parise, G.; Bongiorno, M.; Martirano, L. A Comprehensive Technoeconomic Solution for Demand Control in Ports: Energy Storage Systems Integration. IEEE Trans. Ind. Appl. 2022, 58, 1592–1601. [Google Scholar] [CrossRef]
- Parise, G.; Parise, L.; Malerba, A.; Pepe, F.M.; Honorati, A.; Chavdarian, P.B. Comprehensive Peak-Shaving Solutions for Port Cranes. IEEE Trans. Ind. Appl. 2017, 53, 1799–1806. [Google Scholar] [CrossRef]
- Wang, N.; Chang, D.; Shi, X.; Yuan, J.; Gao, Y. Analysis and Design of Typical Automated Container Terminals Layout Considering Carbon Emissions. Sustainability 2019, 11, 2957. [Google Scholar] [CrossRef]
- Sánchez, R.J.; Palma Barleta, E.; Mouftier, L. Reflexiones Sobre el Futuro de los Puertos de Contenedores; Recursos Naturales E Infraestructura; CEPAL: Santiago Chile, 2017; Volume 186, p. 53. [Google Scholar]
- Durán, C.A.; Córdova, F.M.; Palominos, F. A conceptual model for a cyber-social-technological-cognitive smart medium-size port. Procedia Comput. Sci. 2019, 162, 94–101. [Google Scholar] [CrossRef]
- Observatorio Logístico. Consumo Energético y Emisiones en Puertos. 2022. Available online: https://www.observatoriologistico.cl/medio-ambiente-y-energía/consumo-energético-y-emisiones/analisis/?id=627974aab6821b006388830b (accessed on 28 August 2022).
- Durán, C.A.; Córdova, F.M.; Palominos, F. Method for improving critical strategic and operational success factors in a port system. Procedia Comput. Sci. 2018, 139, 448–455. [Google Scholar] [CrossRef]
- Cámara Marítima y Portuaria de Chile. Análisis Comparativo Comercio Exterior Año 2020 vs. 2019; Technical Report; Cámara Marítima y Portuaria de Chile: Valparaíso, Chile, 2021. [Google Scholar]
- Gharehgozli, A.; Zaerpour, N.; de Koster, R. Container terminal layout design: Transition and future. Marit. Econ. Logist. 2020, 22, 610–639. [Google Scholar] [CrossRef]
- Abu Aisha, T.; Ouhimmou, M.; Paquet, M. Optimization of Container Terminal Layouts in the Seaport-Case of Port of Montreal. Sustainability 2020, 12, 1165. [Google Scholar] [CrossRef]
- Li, Y.; Chu, F.; Zheng, F.; Liu, M. A Bi-Objective Optimization for Integrated Berth Allocation and Quay Crane Assignment With Preventive Maintenance Activities. IEEE Trans. Intell. Transp. Syst. 2022, 23, 2938–2955. [Google Scholar] [CrossRef]
- Alvarez, J.F.; Longva, T.; Engebrethsen, E.S. A methodology to assess vessel berthing and speed optimization policies. Marit. Econ. Logist. 2010, 12, 327–346. [Google Scholar] [CrossRef]
- Petering, M.E.H. Effect of block width and storage yard layout on marine container terminal performance. Transp. Res. Part E-Logist. Transp. Rev. 2009, 45, 591–610. [Google Scholar] [CrossRef]
- Thanos, E.; Toffolo, T.; Santos, H.G.; Vancroonenburg, W.; Vanden Berghe, G. The tactical berth allocation problem with time-variant specific quay crane assignments. Comput. Ind. Eng. 2021, 155, 107168. [Google Scholar] [CrossRef]
- Elgesem, A.S.; Skogen, E.S.; Wang, X.; Fagerholt, K. A traveling salesman problem with pickups and deliveries and stochastic travel times: An application from chemical shipping. Eur. J. Oper. Res. 2018, 269, 844–859. [Google Scholar] [CrossRef]
- Karakaya, E.; Vinel, A.; Smith, A.E. Relocations in container depots for different handling equipment types: Markov models. Comput. Ind. Eng. 2021, 157. [Google Scholar] [CrossRef]
- Krantz, J.; Johansson, T. Assessing the Energy Use and Carbon Dioxide Emissions of Maritime Infrastructure Projects BT—Sustainability in Energy and Buildings 2018. In Sustainability in Energy and Buildings 2018; Kaparaju, P., Howlett, R.J., Littlewood, J., Ekanyake, C., Vlacic, L., Eds.; Smart Innovation, Systems and Technologies; Springer: Cham, Switzerland, 2019; Volume 131, pp. 43–51. [Google Scholar] [CrossRef]
- Zhang, C.; Guan, H.; Yuan, Y.; Chen, W.; Wu, T. Machine learning-driven algorithms for the container relocation problem. Transp. Res. Part B Methodol. 2020, 139, 102–131. [Google Scholar] [CrossRef]
- Jebb, A.T.; Ng, V.; Tay, L. A Review of Key Likert Scale Development Advances: 1995–2019. Front. Psychol. 2021, 12, 637547. [Google Scholar] [CrossRef]
- He, S.; Blasch, J.; van Beukering, P. How does information on environmental emissions influence appliance choice? The role of values and perceived environmental impacts. Energy Policy 2022, 168, 113142. [Google Scholar] [CrossRef]
- La Agencia de Sustentabilidad y Cambio Climático. Sustentabilidad en los Puertos de Chile; Technical Report; La Agencia de Sustentabilidad y Cambio Climático: Santiago, Chile, 2020. [Google Scholar]
- Ministerio del Medio Ambiente. Estrategia Climatica de Largo Plazo de Chile: Camino a la Neutralidad y Resiliencia a más Tardar al 2050; Technical Report; Ministerio del Medio Ambiente: Santiago, Chile, 2021.
- Autoridad Portuaria de Valencia. La Electrificación de los Muelles del Puerto de València más Cerca—Valenciaport. 2022. Available online: https://www.valenciaport.com/la-electrificacion-de-los-muelles-del-puerto-de-valencia-mas-cerca/ (accessed on 28 August 2022).
- Önüt, S.; Tuzkaya, U.R.; Doğaç, B. A particle swarm optimization algorithm for the multiple-level warehouse layout design problem. Comput. Ind. Eng. 2008, 54, 783–799. [Google Scholar] [CrossRef]
- Valenciaport, F. Eficiencia Energética en Puertos: Tendencias y Mejores Prácticas; Technical Report; Organización de los Estados Americanos, Comisión Interamericana de Puertos: Valencia, Spain, 2016. [Google Scholar]
- Autoridad Portuaria de Valencia. Boletín Estadístico APV Diciembre de 2021; Technical Report; Autoridad Portuaria de Valencia: Valencia, Spain, 2021.
- Svenska Institutet for Standarder. Svenska Standard SS-ISO 668:2020: Series 1 Freight Containers—Classification, Dimensions and Ratings (ISO 668:2020, IDT), 5th ed.; Svenska Institutet for Standarder: Stockholm, Sweden, 2020; p. 11. [Google Scholar]
- McKinsey & Company. Global Energy Perspective 2022: Executive Summary: McKinsey’s Global Energy Perspective is a Collaboration between Energy Insights and Adjacent Practices; Technical Report April; McKinsey & Company: New York, NY, USA, 2022. [Google Scholar]
- Kumar, A.; Singh, P.; Raizada, P.; Hussain, C.M. Impact of COVID-19 on greenhouse gases emissions: A critical review. Sci. Total Environ. 2022, 806, 150349. [Google Scholar] [CrossRef] [PubMed]
- Bolaño-Ortiz, T.R.; Puliafito, S.E.; Berná-Peña, L.L.; Pascual-Flores, R.M.; Urquiza, J.; Camargo-Caicedo, Y. Atmospheric Emission Changes and Their Economic Impacts during the COVID-19 Pandemic Lockdown in Argentina. Sustainability 2020, 12, 8661. [Google Scholar] [CrossRef]
- Abu-Rayash, A.; Dincer, I. Analysis of the electricity demand trends amidst the COVID-19 coronavirus pandemic. Energy Res. Soc. Sci. 2020, 68, 101682. [Google Scholar] [CrossRef]
- Puerto Valparaíso. Plan Maestro Puerto Valparaíso; Technical Report; Puerto Valparaíso: Valparaíso, Chile, 2020. [Google Scholar]
- Empresa Portuaria San Antonio. Empresa Portuaria San Antonio Plan Maestro Diciembre 2013; Technical Report; Empresa Portuaria San Antonio: San Antonio, Chile, 2013. [Google Scholar]
- Cloquell Ballester, V.; Lo-Iacono-Ferreira, V.G.; Artacho-Ramírez, M.Á.; Capuz-Rizo, S.F. The Carbon Footprint of Valencia Port: A Case Study of the Port Authority of Valencia (Spain). Int. J. Environ. Res. Public Health 2020, 17, 8157. [Google Scholar] [CrossRef]
- Saravia de los Reyes, R.; Fernández-Sánchez, G.; Esteban, M.D.; Rodríguez, R.R. Carbon Footprint of a Port Infrastructure from a Life Cycle Approach. Int. J. Environ. Res. Public Health 2020, 17, 7414. [Google Scholar] [CrossRef]
- Ministerio para la Transición Ecológica y el Reto Demográfico. Nota Informativa Sobre el Avance de Emisiones de Gases de Efecto Invernadero Correspondientes al año 2021; Technical Report; Ministerio Para la Transición Ecológica y el Reto Demográfico: Madrid, Spain, 2022.
- Santos, T. Regional energy security goes South: Examining energy integration in South America. Energy Res. Soc. Sci. 2021, 76, 102050. [Google Scholar] [CrossRef]
- Wang, J.; Ghosh, S.; Olayinka, O.A.; Doğan, B.; Shah, M.I.; Zhong, K. Achieving energy security amidst the world uncertainty in newly industrialized economies: The role of technological advancement. Energy 2022, 261, 125265. [Google Scholar] [CrossRef]
- Rowe, F.; Robinson, C.; Patias, N. Sensing global changes in local patterns of energy consumption in cities during the early stages of the COVID-19 pandemic. Cities 2022, 129, 103808. [Google Scholar] [CrossRef]
- Chen, C.F.; Zarazua de Rubens, G.; Xu, X.; Li, J. Coronavirus comes home? Energy use, home energy management, and the social-psychological factors of COVID-19. Energy Res. Soc. Sci. 2020, 68, 101688. [Google Scholar] [CrossRef]
- Quintano, C.; Mazzocchi, P.; Rocca, A. Evaluation of the eco-efficiency of territorial districts with seaport economic activities. Util. Policy 2021, 71, 101248. [Google Scholar] [CrossRef]
- Puig, M.; Azarkamand, S.; Wooldridge, C.; Selén, V.; Darbra, R.M. Insights on the environmental management system of the European port sector. Sci. Total Environ. 2022, 806, 150550. [Google Scholar] [CrossRef]
- Lozano Pefaur, N. Metodología Aplicación y Análisis de Encuesta de Consumo Energético y Emisiones: En Puertos Marítimos; Technical Report; Fundación Chilena de Eficiencia Logística, Conecta Logística, Ministerio de Transportes y Telecomunicaciones (MTT): Santiago, Chile, 2022.
- SEP Sistema de Empresas. Terminales Portuarios Chilenos Logran Eficiencias Energéticas Similares a Pares Europeos y Norteamericano. 2022. Available online: https://www.sepchile.cl/2022/05/13/terminales-portuarios-chilenos-logran-eficiencias-energeticas-similares-a-pares-europeos-y-norteamericanos/ (accessed on 28 August 2022).
- Hervás-Peralta, M.; Poveda-Reyes, S.; Molero, G.D.; Santarremigia, F.E.; Pastor-Ferrando, J.P. Improving the Performance of Dry and Maritime Ports by Increasing Knowledge about the Most Relevant Functionalities of the Terminal Operating System (TOS). Sustainability 2019, 11, 1648. [Google Scholar] [CrossRef]
- Sifakis, N.; Tsoutsos, T. Planning zero-emissions ports through the nearly zero energy port concept. J. Clean. Prod. 2021, 286, 125448. [Google Scholar] [CrossRef]
- Zhong, H.; Hu, Z.; Yip, T.L. Carbon emissions reduction in China’s container terminals: Optimal strategy formulation and the influence of carbon emissions trading. J. Clean. Prod. 2019, 219, 518–530. [Google Scholar] [CrossRef]
- Yu, D.; Li, D.; Sha, M.; Zhang, D. Carbon-efficient deployment of electric rubber-tyred gantry cranes in container terminals with workload uncertainty. Eur. J. Oper. Res. 2019, 275, 552–569. [Google Scholar] [CrossRef]
- Tang, R.; Wu, Z.; Li, X. Optimal operation of photovoltaic/battery/diesel/cold-ironing hybrid energy system for maritime application. Energy 2018, 162, 697–714. [Google Scholar] [CrossRef]
- Xu, L.; Wen, Y.; Luo, X.; Lu, Z.; Guan, X. A modified power management algorithm with energy efficiency and GHG emissions limitation for hybrid power ship system. Appl. Energy 2022, 317, 119114. [Google Scholar] [CrossRef]
- Ashrafi, M.; Acciaro, M.; Walker, T.R.; Magnan, G.M.; Adams, M. Corporate sustainability in Canadian and US maritime ports. J. Clean. Prod. 2019, 220, 386–397. [Google Scholar] [CrossRef]
- Kang, D.; Kim, S. Conceptual Model Development of Sustainability Practices: The Case of Port Operations for Collaboration and Governance. Sustainability 2017, 9, 2333. [Google Scholar] [CrossRef]
- DIPRES Empresas Públicas. Empresas Públicas: Decretos Presupuesto Aprobados. 2021. Available online: https://www.dipres.gob.cl/599/w3-propertyvalue-20892.html (accessed on 30 September 2022).
- Alamoush, A.S.; Ballini, F.; Ölçer, A.I. Ports’ technical and operational measures to reduce greenhouse gas emission and improve energy efficiency: A review. Mar. Pollut. Bull. 2020, 160, 111508. [Google Scholar] [CrossRef]
- Jonathan, Y.C.E.; Kader, S.B.A. Prospect of Emission Reduction Standard for Sustainable Port Equipment Electrification. Int. J. Eng. 2018, 31, 1347–1355. [Google Scholar]
- Sadiq, M.; Ali, S.W.; Terriche, Y.; Mutarraf, M.U.; Hassan, M.A.; Hamid, K.; Ali, Z.; Sze, J.Y.; Su, C.L.; Guerrero, J.M. Future Greener Seaports: A Review of New Infrastructure, Challenges, and Energy Efficiency Measures. IEEE Access 2021, 9, 75568–75587. [Google Scholar] [CrossRef]
Publisher’s Note: MDPI stays neutral with regard to jurisdictional claims in published maps and institutional affiliations. |
© 2022 by the authors. Licensee MDPI, Basel, Switzerland. This article is an open access article distributed under the terms and conditions of the Creative Commons Attribution (CC BY) license (https://creativecommons.org/licenses/by/4.0/).