Abstract
Road transport is an integral part of economic activity and is therefore essential for its development. On the downside, it accounts for 30% of the world’s GHG emissions, almost a third of which correspond to the transport of freight in heavy goods vehicles by road. Additionally, means of transport are still evolving technically and are subject to ever more demanding regulations, which aim to reduce their emissions. In order to analyse the sustainability of this activity, this study proposes the application of novel Artificial Intelligence techniques (more specifically, Machine Learning). In this research, the use of Hybrid Unsupervised Exploratory Plots is broadened with new Exploratory Projection Pursuit techniques. These, together with clustering techniques, form an intelligent visualisation tool that allows knowledge to be obtained from a previously unknown dataset. The proposal is tested with a large dataset from the official survey for road transport in Spain, which was conducted over a period of 7 years. The results obtained are interesting and provide encouraging evidence for the use of this tool as a means of intelligent analysis on the subject of developments in the sustainability of road transportation.
1. Introduction & Previous Work
The 17 Sustainable Development Goals of the UN’s master plan include a determined line of action to halt global warming, with a direct link to reducing CO2 emissions. The United Nations Framework Convention on Climate Change (UNFCCC) and the Kyoto Protocol, both signed in 2002, point in the same direction.
Moreover, road transport is consubstantial to economic activity and, thus, essential to the future of our civilisation. Its counterpart accounted for 30% [1] of global CO2 emissions in 2015, and 29% of the 314,529 kilo-tonnes of GHG emitted in 2019 in Spain, with a total of 91,372 kilo-tonnes of CO2-equivalent emissions. In turn, it is estimated at a global and an EU level that nearly a quarter of these emissions correspond to freight transportation in heavy goods vehicles and buses [2,3], with this being one of the areas that has recorded sustained growth in recent years. Meanwhile, other modes of transport are progressively reducing their share, with an estimated increase of four times their current emissions by 2050 if no measures are adopted on the matter. In view of these data and forecasts, part of the focus of scientific studies and lines of action for governance have centred on this area, with progress being made on the development of proposals to regulate emissions for the equipment that performs this activity, which clearly accounts for 6% of the European Union’s total GHG emissions [4].
1.1. Sustainability in Transportation
The systematic review of intervention systems for the sustainability of road freight transport revealed that the most obvious line of action is the application of emerging technologies combined with decisive energy policies [5]. Other complementary lines of action focus on the dedication and adaptation of infrastructures to the effective development of this activity and the promotion of intermodality in the efficient management of supply chains [6]. In many cases, these are centred on a firm commitment to synchro-modality [7] and are even inclined to measure the sustainability of transport on the basis of its intermodality [8]. A distinction is also made between the effectiveness of different measures in favour of sustainability in collection and delivery transport, with improved applicability of collaborative techniques supported by information systems, as opposed to long-distance transport, where the results of technological optimisation in terms of transport equipment consumption and the suitability of infrastructures are more convincing [9]. Some models, reflecting the close connection between the economy and transportation, are based on the analysis of an economic sustainability approach to logistics models [10] and, along the same lines, some of them focus on the analysis of certain goods based on their production structure and the distribution of goods by road, analysing their entire activity [11]. There are also studies aimed at optimizing the transport process based on streamlining some of its sub-processes such as loading [12,13].
To this extent, we could say that we are following a classic perspective in the search for sustainability, which Corlu [14] points to in his review of the state of the art on optimising energy consumption in transport processes, as a combination of three main lines of action for road transport: (i) improving the load factor, understood as a reducer of emissions based on maximum occupancy of the means of transport, (ii) the use of collaborative techniques to optimise the allocation of means of transport and (iii) defining and monitoring sustainability objectives in the development of transport operations. Nevertheless, the most remarkable aspect of the ensemble is that all the models and studies point, in short, to a common underlying objective; the optimisation of energy consumed in the process of freight transport operations.
A line of research directly associated with the central objective of energy improvement is the study of emissions from transport equipment based on their age. Hassani et al. [15] determined that emissions in light vehicles can be up to five times higher depending on their age. Owing to this finding, this idea (sustainability based on the vehicles age) is given special relevance in this study.
These results are not arbitrary; instead, they are the result of the implementation of policies adopted by the vehicle manufacturing sector. Back in 2002, Ang-Olson and Schroeer [16] determined that the proper implementation of technical solutions in the production of heavy goods road transport vehicles could lead to a reduction of more than 11 billion litres of annual fuel consumption within a period of 10 years, associated with a decrease of 8.3 million tonnes of greenhouse gas emissions in the United States (US) alone. Since then, the governance mechanisms of the US and the EU have continued to impose mandates on the production of transport vehicles, aimed at reducing consumption and emissions [17]. As a result of these mandates, the so-called Euro emission standards have been progressively developed, with successively more demanding requirements on consumption and emissions of transport elements, as shown in Table 1, on carbon monoxide (CO), nitrogen oxides (NOX) and particulate matter (PM).

Table 1.
Emission standards adopted by the EU for diesel cars and heavy goods vehicles. Source: Own elaboration on the data of [18].
If we focus specifically on heavy goods vehicles, Haugen and Bishop [19] establish two complete vehicle emission samplings at loading and unloading points with significant freight movements, finally determining that a reduction from an average age of 7.8 to 6 years for these vehicles results in a significant reduction in emissions of up to 87% of suspended particulate matter. A subsequent study [20] also determined that the reduction in harmful NOX emissions decreased from 38 g to 9 g per kg of diesel fuel consumed by heavy goods vehicles from 2005 to 2020, representing a reduction of 76.3% in vehicles produced between these dates, i.e., an average reduction of 5% in emissions for each year of vehicle production during this period.
With possible differences in the quantification of emission improvements, there is one clear conclusion; heavy goods vehicles are a significant contributor to the emission of harmful gases, and the age of said vehicles is also a determining factor in their efficiency and sustainability.
1.2. Previous Work on Digitisation
New perspectives emerge when incorporating the digitalisation approach to road transportation. A study by a panel of 52 experts [21], highlights the value of process automation, the complete collection of data on digital information and the basis for the application of artificial intelligence for adequate performance and planning. Taking a step further in this direction, and with a clear focus on improving the management of supply chains, a study was carried out on the data collected by the EU in the Permanent Surveys of Goods Transport by Road [22]. With this purpose, a modelling was carried out on this activity, which was compiled by EUROSTAT for its member countries between 2011 and 2014. It was carried out under a Horizontal Collaboration model [23] and analysed the improvements that would have resulted from the application of Pooling techniques, similar to optimised freight groupings, and an implementation model of the so-called Physical Internet [24]. This was done by developing computer models that simulate each option, which are used to estimate a calculation of emissions. The end result is a clear advantage for the currently purely theoretical physical internet model.
More specifically, previous contributions have been made concerning the use of Artificial Intelligence (AI) in general and Machine Learning (ML) in particular, in order to address sustainability issues in road freight transport. In [25], an integrated fuzzy failure mode and effects analysis approach was proposed for the selection of risk mitigation strategies in track and trace tasks in the industry, which aimed to help managers choose a strategy considering the criticality of the risks under a limited budget. In addition, [26] presented a novel container transport optimisation model that incorporates the road network along with connectivity metrics, aiming to minimise total trip distance, truck fuel cost, container rental cost, and container movements between multiple consignees and haulers. More recently, [27] proposed a novel approach to predict the profit margin, on a customer basis, in the sustainable road freight transport sector by combining different ML methods. This helps managers to obtain useful information on strategic and sustainable development perspectives.
Differing from this previous study, the authors of this article have applied different ML techniques [28] to the same data family (see Section 2). Significant results have been obtained with respect to their link with the economic activity cycles. The economic turning points that occurred during the Great Recession in Spain have also been identified, based exclusively on various clustering techniques from the road freight transport dataset. A strong recession was observed until the second quarter of 2012, followed by a severe depression during the following period until the second quarter of 2013, which was then followed by a gradual recovery until in the second quarter of 2015, where a clear phase of economic growth emerged.
The dataset showing the average fleet age of heavy goods road vehicles never ceased to increase at any given moment during the period in question (although it increased at different rates). It almost exactly coincided at the points of economic inflection with the quartile (Q) distribution of the data, as can be seen in Figure 1. This accelerated or sustained growth corresponds to nothing other than a pattern of over-amortisation of the means of production in times of economic recession, as a measure to protect the profitability of its economic activity.
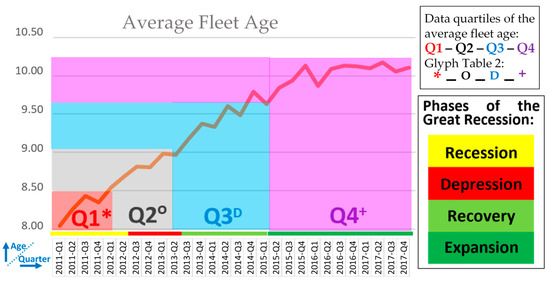
Figure 1.
Transport fleet age data series, divided into quartiles and related to the phases determined for the Great Depression. Source: Own elaboration.
We have decided to focus our studies on this data series grouped into quartiles owing to the following reasons: Firstly, it is specifically linked to the sustainability of transport activity; and secondly, its distribution of data by quartiles coincides with the economic phases. Furthermore, the study of this series, which is key to the interpretation of the sustainability of the fleet of freight transport vehicles, was neglected from the evolution and study of the rest of the series that reflected specific increases or decreases in the depression phase, which makes it advisable to apply complementary analysis techniques to it.
To address this problem, pioneer visualisation tools based on ML are put forward in this study. More specifically, clustering and Exploratory Projection Pursuit (EPP) techniques have been combined for the first time, under the frame of Hybrid Unsupervised Exploratory Plots (HUEPs), to support the visual analysis of sustainability data regarding road transportation. Likewise, the original formulation of HUEPs is extended, as well as new projection techniques being proposed and validated.
Thus far, researchers have widely studied clustering and EPP methods, concluding some of them that projection methods are not a useful in order to reduce the dimensionality of data for a following clustering [29,30]. Although this statement may be true in some cases, some other combinations of such methods have been previously proposed, different from this sequential application of methods. That is the case of [31,32], where the output of clustering methods (i.e., the assigned cluster for each data instance) is added to the projection obtained by EPP methods, that could be 2D or 3D. On the other hand, other authors have proposed [33,34] the simultaneous application of clustering and dimensionality-reduction methods. As opposed to these previous ideas, HUEPs have been recently proposed for the combination of clustering and projection methods, being independently applied.
The remaining sections of this article are organised as follows: the methods employed, together with the data on which they are applied, are described in Section 2. The results obtained in the experimental study are presented in Section 3, and the main conclusions in relation to these, as well as some proposals for future work, are presented in Section 4.
2. Materials and Methods
As previously stated, road transportation activity was researched in this study, with a specific focus on its sustainability. This was done by analysing a dataset described in Section 2.1 with the novel techniques that are presented in Section 2.2.
2.1. Dataset
Data were retrieved from two different sources:
- The Ministry of Transport, Mobility and Urban Agenda (Ministerio de Transportes, Movilidad y Agenda Urbana) of Spain, through its General Sub-Directorate of Economic Studies and Statistics.
- The European Road Freight Transport survey (ERFT). This survey relates to the activity of heavy goods vehicles licenced in Spain for the transport of goods. It has a sufficiently high sampling level to be of statistical representativeness for each Autonomous Region, in order to measure their transport operations. With this aim, the survey registers the movement of a single class of goods, from a departure point to a destination. The research was conducted in accordance with the corresponding regulation [35] and its subsequent revision [36]. The total number of records included on that database was 1,932,671 that has a sampling representativeness of 1,259,938,252 transport operations.
Data from between 2011 and 2017 were used. All the data represented quarterly levels of aggregation, which therefore included each variable in the study, a total of 28 values. The variables under consideration were:
- Transportation costs (B): based on a 100 percent increase above the average yearly prices in 2000, as determined by the Ministry of Development’s quarterly research studies.
- Fuel costs in Spain: quarterly midpoints weighted in centimes of a euro, as indicated by the data gathered by the Ministry of Development.
- Fuel costs in the EU: quarterly midpoints weighted in centimes of a euro, as indicated by the data gathered by the Ministry of Development.
- Number of tons transported (A, B, C): weight of transported goods.
- Completed trips (A, B, C): number of transport operations and empty distance.
- Empty distance (A, B): kilometres travelled without goods.
- Maximum load for transport operations (A, B): upper weight limit for completed trips in tons.
- Maximum load for empty distance (A, B): upper weight limit for empty distance covered in tons.
- Haulage distance (A, B): kilometres travelled.
- Empty haulage distance (A, B): kilometres travelled without goods.
- Quantity of vehicles represented (A): number of vehicles represented.
- Represented load capacity (A): upper load limit of the represented vehicles.
- Tons-kms (A, B, C): total tons transported, and distance covered in each haulage operation.
- Average fleet age (A, B): average amount of years elapsed since the registration of the vehicles. As previously indicated in Section 1.1, this is an important data finding in regard to sustainability. Owing to this, it is also used in the glyph metaphor.
- Average fleet age for empty distance (A, B): average amount of years elapsed since the registration of the vehicles travelling without goods.
The data series with assigned letters were sub-divided as according:
- (A)
- Type of transport: (A1) All transport; (A2) Own transport; (A3) Hire or reward.
- (B)
- Distance range: (B1) All distances; (B2) < 50 km; (B3) 51–100 km; (B4) 101–200 km; (B5) 201–300 km; (B6) > 300 km.
- (C)
- Geographic catchment: (C1) All catchments; (C2) Municipal; (C3) Regional; (C4) National; (C5) Importation; (C6) Exportation; (C7) Cabotage.
113 transport data series were calculated, with the values of the 28 previously indicated quarters in each one.
As a result, a dataset with high dimensionality is required to be analysed in order to investigate the sustainability of road transportation.
2.2. Hybrid Unsupervised Exploratory Plots
Hybrid Unsupervised Exploratory Plots (HUEPs) [37] have been recently proposed as a new visualisation tool to combine the outputs of Exploratory Projection Pursuit (EPP) and clustering methods in a novel and informative way. To address the well-known “curse of dimensionality” challenge and advancing in descriptive data analysis, both EPP and clustering methods are independently applied, and their outputs combined in a new way. In particular, 3 EPP methods were put forward, commonly known as Principal Component Analysis (PCA), Maximum Likelihood Hebbian Learning (MLHL), and Cooperative MLHL (CMLHL). There are different ways of implementing such methods; in the original formulation of HUEPs, they were implemented as Artificial Neural Networks.
Additionally, an extension to this study is included to improve the visualisation capability of HUEPs. In order to generate the displays, each original x vector (from the input space) is processed as follows:
- 2D projection of the vector is obtained by the applied EPP method (, ).
- The output of the clustering method (i.e., the assigned cluster number) is calculated ().
- The two previous outputs are combined in a 3D vector that is located in the output space ().
- Optionally, further information (sustainability data in the present study) is added to the visualisation by using the glyph metaphor.
Originally, HUEPs were conceived as a new way of intuitively displaying data by applying one partitional (k-means) or one hierarchical (agglomerative) clustering method together with one EPP method. As an evolution of this initial proposal, this study validates the incorporation of complementary and well-known display methods, namely Kernel-PCA (KPCA) [38] and Sammon Mapping (SM) [39].
KPCA is a non-linear extension of conventional PCA that takes the majority of kernel functions in order to obtain more interesting projections of data by extracting non-lineal principal components while keeping the computation cost at a reasonable level. On the other hand, SM was proposed as a special case of the distance-based metric Multidimensional Scaling family, being itself one of the first manifold learning proposals. Furthermore, SM can be considered as the first proposed nonlinear manifold learning method. These non-linear EPP methods are proposed for the first time under the frame of HUEPs as being ones of the main non-linear EPP methods. They are analysed in this study and validated with the data previously described.
2.3. Mehtodology
In order to validate the proposed application of HUEPs in the present work, visualizations have been obtained by combining the projections of EPP methods (PCA, MLHL, CMLHL, KPCA, and SM) with the output of clustering methods (k-means and agglomerative). Experiments have been performed tuning each one of the methods with the following parameter values.
PCA
- Number of principal components to be obtained: 2.
MLHL
- Number of projected dimensions to be obtained: 2.
- Learning rate: [0.01, 0.05].
- p parameter: [1, 2].
CMLHL
- Number of projected dimensions to be obtained: 2.
- Learning rate: [0.01, 0.05].
- p parameter: [1, 2].
- tau parameter: [0.00000001, 0.01].
KPCA
- Number of projected dimensions to be obtained: 2, 3.
- Kernel: linear, polynomial, gaussian.
SM
- Number of projected dimensions to be obtained: 2, 3.
- k-means.
- Number of clusters: 2, 3, 4, 6, 8.
- Distance: sqEuclidean, Cityblock, Cosine, Correlation.
Agglomerative
- Number of clusters (cutoff): 2, 3, 4, 6, 8.
- Distance: Euclidean, sEuclidean, sqEuclidean, Cityblock, Hamming, Jaccard, Minkowski, Chebychev, Spearman, Cosine, Correlation.
- Linkage: Average, Centroid, Complete, Median, Single, Ward, Weighted.
3. Results
The HUEP displays obtained are shown in this section. Firstly, Figure 2 shows the HUEP display obtained by combining agglomerative clustering with different EPP techniques. As a result, the influence of the different EPP techniques on the obtained results can be compared. Due to this, additional information is not shown through the glyph metaphor in this figure, to enable the sole comparison of the projections. For the sake of brevity, the most interesting graphical displays are shown and those obtained by some of the EPP methods are not included in Figure 2.
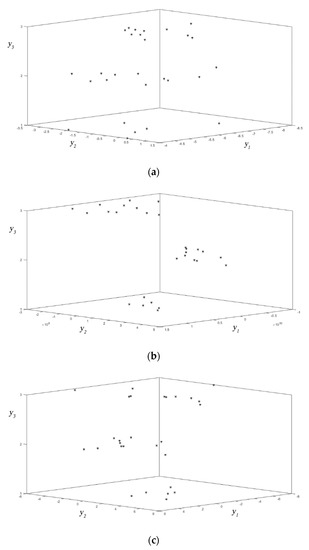
Figure 2.
HUEPs obtained by applying agglomerative clustering (k = 3, distance = sEuclidean, linkage = average) to the analysed dataset, varying the EPP technique: (a) CMLHL, (b) KPCA, (c) SM.
The display obtained by KPCA can be considered the most revealing. It allows the structure of the data to be observed more clearly, as it represents the data in a more compact form and thus allows trends to be analysed with more clarity. Since it is not possible to include all the results obtained in this study, only results obtained using KPCA are shown in the rest of this section.
These results validate the main proposal of the present research: extending the original HUEP formulation by adding new EPP methods that can improve the visualization of a given dataset. For the dataset under analysis, none of the EPP methods in the original HUEP formulation provides with the best projection, but one of the new ones (KPCA) instead.
Results including the Glyph Metaphor
After having selected KPCA as the EPP model that offers the best projections for the data analysed, the results using the glyph metaphor are presented in this section. It is worth mentioning that for any other dataset, this may not be the most appropriate EPP model.
In this section, additional information on the Fleet Age variable (sustainability data) is incorporated in the following graphs. The symbols for each piece of data are differentiated according to the quartile to which they belong, consistent with the value taken for that variable, in accordance with the symbols shown in Table 2.
Table 2.
Legend for the graphs using the glyph metaphor according to the values of the sustainability-related feature (Average age of the vehicle fleet).
In accordance with the above, the previously selected HUEP graph is shown (Figure 2b), although with the sustainability feature now incorporated. Additionally, the figure is enhanced by a form to guide the reader in the interpretation of the results.
In Figure 3 it is possible to see that a clear differentiation of the data quartiles of the series is obtained, and a clear line of progression can be marked on the result (dashed yellow line). The yellow line is associated to the temporal progression of data. From a practical point of view, the graph shows that the visualisation obtained is useful when determining the phases of progression of the age series; 1. the initial age, 2. the phase of over-amortisation of means of transport and 3. the phase of the new average age of the fleet.
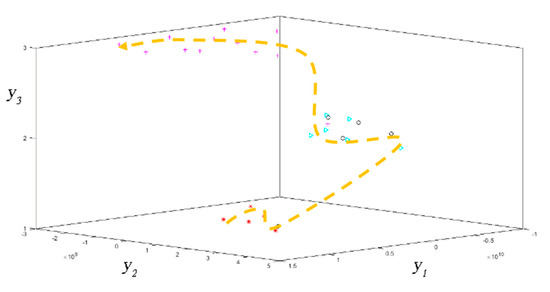
Figure 3.
HUEP obtained by applying KPCA and agglomerative clustering (k = 3, distance = sEuclidean, linkage = average) to the analysed dataset, using the sustainability feature in the glyph metaphor. The yellow line is associated to the temporal progression of data.
To appreciate the impact of the k parameter of the clustering technique on the display, different visualisations are presented below (Figure 4), with the same EPP and clustering models, but with a varying number of clusters.
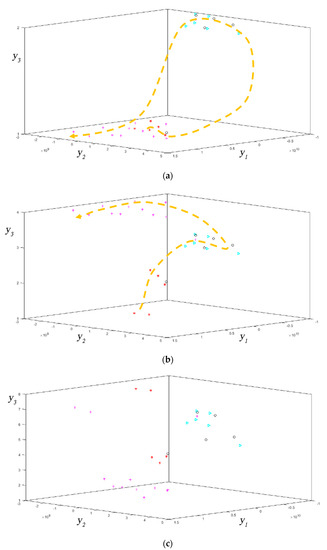
Figure 4.
HUEPs obtained with KPCA and agglomerative clustering (distance = sEuclidean, linkage = average), showing the sustainability feature in the glyph metaphor and a varying number of clusters: (a) k = 2, (b) k = 4, and (c) k = 8.
After analysing the results shown in Figure 4, we can deduce that for k = 2, the visualisation is limited to differentiating between the phases of sustained amortisation and those of increasing amortisation. For k = 4, we can see a progression of increasing age, but compared to the significant result for k = 3 shown in Figure 3, it is limited to differentiating a new cluster in the initial periods of the study. The result for k = 8 does not seem significant. It can therefore be concluded that 3 is an appropriate number of clusters for the dataset under study.
Next, the visualisations obtained by partitional clustering are presented, with the aim of observing the influence of the clustering technique used, comparing it with the previous results (agglomerative clustering). Since 3 has been revealed as an appropriate number of clusters, different HUEPs obtained with k-means for a number of clusters close to 3 are shown in Figure 5.
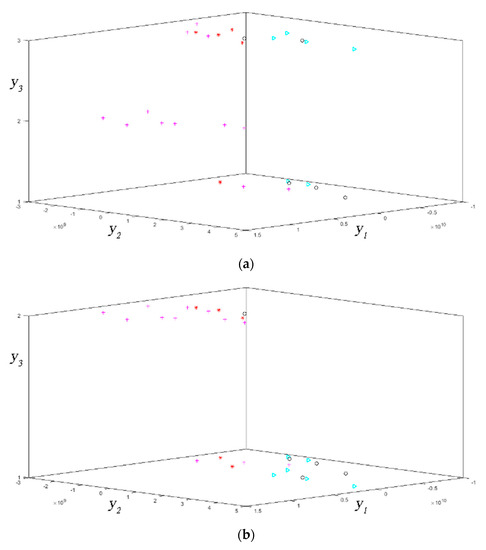
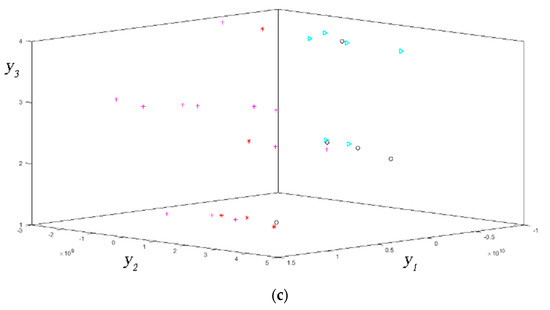
Figure 5.
HUEPs obtained by applying KPCA and k-means clustering (distance = sEuclidean, linkage = average), showing the sustainability feature in the glyph metaphor and a varying number of clusters: (a) k = 2, (b) k = 3, and (c) k = 4.
The results shown in Figure 5 do not provide a clear or convincing display. No significant clustering can be inferred with respect to the progression of the data in terms of the age of the transport fleet in any of the tested configurations. We can therefore conclude that the application of k-means does not provide better displays of the data under study when compared to the agglomerative method.
Finally, the enhanced display obtained by the extended HUEPs is compared to that obtained by the newly applied KPCA method in order to identify what HUEPs can provide users with. The results obtained by KPCA (2D and 3D) are shown in Figure 6, comprising the glyph metaphor to support direct comparison.
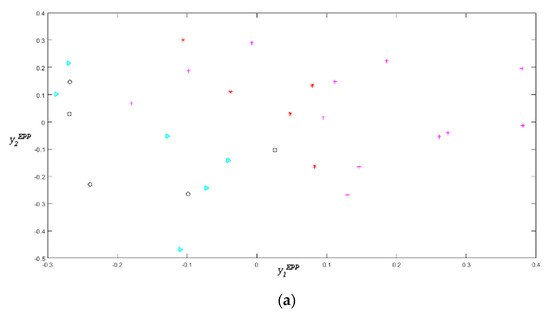
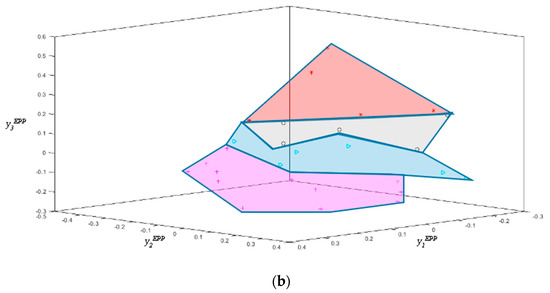
Figure 6.
Projection obtained by applying KPCA in isolation to the analysed dataset, showing the sustainability feature in the glyph metaphor: (a) 2D and (b) 3D.
In Figure 6, we can see that after applying KPCA in isolation, the display is less informative than the one obtained through the HUEPs, as it does not allow for a clear identification of the structure of the data. On the other hand, a certain improvement is obtained in its 3D display as opposed to the 2D display. In the 3D view, significant groups of quartiles of fleet age are clustered in related areas of the three-dimensional space, as indicated in the figure by the coloured areas corresponding to the quartiles. Thus, it can be said that the new HUEP formulation reveals a much more interesting visualization of the dataset. Thanks to it, sustainability of the fleet (regarding the age) can be visually and intuitively analysed.
4. Conclusions and Future Work
On the one hand, it is clear that the development of road freight transport activity is intrinsically necessary for economic activity and the growing exchange of material goods between different areas of the planet, while on the other hand, its deployment entails a significant rate of GHG emissions. Additionally, it is also clear that the positive progression in the development of means of transport has led to significant reductions in the emission of gases and particles into the atmosphere with the most up-to-date equipment. As a consequence of the above, tools for the study, control and prediction of the evolution of the age of means of transport can be deemed priceless for corporate governance and management of this activity. More specifically, in their lines of commitment to sustainability, which may enable them to implement stimulus plans and social responsibility policies aimed at renewing the fleet of transport vehicles.
In this sense, the HUEPs (see Figure 3 and Figure 4) constitute a valid, fast and intuitive visual tool to study the progression of the fleet age based on a set of data related to road freight transport activity.
Regarding the techniques employed for the dataset under study, it is worth noting that one of the new EPP techniques tested (KPCA) is the one that provides the best displays (see Figure 2), further confirming the proposed extension of the original formulation of the HUEPs. It has also been proven that the combination of KPCA with a clustering method provides better results than the 3D displays generated only with the EPP technique (see Figure 3 and Figure 6). As for the clustering techniques, the suitability of the agglomerative method versus k-means has been confirmed, although it is necessary to adjust the number of clusters (k parameter) to the data (see Figure 4 and Figure 5). As previously mentioned, this is the best performing EPP method for the dataset under analysis. It may vary for other datasets.
For future work, it is important to highlight that there are also other factors related to the study of the sustainability of road freight transport activity, which could be the subject of a study of the application of these and other techniques linked to ML, which would probably yield valuable conclusions. A clear example would be the study of the occupation of means of transport in the development of their activity, in addition to scaling the dimension of the data, considering the whole of Europe. As for ML techniques, the application of HUEPs in this field is proposed, adding other clustering techniques such as those based on density.
Author Contributions
Conceptualization, C.A.d.A., S.G. and Á.H.; methodology, C.A.d.A., D.U. and R.A.; software, D.U. and Á.H.; validation, C.A.d.A. and S.G.; formal analysis, R.A., Á.H.; investigation, C.A.d.A., D.U. and Á.H.; data curation, C.A.d.A. and D.U.; writing—original draft preparation, C.A.d.A. and Á.H.; writing—review and editing, C.A.d.A., D.U. and Á.H.; visualization, D.U. and Á.H.; supervision, C.A.d.A. and Á.H. All authors have read and agreed to the published version of the manuscript.
Funding
This research received no external funding.
Data Availability Statement
Restrictions apply to the availability of these data. Data was obtained from the Spanish Ministry of Transport and the Environment.
Acknowledgments
We are grateful for the complete datasets of the Permanent Survey of Goods Transport by Road (Encuesta Permanente de Transporte de Mercancías por Carretera), facilitated by the General Sub-Directorate of Economic Studies and Statistics of the Ministry of Transport and the Environment (Subdirección General de Estudios Económicos y Estadísticas del Ministerio de Transportes y Medio Ambiente) of Spain.
Conflicts of Interest
The authors declare no conflict of interest.
References
- OECD/IFT. International Transport Forum: Global Dialogue for Better Transport The Carbon Footprint of Global Trade Tackling Emissions from International Freight Transport; Organisation for Economic Co-operation and Development-IFT: Leipzig, Germany, 2015. [Google Scholar]
- Ministerio para la Transición Ecologica y el Reto demográfico. Secretaría de Estado De Medio Ambiente Dirección General De Calidad Y Evaluación Ambiental. Centro virtual de publicaciones del Ministerio de Transporte. In Inventario Nacional de Emisiones a la Atmósfera Emisiones de Gases de Efecto Invernadero; Movilidad y Agenda Urbana: Madrid, Spain, 2021. [Google Scholar]
- European-Commission. Reducing CO2 Emissions from Heavy-Duty Vehicles | Climate Action. Available online: https://ec.europa.eu/clima/policies/transport/vehicles/heavy_en (accessed on 16 June 2021).
- Consejo-Europeo. Reglamento del Parlamento Europeo y del Consejo Por el Que se Establecen Normas de Comportamiento en Materia de Emisiones de CO2 Para Vehículos Pesados Nuevos; Official Journal of the European Union: Brussels, Belgium, 2019; Volume 198. [Google Scholar]
- Tob-Ogu, A.; Kumar, N.; Cullen, J.; Ballantyne, E.E.F. Sustainability Intervention Mechanisms for Managing Road Freight Transport Externalities: A Systematic Literature Review. Sustainability 2018, 10, 1923. [Google Scholar] [CrossRef] [Green Version]
- Shankar, R.; Pathak, D.K.; Choudhary, D. Decarbonizing freight transportation: An integrated EFA-TISM approach to model enablers of dedicated freight corridors. Technol. Forecast. Soc. Change 2019, 143, 85–100. [Google Scholar] [CrossRef]
- Agbo, A.A.; Li, W.; Zheng, L.; Zhang, Y.; Atombo, C. Optimisation of intermodal freight transport network. Eur. Transp. Trasp. Eur. 2017, 63, 1. [Google Scholar]
- Kelle, P.; Song, J.; Jin, M.; Schneider, H.; Claypool, C. Evaluation of operational and environmental sustainability tradeoffs in multimodal freight transportation planning. Int. J. Prod. Econ. 2019, 209, 411–420. [Google Scholar] [CrossRef]
- Meyer, T. Decarbonizing road freight transportation—A bibliometric and network analysis. Transp. Res. Part D Transp. Environ. 2020, 89, 102619. [Google Scholar] [CrossRef]
- Rossi, T.; Pozzi, R.; Pirovano, G.; Cigolini, R.; Pero, M. A new logistics model for increasing economic sustainability of perishable food supply chains through intermodal transportation. Int. J. Logist. Res. Appl. 2021, 24, 346–363. [Google Scholar] [CrossRef]
- De Campos, R.S.; Simon, A.T.; Martins, F.d. Assessing the impacts of road freight transport on sustainability: A case study in the sugar-energy sector. J. Clean. Prod. 2019, 220, 995–1004. [Google Scholar] [CrossRef]
- Macioszek, E. Essential techniques for fastening loads in road transport. Zesz. Nauk. Transp. Politech. Śląska 2021, 110, 97–104. [Google Scholar] [CrossRef]
- Macioszek, E. Oversize cargo transport in road transport ⇓ Problems and issues. Sci. J. Silesian Univ. Technol. Ser. Transp. 2020, 108, 133–140. [Google Scholar] [CrossRef]
- Corlu, C.G.; de la Torre, R.; Serrano-Hernandez, A.; Juan, A.A.; Faulin, J. Optimizing Energy Consumption in Transportation: Literature Review, Insights, and Research Opportunities. Energies 2020, 13, 1115. [Google Scholar] [CrossRef] [Green Version]
- Hassani, A.; Safavi, S.R.; Hosseini, V. A comparison of light-duty vehicles’ high emitters fractions obtained from an emission remote sensing campaign and emission inspection program for policy recommendation. Environ. Pollut. 2021, 286, 117396. [Google Scholar] [CrossRef]
- Ang-Olson, J.; Schroeer, W. Energy Efficiency Strategies for Freight Trucking: Potential Impact on Fuel Use and Greenhouse Gas Emissions. Transp. Res. Rec. J. Transp. Res. Board 2002, 1815, 11–18. [Google Scholar] [CrossRef]
- Comisión_Europea. Directiva 2002/80/CE de la Comisión de 3 de Octubre de 2002 por la que se Adapta al Progreso Técnico la Directiva 70/220/CEE del Consejo Relativa a Las Medidas Que Deben Adoptarse Contra la Contaminación Atmosférica Causada Por Las Emisiones de Los Vehícu; OPOCE: Brussels, Belgium, 2002. [Google Scholar]
- Comisión_Europea. Emisiones de los vehículos pesados (Euro VI): Normas de certificación Diario Oficial de la Comisión Europea; 2005. Available online: https://eur-lex.europa.eu/legal-content/ES/TXT/HTML/?uri=LEGISSUM:mi0029&from=ES (accessed on 30 July 2021).
- Haugen, M.J.; Bishop, G.A. Long-Term Fuel-Specific NOx and Particle Emission Trends for In-Use Heavy-Duty Vehicles in California. Environ. Sci. Technol. 2018, 52, 6070–6076. [Google Scholar] [CrossRef] [PubMed]
- Yu, K.A.; McDonald, B.C.; Harley, R.A. Evaluation of Nitrogen Oxide Emission Inventories and Trends for On-Road Gasoline and Diesel Vehicles. Environ. Sci. Technol. 2021, 55, 6655–6664. [Google Scholar] [CrossRef] [PubMed]
- Pernestål, A.; Engholm, A.; Bemler, M.; Gidofalvi, G. How Will Digitalization Change Road Freight Transport? Scenarios Tested in Sweden. Sustainability 2021, 13, 304. [Google Scholar] [CrossRef]
- Mangina, E.; Narasimhan, P.K.; Saffari, M.; Vlachos, I. Data analytics for sustainable global supply chains. J. Clean. Prod. 2020, 255, 120300. [Google Scholar] [CrossRef]
- Soysal, M.; Bloemhof-Ruwaard, J.M.; Haijema, R.; van der Vorst, J.G. Modeling a green inventory routing problem for perishable products with horizontal collaboration. Comput. Oper. Res. 2018, 89, 168–182. [Google Scholar] [CrossRef]
- Montreuil, B. Toward a Physical Internet: Meeting the global logistics sustainability grand challenge. Logist. Res. 2011, 3, 71–87. [Google Scholar] [CrossRef]
- Dadsena, K.K.; Sarmah, S.P.; Naikan, V.N.A. Risk evaluation and mitigation of sustainable road freight transport operation: A case of trucking industry. Int. J. Prod. Res. 2019, 57, 6223–6245. [Google Scholar] [CrossRef]
- Wong, E.Y.C.; Tai, A.H.; So, S. Container drayage modelling with graph theory-based road connectivity assessment for sustainable freight transportation in new development area. Comput. Ind. Eng. 2020, 149, 106810. [Google Scholar] [CrossRef]
- Budak, A.; Sarvari, P.A. Profit margin prediction in sustainable road freight transportation using machine learning. J. Clean. Prod. 2021, 314, 127990. [Google Scholar] [CrossRef]
- Alonso de Armiño, C.; Manzanedo, M.Á.; Herrero, Á. Analysing the intermeshed patterns of road transportation and macroeconomic indicators through neural and clustering techniques. Pattern Anal. Appl. 2020, 23, 1059–1070. [Google Scholar] [CrossRef]
- Desarbo, W.; Jedidi, K.; Cool, K.; Schendel, D. Simultaneous multidimensional unfolding and cluster analysis: An investigation of strategic groups. Mark. Lett. 1991, 22, 129–146. [Google Scholar] [CrossRef] [Green Version]
- Vichi, M.; Kiers, H.A.L. Factorial k-means analysis for two-way data. Comput. Stat. Data Anal. 2001, 37, 49–64. [Google Scholar] [CrossRef]
- Sánchez, R.; Herrero, Á.; Corchado, E. Visualization and clustering for SNMP intrusion detection. Cybern. Syst. 2013, 44, 505–532. [Google Scholar] [CrossRef] [Green Version]
- Arroyo, Á.; Herrero, Á.; Corchado, E.; Tricio, V. A hybrid intelligent system for the analysis of atmospheric pollution: A case study in two European regions. Log. J. IGPL 2017, 25, 915–937. [Google Scholar] [CrossRef]
- Bolton, R.J.; Krzanowski, W.J. Projection Pursuit Clustering for Exploratory Data Analysis. J. Comput. Graph. Stat. 2003, 12, 121–142. [Google Scholar] [CrossRef]
- Yatracos, Y.G. Detecting Clusters in the Data from Variance Decompositions of Its Projections. J. Classif. 2013, 30, 30–55. [Google Scholar] [CrossRef]
- Consejo-Europeo. Reglamento (CE) N° 1172/98 del Consejo de 25 de Mayo de 1998 Sobre la Relación Estadística de los Transportes de Mercancías por Carretera; OPOCE: Brussels, Belgium, 1998. [Google Scholar]
- Consejo-Europeo. Reglamento (UE) No 70/2012 del Parlamento Europeo y Del Consejo de 18 de Enero de 2012 Sobre la Relación Estadística de Los Transportes de Mercancías Por Carretera; Official Journal of the European Union: Brussels, Belgium, 2012. [Google Scholar]
- Herrero, Á.; Jiménez, A.; Bayraktar, S. Hybrid Unsupervised Exploratory Plots: A Case Study of Analysing Foreign Direct Investment. Complexity 2019, 2019, 6271017. [Google Scholar] [CrossRef]
- Schölkopf, B.; Smola, A.; Müller, K.-R. Nonlinear Component Analysis as a Kernel Eigenvalue Problem. Neural Comput. 1998, 10, 1299–1319. [Google Scholar] [CrossRef] [Green Version]
- Sammon, J.W. A Nonlinear Mapping for Data Structure Analysis. IEEE Trans. Comput. 1969, 100, 401–409. [Google Scholar] [CrossRef]


Publisher’s Note: MDPI stays neutral with regard to jurisdictional claims in published maps and institutional affiliations. |
© 2022 by the authors. Licensee MDPI, Basel, Switzerland. This article is an open access article distributed under the terms and conditions of the Creative Commons Attribution (CC BY) license (https://creativecommons.org/licenses/by/4.0/).