1. Introduction
Ensuring a high quality of life in cities, by responding to the growing needs of citizens and city visitors, without causing excessive consumption of natural and environmental resources is one of the main challenges of contemporary urban planning. This ambitious goal can be achieved by promoting a more efficient use of resources, i.e., the soil, which is considered a finite asset and for this reason it must be preserved and protected.
Land use efficiency is a highly debated issue at an international level as several aspects can contribute to defining the concept of “efficiency” [
1,
2]. However, if the term is contextualized in the field of urban development, this is closely linked to the concept of “public value”.
The terms “land take” and “public value capture” (or often “land value capture”) as well as their use in different contexts have been discussed by scholars in the scientific literature in recent years. Marquard et al. (2020) argued towards bridging both notions of land consumption and
LT. They proposed ways of addressing current ambiguities and suggested prioritizing the term “land take” in the EU context. Thus, the conceptual clarity around land consumption and
LT is enhanced and a precondition for solidly informing respective policies and decisions provided [
3]. Barbosa et al. (2016) concluded that the implementation of the 2020 land take milestone will foster more efficient use of land and minimize negative impacts on non-artificial land uses [
4]. Colsaet et al. (2018) provided a systematic review on drivers of
LT and urban land expansion. In this regard, they summarized the causal relationships between land take and different explanatory factors. Scholars concluded that “the effect of many factors however remains relatively undocumented or controversial in the reviewed literature, including widely used policy instruments” [
5].
Hendricks (2020) emphasized “public value capture” as one of the key factors of responsible land management and that smart instruments are needed for a successful implementation. He also characterized PVC as an essential phenomenon to improve the refinancing of public infrastructure and keep the necessary budget for other important duties such as social care [
6].
This article gives attention to the issue of reducing land consumption: a strategic objective that has two main goals. The first one is preserving the natural areas on the edge of urban fabrics and the second is orienting the response to growing needs by recovering portions of abandoned or underused cities.
The article deals with this topic by analyzing how the EU goal of achieving a net land consumption of zero by 2050 [
7] is addressed in various European member states.
Four different case studies were chosen, they differ both in LT level and in morphological and demographic context. In this way it is possible to have a broad and representative overview of how the aspects mentioned above are dealt with in Europe. The geographical areas identified as a case study are the Lombardy region in northern Italy, Latvia, the Flanders region in Belgium and, finally, Malta. The chosen territories also differ from an administrative point of view as Lombardy and Flanders frame the theme of territorial governance and land use from a regional point of view while Latvia and Malta address it from a national point of view.
The article consists of a first part, more theoretical, in which the principles underlying the research are framed and how the EU objective is implemented at the local level. Subsequently, the issue of land consumption at European level is illustrated by showing some significant data and indicators that highlight how there is a strong disparity at European level in the management of this important and valuable resource. In the third chapter the case studies are contextualized, paying attention to both the statistical data regarding land use and the policies in place to achieve the “no net land take by 2050” (NNLT) target [
7]. Finally, the link between the reduction of land consumption, the efficient use of land and the use of public value capture instruments is analyzed.
The innovative aspects that this article intends to pursue concern the analysis of the mechanisms that exist between the definition of land consumption reduction policies and the PVC mechanisms within urban planning operations.
One of the main reasons why land consumption is such a topical issue is that interventions in an extra-urban environment are economically more advantageous than those within the consolidated city. Therefore, PVC tools can become an important lever in this field as they can balance the economic gap and can help to make interventions aimed at redeveloping already urbanized areas rather than vacant land more attractive. As emerges from the analysis of the theoretical framework, the study of PVC tools almost always focuses on the relationships between operators. The novelty of this article lies in the fact that it is taken a step further, analyzing what are the effects that the application of these tools can have on urban development, namely in terms of reducing land consumption.
The other new aspect concerns the contribution made to the formulation of a link between increasing the efficiency of land use and the application of value capture tools.
The paper tries to demonstrate, in fact, how in cases where these tools are more widespread it is easier to pursue urban planning policies based on the principles of sustainable development and land thrift.
2. Literature Review
The last years have been characterized by a growing attention on the part of institutions and citizens to the issues of sustainable development. The international agendas have also defined a series of actions and objectives to be implemented in the short term to reduce the impact of anthropogenic activities on natural systems. However, public bodies do not always have the resources to develop policies and strategies capable of responding to the increasing stresses to which the territories are exposed.
The issue of land consumption is very topical, and the institutions are addressing it with diversified tools ranging from awareness campaigns to the definition of a strategic framework for actions to achieve the NNLT target [
8].
However, there are issues when these strategies must be translated into concrete actions. The main problem is the fact that land consumption is a local phenomenon with repercussions on a national and supranational scale.
If the European reference framework is analyzed, it is feasible to see how this phenomenon takes on different characteristics according to the various Member States. Moreover, both locally, within individual states, and internationally, i.e., between one nation and another, the way of defining and quantifying the quality of vacant soils and the method of calculating the soil consumed take on different facets. These territorial divergences can make it difficult to quantify the urbanized land and compare the level of LT in various European countries.
For this reason, it is important to start from the definition that the European Union has given of
LT: “the area of land used for housing, industrial and commercial purposes, health care, education, nursing infrastructure, roads and rail networks, recreation (parks and sports grounds), etc. In land-use planning, it usually corresponds to all land use beyond agriculture, semi-natural areas, forestry, and water bodies” [
9].
The reduction of land consumption can be achieved through a more efficient and rational use of resources. The application of PVC instruments can help pursue the objectives indicated above.
PVC is closely linked to the institutions that define property in land. Value capture focuses on realizing as public revenue, i.e., through taxes and fees. Land development measures refer to qualitative changes in land-use intensity, involvement of various stakeholders, and facing noteworthy challenges and problem issues during its implementation [
10]. In this paper, PVC includes all instruments that capture all possible increases of the value of land and buildings, whether they are considered as taxes or not. It focuses primarily on capturing unearned benefits resulting from actions other than the landowners. The specific focus of the paper is on the possible impacts of PVC instruments regarding greenfield developments of land and how to discourage further
LT.
The implementation of best practices and solutions developed by networks of virtuous cities to provide an answer to the problems characterizing urban systems and to implement the objectives identified by international agendas requires municipalities to have the availability of resources, especially economic ones, which the public have not available. In addition, administrations are often burdened with high costs for the normal management of the city and for this reason, the implementation of long-term strategies is difficult [
11].
The need to find resources has led administrators to involve private operators more and more frequently within the planning process. The development of public-private partnerships is one of the cornerstones on which the implementation of urban planning forecasts is based, in more detail, the development of the public city is often linked to operations of a private nature [
12].
From this perspective, the policies, and mechanisms for generating and capturing value are inserted and urban regeneration is a set of policies and processes capable of encouraging private operators to invest, helping the pursuit of sustainable development goals [
13].
For this reason, there is research that in recent years have questioned the mechanisms that regulate the relationship, not always linear, between private operators, stakeholders, and public administrations [
11].
It is now well established that urban planning forecasts need resources from the private sphere to be translated into reality. The resources that public bodies can budget are sufficient to meet the most pressing needs, but the implementation of the strategies identified by the international agendas requires much more liquidity than is available. For this reason, administrations seek to capitalize on private resources using value capture tools and techniques [
12,
14].
The considerations made so far can be implemented in the analysis of the steps of value creation defined by Hendricks [
15]. At this juncture it can be seen how Hendricks approaches territorial development by describing the process of urbanization of a free area on which building rights are lowered. This mechanism is undoubtedly the most widespread and the one that has been most applied within the settlement growth process. However, the issues related to land use have introduced within the land regulation system some limitations such as, for example, the goal of net-zero
LT by 2050 [
16].
3. Material and Methods
To determine a cognitive reference framework that shows the spread, at national level, of land consumption and that allows comparing the spread of this phenomenon among the various European countries, GIS analyses have been developed based on the Corine Land Cover (CLC) database developed by the Copernicus program of the European Spatial Agency.
In this optic, the intensity of
LT is calculated as
LT in the given period as a percentage of the area of artificial surfaces. The limitations of monitoring
LT dynamics must be considered before setting policy goals. Decoville and Schneider argue that the tools used to assess the phenomenon at the EU level (CLC and Lucas) cannot accurately compare small territories such as Luxembourg and Malta, because they are not accurate enough at this scale. A purely quantitative approach cannot capture, alone, the diversity and complexity of the challenges of each territory [
17].
The minimum mapping unit for Corine Land Cover is 25 ha, whilst the minimum mapping unit for CLC changes is set at 5 ha [
18]. Similarly, Barbarosa et al. state that for countries with a small area,
LT could therefore be underestimated, as changes in parcels of less than 5 ha can occur in these countries. These changes can be very important for
LT statistics. However, it was generally not possible to take them into account at a national level [
4].
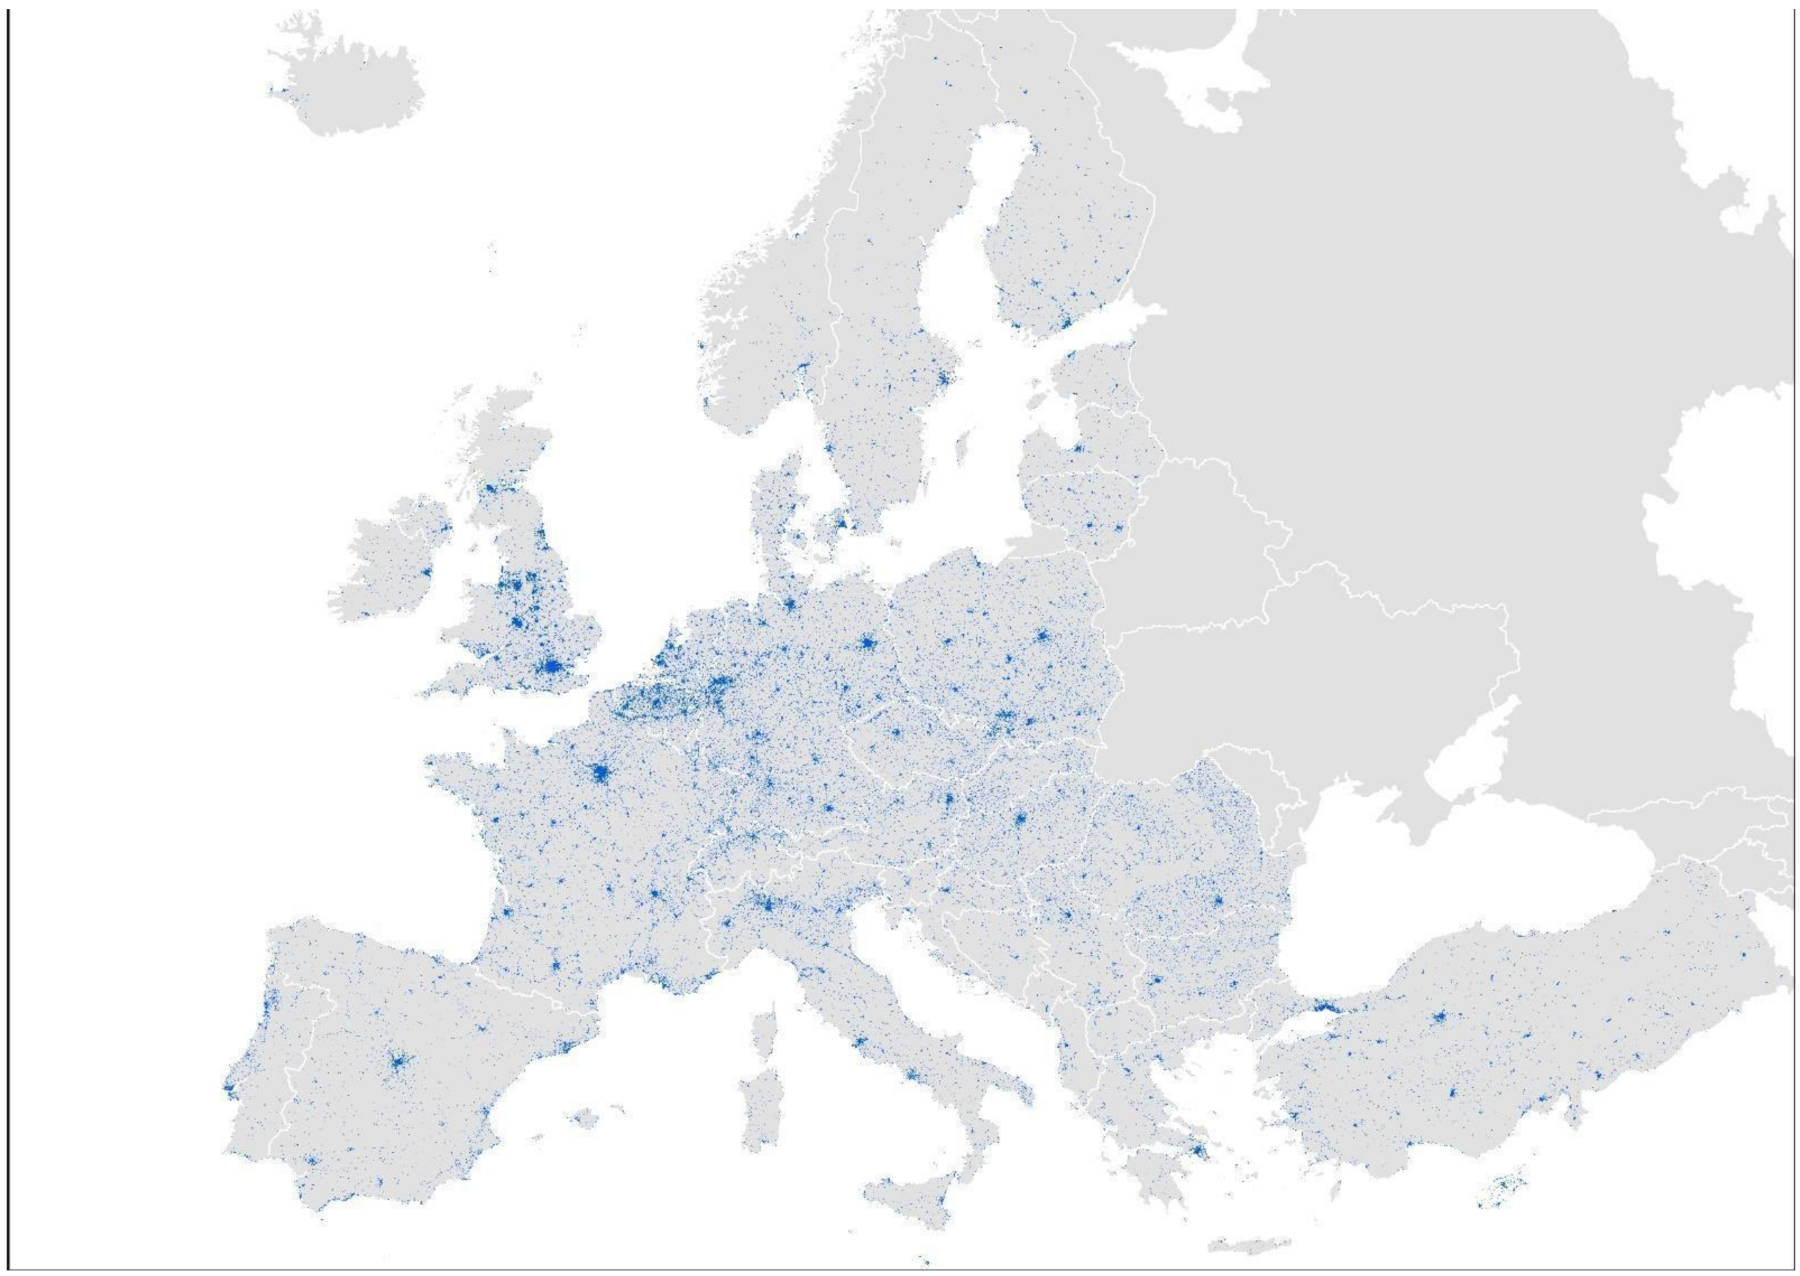
By importing the data relating to the last update of the CLC database into the GIS software and isolating all polygons referring to level 1, i.e., those representing urban areas, it was possible to identify their spatial distribution across Europe (
Figure 1). In this way it was possible to identify the anthropized soil for each nation, that is, the one that no longer has the original natural characteristics and for this reason it corresponds to the definition given by the EU of consumed soil.
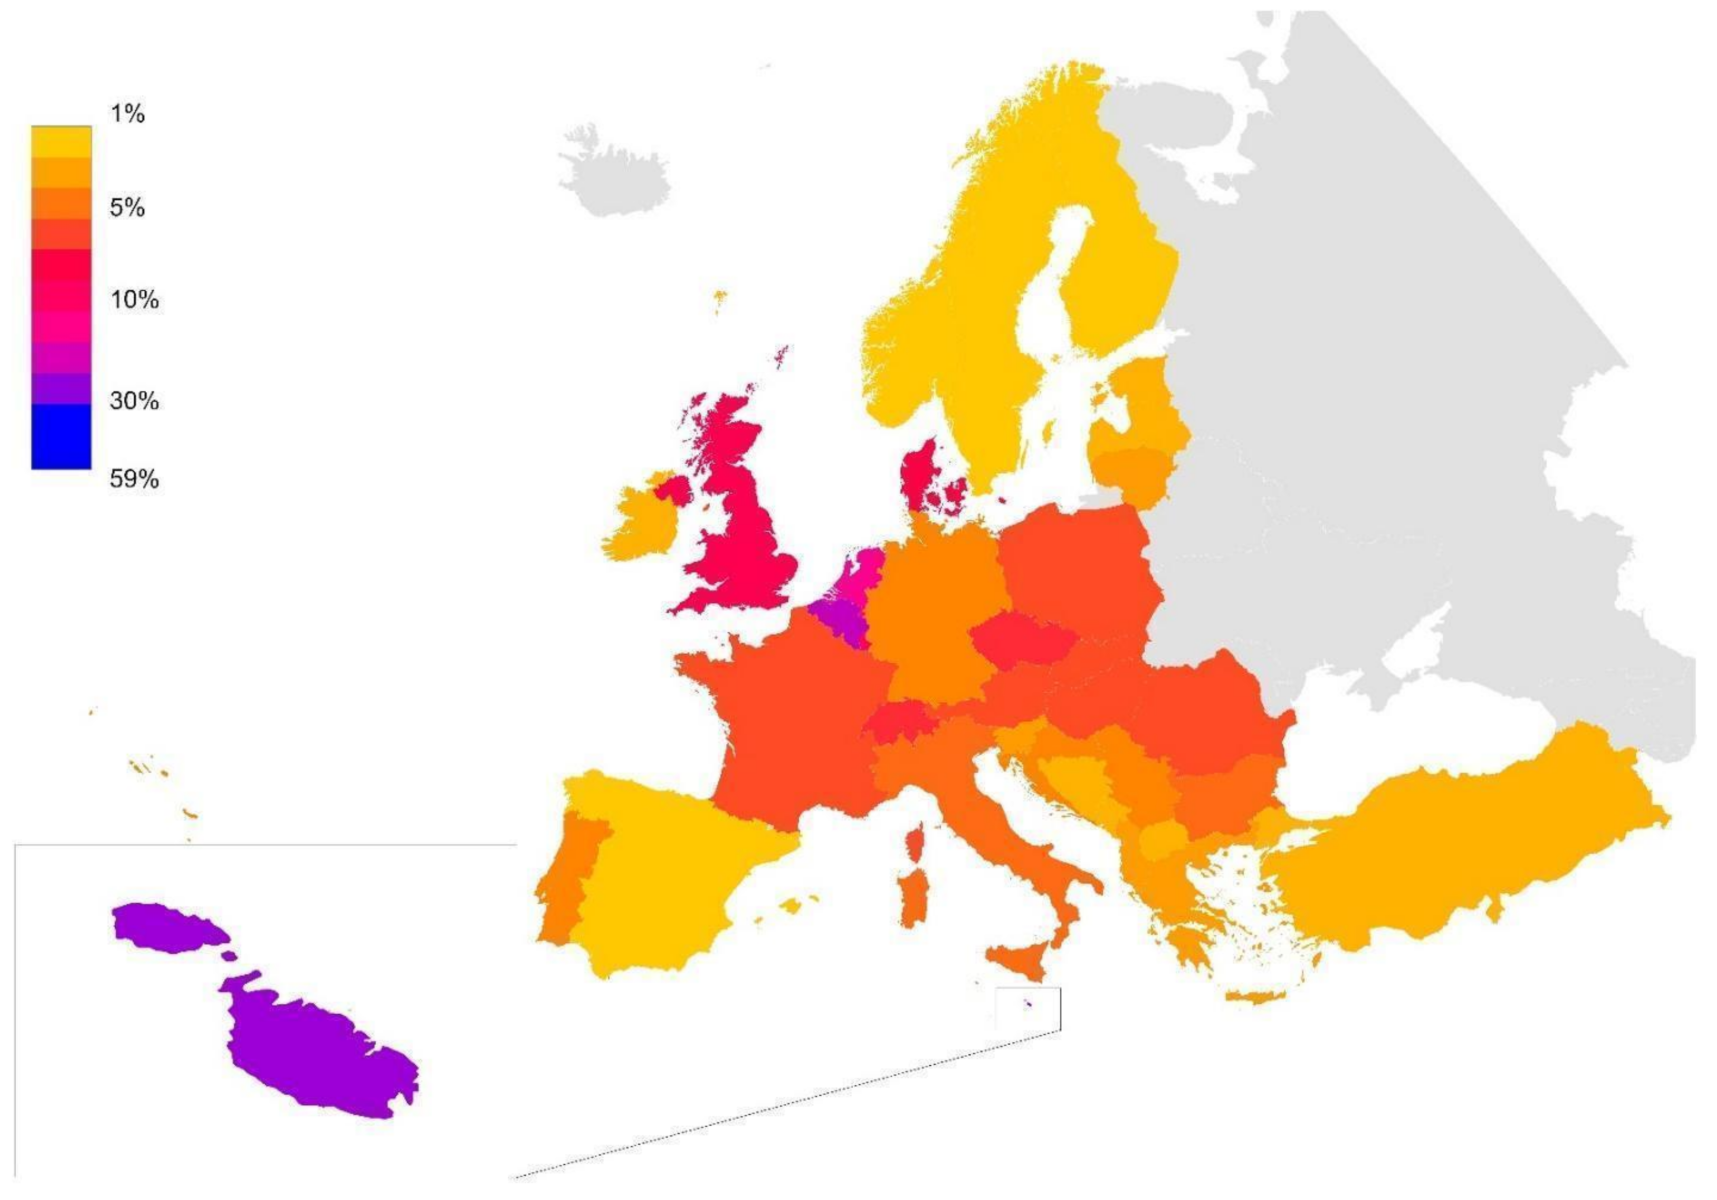
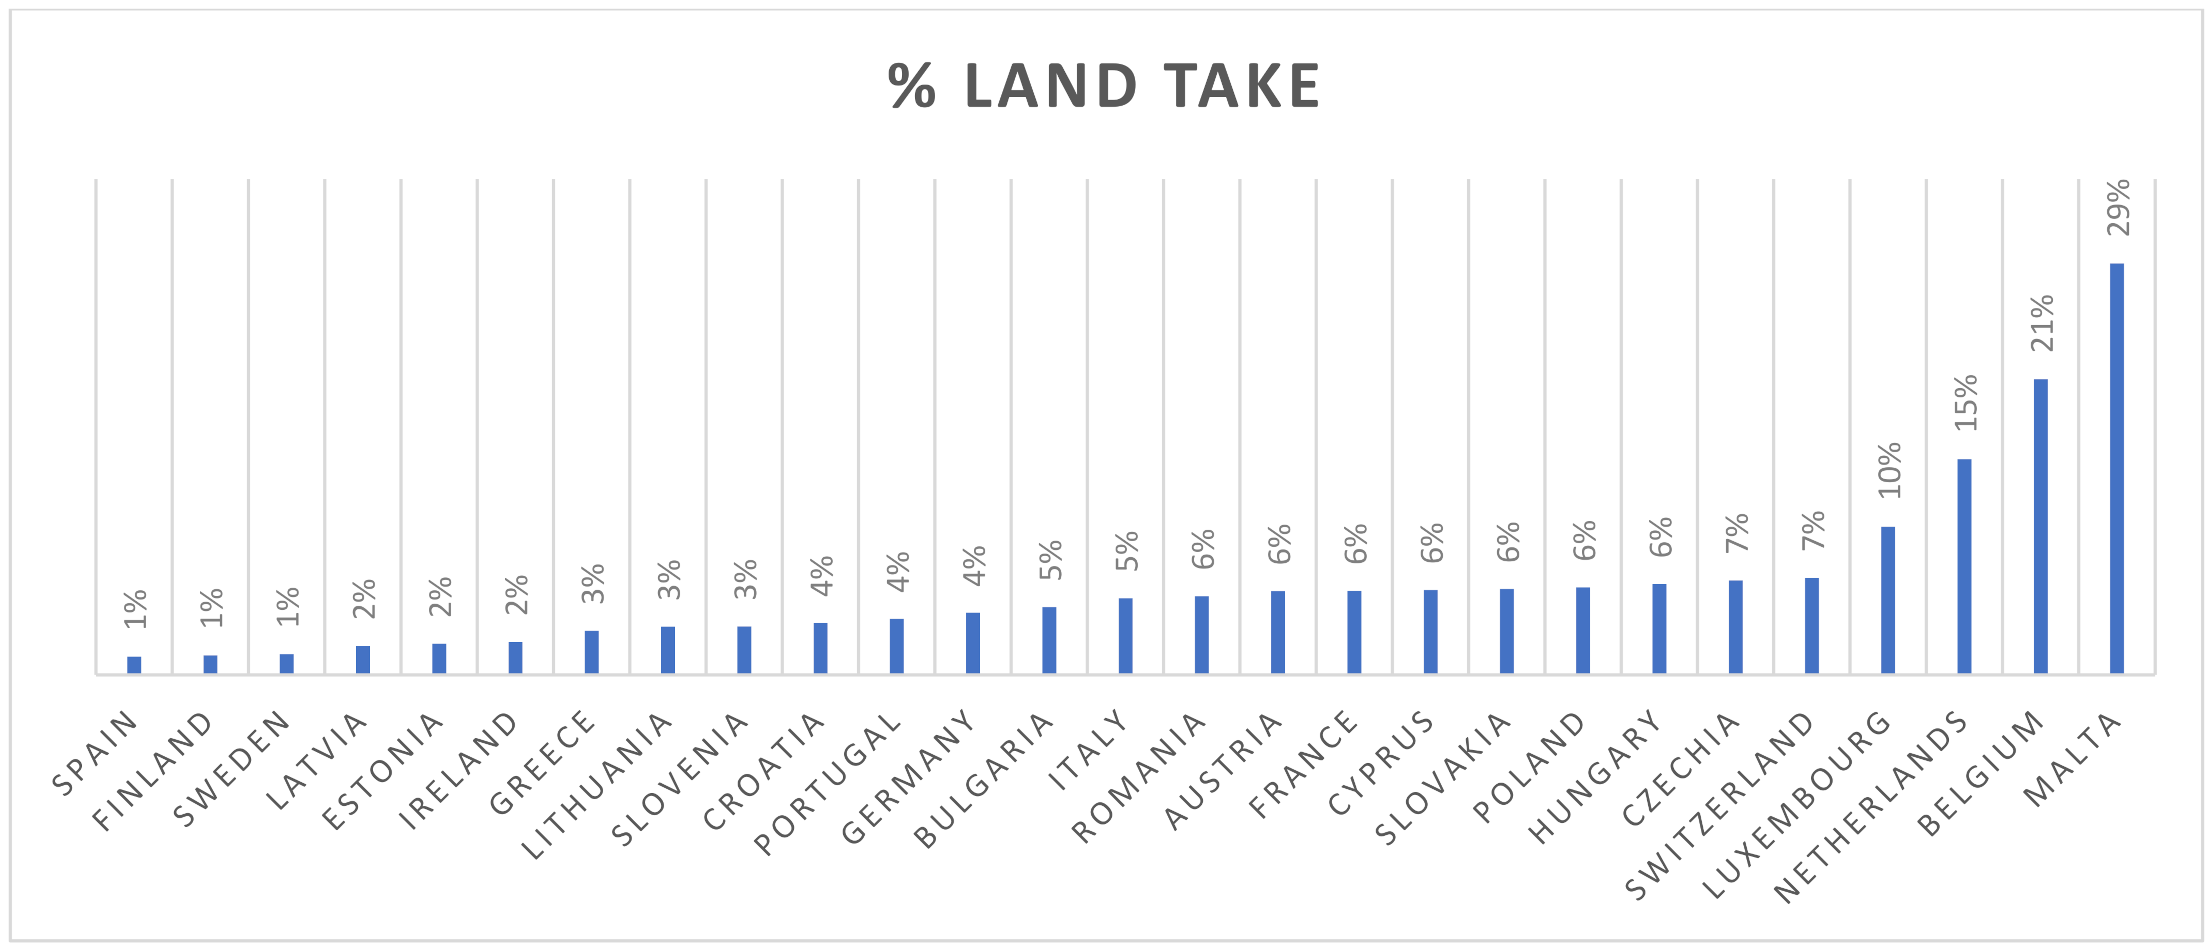
Starting from this dataset, geostatistical analyses have been carried out to determine the level of soil that was consumed, first related to the territorial surface of the individual states (
Figure 2). The result represented in the following map can be represented in a bar graph (
Figure 3) so that it is easy to compare and classify the different states based on the percentage of national
LT.
By this assumption, with reference to the graph in
Figure 3, it is possible to classify States in three groups: group 1 is composed by countries with a low level of
LT (from 1% to 3%; 15 countries); group 2 is characterized by countries with a middle
LT level (from 4% to 6%; 12 countries); group 3 is composed by countries with a high
LT level (over 7%; 11 countries).
With the aim to understand the different mechanisms at the base of the land take phenomenon four case studies were selected. With the hypothesis that it is not possible to define general laws and drivers for land take and land take development across Europe it was necessary to select different countries representative of the variability of the analyzed phenomenon and of the defined groups.
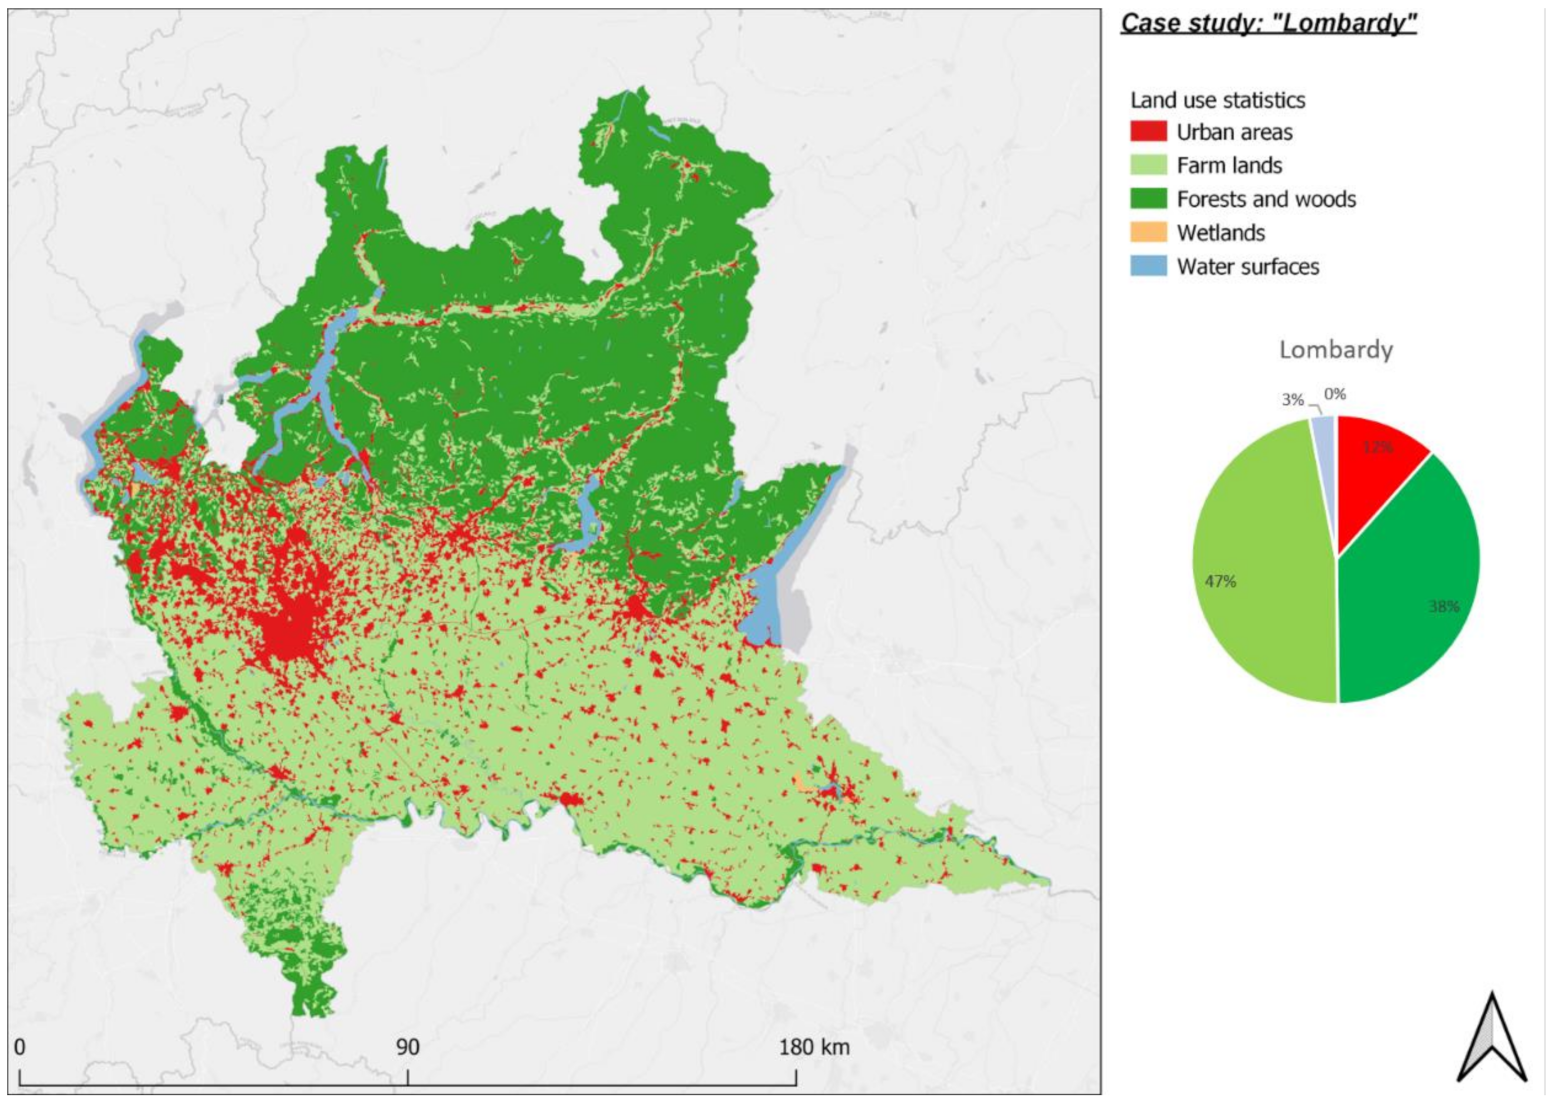
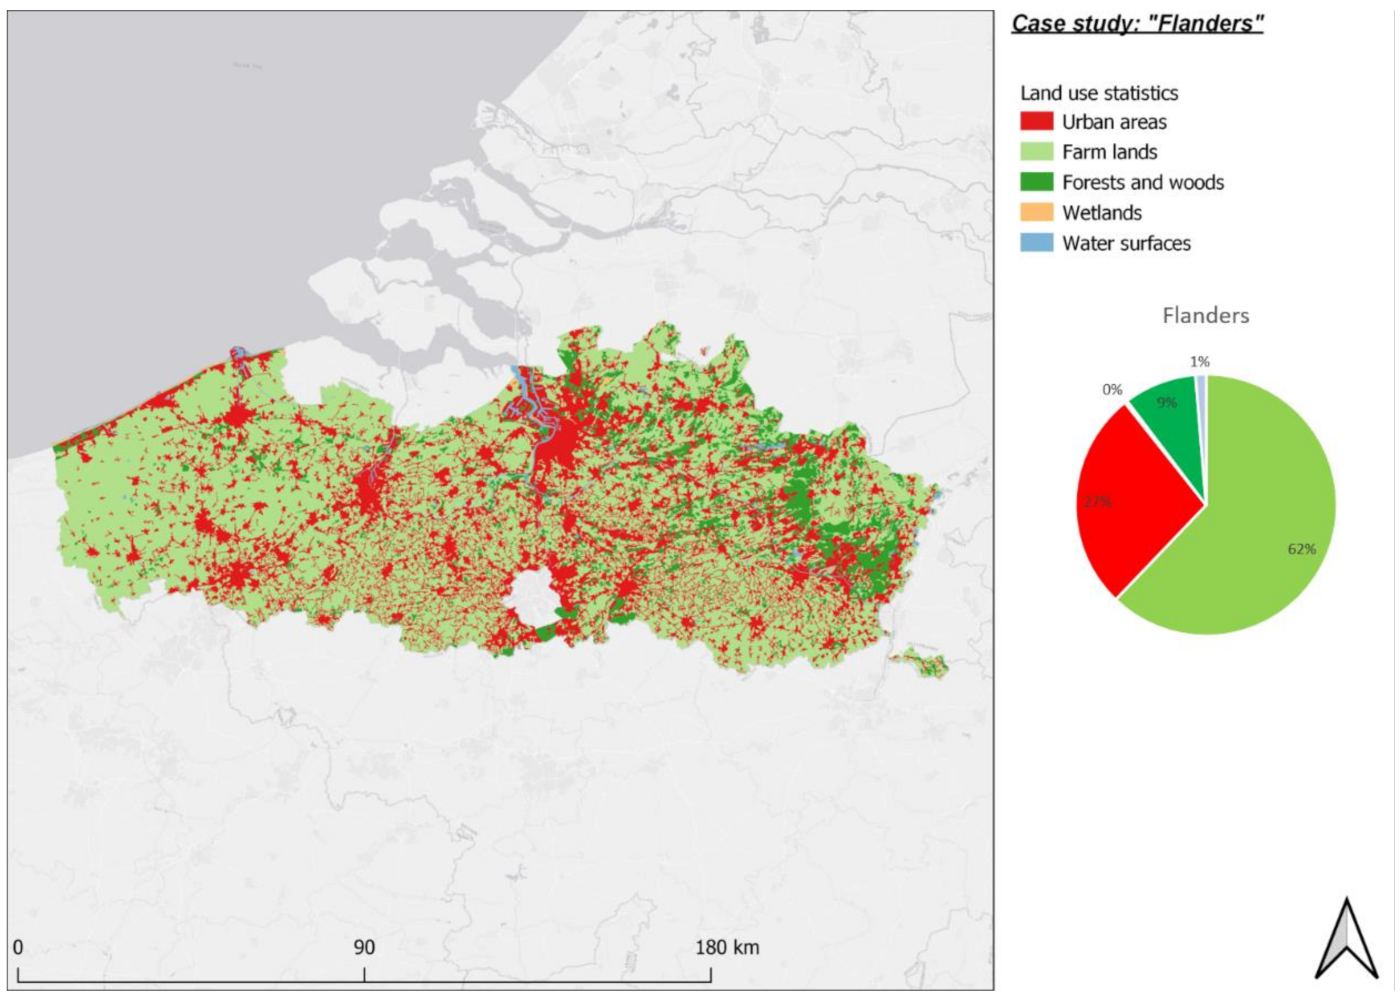
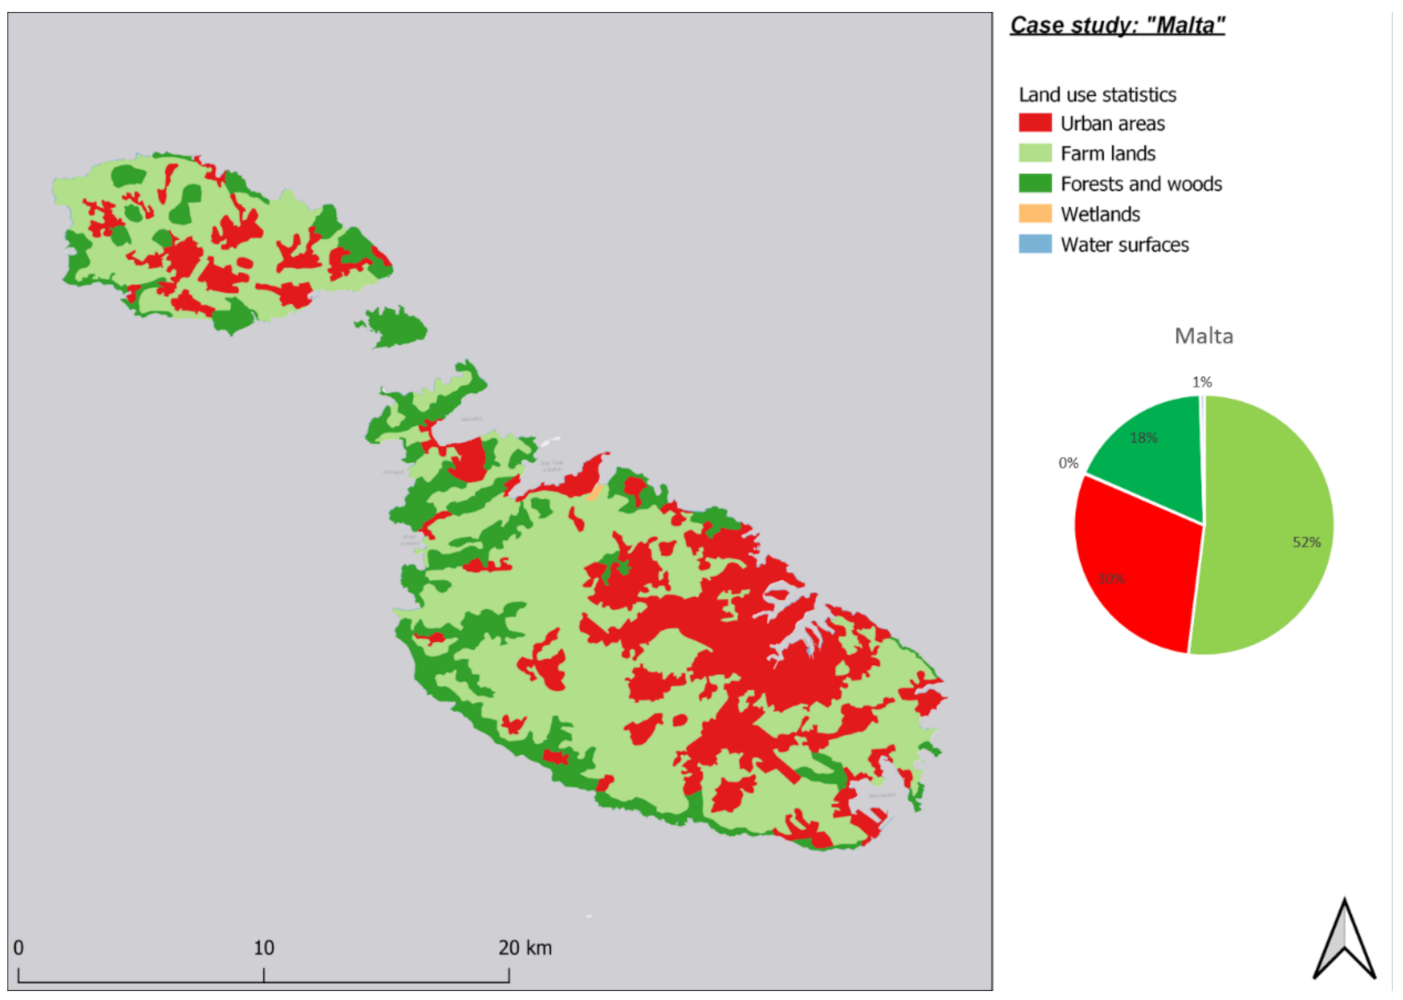
The selected case studies are Latvia that has a LT level equal to 2% and it is representative of the low LT level group; Italy which has a LT level equal to 5% and is representative of the middle LT level group; Belgium and Malta which have a LT level equal to 21% and 29%, respectively, and are representative of the high LT level group.
To represent the spread of the phenomenon also at a sub-national level and with the aim of analyzing the phenomenon of land take in relation to different systems of territorial governance, the Belgian and the Italian cases have been broken down and related to the analysis of some significant regional experiences. In fact, in both chosen countries, the protection and management of territorial resources takes place at a regional level and not at the national one. It was therefore considered useful to analyze the phenomenon based on the governmental level of competence as it is more significant.
To obtain a measurable, replicable, and comparable reference scenario, the information layers concerning land use at European level obtainable from the CLC dataset and containing information about the administrative surfaces of the individual layers were imported into the GIS environment.
Through spatial selections it was possible to filter the data concerning land use, referring to a specific reference year, based on the individual states being studied. In this way it was possible to obtain homogeneous indicators for all the selected areas. The same methodology was also replicable at the regional level since, it was possible to query the CLC dataset even with territorial portions of a lower level than the national one.
In this way it is feasible to overcome the limit given by the fact that in every single state the methodology for calculating land consumption is different.
The next step was to define statistical indicators that let to analyze the data previously obtained and to obtain a qualitative reading of the phenomenon of LT for the areas under investigation. The selected indicators aim to relate some aspects such as the relationship between land consumed, administrative surface and demographic trends.
LT was therefore measured, in the first instance, as an absolute value of square meters of urbanized area and subsequently as a percentage ratio between urbanized area and administrative area.
LT level [%] = Percentage of land take up to the administrative surface;
UL [sq m] = Urbanized Land (obtained from spatial analysis with CLC dataset);
tn = reference year (year of the CLC dataset update);
AS [sq m] = Administrative Surface.
The second step was to relate the LT data with that relating to demographic trends to obtain land consumption per capita.
Indicators have also been established that aim to illustrate, in relation to all the factors explained, the evolution of LT over a significant period.
Taking as a reference a time interval given by the initial instant t0 and by a final instant tn, it is possible to analyze how the phenomenon has varied in terms of the weight of the area consumed in relation to the total area and in relation to demographic variations.
In this way it is possible to obtain the
LT ratio between the instants t
0 and t
n for the single case studies.
LT ratio [sq m/sq km] = Urbanized land consumed in the reference period up to the total surface;
ULtn[sq m] = Urbanized Land at the end of the reference period (obtained from spatial analysis with CLC dataset related to the year tn);
ULt0[sq m] = Urbanized Land at the beginning of the reference period (obtained from spatial analysis with CLC dataset related to the year t0);
AS [sq km] = Administrative Surface.
The same data can also be related to demographic variations based on the following formula.
LT ratio [sq m/(inhabitants∗year)] = Urbanized land consumed in the reference period up to the demographic variation in the reference period;
INHtn = inhabitants at the end of the reference period;
tn − t0 = number of years in the reference period.
The maps obtained with the procedure described above illustrate the situation of LT in 2018 as this is the latest available update of the dataset on the Copernicus program portal. For this reason, the indicators, namely those that refer to the demographic situation in the individual areas under study, refer to national and regional data updated to 2018. While the time frame, based on which the evolution of the phenomenon was analyzed, was chosen for the period 2000–2018.
5. Discussion
The development of theories related to sustainable development has elevated the soil on a pair with other natural resources such as air and water and as such it must be valued, protected from the negative externalities of anthropic actions. This awareness has resulted in the goal of limiting land consumption and therefore reaching the goal of no net
LT by 2050 [
7]. The introduction of the net goal has profound implications at the planning level as it does not it denies the possibility of urbanizing new portions of territory but forces public administrations, in the case of approval of new urbanizations, to recover in the urban environment a portion destined to a green or agricultural area of an extension equal to that of the extra-urban transformation area. This concept takes the name of ecological balance and is an aspect that is very young within the urban planning debate. For example, in Italy, this concept has been characterizing the main laws on territorial governance for a few years (Lombardy and Emilia-Romagna). In both Belgian regions of Flanders and Wallonia, the concept of no-net-
LT policy is taking shape (‘bouwshift’ and ‘le stop béton’, respectively). To avoid further
LT in Belgium, the oversupply of residential and economic zones will have to be reduced and authorities need to get a better grip on urban sprawl outside built-up areas. New policies are being prepared by the regional governments to limit the additional
LT by 2040.
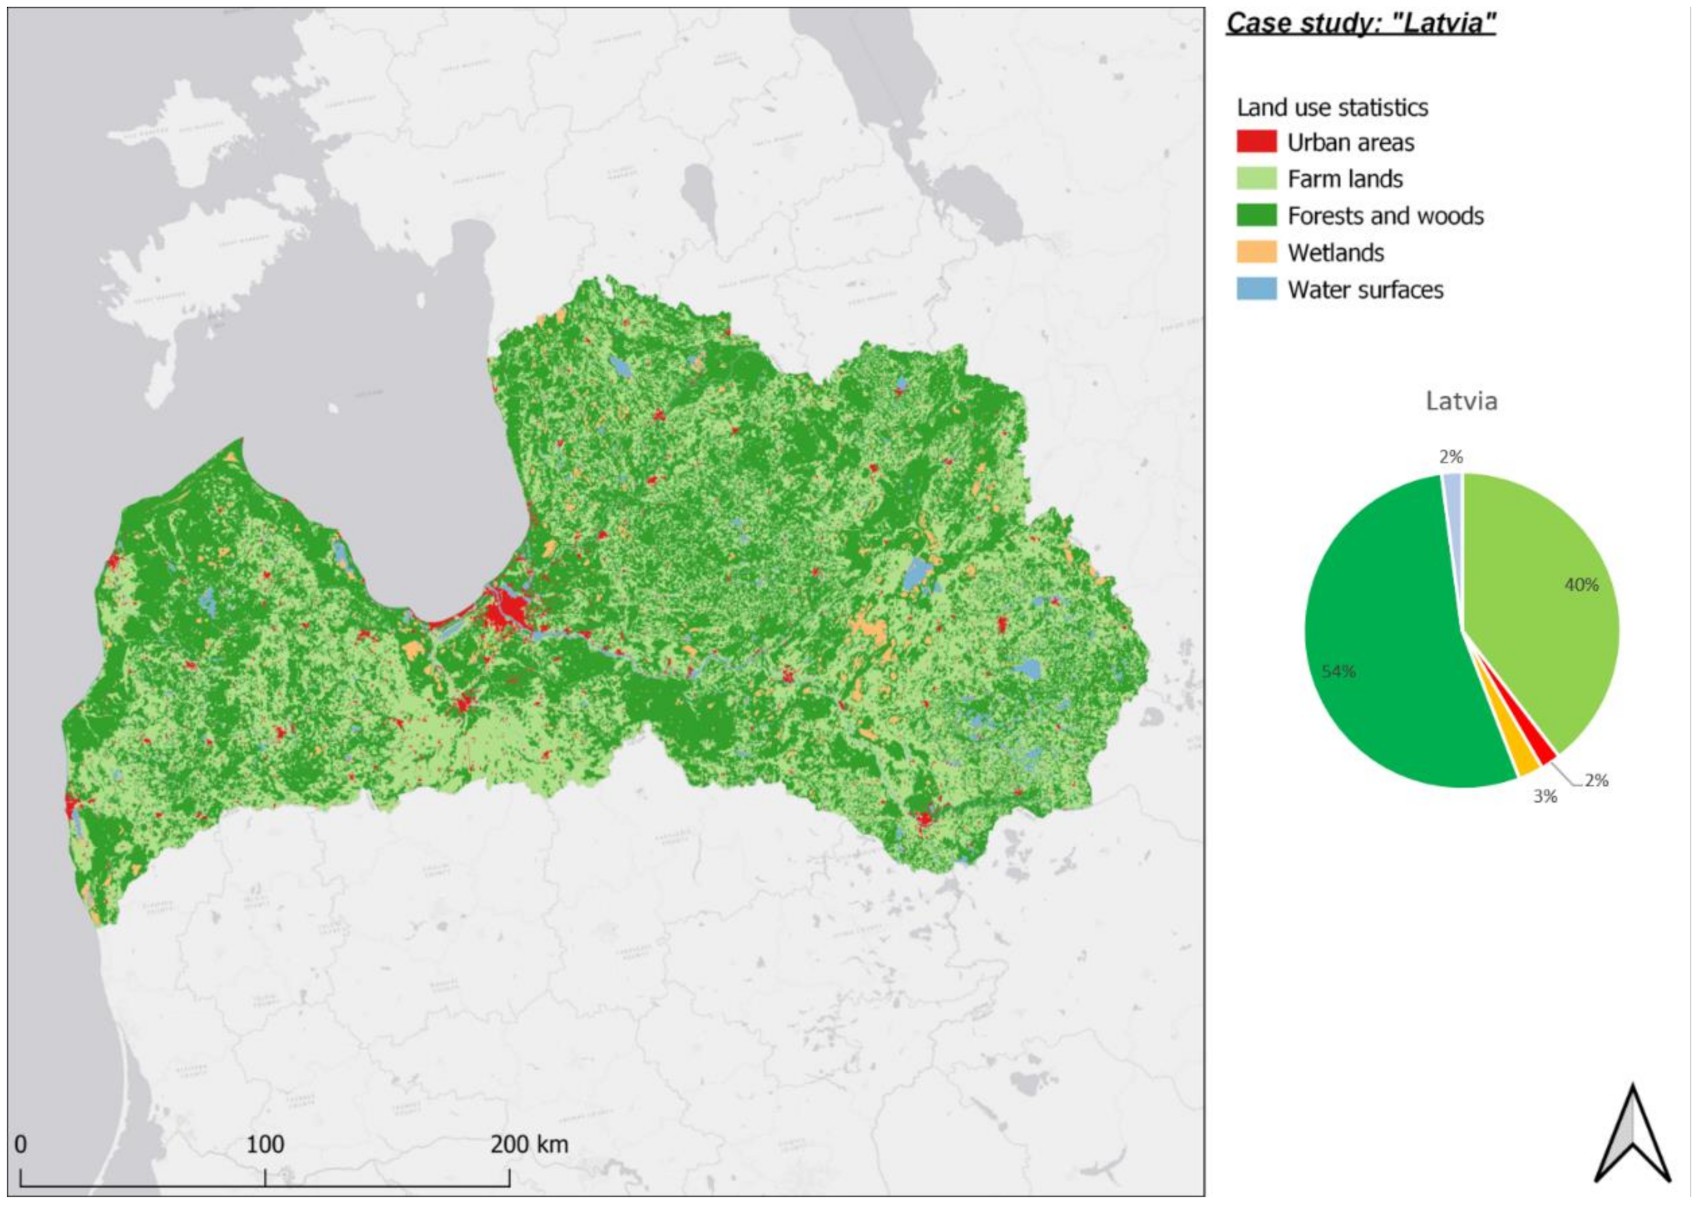
Latvia has a low LT level (2%) and a declining population; therefore, it comes as no surprise that the Baltic country has not yet introduced a ‘no net LT policy’ into its spatial policy. Nevertheless, land is protected by national law and local authorities must consider the soil quality and ensure land preservation of this valuable agricultural land (Land Management Law).
On the other side of the spectrum is the exceptional situation of Malta. Due to its small territory and growing population the Mediterranean archipelago is under high land pressure. Awareness is increasing that more efficient land use is required, especially in the Outside Development Zones (ODZ) where quarrying activities, dumpsites and residential expansion contribute to the high level of LT (29%). Furthermore, Malta’s population is expected to continue increasing up to 2070.
When one considers the annual LT per capita, Malta with a rate of 0.1 sq m per capita annually has the lowest rate when compared to the other cases. This indicates that even though the land take rate is high, the high population density is a limiting factor on the amount of land taken up per person annually. This may indicate a more efficient use of built-up land per capita, when compared to the other cases. Nonetheless, a discussion on whether the Maltese islands can sustain the projected population growth, should be backed by studies and policies, which reflect a more efficient use of already committed areas, the re-naturalization of disturbed areas, as well as the halt in the expansion of development boundaries. Such an approach could lead Malta to achieve the NNLT goal.
In comparison, Belgium is expected to see an initial growth followed by a decline, whilst Italy and Latvia are projected to have a declining population over the entire period until 2070 [
31].
Two Member States of the four case studies examined have taken concrete steps to integrate a NNLT goal in their spatial policy: the embedding of the NNLT concept into the regional laws of Italy with Lombardy as an example and the regional preparations of a NNLT by 2050, and Belgium, with the example of Flanders. In Lombardy the focus is on the spatial compensation mechanism of land recovery into its natural state. The need to balance the transformation areas with green areas of the same size has led many administrations to try to encourage the recovery of abandoned areas within the consolidated urban fabric. Although the concept of recovery of existing fabrics has been present for a long time in the Italian regulatory framework, urban regeneration has become a recurring topic as it is seen as the suitable tool to favor the implementation at local level of the International Agendas since it allows develop a series of actions, strategies, and synergies within the city. In Flanders, to stop further LT, the main concern is rather the reduction of the oversupply of build-up areas designated in the legal binding land use plans. Consequently, in this region the issue of compensating landowners is key to achieving the goal of land neutrality.
Although the LT level is different for the analyzed case studies some thoughts concerning the role of PVC tools can be developed.
It is interesting to consider the two opposite points of the model: the situation of Malta and Latvia. Malta is quite a small and highly urbanized country while Latvia is bigger than Malta and with the lowest European LT level. Data shows that between 2000 and 2018 the population of Mala is increasing, while Latvian inhabitants are decreasing. That means that the pressures to consume more soil are higher in Malta than in Latvia, but data shows that Latvia is consuming more free soil than Malta. That means that in Malta there is a more efficient land use that is grounded on densifications and concentrations. On the one hand, these aspects are at the basis of PVC theories too because in high density urban areas there is a strong demand for services and infrastructure, and this is a lever in the negotiation phase between public bodies and developers. On the other hand, if the accessibility to a site is increased the plus value increases too and its social benefits are higher in dense portions of cities.
5.1. Spatial Planning System and Shares of Ownership
In Latvia, three planning levels—national, regional (planning regions), municipal (local governments)—have been determined by the law, however, only at the municipal level a physical/spatial development plan is elaborated. The sustainable development strategies are carried out at both national and regional levels.
According to Spatial Development Planning Law (2011) the local plans, like comprehensive ones, also have legally binding parts, which, among other provisions, may provide changes into permitted land use if those follow the objectives of the sustainable development strategy of the municipality. A detailed plan of a part of municipal territory should be developed to lay down the requirements for the use of specific land units and building parameters as well as to adjust the borders of land units and restrictions.
Spatial planning has been developed decentralized, integrated, and comprehensive but still land-use oriented with the tendency of centralization for recognizing the priorities of national and regional scales. Public activity and participation raised slowly even systematically, cooperation among stakeholders and capabilities of the local governments need improvements.
Up till 2017, SLS provided land reports, which also included the information about owned land depending on the status of the owner. As of January 1, 2016, the owned land depending on the status of the owner (% of the total land area): natural persons (54.2%); legal entities (18.8%); municipalities (1.8%); state institutions (24.9%); mixed status joint ownership (0.3%).
If the evolution of the Italian land management rules is analyzed, the first urban planning law is the National Urban Planning Law (LUN) 1150/1942.
Until that time, urban development was regulated by rules, relating to the hygiene and health issue. Law 1150/1942 introduces planning as a discipline which has the task of regulating the use of the territory and its transformations by dividing, based on the reference scale, different levels of planning, which have distinct tasks: starting from the territorial level, up to the local scale, with town plans and detailed plans which have the task of regulating the development of limited portions of the city.
During the second half of the 1900s, various laws followed one another which modified some aspects of the Law 1150/1942 but left its fundamental principles unchanged. Of relevance in this area is the Law: 765/1967, with its implementing decree DM 1444/1968, which introduced the concepts of urban planning standards and primary and secondary urbanization charges. These regulations introduced important aspects within the macro-theme of the capture of value by public bodies, as they provide the public administrations with the tools to assign to private operators the task of creating the main services and infrastructures in the context of certain operations, i.e., urban planning [
32]. Before Law 765/1967 it was the task of the administrations to create infrastructural connections and underground services to connect new residential areas built by private individuals in an extra-urban environment. In this way, private operators had a strong advantage from carrying out urban planning operations in an extra-urban environment as the costs for territorial endowments fell on the public and this was the basis of numerous speculative operations that have characterized the development of cities, in the 60s. Following the Ministerial Decree 1444/68, the realization of private interventions is subject to the realization of the urbanization works [
33].
The changes made to the National urban planning law in the 1960s have never been followed by a new urban planning law, however, starting from the 1970s, with the establishment of the Regions, urban planning has become a concurrent matter between the State and the Regions, which can legislate in compliance of the principles identified by the framework law of 1942. In this scenario, the Regions can also legislate about aspects not regulated at National level. Issues related to sustainability and land-use efficiency such as strategic environmental assessment, urban regeneration, and the achievement of the NNLT goal, are not reflected in the national law as they were introduced in the urban planning debate later and their implementation. It is delegated to the individual Regions, for this reason we are witnessing a very diversified regulatory framework.
To take these aspects into account, in 2001 the Constitution was amended, and the concept of urban planning was passed to the broader concept of territorial governance, in this way the goal is to focus on the fact that urban development should no longer be linked only to the dimensional and demographic growth of settlements but also had to deal with the issues related to infrastructure, environmental protection and enhancement of natural resources. This aspect is fundamental as it has led to a new generation of regional laws in which the soil is no longer considered as a surface to build on but as a finite and limited natural resource that must be protected.
In the Lombardy Region, Law 12/2005, in addition to introducing the SEA (Strategic Environmental Assessment) as a fundamental tool in the planning process and in addition to incorporating the principles of subsidiarity and adequacy, also incorporates the transition from urban planning to territorial governance, for which development is no longer measured only in quantitative terms but issues related to resource management and the qualitative growth of cities acquire greater importance. In the following years, Law 12/2005 was amended and integrated (with Laws 31/2014 and 18/2019) acknowledging the EU environmental objectives such as the achievement of net land consumption equal to zero by 2050 and identifying urban regeneration as a strategic tool for achieving this objective.
Similar approaches are found in other regional laws, which mark a change in mentality: an attempt is made to discourage the implementation of expansions in extra-urban areas but, rather, the aim is to respond to the need for growth through the recovery of existing assets. In recent years, Lombardy Region introduced laws grounded on concepts such as the reduction of land consumption, environmental balance, urban regeneration, and ecosystem services. These aspects are regulated by the law 31/2014 and, subsequently, by the law 18/2019 which are integrations of the main Lombardy regional law 12/2005.
In
the Flanders, the regional level provides the legal framework for spatial developments to the two lower levels of government, the provinces (5) and the municipalities (300). Over the past two decades, the focus of planning has increasingly shifted to the local level; the regional government wants to delegate more powers to the municipalities in the context of subsidiarity, but as a result, there is little top-down steering of spatial development in the Flemish region. The old national land-use plans (
gewestplannen) made under the Belgian state still dominate spatial development because they are binding with no expiry date. The binding nature of these plans, which gives high legal certainty to owners, conflicts with a more sustainable development. For this reason, academics have already called for these plans to be abolished (Inspire to expire-project [
34]), but the Flemish government refuses and emphasizes the primacy of ownership. Combined with a very low level of state land ownership, this legal certainty, chiseled in stone, gives little room to develop new policies and reduce the high level of
LT caused by oversupply.
In Malta development planning is carried out on a national level. The Development Planning Act, Chapter 552 of the Maltese Legislation, makes provisions for the sustainable planning and management of development. The Strategic Plan for the Environment and Development (SPED), which was approved by Parliament in July 2015, has replaced the 1990 Structure Plan for the Maltese Islands. The SPED is based on an integrated planning system that regulates the sustainable management of land and sea resources. The plan provides a strategic spatial policy framework for both the environment and development up to 2020, complementing the Government’s social, economic, and environmental objectives [
35]. At the time of writing the SPED is being reviewed.
In Malta there are 68 local councils. Seven local plans, covering groups of localities, cover the whole archipelago. Development zones and the relevant planning policies applicable for each area are identified in these local plans.
The Government of Malta is the largest landowner in the country. There are no publicly available statistics which give an indication of the other main landowners in the country. Given the history of the island, the Ecclesiastical authorities also feature as major landowners. In Malta, property ownership is favored over other forms of property titles. As per the 2011 Census, on a national level, more than three-fourths of all occupied dwellings were either owned freehold (60.4%) or with ground rent (16.0%).
The Land Registry was established in 1982 through the Land Registration Act (Cap. 296). From time to time the Minister issues Registration Area Orders whereby areas in Malta are declared as Land Registration Areas and any property transfer or relevant contract are registered. The system is a way by which titles to land are registered. However, one must note that not all land in Malta is registered to date.
5.2. Main Drivers of Land Take
In Latvia, the artificial land development is driven mostly by the finalization of residential units, which were under construction already in the period 2000–2006 [
22]. Observing the artificial
LT (development) in the period 2006–2012, it is driven by extensions (% of total area of artificial surfaces in 2012). Besides the sprawl itself, recycling of developed urban land seems to be an important driver of the artificial development in the country, represented mostly by the conversion of construction sites into urban fabric units. For what concerns the spatial distribution of build-up sites, there is a major concentration of developed areas around the capital city of Riga. There are also scattered patches of all other types of sprawls distributed over the whole country. However, their density is rather low. According to EEA [
22], the main sources for the sprawl in Latvia are pastures (49%) and forested areas (28%). According to Corine land cover statistics in the period 2000–2018 [
21] the artificial
LT is driven by expansion: mines and quarries (39%); construction sites (26%); urban diffuse residential (11%); industrial and commercial sites (9%); sport and leisure activities (8%); transport networks (2%); harbors (2%); and airports, dumpsites, and green urban areas—each less than 1%.
The Italian situation regarding
LT is very diversified from Region to Region. Using the National data concerning the territorial diffusion of the phenomenon, it can be noted that the national average is around 6–7% (in this perspective it is interesting to focus on the fact that the European data instead attest the Italian
LT level as 5%). However, as shown in ISPRA report [
25], there are Regions below this threshold and others that instead exceed it. This phenomenon is explained above all by analyzing the morphology of the Italian territory which is very diversified. In fact, it can be noted that the Regions of the Po Valley, such as Lombardy, Veneto, and Emilia Romagna, have a higher
LT level than the others which are characterized by a predominantly mountainous or hilly area. The second aspect that is useful to analyze in relation to the different levels of
LT in the Italian Regions is given by the different degree of the infrastructure of the territory. Combining these two aspects: morphology and infrastructures of the territory, it is possible to see why Lombardy has the highest
LT level among the Italian Regions, equal to double the national average. In the second part of this chapter, the aspects underlying Lombard urban development are analyzed in more detail [
25,
36] (
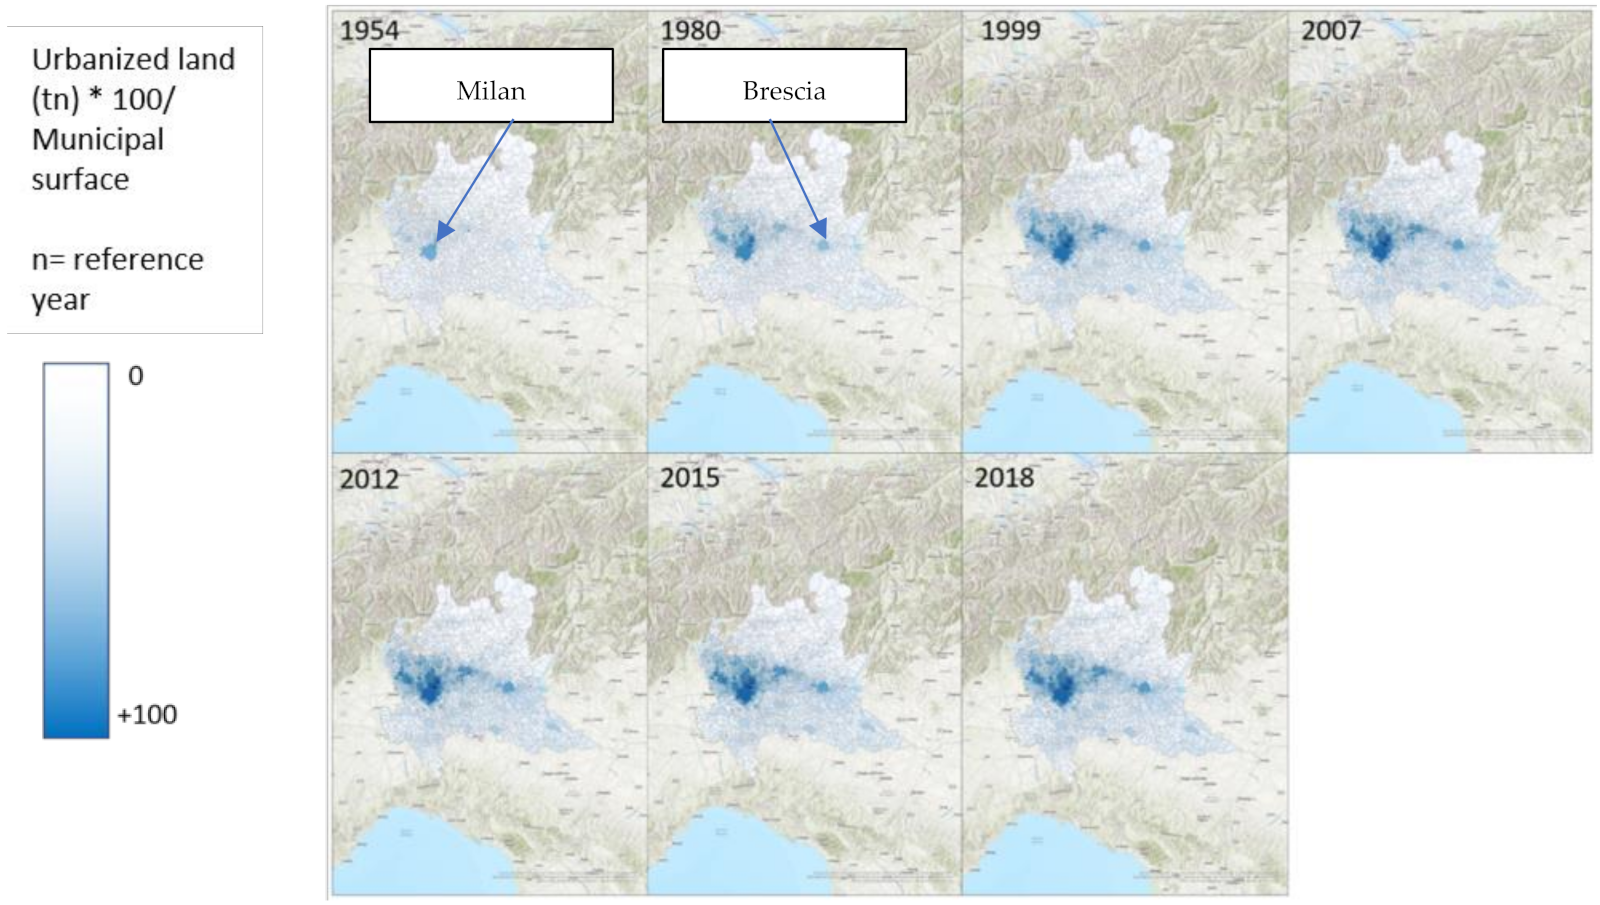
Figure 8).
What emerges is that Brescia and Milan are the two dominant polarities, however two other fundamental aspects can be clearly noted: the first is that Milan has been a very strong driving force for the development of the hinterland municipalities which, are characterized by a high percentage of urbanized territory, creating an almost continuous conurbation in the western portion of the regional territory, and influencing part of the municipalities of the lower province of Bergamo. In this development mechanism Brescia is more marginalized; however, it is also good to consider the second aspect that characterizes the map in question: it can, in fact, be noted that the arrangement of municipalities with greater territorial development follows the trend of the main infrastructures that characterize Lombardy such as the A4 motorway and the Milan-Venice railway.
In
the Flanders, according to CLC the land consumption rate was 383 ha/year or 0.6 per capita during the period 2000–2018. Compared to the regional measurements made since 2013 this seems to be an major underestimation of the actual evolution; during the period 2013–2019 a land consumption rate of 1845 ha/year or 2.8 m
2 per capita was measured [
26].
LT is increasing higher in the agricultural zones than in built-up categories. This is due to many new buildings and expansion of existing buildings that have no relation whatsoever to the agricultural zoning but are nevertheless allowed due to many exceptional rules. Furthermore, illegal buildings and changes of function that are not acted against due to a lack of enforcement are damaging the rural landscape. The reconversion of an agricultural farm into a house, office, horse ranch, etc., is a typical phenomenon that further erodes the open space. Furthermore, part of the high
LT in the agricultural areas can be explained by the industrialization of agriculture and additional roads.
If no policy changes are made,
LT will continue to grow to over 36 %. This future land take can already be estimated, as the national land use plans (dating from 1976–1980) are still binding after more than 40 years and provide an oversupply for housing, industrial development, e.g., The greenfield development capacity in the 25 land use plans is about 40,000 ha of which one third is designated for housing [
37]. The build-up sites are in remote areas and not near the cities where demographic growth is expected. As a result, land is squandered so that these sites can still be valorized. Various studies [
38] have shown that the capacity of the existing urban tissue is sufficient to absorb all demographic and further economic growth without additional
LT.
In the end, if the Malta case is considered it is feasible to see that between 2000 and 2018, the total area of land taken over by artificial land totaled 1.19 sq. km. or 119 ha. That land was taken over for various uses ranging from residential to commercial uses.
Quarrying activities, with 31 ha and expansion of residential areas, with 30 ha were the largest two contributors to LT between 2000 and 2018. These were followed by the expansion in dumpsites, with 27 ha, mainly with the main dumpsite in Maghtab.
On the one hand, the increases in quarrying activities and residential expansion reflects the growth of the construction industry, fueled by economic and population growth. On the other hand, the growth of Malta’s main dumpsite is being actively controlled with ongoing plans to remodel Malta’s waste management strategy, with a drive towards the circular economy and through the introduction of a waste to energy plant among other initiatives.
5.3. Towards the Implementation of NNLT
In Latvia, the national-level policy and target-setting are not provided for even strategic direction towards NNLT. However, “urban containment” is recognized as one of the planning instruments for managing incremental urbanization. Thus, besides the central government regulations on urban containment [
19,
39,
40], the principles and conditions for the use and protection of land (
Section 3 and
Section 4) as well as the management of vacant land and degraded territories are determined in the Land Management Law [
20]. Thus, the local government (municipality) shall intend territories with the lowest land quality assessment and territories which due to their location and configuration are not appropriate for the use in agriculture or forestry, as priority for changing the category of the agricultural land and forest land. The local government in the spatial planning documents shall intend degraded territories as priority for building. If the quality assessment of agricultural land exceeds 50 points, the local government shall ensure land preservation of this valuable agricultural land, determining restrictions for land subdivision and for changing the category of land use. If the assessment of the quality of agricultural land is higher than 45 points, but does not exceed 50 points, the local government may set restrictions for land fragmentation and change of land use category. The land user shall carry out activities to preserve the quality of land and soil and prevent their degradation.
The Protection Zone Law, among others, determines forest protection zones, embracing the cities for ensuring not only the necessary conditions for recreational activities and health improvement for the inhabitants, but also decreasing or compensating the negative effects of cities on the environment [
41]. The conditions of protection zones are a part of formal and legally binding spatial plans of a local government.
Some centralized institutional arrangements in relation to spatial planning and for the purpose to diminish risks of negative externalities and urban sprawl have been introduced in Latvia. These arrangements initially were discussed among practitioners/planners and public authorities reflecting intentions towards improving the quality of spatial planning practice in 2013–2014. Accordingly, central governmental regulations were enforced to determine that the residential and mixed center built-up functional zones can be determined only in urban areas, i.e., towns and settlements [
19] and that, in addition to designed territories by comprehensive and local plans as well as if planned complex built-up territories, the detailed plan must be developed if planned new land units and there is a need to create the access to streets or roads [
40].
The government of the territory in Italy is regulated by regional laws that operate according to the principles defined by the national framework laws. Alternatively, the Regions can legislate in such a way as to regulate aspects not regulated at the national level. Examples of this second case are strategic environmental assessment, land consumption and urban regeneration for which the regions have adopted different regulations as they are aspects introduced after the entry into force of the national urban planning law.
To understand the different regional approaches with which the issue of soil value is treated and the means available for its possible capture, it is necessary to analyze the development mechanism of the urban fabric. According to a 2005 report by the EEA, historically the mechanisms of urban sprawl have been fueled by the extremely low price of agricultural land which, when compared to the price of already urbanized land or abandoned industrial areas, represents a further advantage. In favor of operations in an extra-urban environment. In many development projects, the cost of acquiring agricultural land is relatively low and allows higher profits to be made than using already urbanized areas or brownfield sites even when reclamation is not required [
42].
This is also the concept underlying the Lombard Regional Law 18/2019, which aims to make the costs related to urban regeneration more advantageous and competitive, trying to reduce the economic disadvantage of interventions on abandoned areas (perhaps burdened by costs reclamation) compared to those on agricultural areas outside the consolidated urban fabric.
As in some other European member states or regions,
the Flemish regional government is currently putting forward the discourse of a net zero
LT (‘bouwshift’ or ‘development shift’ towards the existing urban areas). In 2018, the government approved the Strategic Vision for the Flanders Spatial Policy Plan (BRV) to reduce the additional
LT to zero by 2040. Because of the current land-take, the Flemish government is striving for a gradual reduction to zero land-take by 2040 instead of 2050. This ambition requires a profound adaptation of existing planning instruments [
38] such as the land-use plans and the compensation scheme, which is causing a lively debate in both Flanders and Wallonia, where the same objective is pursued (‘betonstop’ and ‘le stop beton’).
In Malta, the integration of land use into coordinated decision-making is promoted as a tool to achieve environmental improvement and land use efficiency, and at the same time promoting economic development and social progress. The adoption of targets on land as a resource and spatial planning objectives should support an integrated approach involving all relevant levels of government. According to Malta’s Strategy for the Environment for 2050, Malta’s Strategic Plan for the Environment and Development (SPED) should serve as the binding document for all government entities and should move towards the EU goal of no increase in net
LT [
27,
43].
The 2018 State of the Environment Report for Malta concludes that due to various competitive land uses, more efficient land use is required. The oversupply of housing and the cumulative impact of development in Outside Development Zones (ODZ) must be assessed and monitored, including the net increase of land-take for development. This is important for guiding policy makers and making informed decisions.
The way forward should be more about rebuilding or refurbishing vacant buildings to escape the pressures required to develop new land. Further efforts should be made to limit the use of undeveloped land in rural areas, for example, by identifying alternative locations in brownfield sites. The competent authorities should consider establishing a structure that will identify, understand, and manage the available housing stock, while studying whether it can be opened for other purposes. Development monitoring is also required to ensure that it is restricted to approved areas and to prevent overflow [
35]. Furthermore, The Rural Policy and Design Guidance 2020, which was issued for public consultation, indicates that
LT up in rural areas shall only be used as a last resort. Malta however does not yet have any specific set targets for achieving the goal of net zero
LT by 2050.
5.4. PVC Instruments to Support Less Land Consumption and Land Thrift
In Latvia, formal (institutionalized) tools of spatial planning due to its implementation may be considered for direct value capture. The regulations regarding land use and building are concerned with the provisions for land use and development and form a binding part of comprehensive, local, and detailed plans. A detailed plan shall be implemented according to an administrative contract concluded between the local government and the developer. In accordance with the provisions of the Administrative Procedure Law, a contract shall contain various conditions, time periods and disclaimers regarding cancellation as well as requirements concerning the period for commencement of construction work of objects, management of the planned territory and public infrastructure, construction stages and its sequence. If reallotment is considered for a new development area but an infrastructure for streets has not been created, about 20% of the land designed to readjust should be intended for public open space, e.g., streets, green areas, etc. After development such a land unit may be transacted to the municipality for its further management.
The regulations on land use and building can be considered as a source for direct value capturing in a municipality, e.g., they may determine that prior to getting a building permit for residential building, the developer must ensure the erection of a street, electricity supply, water supply, and sewerage drain within a development territory. Moreover, after the enforcement of the new plan, a municipality is entitled to decide on higher real property tax due to extension of property rights.
In Latvia, the immovable property tax represents the indirect model of PVC, however, any other types of tax income and fee may be used for improving public infrastructure in the territory of the municipality according to the accepted annual financial (budget) plan. Basically, the immovable property tax and personal income tax benefit local authorities and constitute the main part of their resources.
Value surplus due to private investments is subject to PVC in Latvia. All costs for the development influence and create the surplus-value to capture it. The development costs and value surplus of the development are ‘shared’ between the public body and developer. However, it is a challenging research question to identify these shares due to development phases. Land value increases due to extension of property rights (spatial planning) benefit both a developer/landowner and a municipality. All types of taxes and fees that create the municipal revenues and are distributed for the benefits of local society are to a great extent applicable to all property value increase independently of the roots of increasing values [
44]. Institutional environment supporting local socio-economic development and environmental sustainability should be more assessment-based to stimulate investments in existing infrastructure and prevent net land consumption.
Certain PVC instruments can be used to limit or slow down the additional land use. In this respect, several widely known instruments, e.g., a property tax, transfer tax, infrastructural charges, and a development fee in the case of Riga City, are applied. These instruments serve mainly to social distribution and financing public infrastructure. They are not yet used as a direct instrument to slow down or discourage new greenfield development. However, the Latvian system of property taxation may be beneficial in limiting new LT. For instance, by introducing extra immovable property tax (double tax rate—3% of assessed cadastral value) for degraded land, abandoned agricultural land and land with degraded buildings. Some landowners who conclude that their project is not economically feasible anymore, request a zoning change to agriculture or forestry land, preferring a downzoning to further payment of a higher tax. In other words, a difference in land tax can prevent owners from speculatively holding on to their development rights and waiting for ‘better’ times with more demand. Moreover, Latvia does not grant compensation to owners when converting from a buildable to an unbuildable use. Therefore, scaling back future development has no financial implications for the state and the taxpayer.
The situation is different in Lombardy Region, where the payment of urbanization charges and the type of standard works that must be carried out are established on a case-by-case basis with the urban planning agreement, the main negotiated procedure between public bodies and private operators, stipulated in the implementation planning.
In the past, monetization charges could be paid and used by municipalities to finance the budget. This led to mechanisms where sprawl was a positive thing as it allowed municipalities to make up for new resources to be available for current spending. Currently this is no longer possible as the municipalities are obliged to use the charges to carry out public works that can be both internal and external to the sector subject to intervention.
If the case study of the Lombardy Region is considered, it can be noted that the aspects related to urban planning agreements, those relating to urbanization charges and standard works, have profound repercussions also in terms of reducing land consumption. In fact, following the changes made to law 12/2005 by law 31/2014, outlined to meet the European objective of achieving net land consumption by 2050, tools have been defined to incentivize the recovery of abandoned urban areas rather than respond to urban planning loads by occupying new vacant land [
45]. In this way the concept of sustainable urban development is created against that of unsustainable urban development. In fact, to make transactions within the perimeter of the consolidated city more attractive, a series of tax tools have been introduced to support operators. These tools were also taken up by law 18/2019 which has the task of defining urban regeneration operations in Lombardy. Urban regeneration is in fact seen as the main means to achieve the zero-land consumption target by 2050, however, although the principle underlying the law is noble, the implementation methods with which this concept is implemented are questionable and are still today the subject of debate. The law provides for measures such as volumetric incentives of up to 20% and reduction of charges up to 60%. These tools are very advantageous for operators but limit the ability of public bodies to capture value with consequent problems also relating to the redistribution of surplus-value on the territory. In this way the quality of the private areas becomes higher than that of the surrounding public areas.
In the specific
Belgian context, a no net
LT starts with a large-scale downzoning operation; a zoning shift must precede the development shift. Even though the zero
LT is high on the political agenda, no new instruments have yet been introduced to support the new policy of zero
LT. For instance, soil quality assessment is not part of the planning process due to the binding nature of the land use plans. Extensive research into new instruments has been carried out and a draft Decree Instruments of Land Policy is debated in regional parliament [
46]. However, this draft decree met legal objections and criticism from the municipalities, which is why it has not been approved yet. On the one hand, this draft decree strengthens the instruments of value capture, but on the other hand, compensation to landowners is substantially increased. This raises many questions about the feasibility and affordability of the government’s so-called ‘development shift’. To please landowners, the government wants to increase the compensation scheme on three main parameters: (1) the value loss must be covered for 100% and no longer at 80%, (2) the value loss has to be based on the current market value and no longer on the current purchase value paid by the owner, and (3) all the designated area and no longer only the area near roads, has to be compensated. Estimates of this change in the compensation scheme show that the cost of compensation may increase by a factor of 5 to 10, making downzoning practically unaffordable for the government.
So, more revenue is needed to pay for the zero LT policy, especially if the government increases the compensation cost. The most obvious option is to increase the levy on planning gains in case of up zoning (planbaten). In Flanders, this applies to the conversion of unbuildable to buildable zoning and amounts to only 1 to 30% of the so-called ‘presumed added value’. Moreover, the ‘presumed’ value increase is a fixed table of prices and in many cases an underestimation of the actual added value. The government could consider the added market value as a basis for calculation and could increase the share to be taxed as well. However, the increase in taxable share does not go beyond 1 to 50% in the draft decree. From a socially justified point of view, the added value could be taxed to the same level as value loss is compensated in the case of downzoning. However, the current and new value capture on value increase (1–30%, 1–50%) is not the mirror image of the current and new value compensation scheme (80% to 100%).
A second instrument with the potential for implementing a net-zero LT is the implementation of the transfer of development rights. TDR could be useful if the ‘construction shift’ is done from a planned greenfield development to an existing artificial surface that needs to be recycled (e.g., brownfield). However, from a legal and practicability point of view, this instrument appears to be complex in the Belgian context. The oversupply of transmitting rights that needs to be neutralized is guaranteed, but it is not clear whether sufficient receiving rights are possible. Due to the generous interpretation of building rights on land use plans, it is not possible to determine how much building right is originally granted to the landowner. Consequently, the TDR application was removed from the draft decree. The same fate befell the value capture of density increase without rezoning; this was also removed from the draft decree.
Finally, in the current public debate on the instruments, a third option of property tax is suggested. In his approach, Bossauw [
47] reverses the compensation discourse by suggesting a tax on additional
LT. This environmental tax is based on the ‘polluter pays’ principle and should cover collective costs caused by urban sprawl. A tax on further
LT could discourage spatial expansion and squandering of land. Furthermore, it could level out the discrepancy with more expensive urban development and contribute to a more budget-neutral solution to the compensation problem. This option has not yet been elaborated, but it undoubtedly has the potential to spare the government budget and slow down new
LT.
The term PVC is not usually referred to in Malta. One can only find limited reference to this term in research. However, PVC tools such as the property transfer tax, development permission fees, infrastructure service contribution and planning obligations do exist and are widely used.
In Malta, there is no land tax, but a property transfer tax is in place. Discussions on implementing a land tax in Malta were sporadic and the introduction of a land tax never materialized into any concrete action by the State. The property transfer tax may indirectly be used as a tool to support less land consumption. Initiatives taken by the Maltese Government over the years had lowered the rate of property transfer taxes for specific periods of time, within Urban Conservation Areas, to encourage the regeneration of these areas and thus indirectly reducing the need to consume more land elsewhere.
Similar initiatives can be taken in areas in need of regeneration, where a lower property transfer tax rate can encourage the development of already urbanized areas, thereby reducing the need to expand more land for development. An example could be the regeneration of the locality of Marsa, which for years had borne the brunt of the national power station, which has now been relocated.
The Planning Authority’s Development Planning fund receives funds through planning gain fees. The 2020 revisions to this fund were intended to further encourage the use of PA funds for urban greening concepts, Green and Blue Infrastructure (GBI) and to aid vulnerable sectors within society.
This indicates that while existing PVC instruments may not directly support less land consumption and land thrift, planning gain fees can also contribute towards the rehabilitation of degraded areas. The concept of planning gains or planning obligations can be further widened to include for renaturation projects and desealing of soil-sealed areas, especially for large private sector development projects.
LT is not only the result of private projects. LT is also the result of road, school, and hospital building. While these projects are beneficial to the public in general, the LT generated by these projects is substantial. The government pays monetary compensation (according to market value) to the landowners when land is taken over for a public project. However, there is no disincentive for public authorities to limit the footprint of land take in their projects. A new PVC tool could be presented. It could introduce planning obligations on public projects, whereby public entities that propose projects with a high volume of LT would be required to re-naturalize other publicly owned lands. The Lands Authority which manages government-owned land could together with other entities such as the Ministry for the Environment, Climate Change and Planning, the Environment Resources Authority and the Planning Authority identify large swathes of government-owned land which can be re-naturized.
The way LT and compensation are measured at a European level, makes it very difficult for Malta to rehabilitate areas large enough to be considered as compensation or as an offset to the expansion of artificial land needed for development in other areas. The rehabilitation of the Wied Fulija landfill into a natural parkland can be taken as an example. An area of 6.5 ha, previously a dumpsite, has been restored into a green area. Projects of this scale, which can be implemented by the Maltese Government may be limited in nature.
6. Conclusions
The research shows how it is difficult to assess
LT across Europe because the reference scenario is widely different, moving from state to state and in some cases even between different regions inside a single country. The policies that aim to reduce
LT are slightly different too and the European target of NNLT by 2050 is translated in different ways across Europe according to the pressures and drivers at the basis of the
LT phenomenon of each single nation [
48].
The comparative research showed that the definitions of LT used by the various European member states are not the same, which makes it difficult to compare national statistics. Therefore, to make the comparison of four cases feasible, the uniform data of the CLC (CLC 2018) was used. This dataset has the advantage of allowing a comparative analysis between the countries, but when we have a closer look at the data and compare them with more accurate, national measurements, we notice that especially the smaller countries show large deviations. For Malta and Flanders, we can confirm the conclusions of Barbarosa et al. and Decoville and Schneider that the level of LT is underestimated as changes in parcels of less than 5 ha can occur in these countries. In regions with a lot of urban sprawl such as Flanders, the resolution of the CLC is not high enough to measure all buildings and other human land use, resulting in an underestimate of 6% LT in the case of Flanders.
To improve the overall monitoring of the (non) binding objective of the NNLT, it is recommended that each Member State uses the same definition of LT and integrates it into its policy discourse, geographical statistics, and land registry.
As stated by Marquard et al. [
3], the term
LT should be clarified and prioritized in the EU context. For example, the Flemish government introduced the Dutch translation of
LT (‘ruimtebeslag’) into its regional policy documents and adopted the concept in its GIS measurements. Since 2013, the environmental agency has been publishing detailed
LT measurements every three years in line with the European definition (Landgebruikskaart 2013, 2016, 2019). Such regular publication gives an in-depth view on the current evolution and helps keep the issue of
LT on the political agenda.
The examples considered in the research show how land use is linked to PVC and how PVC tools are at the basis of policies aimed at increasing land use efficiency.
Efficiency can be fostered by promoting densification policies [
49] that can be translated into actions aimed at redeveloping existing abandoned and derelict urban sites instead of creating new neighborhoods outside the consolidated city [
50]. This aspect, which is the grounding principle of urban regeneration policies, can bring on one hand in reducing the consumption of new land contributing to achieving the NNLT goal and on the other hand, it can increase densification in urban areas creating the condition to develop PVC policies [
51].
As argued by Yang et al. (2021) in their study of land surface temperature factors based on local climate zones, the relation between building density, vegetation and water bodies could create more comfortable living environments, however measures should be taken to suit the local conditions, thereby ensuring the coordinated development of regional climate and social economy [
52].
These aspects bring to further questions that can be developed in future studies and they concern aspects related to cultural ones of urban regeneration. How is it possible to foster urban development without losing local identity? How is it possible to involve the private subjects in the urban development process when the urbanization of agricultural land is more convenient for them but not for society? Are the effects of urban regeneration related to different types of operative agreements?
These are only a few implications related to the implementation of PVC tools to foster land use efficiency, but they must be answered to achieve a more sustainable urban development that aims to create value through the enhancement of local assets and features.


