Article

Dense and Proximate Development—Daylight in the Downtown Area of a Compact City

Faculty of Architecture, Warsaw University of Technology, 00-661 Warszawa, Poland
*
Author to whom correspondence should be addressed.
Sustainability 2022, 14(2), 774; https://doi.org/10.3390/su14020774
Submission received: 5 December 2021 / Revised: 6 January 2022 / Accepted: 8 January 2022 / Published: 11 January 2022
(This article belongs to the Special Issue A Diversified Approach to Mitigate Crises in Urbanized Areas)

Abstract

:
Daylight is of utmost importance and should be the main source of light in most areas dedicated to working and living. When considering our contemporary way of living, it can be easily discerned that most of our life is spent indoors, yet in a typical architectonic design approach, daylight is too often hardly of consequence. Hence daylight becomes a critical factor. Designers comply with the legal requirements of the solar hours required for areas subjected to constant use. Simultaneously for electrical engineers’ daylight is only an additional source of light valued only where energy efficiency is concerned. The basic idea of this research is to, starting from the concept level, design the building’s volume in line with energy efficiency requirements and user expectations using daylight access strategy as the main parameter. This scope of research has been a subject of various scientific theses conducted within the last years at the Faculty of Architecture Warsaw University of Technology. This paper is dedicated to the latest and most developed outcomes. The presented solution is an architectonic point of view dedicated to the use of the daylight factor in office areas located in a dense city district that may support efficient energy requirements, including the requirements of the electric lighting system. Illumination values were set according to the BREEAM daylight and PN-EN 17037 Daylight of Buildings standard. The presented strategy is unconventional for Poland, but has the potential to be included in practice and should be developed further, together with electrical engineers, as a part of energy-saving solutions. Possibly, it should be followed simultaneously with the development of the compact cities ideas. It is hoped that it might be a starting point for discussion, and for a more detailed interdisciplinary research in the future.

1. Introduction

Daylighting has been consciously and unconsciously used throughout the history of human civilization. The sun was the key factor influencing the form and location of monuments and the layout of many towns [1]. Notably, legal access to light was already known in the Roman Ages, where the right-to-light created a set of servitude laws known as’iura luminum’ [2].
The introduction of electricity into buildings in the second half of the 20th century gave the design architects tremendous creative freedom and independence from the natural light source. The general assumption was that electricity solved all problems concerning adequate light in homes and places of work throughout the whole day, and it was only in the late 90s that new analyses proved the daylight’s indispensability in working and residential areas. It concerns economic issues and energy-efficient strategies as well as a wide spectrum of health issues [3,4,5]. Moreover, the users of daylit office buildings reported an increase in general well-being compared to areas without access to daylight; hence, benefits such as better health, reduced absenteeism, increased productivity, financial savings, and user preference should also be considered [6,7].
Urbanization and the idea of compact cities have consequences on access to daylight. This approach dates back to 1970 when Dantzig and Saaty [8] proposed a terraced circular city composed of eight levels with a central core containing commercial, industrial, and service centers. The urban plan included high-density settlements with less dependence on automobiles. Various definitions of compact cities can be found in the literature. In the late 20th century, Thomas and Cousins [9,10] also identified a compact city as having short walking distances and high accessibility, whereas a decade later, Neuman presented its 14 characteristics as including small plots destined for development and low open space ratio [10]. In short, planning conditions postulated a return to the traditional morphology of town planning, where cities should include a denser urban structure. Compact city characteristics lead to a lower environmental impact, with shorter distances and less automobile dependency. The aim was to increase the efficiency of existing infrastructural investments by supporting residents with easier walking distances and access to various city functions. The city of Amsterdam can be used as a good example, as its government policy is to build higher to take advantage of the city infrastructure and proximity to places of work and services. This city model is valuable when the economic goals are concerned, and even if no significant impact on local social capital, sense of community, or resident satisfaction were noted, the environmental and energy-efficient aims were still secondary [11,12]. Owing to the rapid growth of urbanization processes, buildings have become responsible for more than one-third of the world’s energy demand. Cities account for 70% of greenhouse gas (GHG) emissions, 2/3 of global energy consumption, and 50% of solid waste production [10]. Simultaneously, if the development policies are aligned with environmental and climate objectives, cities may play a key role in reducing emissions. According to OECD’s principle 5, it is possible to leverage cities’ potential to advance environmental quality and support the transition to a low carbon economy by exploiting the potential advantages. The use of urban density and form, moreover, doubles the population density and increases CO2 efficiency typically by 42%. [13,14]. This is why many governments and international organizations focus on the building sector and promote introducing more sustainable and energy-efficient solutions in buildings.
Unfortunately, intensification of the existing urban tissue means that new buildings are often high-rise and subject to intense shading by other already existing buildings. This has a profound impact on user access to acceptable daylight levels. Therefore, standard facility management is highly dependent on the electric lighting system used as the primary light source. Much of the current energy demand in buildings is also due to various outdated building practices, inefficient systems and equipment, and inadequate technical control. Several studies have discussed the energy-saving potential of integrated daylight and artificial lighting solutions, where efficiency measures can reduce artificial lighting energy demand [15,16,17]. In general, energy demand is up to 30–40% of the total energy requirements [18]. Artificial lighting accounts for 14% of the electrical consumption in the European Union and 19% worldwide [19]. The use of well-designed natural lighting, controlled by technologies or systems guaranteeing its accessibility inside buildings, can reduce the level of energy consumption for artificial lighting and air conditioning systems [20].
One of the obvious and often studied solutions that lower the need for artificial light is the application of an atrium providing natural lighting and indoor temperature control. This choice contributes to both the welfare and comfort of occupants proceeding with different tasks and efficient energy outcomes [21,22]. Starting with environmental aspects such as enhancing the daylight level, this solution also has economic value, such as lower energy requirements for artificial lights. The best geometrical parameters of the atrium are limited by the level of accessible daylight and heat distribution in the building’s volume. This idea can be referenced to the ‘Well Index Formula’ [22], specifying the ratio of the atria’s height, width, and length.
There are no worldwide uniform standards for daylight illumination. Various approaches can be found in international environmental certifications and national legal codes. In the United States, the first documents recommending an expected level of daylight in buildings were prepared by the Building Officials and Code Administrators International in 1990 [23]. This idea was further developed in Germany with DIN 5034-4, where the preferred illumination level depended on the complexity of the performed task [24]. There is a current development with DIN 5031-100 describing the melanopic light effect of natural and artificial light sources [25].
One of the most widespread certification systems, the Building Research Establishment’s Environmental Assessment Method (BREEAM), relies on the BS EN-12464 standard. According to BREEAM 2018, at least 80% of the office area should receive a minimum of 300 lux for 2000 h/annum, and for areas with borrowed light, designers can use light shelves, clerestory glazing, sun pipes, or internal translucent or transparent partitions [26].
Another metric was authored by the Illuminating Engineering Society (IES) in 2013, called Lighting Measurement 83 (LM-83), Approved Method: IES. Spatial daylight autonomy (SDA) and annual sunlight exposure (ASE). It is evident that long exposures to high illuminance levels can cause unwanted overheating and glare. To avoid this phenomenon, the annual sunlight exposure (ASE) depicts the percentage of the area that annually meets or exceeds the illuminance limit (1000 lx) for at least 250 h. Presently, SDA and ASE criteria are incorporated in the leading environmental certification standards and standard software packages (Diva, Ladybug, and Honeybee for Rhino, Design, etc.), allowing us to proceed with the case-best scenarios [27]. The daylight factor (DF) is defined as:
DF = (Ei/Eo) × 100%
where Ei = illuminance due to daylight at a point on the indoors working plane, Eo = simultaneous outdoor illuminance on a horizontal plane from an unobstructed hemisphere of an overcast sky.
DF-based legislation is concentrated on the availability of an external light source rather than on the level of illumination within the interior space, as it does not respond to climate change and regional parameters. However, its simplicity and familiarity allow for widespread use during the first stages of design, where accurate compliance with building codes is not required. BREEAM provides recommendations for the average daylight factor (ADF) required for the mid-European latitude (50–55 degrees); for office areas, its value should be at least 2% [26].
Another well-known metric is the "window-to-wall ratio" (WWR). Usually, this is expressed as a percentage and differs according to the dimensions of the evaluated space. In the United Kingdom, official recommendations regarding WWR were first published in 1971 by the Department of Environment. It specified a threshold of 20% for spaces with an 8 m depth, and 35% for those of 8–14 m [1,24]. Window to floor area ratio took root in the regulations of other countries (i.e., Japan and Poland). BREEAM also specifies the size of the opening and the distance to the vertical elements obscuring the direct view [25]. In addition, LEED claims that 75% of regularly occupied areas should have a fair view of the outside [28,29,30]. Similar data were placed in the European Standard EN17037 content [31].
Polish daylight standards are based on the WWR approach and, with minor variations, have remained unchanged for the past 90 years. Two short paragraphs can be found in the resolution technical conditions, which must be applied to buildings and sites [32,33,34]. The first indicates that constant use areas (more than 4 h in Poland) should have access to daylight. Data concerning the area, shape, and expected scope of the tasks foreseen in the room should be included in the analysis. The other paragraph specifies that window area openings versus floor area should be 1:8 or at least 1:12, depending on the foreseen function. On 30 January 2019, Poland introduced the new EU standard PN-EN 17037 Daylight in Buildings. Norms are not obligatory in Poland and are legally binding only when specified in the Building Code Act. This new norm diverges from the existing legal provisions, and its possible application in the design process is currently a subject of international research titled ‘New Level of Integrated Techniques for Daylighting Education (NLITED)’ led by the University of Gdansk [35]. Similarly, as in the BREEAM method, PN-EN 17037 provides two approaches to choose from when justifying the adequate level of daylight: (1) based on the daylight factor, and (2) illuminance of the working plane. The main evaluation quantities were illuminance, percentage of the area, and duration. The recommended values were similar to each other. This standard also uses the term daylight glare probability (DGP). The formula includes data concerning illuminance at the eye level and luminance of glare sources.

2. Methods and Research Approach

Even though for many architects massing, orientation, and aesthetic solutions for glassed areas are a primary option, the professional expertise of the authors proves that too often daylight is not considered as the leading factor. In more advanced stages, they rely on electrical engineers to deal with the appropriate level of illumination. Daylight issues are secondary, and their capacity to be used as one of the leading design parameters is lost. In this study, researchers assumed that the designer would follow an efficient energy strategy with the daylight used as the main parameter shaping the building’s volume. The aim was to achieve the best daylighting solution. Therefore, the function and location of the window openings and other daylighting systems, including their interaction level, were already acknowledged during the design conception phase. This approach is not entirely new. In the past, when daylight was the only light source, the buildings also had to be designed as efficiently as possible based on existing technologies.
All middle latitude regions, starting at approximately 40°, are notable as receiving low levels of ultraviolet B (UVB) light waves, especially during the winter months [36]. In phase time, the typical choice is to compensate the required light level with artificial light systems or regulate the daylight excess with blinds and louvers introduced in the final stages of the design process. High-rise buildings located in city centers, often in already developed areas, are subject to all the aforementioned limitations. Final volumes must maintain efficient energy reference limits and fulfill the economic expectations of the financing stakeholders. Since daylighting systems are marginal, more care is taken with other solutions such as thermal transmittance with low "U" efficiency of the building’s envelope (W/m2K) and efficiency of technical systems and technologies. The present analysis is a checkpoint for an innovative design approach where daylight issues are the main parameter influencing the massing scheme. The solutions cover both direct and reflected light solutions. The research was conducted in the following phases:
  • Choosing a Warsaw downtown site.
  • Energy requirements calculated for a standard contemporary building located on the chosen site.
  • Optimization of the building volume with daylight parameters and alternative solutions.
  • Energy requirements calculated for the building designed with daylight parameters. The chosen approach is to redirect daylight from unshaded parts of the designed volume to the shaded areas using sky-atria. Two concepts were proposed and verified against the reference building.
The research area was based on a repeatable analysis procedure and the assessment of proposed and modified solutions [20]. Rhinoceros 3d application software developed by Robert McNeel & Associates, including version 6 + plugin Grasshopper, and Galapagos, built-in that version was chosen as the basic software. In addition, the plugins Ladybug (version 0.0.68) and Honeybee (version 0.0.66) were used to run the environmental simulations in real-time. During the early stages of research, radiation hour analysis and shadow range were used. A simple ray-tracing simulation was performed to check for the best efficiency and compliance of the chosen daylight systems. This method calculates the path of the sun rays for regions with varying absorption and reflection characteristics, such as the Warsaw region. However, in the Honeybee software, all surfaces were defined as fully reflective, which necessitated further confirmation of the results obtained during the final simulations. In this case, an annual daylight (AD) analysis was chosen, which considered the material qualities, including reflection, absorption, and transmission. All material parameters were adjusted according to the BREEAM certification standards (Table 1) [25]. The best possible solution was optimized with support from the built-in Grasshopper solver Galapagos and its generic algorithm. When interacting with the input data, it generated an upgraded geometry according to the performance of the set objectives. The limits were inserted gradually, while the research moved from general to specific analysis. The outcome was drawn up as a system that combined the best possible solutions.
Additional data were sourced from the PN-EN 17037 standard [37] (see Table 2).
As discussed above, the daylight regulations formulated in existing Polish building codes are not well developed compared to the rules applied in other countries. Therefore, for this research, the following assumptions were formulated (Table 1 and Table 2): i. The daylight glare probability (GBP) should not exceed a maximum value of 0.45 on the evaluated surface for more than 5% of the occupational time. ii. To avoid glare, the WWR must not exceed 50%. iii. Internal areas (75%) were provided with at least a landscape view, with no vertical obstacles within 6 m from the exterior glazing. iv. The threshold for the view of a WWR was accepted according to the BREEAM specification for the spaces of four depths: less than 7 m, 20%; 8–11 m, 25%; 11–14 m, 30%; 14 or more, 35%. v. Any space with a WWR of more than 40% was treated as prone to glare and required solar shading devices. vi. For office spaces, the most comfortable distance from the opening to the working surface was 6 m, as this width is used in many European countries. The placement of openings on two sides of the working space doubled this distance [37].
The first analysis included preparing a 3D urban model of the surroundings. Software used included BIM Modeling—Autodesk®, Revit, and Solar and Radiation Analysis in Autodesk® Revit environment. Heating simulations were performed using DesignBuilder software with a simplified building energy model (SBEM) alternative having monthly static calculations. The climate data were modified according to the Polish standard PN–EN 12831:2006 and monthly data available from the Polish Institute of Meteorology and Water Management. DIVA-for-Rhino was used for ray-tracing analysis.

3. Case Study Results

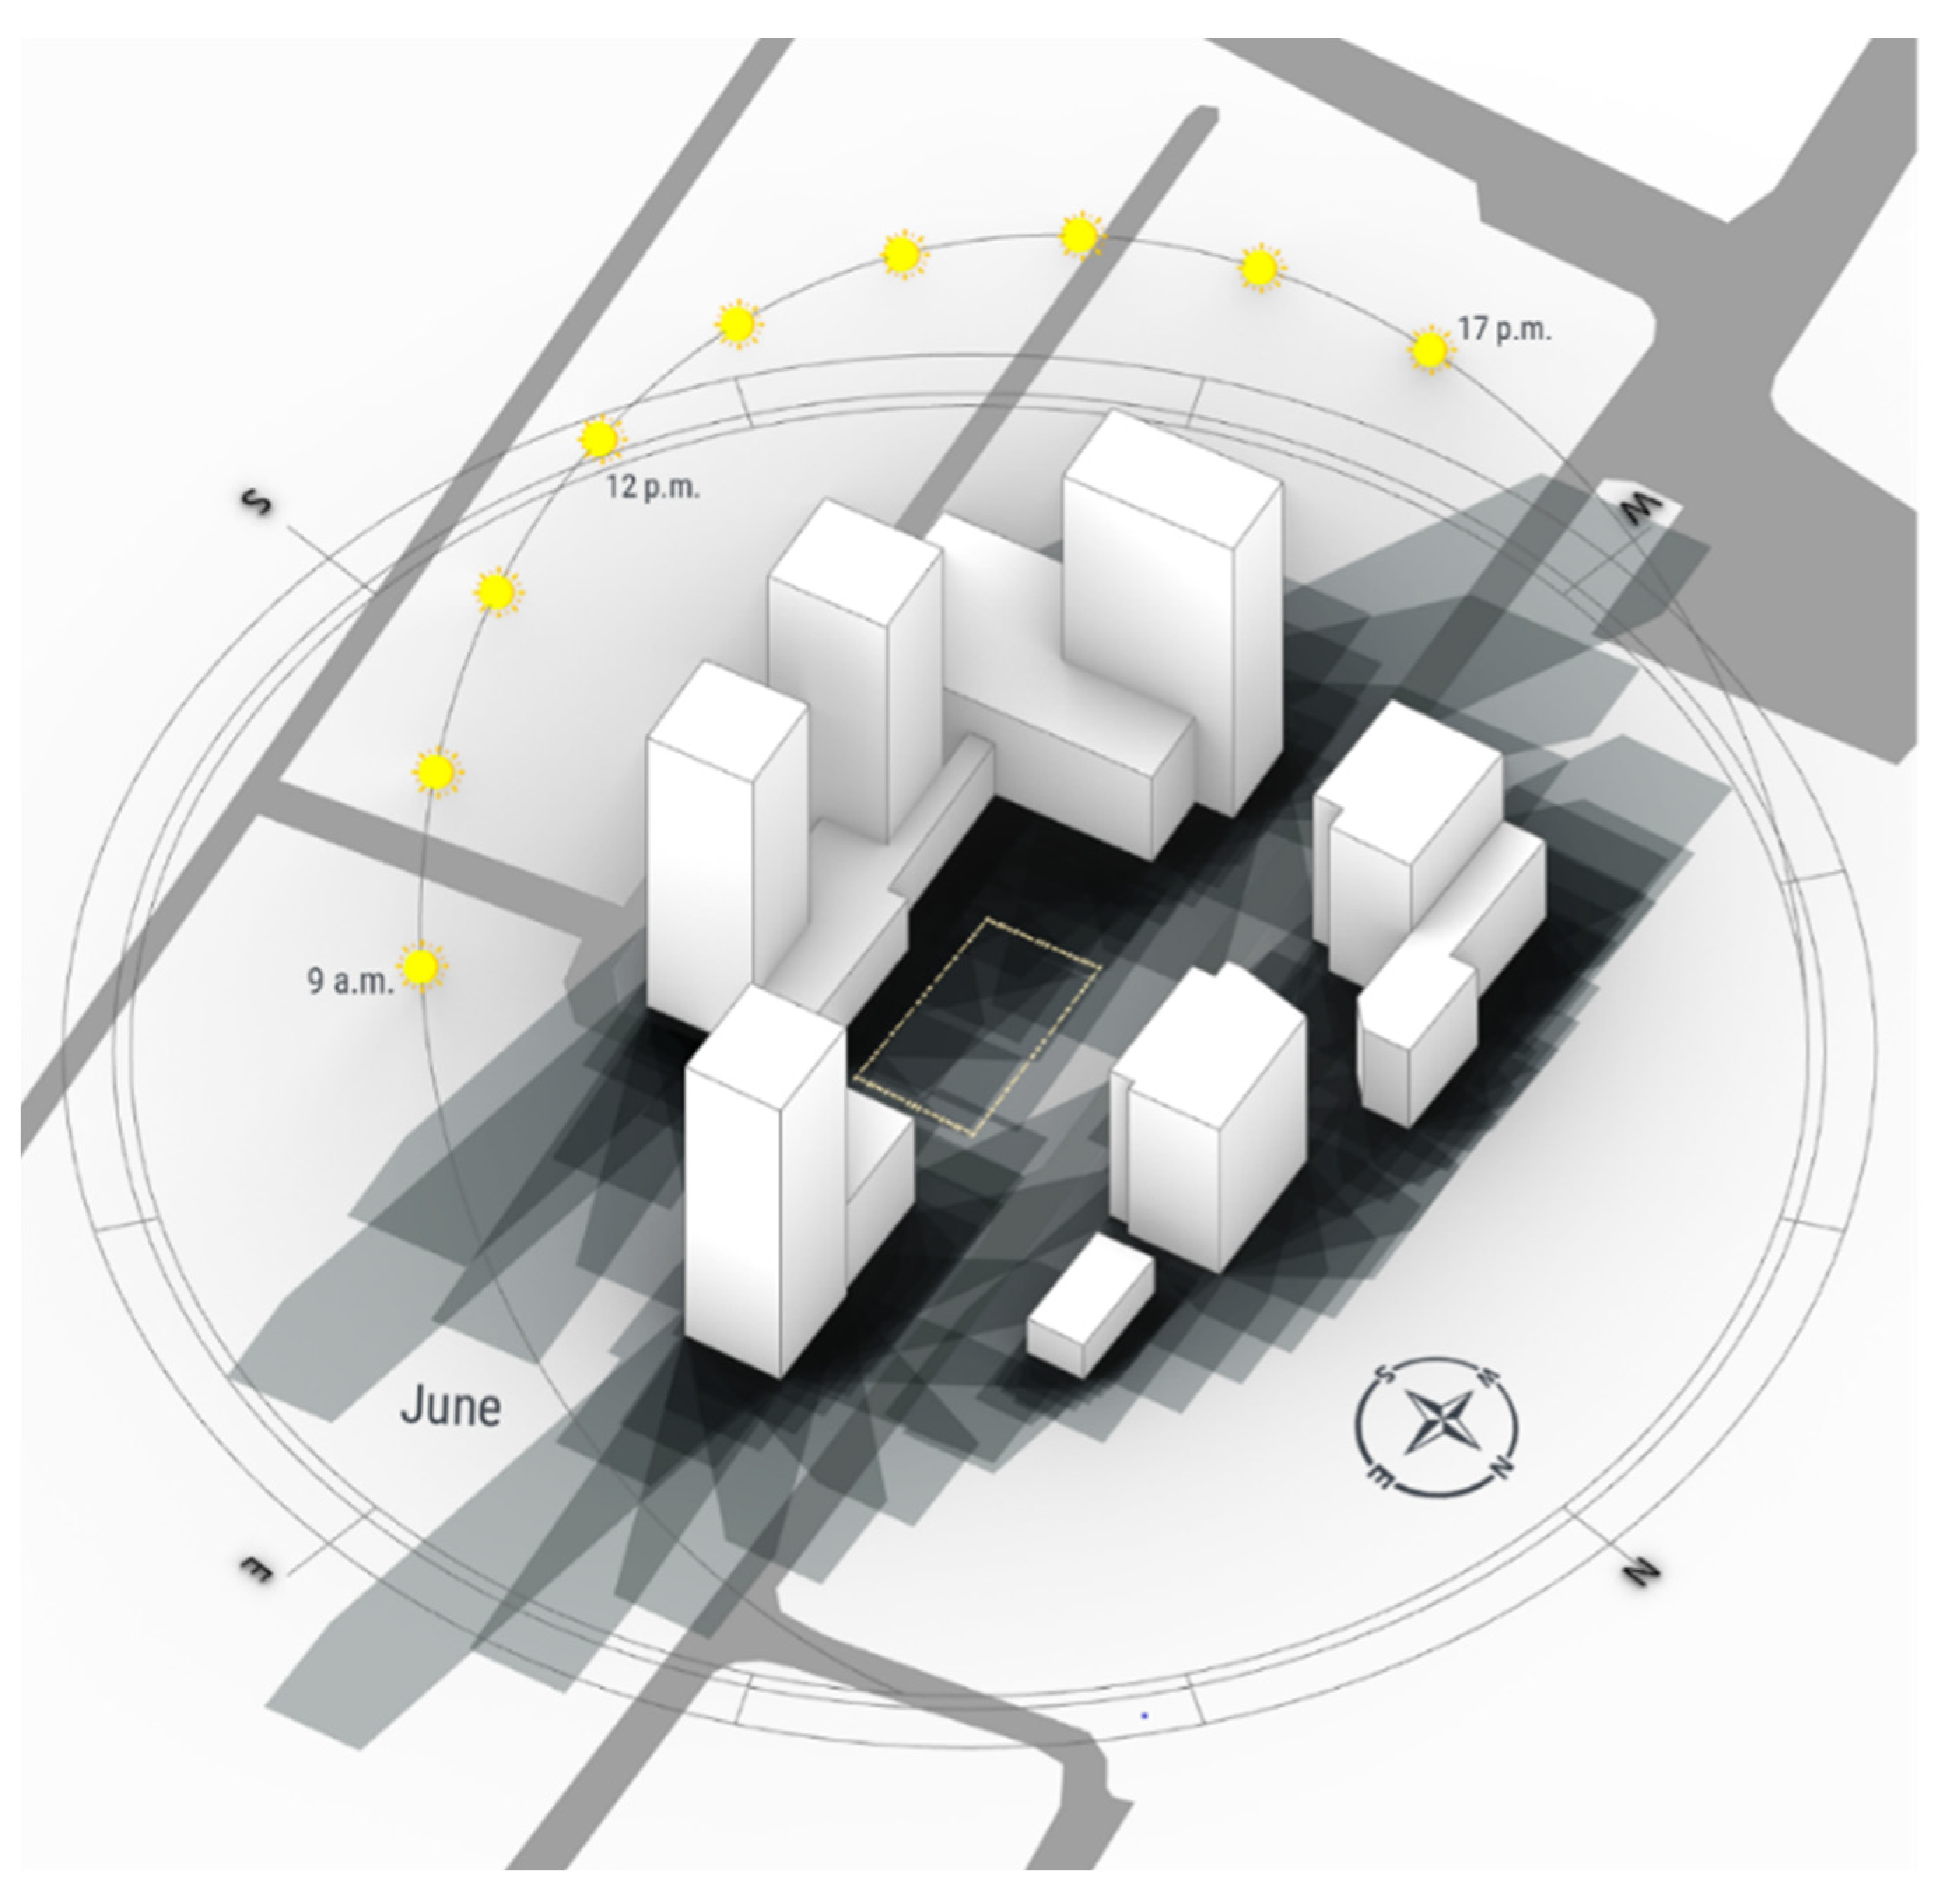
3.1. Choice of a Site in the Warsaw Downtown Area

Several Warsaw locations were initially chosen for this study. They had to fulfill specific parameters: location in the city center, dense and highly shaded developed site, the existence of a valid master plan allowing to build above 100 m in height, and the possibility for retail and office function. The best location proved to be a plot in the Wola District located at 59 Grzybowska Street (G59). It had the lowest daylighting parameters among the analyzed plots. Accordingly, a preliminary radiation analysis of the site was performed. The simulation was conducted for 21 June when the sun is at its apex. The shadows were the shortest on that day, and the shading results indicated shadowing throughout the year. (Figure 1).
The master plan indicated that this site could be used for office purposes. Designers had to maintain 10% of green areas, and a maximum construction density factor of 8.0 was established. Maximum height allowed: 170 m for a building located on the east side of the plot area and 100 m for a building located on the west side [38].

3.2. Energy Use Calculated for a Contemporary Standard Building Located on the Chosen Site

The first analysis included preparing a 3D urban model of the surroundings. The outcome determined the maximum allowed height of the new volume. According to the existing legal requirements, new buildings should not reduce the existing sunlight conditions of the surrounding dwellings; therefore, the initially assumed height of 170 m was reduced to 120 m with a 24 × 36 m footprint. At this stage, the atrium was not foreseen.
For this initial concept, heating simulations were performed using initial design data (Table 3).
The analysis aimed to establish energy requirements analyzed for a reference office building against the dataset according to the Polish Building regulations published in a resolution issued by the Minister of Infrastructure and Construction, concerning technical conditions that must be fulfilled by the buildings and their location dated 7 June 2019. The building’s main parameters were supplemented with official climatic data, foreseen number of users, electric lighting system capacity including assumed zoning and efficient use of daylight, required ventilation volumes, and equipment. A predefined heating and ventilation system requirement and assumed use profiles were included in the simulation. The data were sourced from an online weather forecast service of the Institute of Meteorology and Water Management, based in Warsaw.
The typical Warsaw energy carrier mixes the city-supplied heat and electric energy sourced from alternative sources, including coal. Therefore, a simple calculation process cannot be used. The primary energy (PE) was accepted as the preferable parameter and calculated as the final energy multiplied by the chosen energy carrier’s non-renewable primary energy input coefficient wi. For electric energy, the wi coefficient equals 3.0, and for the Warsaw heating network, it is 0.79 [39]. The total primary requirement for the designed building was estimated at 5,127,843.01 kWh/year and a PE ratio of 412.85 kWh/m2year. The total primary requirement for the reference building was estimated at 5,894,693.48 kWh/year and a PEref ratio of 499.86 kWh/m2y. The reduction in CO2 emissions limited to the area with regulated temperature was estimated and balanced against the reference building data. The emission factor for the designed building was 119.5 kgCO2/m2y, and for the reference building 151.8 kgCO2/m2y. Compared to the reference building, the basic design choices used in the proposed building allowed for 7.8% higher energy efficiency.

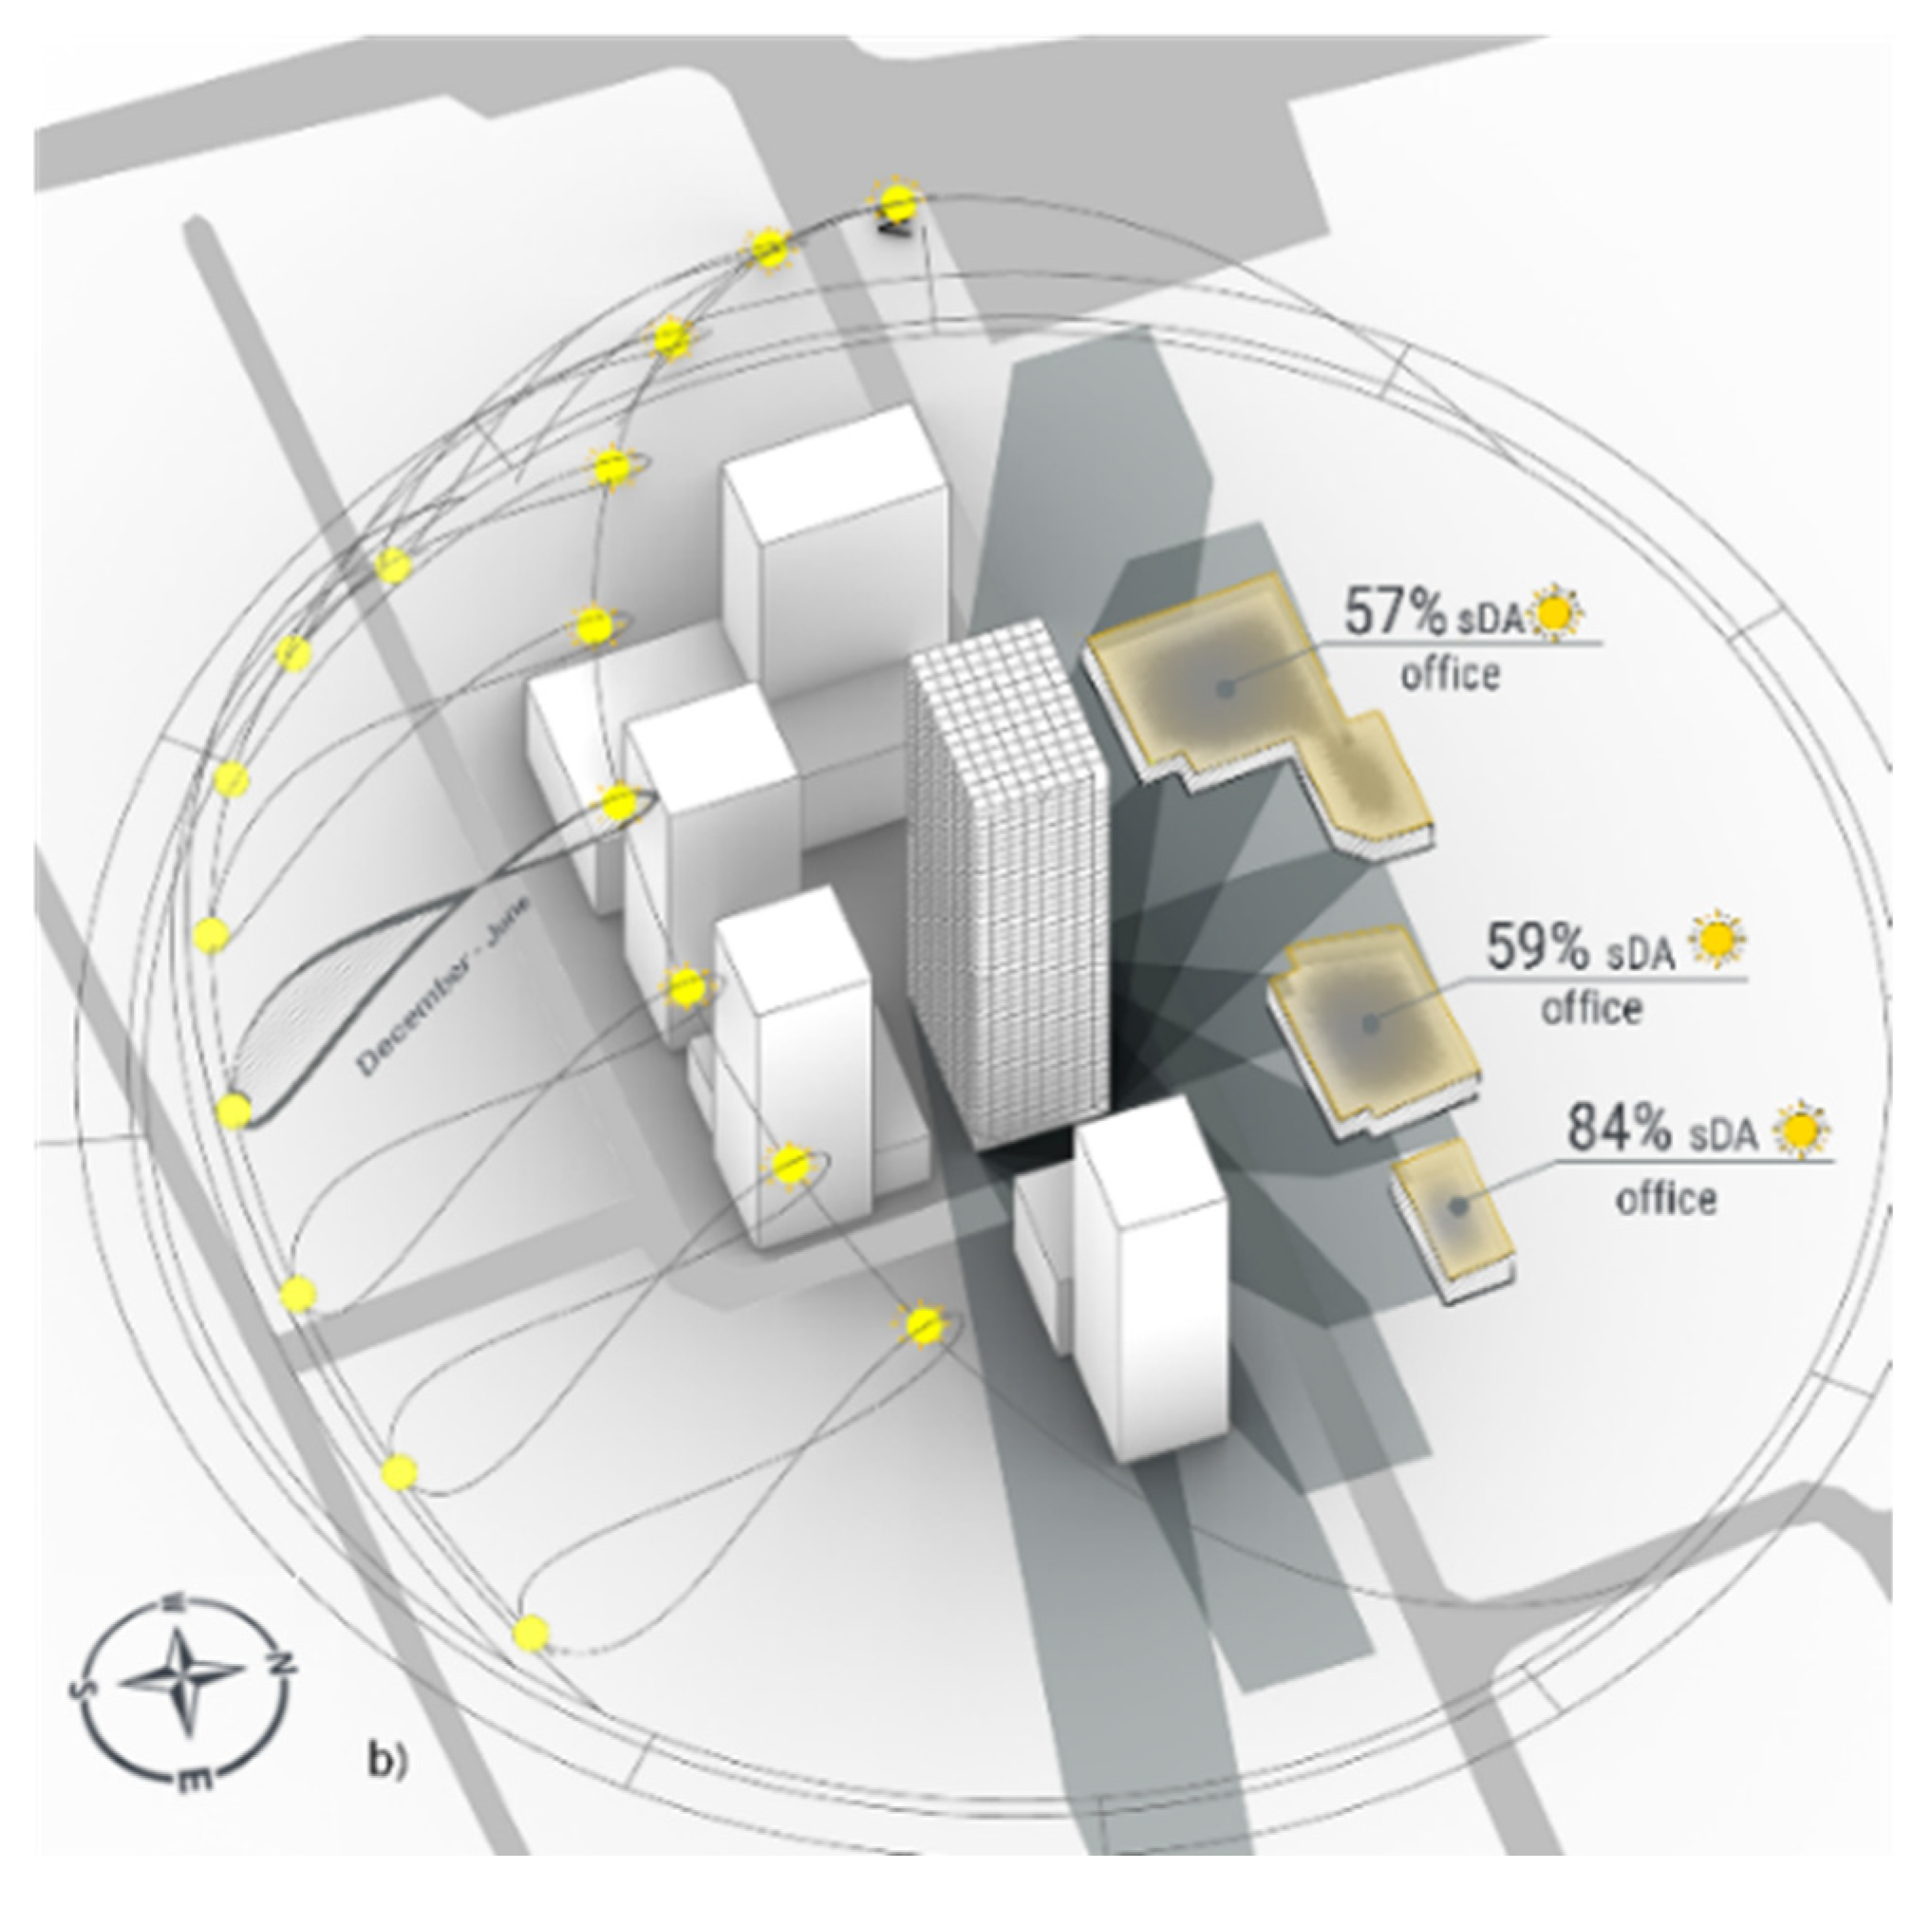
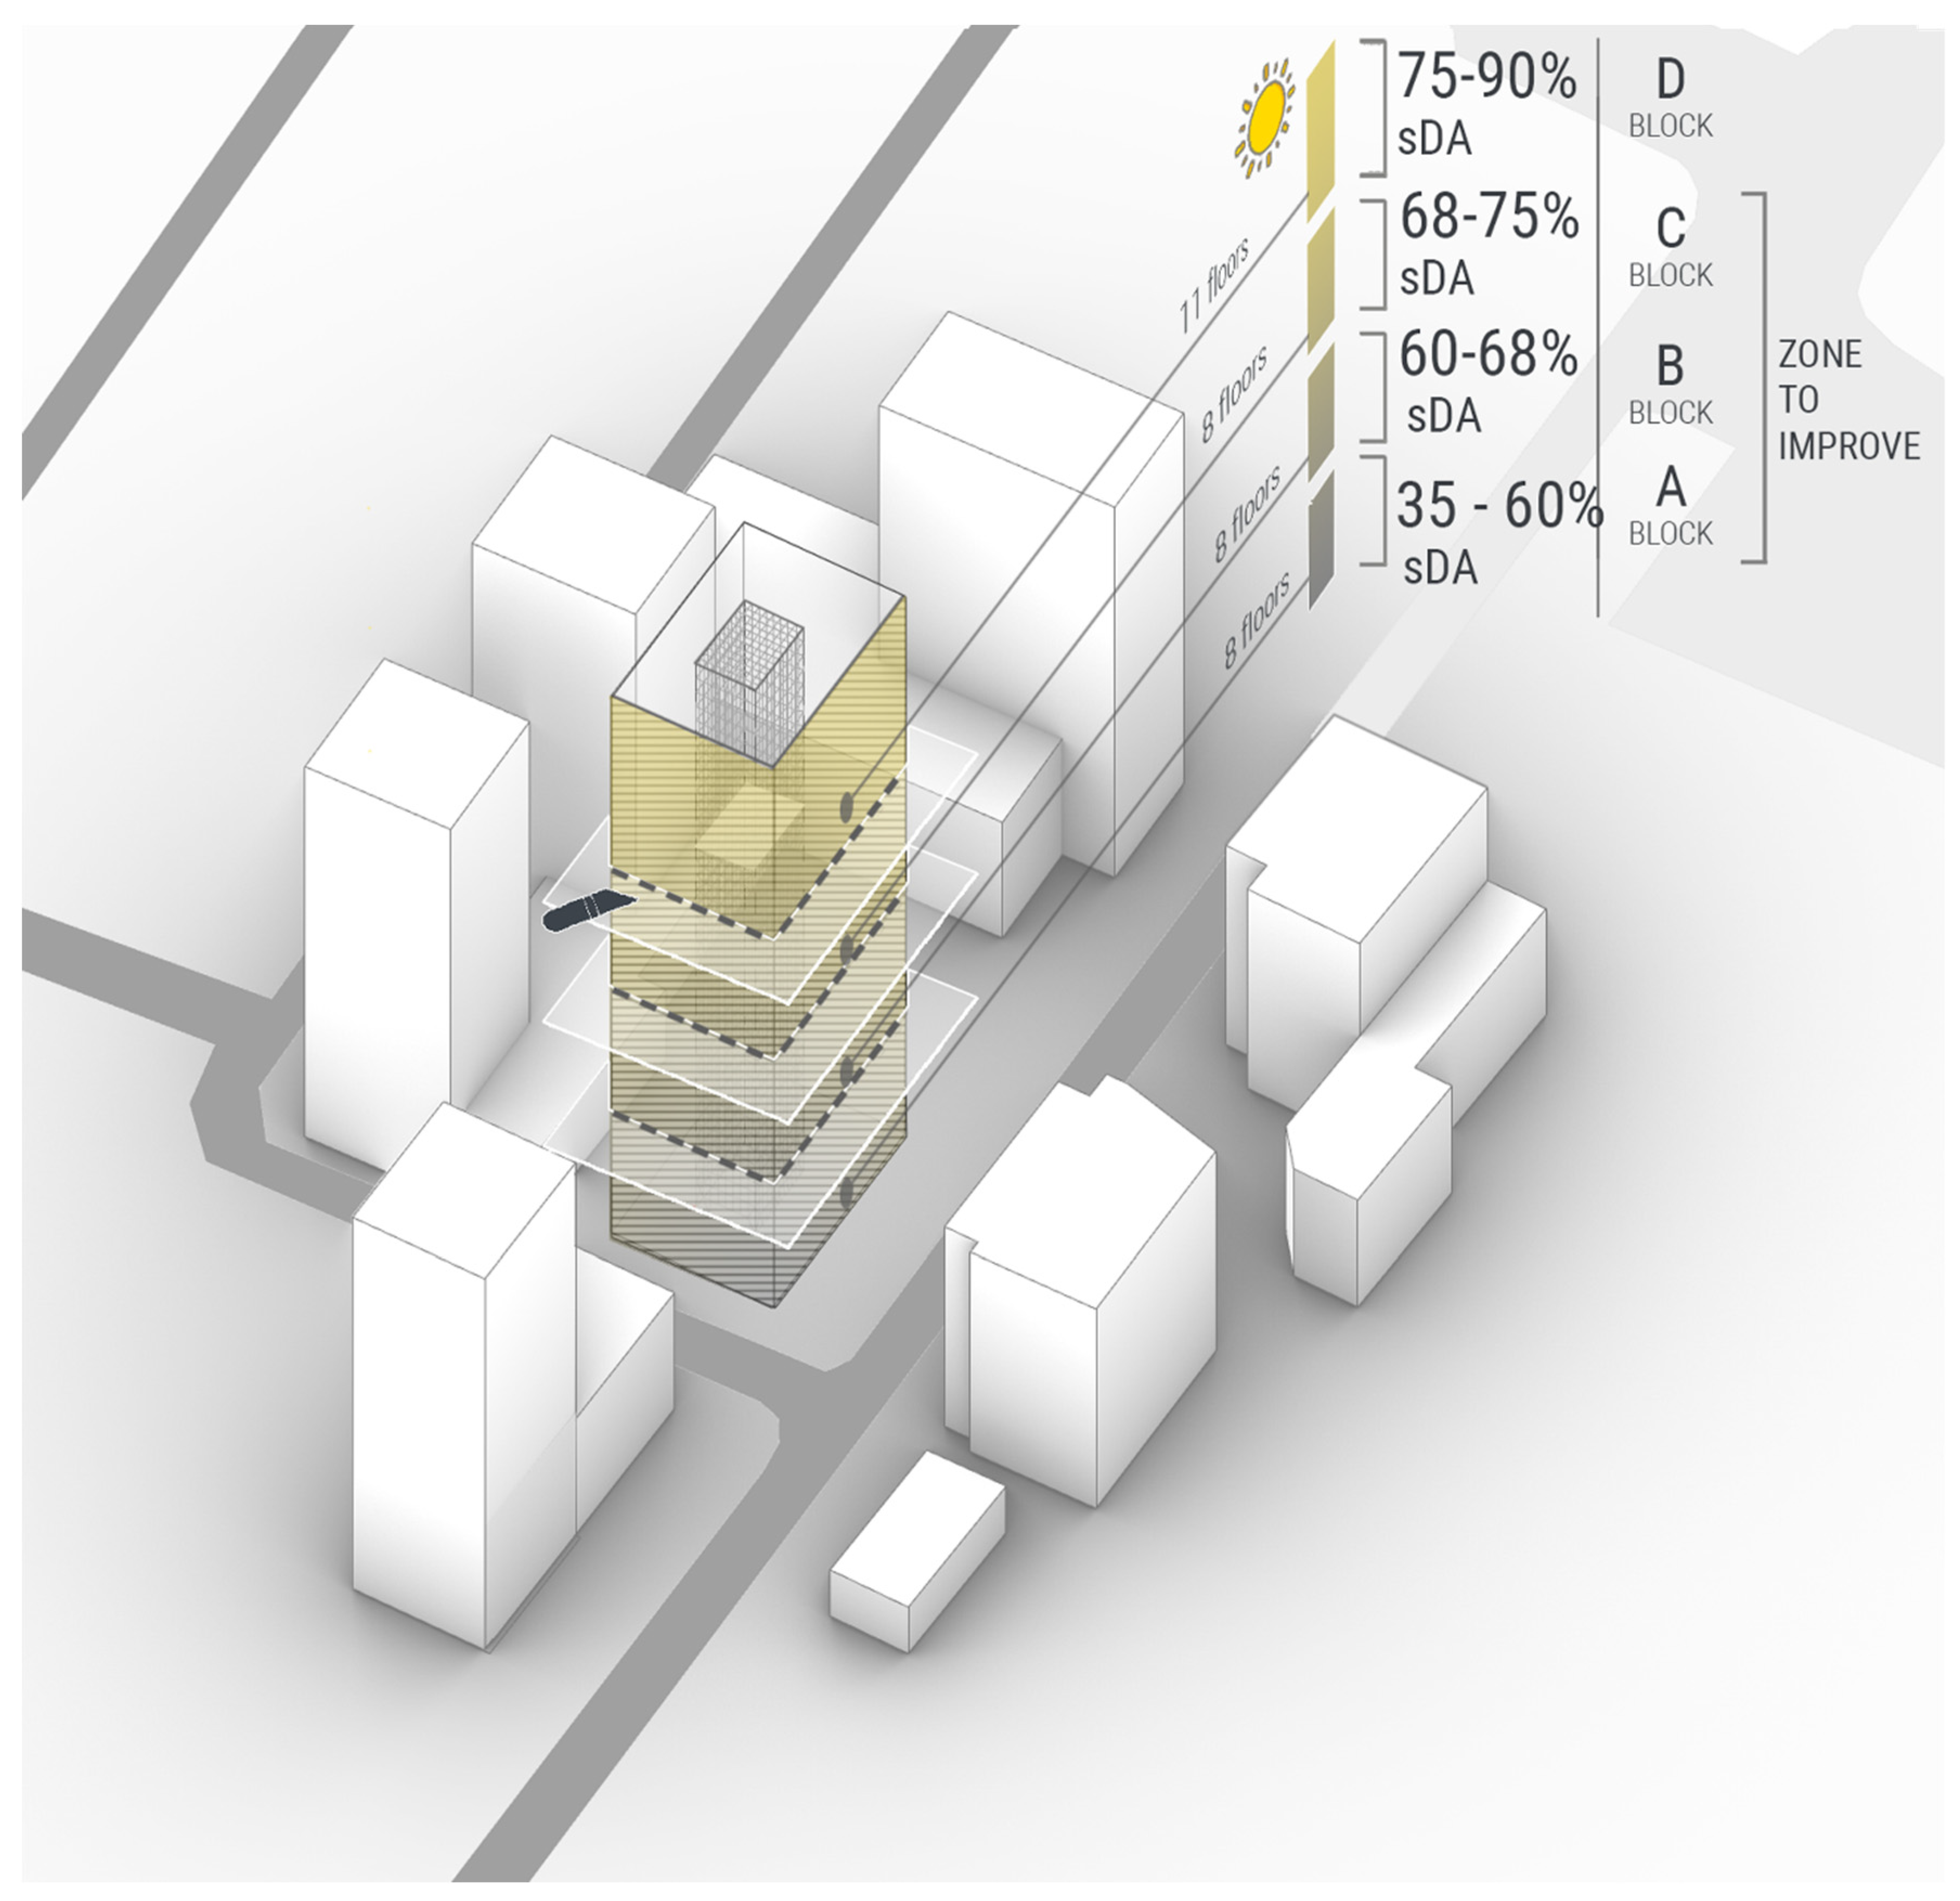
3.3. Optimization of the Building Volume with Daylight Parameters: Alternative A

The optimized building had the same dimensions as the initial building presented in Section 3.2: 120 m (approximately 35 floors) in height with a 24 × 36 m base. Analysis of the incident annual light directions revealed that the west-south part of the plot had the highest shade percentage. This analysis included the shading and screening of the surrounding buildings (Figure 2).
The simulation was conducted for a period from 21 December to 21 June. These positions correspond to the highest and the lowest possible points of the sun in the sky and show the starting and ending points of the shaded zone on the Z-axis (Figure 3). As seen in the diagram, the most illuminated area is the central part of the south facade, starting from the 5th floor of the building. The area below the 5th floor and a major part of the area between the 5th and 20th floors are episodically shaded during the year.
Existing urban restrictions and vertical shading studies indicated that daylight could be captured through a set of skylight or sky-atria systems. An atrium of 9 × 12 m was initially chosen, as these dimensions maintained a satisfactory view from the adjacent atria offices, providing the obscuring plane at a distance exceeding 6 m. The atrium form was rectangular, enclosed, and centralized, allowing light distribution while providing moderate ventilation. Following this model, an analysis was conducted to check the effectiveness of the chosen strategy. The building was divided into four blocks A, B, C, D, in which three were 28.8 m and one was 33.6 m starting from street level. For each block, an annual sunlight analysis was conducted (Figure 4).
Figure 4. shows that blocks A, B, and C require the enhancement of daylight parameters. This conclusion refers to the LEED and BREEAM daylight regulations, stating that the "preferred" value of daylight starts with 75% of the area and should be in the range of 300–1000 lx during at least half of the year. Atrium efficiency analysis proved that the zenith light source is sufficient only for the topmost block, whereas the central part of the south facade was suitable for the placement of the sky-atriums. Hence, a side-light-capturing concept was introduced. The vertical shading analysis is shown in Figure 5a. The assumption was to enhance the light level in 75% of the building’s area. This resulted in a multi-story side terrace proposal, with optimized size and form and a public function (Figure 5b). The primary choice of their dimensions and position was based on an equilibrium between creating a usable social area and minimizing its interference with the incoming light. The wall and ceiling reflective panel data were included in the algorithm input to provide the case with the best vertical and horizontal distribution of light within the building’s interior (Figure 5c,d).
The final daylight solution of the building was checked for glare effect and adequately modified where the location and size of the windows were considered.
The functional division of each floor was planned to correspond to the final daylight enhancement results. The range of activities was modified according to the achieved daylight levels (Figure 6). Therefore, artificially illuminated underground floors should serve as technical and car parking areas. The most shaded floors in block “A” can be used for public spaces without the benefit of lasting visual activities. Starting from the second floor, where the daylight level was enhanced, the range of functions was greater, although office areas started from the third floor with the lowest atrium. It was assumed that the easy office work area must meet the 300 lx-requirement, those suitable for computer-based activities must meet 500 lx compliance, and an office area involving drawing-based activities requires 750 lx [26].
Initial data for optimized building alternative A are as described in Table 3, except for the variable input data where, in comparison to the basic simple cuboid assumptions, an additional 43% of the usable area was supported with daylight illumination. The designed building energy requirements were set against a reference building and data according to Polish regulations (Table 4). The total primary requirement for the designed building alternative A was estimated at 4,980,721.98 kWh/year and the PE ratio at 403.52 kWh/m2y. The total primary requirement for the reference building was estimated at 5,894,693.48 kWh/year and a PEref ratio of 499.86 kWh/m2y. The reduction in CO2 emissions limited to the area with regulated temperature was estimated and balanced against the reference building data. The emission factor for the designed building is 108.4 kgCO2/m2y, and for the reference building is 151.8 kgCO2/m2y. Compared to the reference building, the design choices used in alternative A allowed for a better energy efficiency of 9.55%.

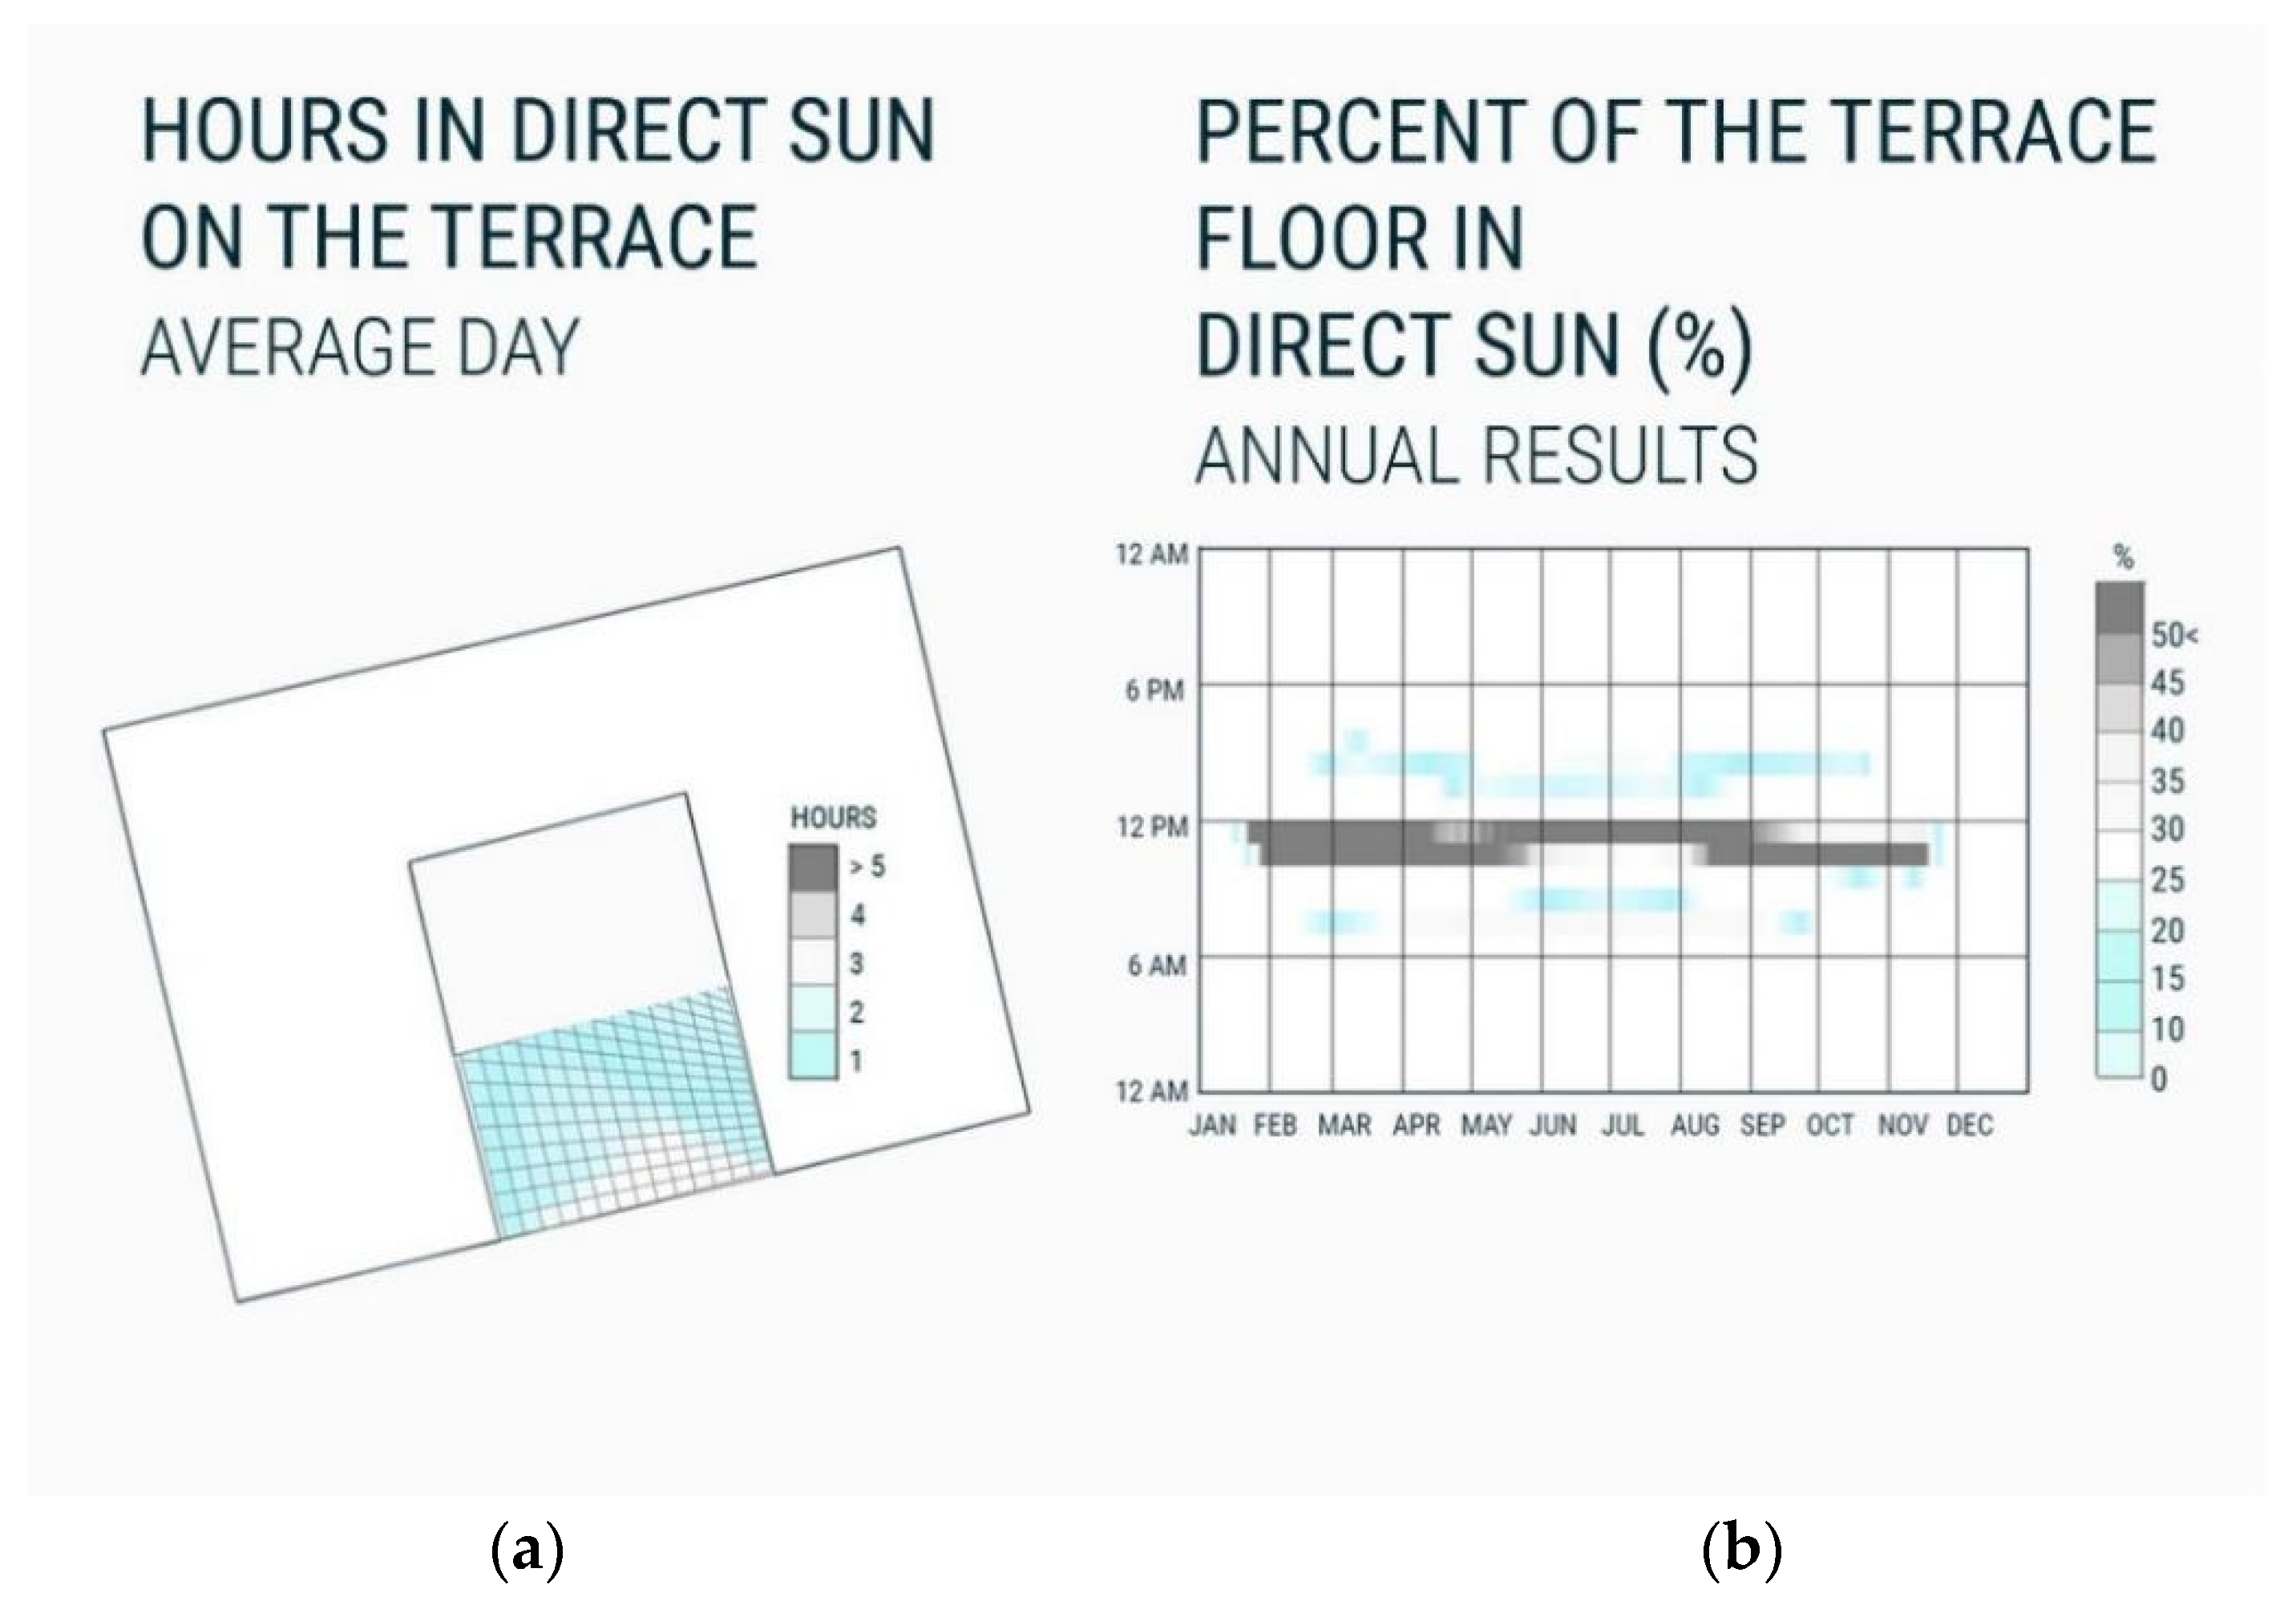
3.4. Optimization of the Building Volume with Daylight Parameters: Alternative B

The proposed alternative A solution proved to fulfill expectations, but it lacked architectonic esthetics, and the level of daylight illumination in the office areas was lower than what was initially assumed. To achieve a more diverse and energy-efficient architectural massing, additional daylight studies based on annual illumination and sky clarity conditions were undertaken. Occupancy daily hours’ time range, from 8 a.m. to 5 p.m., was used in the analysis. The results were divided into four groups, representing the months with the solstices and equinox positions of the sun: December, March, June, and September. In Warsaw latitudes (52°05′52″ N–52°22′05″ N; 20°51′06″ E–21°16′16″ E) March is characterized as the month with the highest number of clear sky days, while September is usually described as cloudy (Figure 7).
Annual illumination analysis proved that in some areas of the facade, the annual level of daylight had similar values. Therefore, the initial positioning of the sky atria was reconfigured from linear to diagonal by areas having similar illumination parameters (Figure 8). The efficiency of this solution was verified against previous assumptions and illumination levels.
The new arrangement was more satisfactory, both from the architectural and illumination outcomes. Nevertheless, to use the full potential of the proposed terraces, their position and form were developed more carefully using a generative optimization process.
Solar radiation was chosen as the main optimization parameter. The level of freedom for every point in the Z-axis direction was set between 3 and 15 m for blocks B and C, and between 6 and 15 m for block A. This choice was conditioned by the most intensively shadowed position of the latter. The X and Y coordinates were chosen according to the earlier placement of each terrace opening, although for blocks B and C, certain degrees of freedom were allowed to receive more daylight inside the terrace. For block C, this meant shifting the exterior terrace walls towards the west-south corner by 3 m, and for block B by 5 m. This combination of different coordinates resulted in differentiated volumes, which became the second optimization parameter (Figure 9).
Optimizations of the volume and radiation parameters were performed separately. Prioritization of the minimum volume parameter would have decreased the radiation parameter, while concentration on radiation analysis would inevitably increase the volume.
To achieve the best results in both categories, data from each category were combined. The final choice was based on the architectural qualities of each terrace separately and together as part of the designed volume. To guarantee both daylight efficiency and social access, the possibility of using them as a public area was checked. As the surface of the terrace floor was used as the prime redirector of the light rays, to minimize energy losses from possible screening, annual glare (direct light hours) maps for every terrace were prepared. These glare maps depict zones where direct light is allowed episodically or not at all (blue zones depicted in Figure 10) and which are the best locations for the public zones. Elevated balconies located within each of the daylight opening sections allow the best level of incoming light. Finally, two major options were developed.
Additional simulation included the use of reflective panels inside the terrace zones. Aftermarket analysis of particular factors that could be achieved, the best case solution where reflectance was concerned, became ALPOLIC-RF composed of a polyethylene core sandwiched between two skins of aluminum alloy. The top skin was EN AW-1085 hard, and the back was A1100P-H14 by JIS H4000. The surface was a mirror-look anodized finish, and the backside was a polyester-based wash coating or service coating. The surface was protected with a transparent self-adhesive peel-off protective film. Panel’s thickness: 0.02 m; and the standard size: width = 1220 m Length = 2440 m. ALPOLIC-RF has several properties, including thermal conductivity: 0.47 W/m2 K; and reflectance (JIS D5705): 83–97%.
Simulations of sunray paths were chosen as the most effective parametric method. This illustrates the impact of the balconies’ area on the level of daylight inside the building. The number of sun rays reaching the surface of the atria walls, before and after placement of the balconies, was chosen as the main evaluation parameter. The total floor area of the balconies located inside the terraces represents the secondary bounding value. The assumption was to create as much public space as possible, with the least losses in daylight performance. The overhang was given a width of 1 m and 3.5 m depending on the terrace’s illumination and glare conditions.
The suspended overhang was constant for every balcony and equal to 1.1 m. In the Y-axis direction, points could move within a range limited to one side by the size of the terrace wall, and from another by the artificially created 1 m limit. The final solution depended on architectural and radiation performance parameters (Figure 11 and Figure 12). After the first bounce from the terrace surface, a significant amount of light was redirected upward. To supply lower floors with daylight, it was decided to cover every daylighting sky-atrium with a ceiling clad in reflective and light redirecting panels. By changing the angle of the panels (positioning in the Z-axis direction), the form of the entire ceiling was also optimized (Figure 13). These parameters defined the position of the panels’ points in the X and Y directions. The Z-axis limits were set between 0 and 1–3 m from the initial terrace ceiling surface, depending on the point’s position. The two main optimization aims were the best number of sun rays reaching the atria walls and minimization of the sun rays bouncing off the terrace floor surface. A ray-tracing simulation was used for this purpose (Figure 14).
During the analysis of the final results, it was noted that steeper angles of the panels covering the atria were highly efficient when distributing rays along the atrium walls, which were turned away from the side source of light. However, this obstructed the top floors of the evaluated atrium and decreased the incoming illumination level. Consequently, a more uniform option was chosen (Figure 15). This simulation became the basis for further analysis of interior light distribution. Optimized atrium ceiling panels provided sufficient downward redirection of the light rays, yet this illumination level did not affect the daylight level in the adjacent office spaces. Initial data proved that reflective panels set at certain angles within the volume of the atrium could serve as a more efficient light distribution solution. To choose the adequate form, several options were tested based on ray-tracing simulations. These included three types of sidewall reflective panels and a central reflective panel option.
Tilted horizontal panels which bulged towards the atrium’s center at different amplitudes demonstrated the best performance. Also, “bulges” provided additional square meters on the top floors of the evaluated Block. Nevertheless, the results of the light redirection between the atrium’s walls still required improvement. To solve this issue, a central light wall system was implemented. Since the daylight source is only on one side of the building, this system had to be modified. The sidewall reflective panels and the central wall system were tested simultaneously; the proposed solution proved to be very efficient and was chosen as the final interior daylight solution. The chosen panels were set as the starting point for the optimization process (Figure 16).
The main evaluation surface was placed 0.8 m above floor level, as a typical working plane on which most visual tasks are performed. In addition, to make the distribution of rays as uniform as possible, the volume of each block was divided into two zones: A—facing the opening of the terrace and B—turned away from the terrace opening. To open the evaluated surface toward the incoming light, the wall panels in the Z-axis direction were fixed at the surface level (height = 0.8 m). Central panels were given vertical freedom between 0.6 m and 1.5 m. The size of the atrium walls restrained the X-axis dimensions of the central and side panels. The exception was block B, where the placement of the central panels was diagonal and filled the span of the atrium. Limits on the Y-axis vector for the side wall panels movement were defined between 0 and 2.5 m. Multiple data combination analyses led to the final uniform light distribution within the interior of the building. The diagram shown in Figure 17 depicts an example of block A, which is the most shaded. The incoming sun rays were divided between set zones A and B with a ratio of 1.06 to 1. Analogous analysis was performed for each block.
The result on the scale of all three blocks can be observed using a ray-tracing scheme. This illustrates the behavior of incoming sun rays based on a combination of optimized solutions (Figure 18). In addition, to evaluate the outcomes against the official standards, measurements were made for the annual daylight analysis and SDA levels. The simulation reflectance indexes for the surfaces were defined as: interior ceilings—0.9, walls—0.7, floor—0.4, reflective ceiling panels and central atrium panels—0.97, sidewall atrium panels—0.93. According to the planned functions, all blocks were checked for thresholds of 300, 500, and 750 lx. The illumination level for block A from the 2nd to the 6th Floor was estimated to be 300 lx upwards, suitable for easy office work activities. The first two floors of the block were designed as public spaces, so the daylight level regulations in these areas did not apply. However, the illumination level increased by approximately 6% compared to the initial parameters. Block B was divided into two parts: a 300 lx compliant zone (from 7 to 9th floor) and a computer-based work area with 500 lx illumination level (10–14th floors). The best performance was achieved in block C, which fulfilled the highest declared requirement of 750 lx in 75% of its area. The remaining 25% of the area met the threshold of 500 lx, which is sufficient for offices with computer-based work.
The final daylight solution was checked for the possibility of a glare effect. The annual sunlight exposure (ASE) values for each block were also estimated (Figure 18). Complementing the SDA value, it is depicted as a raytracing scheme of the optimized daylight system (Figure 19).
The regulation limit was set at 10%. This value may be modified with the support of various facade configurations. In this case, a WWR of 40% was used for the optimization scheme of the facade panels (Figure 18).
The solution for every facade was analyzed in line with the above assumptions. The outcome was corrected under the foreseen function of each area and the overall architectural and esthetic perception of the facade pattern (Figure 20). Also spatial daylight autonomy (SDA) was analysed for Blocks A-C (Figure 21). The topmost Block D has good daylight parameters from the start, hence it did not undergo SDA.
Initial data for optimized building alternative B are shown in Table 3, except for the variable input data where an additional 45% of the usable area was supported with daylight illumination when compared with the initial simple cuboid. The building was set against a reference building and data according to the Polish regulations published in the Resolution issued by the Minister of Infrastructure and Construction concerning technical conditions that must be fulfilled by the buildings and their location dated 7.06.2019 (Table 4). The total primary requirement for the designed building Alternative B was estimated to be 4,852,680.58 kWh/year and a PE ratio of 400.21 kWh/m2y. The total primary requirement for the reference building was estimated at 5,894,693.48 kWh/year and a PEref ratio of 499.86 kWh/m2y. The reduction in CO2 emissions limited to the area with regulated temperature was estimated and balanced against the reference building data. The emission factor for the designed building was 105.4 kgCO2/m2y, and for the reference building was 151.8 kgCO2/m2y. In comparison to the reference building, the basic design choices used in alternative B allowed for better energy efficiency of 10.12%.

4. Discussion

Integrated design is a method in which all stakeholders are engaged in the design process right from the initial steps of the process. This approach includes interdisciplinary connections between various technical disciplines, allowing the integration of chosen solutions and achieving environmental, economic, and energy efficiencies during the building’s life cycle. The advantages include applying case-best technologies leading to the assumed aims and lower facility costs due to lower energy requirements. Part of the modified design process is optimizing solutions, including life cycle cost analysis (LCA), which will soon become the basic choice. Integrated design is a challenge, as solutions in each technical discipline often contradict each other, and the design management process is also incomplete.
For many years, buildings have been designed following the financing party’s wishes. Presently, the investor will still have a decisive influence, but due to the legal regulations, the designers will be forced to provide buildings that comply with stricter energy standards, and they will have to find a consensus between the building’s form, type of structure used, and energy-efficient technologies. In addition, according to the analyses, the demand for electric energy will grow. In the Stated Policies Scenario, the leading drivers of global electricity demand growth are motors in the industry. Over 30% of the total growth to 2040, space cooling: 17%. Large appliances, small appliances, and electric vehicles: 10% each [40]. Presently, most of the existing solutions are concentrated on applying new technologies, such as photovoltaics or wind farms, more on the introduction of additional equipment in or on the building volumes than on efficient modification of the building’s volumes before application of the technical systems.
There are still some areas that are not well developed. Active and passive daylighting systems are separated from electric lighting systems, and both are characteristically detached from other systems, such as security, communications, and information. Standard transparent facade elements are not technically daylight systems. Often, they do not reflect the design intention or performance characteristics necessary to respond to climatic conditions. Hence, a dynamic and holistic lighting system is often not part of the design data of a standard building. Integrating daylighting systems with electric lighting systems has been an ongoing project for researchers, practitioners, and industries for over 30 years. Successful integration solutions are infrequently implemented and do not have substantial input from the architecture despite the benefit of potential savings, whereas achieved solutions may not fulfill either aesthetic or user expectations.
The basis for further development is already in place. Since the late 1990s, climate-based modeling software has allowed for an approximate daylight distribution in the interiors. This has allowed various spatial and temporal averaging of daylight availability in buildings and the formulation of new daylight criteria such as daylight coefficient (DC) and useful daylight illuminance. These models provide adequate support for initiating an alternative approach to the massing process of a building. This approach is already visible in some small-and-medium-sized experimental buildings, which were later monitored and studied. Economics usually prevents high-rise buildings from becoming model developments, making daylight analysis conducted at different levels of design even more important. When designing, emphasis is placed on the construction process and maintenance costs. However, more attention should be paid to the energy efficiency starting from the initial building volume, which, even at the concept level, should be an outcome of an interdisciplinary design.
In addition to energy efficiency, choosing a particular daylight parameter requires consideration of two practical aspects: type resources available for implementation and user satisfaction. The daylighting design of the building should be aligned with other design activities during concept design. If the approach is approximate, the targeted energy and daylight performances will not reveal the true capacity of the site, and possible mistakes will be difficult to correct during the detailed building design phase. Despite affordable daylight simulation tools and a satisfactory accuracy between the simulated and measured daylight levels in buildings, comprehensive studies on actual daylight levels in existing buildings are rare and even rarer when it comes to a new design process. Most of the available studies are performed on representative models of rooms or buildings, and this approach has certain limitations where the chosen parameters are concerned.
Lowering the electricity needs either through a better standard of lighting equipment or an alternative approach to daylight initiated in the early phases of the design process is an area for further development. These solutions are especially important because expensive high-rise buildings are often located in dense urban hubs with high energy requirements and low access to daylight. One of the possible choices is the implementation of atriums to allow a higher level of incoming natural light, also improving the users’ visual comfort, welfare, and comfort. In addition, as an architectonic element, atriums can act as a transition space, favoring communal activities among the occupants while providing an esthetic spatial quality. To correctly design an atrium that will enhance the use of daylight, it is necessary to identify the design variables that have a major impact on the building’s form, which should be part of an integrated design solution daylight and should not be omitted as a potential source of energy that could be coupled with electricity.

5. Conclusions

The current challenges in energy demand and environmental crises confirm that improving building standards is a growing requirement. There are various choices to improve the energy efficiency of buildings, and it is important not to omit the useful daylight parameters in building performance optimization studies. Therefore, the method proposed in this paper is a voice in ongoing research, providing a possible alternative approach. Because the quantity and variety of buildings are unlimited, any improvement in the building sector involving efficient energy parameters should be of great value.
The proposed approach is innovative as it establishes daylight as the leading design parameter, which supports the optimization of the massing choices and allows for daylight-sensitive working areas. Integrated design is at the heart of this solution, and an interdisciplinary team should work together from the initial steps of design in order to develop a building where efficient energy and lower carbon emissions also play a vital role.
The analysis proved that one of the advantages of using daylight parameters as the leading design factor was that approximately 40% more of the total building area received access to daylight compared to a traditionally shaped volume. Additionally, total primary requirement, PE ratio, and CO2 emission factors were lower in both proposed alternatives when compared to a reference building (Table 5).
Starting from the 19th Floor, optimized volume (Alternative B) fulfills requirements for 750 lux for at least 55% of space for at least half of the year, and starting from the 10th Floor, optimized volume fulfills requirements for 500 lux for at least 55% of space for at least half of the year. This gives the financing stakeholder a lease option for a wider variety of functions and has economic implications.
The calculations proved that a high-rise building designed according to existing building regulations and using standard energy-saving solutions might require approximately 8% lesser total energy compared to the official regional reference building. In the case of an alternative design approach, where daylight was the initial design parameter, the total energy requirements were lowered by approximately 10%. The difference calculated between alternatives A and B is marginal and may be accounted for by the calculation error. Outside daylighting, all other parameters assumed for the analysis were constant; therefore, lower energy demand lowers the requirements for electric lighting systems.
The importance of this research lies in the presented approach to daylighting design of high-rise buildings and the proposed procedure. The final solutions, regarding the form of the building, and used massing, will depend on the specific characteristics of the site, including geographical location, existing urban density, and other building volumes.
The advantages of this method are that it can be used already during the initial concept phase and the outcomes can be modified on various levels of design development. There are also some disadvantages. The modeling methodology should be connected with a Break Even Analysis (BEP), setting off the potential costs of construction against lower facility costs and an evidently smaller Net Floor Area (NFA), giving the investor a chance to halt the development. Another disadvantage is that the method relies on the accuracy of the software programs and the correctness of established initial local data.
Another conclusion is that daylight approaches and methodologies differ in various countries. In some regions, borrowed light is not acceptable within daylighting studies—Poland is one such case. With the development of compact city solutions, urban areas will soon become more densely developed, and there is a need for a new design approach and alternative methodologies. Either the buildings will be built without acceptable access to daylight, or a new strategy will have to be formulated. The EU EN 17037 Daylight in Buildings standard appears to be a move in the right direction if its contents are employed by European designers.

Author Contributions

E.R.: conceptualization; validation; formal analysis; writing—review and editing; supervision. M.Y.: methodology, software, investigation, data curation, visualization. All authors have read and agreed to the published version of the manuscript.

Funding

This research received no external funding.

Institutional Review Board Statement

Not applicable.

Informed Consent Statement

Not applicable.

Data Availability Statement

The study did not report any data.

Conflicts of Interest

The authors declare no conflict of interest.

References

  1. Boubekri, M. Daylighting, Architecture and Health; Taylor & Francis: Abingdon, UK, 2008; pp. 25–159. [Google Scholar]
  2. Morgan, H.M.; Warren, L.H. Vitruvius. The Ten Books On Architecture; Harvard University Press: Cambridge, UK, 1914; pp. 173–190. [Google Scholar]
  3. Edward, L.; Torcellini, P. A Literature Review of the Effects of Natural Light on Building Occupants. National Renewable Energy Laboratory, July 2002 ï NREL/TP-550-30769. Prepared under Task No. BEC2.4002. Available online: http://www.osti.gov/bridge (accessed on 4 December 2021).
  4. Knoop, M.; Stefani, O.; Bueno, B.; Matusiak, B.; Hobday, R.; Wirz-Justice, A.; Martiny, K.; Kantermann, T.; Aarts, M.P.J.; Zemmouri, N.; et al. Daylight: What makes the difference? Lighting Res. Technol. 2019, 52, 423–442. [Google Scholar] [CrossRef] [Green Version]
  5. Münch, M.; Wirz-Justice, A.; Brown, S.; Kantermann, T.; Martiny, K.; Stefani, O.; Vetter, C.; Wright, K.; Wulff, K.; Skene, D. The Role of Daylight for Humans: Gaps in Current Knowledge. Clocks Sleep 2020, 2, 61–85. [Google Scholar] [CrossRef] [PubMed] [Green Version]
  6. Franta, G.; Anstead, K. “Daylighting Offers Great Opportunities,” Window & Door Specifier-Design Lab. Am. J. Civ. Eng. Archit. 2018, 6, 168–171. [Google Scholar] [CrossRef] [Green Version]
  7. Hygge, S.; Löfberg, H.A. Post Occupancy Evaluation of Daylight in Buildings. A Report of IEA SHC TASK 21 /ECBCS ANNEX International Energy Agency, Sweden. 1999. Available online: https://task21.iea-shc.org/Data/Sites/1/publications/Task21POE.pdf (accessed on 4 December 2021).
  8. Dantzig, G.B.; Saaty, T.L. Compact City: A Plam for a Livable Urban Environment; W.H. Freeman and Co.: San Francisco, CA, USA, 1973. [Google Scholar]
  9. Bibriab, S.E.; Krogstiec, J.; Kärrholmd, M. Compact City Planning and Development: Emerging Practices and Strategies for Achieving the goals of Sustainability. Built Environ. 2020, 4, 100021. [Google Scholar] [CrossRef]
  10. OECD. Compact City Policies: A Comparative Assessment, OECD Green Growth Studies; OECD Publishing: Paris, France, 2012. [Google Scholar] [CrossRef]
  11. Strømann-Andersen, J.; Sattrup, P. The urban canyon and building energy use: Urban density versus daylight and passive solar gains. Energy Build. 2011, 43, 2011–2020. [Google Scholar] [CrossRef]
  12. Arundel, R.; Ronald, R. The role of urban form in sustainability of community: The case of Amsterdam. Environ. Plan. B Urban Anal. City Sci. 2015, 44, 33–53. [Google Scholar] [CrossRef]
  13. OECD Principles on Urban Policy. OECD 2019. Available online: https://www.oecd.org/cfe/Brochure-OECD-Principles-Urban-Policy.pdf (accessed on 4 December 2021).
  14. Gudipudi, R.; Fluschnik, T.; Cantú Ros, A.G.; Walther, C.; Kropp, J.P. City density and CO2 efficiency. Energy Policy 2016, 91, 352–361. [Google Scholar] [CrossRef]
  15. Susa-Páez, A.; Piderit-Moreno, M.B. Geometric Optimization of Atriums with Natural Lighting Potential for Detached High-Rise Buildings. Sustainability 2020, 12, 6651. [Google Scholar] [CrossRef]
  16. Verma, A. The Effect of an Atrium and Building Orientation on The Daylighting and Cooling Load of an Office Building KTH Royal Institute of Technology School of Architecture and the Built Environment. Master Degree Project, Sweden. 2017, Volume 6, pp. 1–69. Available online: http://www.diva-portal.se/smash/get/diva2:1163933/FULLTEXT01.pdf (accessed on 17 December 2020).
  17. Shen, E.; Hu, J.; Patel, M. Energy and visual comfort analysis of lighting and daylight control strategies. Build. Environ. 2014, 78, 155–170. [Google Scholar] [CrossRef]
  18. Plörer, D.; Hammes, S.; Hauer, M.; van Karsbergen, V.; Pfluger, R. Control Strategies for Daylight and Artificial Lighting in Office Buildings—A Bibliometrically Assisted Review. Energies 2021, 14, 3852. [Google Scholar] [CrossRef]
  19. Guidelines Accompanying Regulation (EU) No 874/2012 with Regard to Energy Labelling of Lighting Products and Regulations (EC/EU) No 244/2009, 245/2009 and 244/2012 with Regard Eco-Design Requirements for Lighting Products. European Commission. July 2015. Available online: Chrome-extension://efaidnbmnnnibpcajpcglclefindmkaj/viewer.html?pdfurl=https%3A%2F%2Feceuropa.eu%2Fenergy%2Fsites%2Fdefault%2Ffiles%2Fdocuments%2FImplementation%2520Guide%2520Lighting.pdf&clen=4855904&chunk=true (accessed on 4 December 2021).
  20. Muneer, T.; Knez, M.; Koster, H. Natural light controls and guides in buildings. Energy saving for electrical lighting, reduction of cooling load. Renew. Sustain. Energy Rev. 2015, 41, 1–13. [Google Scholar] [CrossRef]
  21. Du, J.; Sharples, S. Assessing and predicting average daylight factors of adjoining spaces in atrium buildings under overcast sky. Build. Environ. 2011, 46, 2142–2152. Available online: https://www.sciencedirect.com/science/article/abs/pii/S0360132311001223 (accessed on 4 December 2021). [CrossRef]
  22. Katunský, D.; Dolníková, E.; Dolník, B. Daytime Lighting Assessment in Textile Factories Using Connected Windows in Slovakia: A Case Study. Sustainability 2018, 10, 655. [Google Scholar] [CrossRef] [Green Version]
  23. AMA StyleBoca National Building Code, 11th ed.; Building Officials and Code Administrators International: Country Club Hills, IL, USA, 1990.
  24. Boubekri, M.A. Overview of The Current State of Daylight Legislation. J. Hum. Environ. Stud. 2004, 7, 57–63. Available online: https://www.jstage.jst.go.jp/article/jhes/7/2/7_2_57/_article/-char/en (accessed on 4 December 2021). [CrossRef] [Green Version]
  25. Neberich, M.; Opferkuch, F. Standardizing Melanopic Effects of Ocular Light for Ecological Lighting Design of Nonresidential Buildings—An Overview of Current Legislation and Accompanying Scientific Studies. Sustainability 2021, 13, 5131. [Google Scholar] [CrossRef]
  26. BREEAM UK New Construction 2018 Manual, Technical Manual SD5078 BREEAM New Construction 3.0. Available online: https://www.breeam.com/NC2018/content/resources/output/10_pdf/a4_pdf/print/nc_uk_a4_print_mono/nc_uk_a4_print_mono.pdf (accessed on 4 December 2021).
  27. USGBC. LEED 2018. Available online: https://new.usgbc.org/leed (accessed on 11 November 2020).
  28. Akerstream, T.; Brennan, B.B.; Pauls, M. A Client’s Perspective. In The Tall Buildings Reference Book; Parker, D., Wood, A., Eds.; Routledge: New York, NY, USA, 2013. [Google Scholar]
  29. Boyce, P.; Hunter, C.; Howlett, O. The Benefits of Daylight Through Windows; Lighting Research Center, Rensselaer Polytechnic Institute: Troy, NY, USA, 2003; Available online: https://www.lrc.rpi.edu/programs/daylighting/pdf/DaylightBenefits.pdf (accessed on 15 November 2020).
  30. LEED v4 for Building Design and Construction Updated July 25. 2019. Available online: https://www.usgbc.org/sites/default/files/LEED%20v4%20BDC_07.25.19_current.pdf (accessed on 4 December 2021).
  31. Waczynska, M.; Sokol, N.; Martyniuk-Peczek, J. Computational and experimental evaluation of view out according to European Standard EN17037. Build Environ. 2021, 188, 107414. Available online: https://www.sciencedirect.com/science/article/pii/S0360132320307824 (accessed on 4 December 2021). [CrossRef]
  32. Resolution of a Minister of Infrastructure, Dated 12 April 2002 w Sprawie Warunków Technicznych, Jakim Powinny Odpowiadać Budynki i ich Usytuowanie Dz.U.2019.1065 Issued 2019.06.07. Available online: https://architektura.info/prawo/warunki_techniczne_budynki (accessed on 10 September 2020).
  33. ASHRAE 90.1-2019 (I-P) Standard 90.1-2019 (I-P Edition)—Energy Standard for Buildings Except Low-Rise Residential Buildings (ANSI Approved; IES Co-sponsored). STANDARD by ASHRAE. 2019.
  34. Act Dated 20 May 2016 o Efektywności Energetycznej Dz.U.2021.468. Available online: https://isap.sejm.gov.pl/isap.nsf/DocDetails.xsp?id=WDU20160000831 (accessed on 4 December 2021).
  35. New Level of Integrated Techniques for Daylighting Education (NLITED). Available online: https://www.nlited.eu (accessed on 4 December 2021).
  36. Global Solar UV Index. A Practical Guide. World Health Organization 2002. Available online: https://www.who.int/uv/publications/en/UVIGuide.pdf (accessed on 4 December 2021).
  37. PL-EN 17037 Daylight in Buildings Warsaw; Polski Komitet Normalizacyjny: Warsaw, Poland, 2019.
  38. Resolution No XCIV/2410/2014 Warsaw City Council Dated 6 Listopada 2014 r. w Sprawie Uchwalenia Miejscowego Planu Zagospodarowania Przestrzennego rejonu ulicy Towarowej. Available online: http://edziennik.mazowieckie.pl/WDU_W/2014/11574/akt.pdf (accessed on 4 December 2021).
  39. Rynska, E.; Klimowicz, J.; Kowal, S.; Lyzwa, K.; Pierzchalski, M.; Rekosz, W. Smart Energy Solutions as an Indispensable Multi-Criteria Input for a Coherent Urban Planning and Building Design Process—Two Case Studies for Smart Office Buildings in Warsaw Downtown Area. Energies 2020, 13, 3757. [Google Scholar] [CrossRef]
  40. World Energy Outlook 2019, Report Extract Electricity. Available online: https://www.iea.org/reports/world-energy-outlook-2019/electricity (accessed on 4 December 2021).
Figure 1. Radiation analysis of the plot on G59 on an average day.
Sustainability 14 00774 g001
Figure 2. G59 radiation analysis of the urban surroundings.
Sustainability 14 00774 g002
Figure 3. (a)Vertical shading study of S-W facade G59. (b) Vertical shading study of N-W facade G59.
Sustainability 14 00774 g003
Figure 4. The division of G59 into blocks based on daylight level.
Sustainability 14 00774 g004
Figure 5. (a) G59 building. Preliminary position of the terraces. Terraces are located based on an internal atrium concept. (b) G59 building form and position of balconies inside the atriums. (c,d) Wall and ceiling reflective panels located at the backside of the atrium to enhance daylight probability level (preliminary concept).
Sustainability 14 00774 g005
Figure 6. G59 building. Preliminary functional division, based on enhanced daylight levels.
Sustainability 14 00774 g006
Figure 7. Radiation and clear sky analysis results for the months (a) December, (b) March in the G59 building, (c) June, and (d) September in the G59 building.
Sustainability 14 00774 g007
Figure 8. Final placement of the terraces according to the level of radiation and sky map results for the G59 building.
Sustainability 14 00774 g008
Figure 9. Optimization iterations with the North facing corner terrace for block B in G59. (a,b) Iterations of the volume parameter. (c,d) iterations of the radiation parameter.
Sustainability 14 00774 g009
Figure 10. Glare analysis results. Example a terrace in Block A of G59 (a) Diagram presenting hours with direct sunlight on the terrace floor (average day). (b) Diagram presenting the percentage of the terrace floor under direct sunlight operation.
Sustainability 14 00774 g010
Figure 11. Optimization algorithm. A block scheme for the balconies in G59.
Sustainability 14 00774 g011
Figure 12. Optimization iterations for G59. Example of the corner terrace in Block B. (a) Summary area of the balconies: 33 m2, lower level of rays: 7%. (b) Summary area of the balconies: 27 m2, lower level of rays: 4%. (c) Summary area of the balconies: 31 m2, lower level of rays: 5% (chosen).
Sustainability 14 00774 g012
Figure 13. Optimization algorithm of the ceiling’s form in G59.
Sustainability 14 00774 g013
Figure 14. Ray tracing simulation, the effectiveness of the chosen daylight strategy for G59 (a) Initial path of the rays. (b) ceiling implementation results.
Sustainability 14 00774 g014
Figure 15. Optimization iterations of the ceiling’s form in G59. Example of the corner terrace, block B (a) initial number of rays entering the atrium: 202, final number of rays: 531. (b) initial number of rays entering the atrium: 202; final number of rays: 542 (chosen).
Sustainability 14 00774 g015
Figure 16. Optimization algorithm scheme of the sidewall and central atrium’s panels, G59.
Sustainability 14 00774 g016
Figure 17. Optimized central and wall panels, results are shown on the example of Block A. 1–3—side wall reflective panels, 2—central reflective panels.
Sustainability 14 00774 g017
Figure 18. Glare maps with ASE values check for every block in G59.
Sustainability 14 00774 g018
Figure 19. Final results for G59. Ray-tracing scheme including optimized daylight systems.
Sustainability 14 00774 g019
Figure 20. Block scheme for the optimization of the facade panels G59.
Sustainability 14 00774 g020
Figure 21. Final results for G59. SDA results comparison regarding an example of initial and optimized solutions. The topmost Blok D was not optimized due to very good spatial daylight autonomy, remaining diagrams show optimization for Block (AC).
Sustainability 14 00774 g021aSustainability 14 00774 g021b
Table 1. Recommended level of illumination by the type of the executed task in standard BS EN-12464 [25].
ActivityIlluminance (lux)
Simple orientation for short visits50–100
Areas with traffic and corridors—stairways, escalators, and travellators—lifts—storage spaces100
Working areas where visual tasks are only occasionally performed100–150
Coffee break room, technical facilities, ball mill areas, pulp plants, waiting rooms200
Easy office work250–300
General office work, PC work, showrooms, laboratories, kitchens500
Supermarkets, mechanical workshops, normal drawing work750
Table 2. Recommended level of illumination specified in PN-EN 17037 standard [37].
Level of Recommendation for the OpeningTarget Illuminance Et (lux)Fraction of Space for the Target Level
F Plane (%)
Minimum Target Illuminance
Level (lux)
Fraction of Space for the Minimum Target Level
F Plane (%)
Fraction of Daylight Hours
F Time (%)
Minimum300501009550
Medium500503009550
High750505009550
Table 3. Initial design data.
GeneralitiesInitial Design Data
Climatic zone III for Poland according to PN–EN 12831:2006
 
Altitude: 108 m above sea level
 
Level of atmosphere visibility: P = 4
Average Sumer (April–September) external calculated temperature according to PN–EN 12831:2006
-
tz = 32 °C
-
humidity φ = 45%
Average Winter (December–January) external calculated temperature according to PN–EN 12831:2006
-
tz = −20 °C
Average monthly external temperatures from the online weather forecast service of the Institute of Meteorology and Water Management, based on Warsaw data (1981–2020)
Summer season internal temperatures
-
Office areas +24 °C
-
Retail and restaurant areas +26 °C
Winter season internal temperatures according to Polish Building Standards
-
Office areas +21 °C
-
Retail and restaurant areas + 21 °C
-
Entrance hall +21 °C
-
Sanitary areas +20 °C
-
Technical areas +12 °C
-
Staircases +16 °C
-
Underground garages +5 °C
Assumed design parametersNumber of equipment working hours t = 12
Areas assumed for heating, cooling, and ventilation:
-
Offices: 6 m2/person
-
Retail: 5 m2/person
-
Restaurants: 2 m2/person
Fresh air factor:
-
Offices: 36 m3 of fresh air/h/person
-
Retail: 35 m3 of fresh air/h/person
-
Restaurants: 30 m3 of fresh air/h/person
Heat gains
-
Explicit heat gains from a single person:
qj = 71.8 W/person
-
Average office heating gains from the equipment:
30 W/m2
-
Heating gains from artificial lighting:14 W/m2
“U” values for Glass Facades U = 1.0–1.5 W/(m2K); Lt = 60–74%; g = 32–45%
External WallsU = 0.25 W/(m2K)
Roof U = 0.20 W/(m2K)
Slab over an underground parking levelU = 0.25 W/(m2K)
Internal walls
-
Reinforced concrete: U = 2.10 W/(m2K)
-
Light structure: U = 2.70 W/(m2K)
Other assumptions
-
Main heating source—city mains: Q = 1500 kW
-
Main cooling source—ice water aggregates/free-cooling: Q = 2350 kW
Table 4. Characteristic parameters of the designed and reference building.
ParametersUnit Designed BuildingReference Building
External wall U-valueW/m2K0.250.30
Roof U-value W/m2K0.200.25
Slab over underground garage level U-valueW/m2K0.250.45
Window U-valueW/m2K1.21.8
Solar radiation transmission factor (g) 0.350.50
Office lighting system (500 lux)W/m21420
Office equipmentW/m23030
Ventilation unit power in/outkW/(m3s)1.2/1.01.2/1.0
Heating efficiency recovery%7050
Infiltration (inc. air renewal)l/h0.71.0
Table 5. Comparison of the characteristic parameters of the designed and reference building.
ParametersUnit Designed Building Alternative ADesigned Building Alterative BReference Building
Total primary requirementkWh/year4,980,721.984,852,680.585,894,693.48
PE ratiokWh/m2year403.52400.21499.86
Emission factorkgCO2/m2y108.4105.4151.8
Energy efficiency designed v reference buiding%Higher by 9.55Higher by 10.12
Spatial Daylight Autonomy—base 300 lux
- Bloc A—Ground Floor—5th Floor% of area 45.42–61.8039.49–53.94
- Block B—Floor 8–12% of area 64.74–79.9060.26–70.75
- Block C—Floor 16–22% of area 80.26–92.1675.55–81.24
- Block D—23rd Floor and above% of area
Publisher’s Note: MDPI stays neutral with regard to jurisdictional claims in published maps and institutional affiliations.

