Abstract
The spiral tunnel could flexibly design the curvature and slope of the tunnel according to the geological structure, avoiding the adverse effect of complex terrain and topography, and had a strong advantage in engineering applications. Different from ordinary straight linear tunnels, spiral tunnels have a circular trend with obvious curvature and slope, which ensures certain differences between construction ventilation of the two types of tunnels, especially in terms of ventilation air flow field and pollutant diffusion. Relying on the actual spiral tunnel project, this paper studies the diffusion mechanism of ventilation pollutants in spiral tunnel construction. Optimization of the layout of the air duct based on numerical simulation and proposed pulsating ventilation method was performed to improve the ventilation and drainage effect of the tunnel. The time to reach the carbon monoxide concentration after blasting, and the dust concentration during the spraying process, were determined as indicators to measure the ventilation effect during the construction period. The hanging position of the air duct, the distance from the air duct outlet to the palm face, and the air speed were determined as the main factors affecting the ventilation effect. The main factors, the degree of influence and sensitivity of each influencing factor on the index, are studied, and the optimal air duct layout scheme suitable for the site is determined. The scheme can improve the ventilation effect and ventilation quality and provide effective reference for ventilation problems during the construction of other spiral tunnels. Meanwhile, more factors need to be examined to study the impact of pollutants in spiral tunnel construction, and physical models are needed to study the diffusion mechanism of pollutants in a spiral tunnel.
1. Introduction
With the rapid development of expressway industry, tunnel construction technology is increasingly advancing. In recent years, a large number of spiral tunnels have been built in China, which can greatly shorten the distance, and also effectively reduce the slope, of the expressway. However, during the construction of spiral tunnels, ventilation problems are much more difficult than those in general linear tunnels due to some factors, such as curvature and slope [1]. The diffusion of pollutants, such as smoke and dust, would be obstructed a lot more. It is well known that the safety and working environment of tunnel construction are both closely related to the ability of the ventilation system to exhaust pollutants [2,3], and thus spiral tunnels’ ventilation problems urgently need to be solved.
In terms of tunnel ventilation, a large number of ventilation experiments and numerical simulation studies have been carried out. The main purpose of tunnel construction ventilation is to dilute and discharge the pollutants in the tunnel construction area. The ventilation system during tunnel construction included press-in types, extraction types and mixed types [4]. Yang et al. applied tunnel ventilation to the construction of long tunnels, including Huayingshan tunnel and Nibashan tunnel [5,6]. Chen et al. [7] studied the effects of road gradient, vehicle speed, and traffic pressure on CO and NOX emissions during tunnel operation, and the results showed that the average CO and NOX emission factors increased with the increase in road slope. Chang et al. [8] studied the influence of the position of the air duct, the distance between the air duct mouth and the working face, the wind speed in the air duct, and the cross-sectional area of the tunnel on the flow field and the CO concentration distribution in the tunnel space by using the numerical calculation method. Geng et al. [9] studied dust movement law in the mixed ventilation system of a coal roadway by a numerical calculation method. Hu et al. [10] used the CFD-DPM method to study the effect of ventilation speed on the diffusion of dust during tunnel construction. Zhou et al. [11] studied the influence of supercharged air volume, exhaust air flow, and supercharged air duct diameter on the dustproof distance.
For spiral tunnel ventilation, there are already some studies, but these are still at an underdeveloped stage. Li et al. [12] took the method of numerical simulation, based on computation fluid dynamics theory and fire-turbulence numerical simulation theory, establishing a full-scale spiral tunnel model, and applied CFX simulation software (2022R1 version, AEA Technology Group, Oxfordshire, UK) to research full-scale spiral tunnel fires and their ventilation conditions, and the results show the impact of slope on smoke temperature distribution and smoke spread pattern in spiral tunnel fires. He et al. [13] applied large eddy simulation technology to study the numerical simulation of fire smoke flow law in a small radius curved tunnel. Chow et al. [14,15] carried out physical experiments on a scale model and obtained the formula of air velocity and temperature decline when tunnel fires occur under different slopes. Oka et al. [16] studied the flue gas flow characteristics of spiral tunnels with different slopes. In addition, the characteristics of fire smoke flow in curved tunnels, which include velocity, temperature and concentration distributions, are analyzed under different ventilation conditions. In summary, it can be seen that most studies on ventilation problems in spiral or curvilinear tunnels have focused on operational time rather than construction time. The existing studies mainly conduct research on ventilation under fire or other disasters in tunnels; there is little study discussing the big problem of ventilation during tunnel construction. As it is closely related to workers’ safety and health, a reasonable ventilation setting could reduce costs and improve efficiency.
In order to overcome the difficult problem of ventilation in constructing spiral tunnels, this paper tries to find out the law of pollutant diffusion under different conditions of ventilation duct settings in a spiral tunnel, and puts forward a reasonable setting to improve ventilation efficiency and reduce construction costs. In this paper, the combination of an orthogonal test and numerical simulation is used to analyze the airflow and dust behavior under different ventilation systems, and to optimize the most effective ventilation scheme of the spiral tunnel.
2. Orthogonal Experiment and Numerical Simulation Method
Forced ventilation is a common ventilating form in tunnel construction [17], which means the ventilator delivers fresh air to the roadways or tunnels by air ducts and exhausts into polluted air. Some researchers even mentioned that the main factors affecting the ventilation efficiency of the ventilation duct are the diameter of the duct, the distance between the duct and the tunnel face, and the hanging position of the duct [18]. However, there is little research on multi-factor synthesis of them. Considering that orthogonal experiment is a common method for studying multi-factor and multi-level, it was applied in this paper to analyze the multiple factors affecting ventilation efficiency, characterized by the ability to reduce pollutants, and proposed the most reasonable setting of the ventilation duct under the combination factors [19]. A branch of fluid mechanics that uses numerical analysis and data structures to solve and analyze problems that involve fluid flows proved, by lots of research, that it could reflect the regularity very well and was used instead of real experiments at some points [20].
2.1. Orthogonal Experimental Design
In this paper, the study background was based on a spiral tunnel in Honghe Prefecture (Yunnan Province, China) with a section radius of 5.55 m and a height of 7.1 m; the geometrical dimensions are shown in Figure 1a. The spiral tunnel has a radius of curvature of 720 m and a slope of 2.5%, and a 300 m long blind roadway; the plane diagram is shown in Figure 1b, and the three-dimension geometry model is shown in Figure 1c.
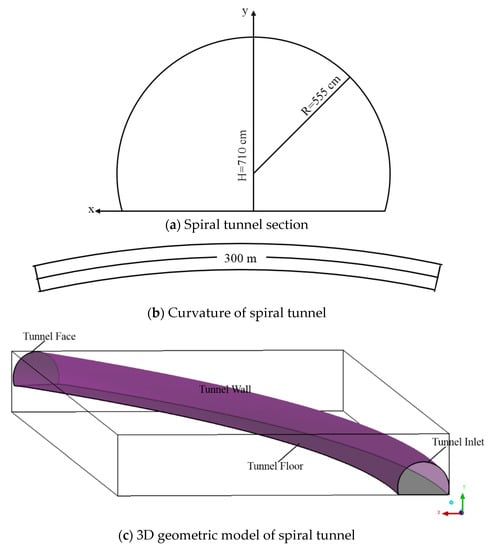
Figure 1.
The spiral tunnel model.
According to previous studies, the diameter of the air duct, the distance between the air duct and the tunnel face, the hanging position of the air duct and some others would affect the ventilation efficiency. However, the actual causes of the air duct diameter affecting the ventilation are the ventilation volume and the ventilation velocity. Therefore, three factors are considered in the orthogonal test, including the hanging position of the air duct, the distance between the air duct and the tunnel face, and the ventilation speed of the air duct.
In linear tunnels, the left and right sides are completely symmetrical because of the linear type, so the hanging position of the ventilation duct is generally located at the vault, haunch, and arch bottom in a vertical direction. For spiral tunnels, the radius of curvature of the left and right sides differs by the tunnel’s width, then the hanging position of the ventilation duct in the spiral tunnel could be located at vertical and horizontal directions. Then, in this experiment, the hanging position (Factor A) listed five levels as vault, left haunch, right haunch, left arch bottom and right arch bottom (Figure 2). The distance between the ventilation duct and the tunnel face (Factor B) was between 5~25 m according to relevant regulations and construction experience, then the five levels of distance were listed as: 10 m, 15 m, 20 m, 25 m and 30 m. The ventilation velocity was decided by the need of ventilation volume of the 300-m long blind roadway. After calculating, the ventilation volume was between 1970~2930 m³/min, which meant the ventilation velocity of the duct (D = 1.5 m) was between 18.59~27.65 m/s, listed with gradient as: 18.59 m/s, 20.85 m/s, 23.12 m/s, 25.39 m/s and 27.65 m/s. The factors and levels of the orthogonal experiment are listed in Table 1.
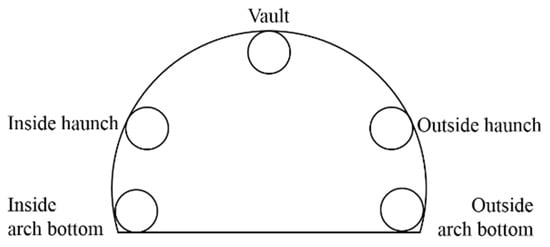
Figure 2.
Five kinds of hanging positions around the spiral tunnel face.

Table 1.
Factors and levels of the orthogonal experiment.
After determining the factors and levels of the orthogonal test, the orthogonal scheme of 3 factors at 5 levels was designed, as shown in Table 2. Then, the numerical simulation experiment was carried out according to the orthogonal experimental scheme.

Table 2.
Orthogonal experiment scheme.
2.2. Numerical Simulation
To find out the most reasonable setting of a ventilation duct, 25 different model experiments were carried out. Three construction stages: blasting, tunnel mucking, and gunite lining were investigated. The results were investigated in four categories: (1) carbon monoxide (CO) concentration in tunnel after blasting; (2) dust concentration in tunnel after blasting; (3) concentration of harmful gases, mainly nitrogen dioxide (NO2), from diesel engines during tunnel mucking; and (4) dust concentration in the tunnel during gunite lining.
The geometric modeling was performed on the basis of the actual size of the based tunnel. Take the tunnel outlet as x–y plane and the direction perpendicular to the tunnel outlet as z-axis, then the geometric model is shown in Figure 2. The geometric model was meshed by unstructured tetrahedral meshing method with the CFD (2022R2 version, D. B. Spalding, London, UK), and the whole model was divided into 603,430 grid cells with quite good mesh quality.
2.2.1. Assumed Conditions
Before calculating the model, some assumptions were required to properly simplify the calculation:
- Considering that the ventilation airflow in the tunnel or air duct was at low speed, this took the air as incompressible fluid.
- The low speed airflow was turbulent at a steady stage. Then, standard k-ε model, which was widely applied as viscous model, was used during computation.
- The tunnel wall could not transfer energy; the fluid field was at a constant temperature. There was no chemical reaction during the diffusion movement.
- During tunnel mucking, most of the harmful gases generated by engines were nitrogen oxides; carbon oxides were minimal, and 90% of nitrogen oxides were nitric oxide [21]. Therefore, the nitric oxide (NO) was selected as the harmful gas during the tunnel slagging.
- The dust, carbon monoxide (CO) and nitrogen dioxide (NO2) involved in the simulation process were all generated during the construction process. The air content under initial conditions was 21% oxygen and 79% nitrogen.
2.2.2. Turbulence Model
Turbulence model is a key component to represent flow behavior in ventilation systems [22]. The software of CFD supports multiple turbulence models for calculations, such as Spalart–Allmaras, K-epsilon, and K-omega. To select an appropriate turbulence model, a comparison of flow behavior between various turbulence models with the experimental data by Parra et al. [23] was conducted. In that study, the details of numerical validation for various turbulence models with experimental data showed that the K-epsilon model gives a pretty reasonable prediction with R2 between the CFD model and experimental data of 0.96. The most widely used model in the engineering field, the K-epsilon model, was chosen for computation.
It is established based on the relationship between Reynolds stress and average velocity gradient. In actual analysis and calculation, the standard model is used the most, where is the kinetic energy and is the kinetic energy dissipation rate. The solution formula of turbulent kinetic energy dissipation rate is as follows:
Turbulent viscosity can be expressed by and :
where is an empirical constant, which is obtained through a large number of previous experiments.
Therefore, the transport equation of a standard model can be written as:
where represents the generation term of turbulent kinetic energy caused by the average velocity gradient, ; represents the generation term of turbulent kinetic energy caused by buoyancy; , , is an empirical constant; is the Prandtl number corresponding to the turbulent kinetic energy; is the Prandtl number corresponding to the energy dissipation rate of turbulent flow; represents thermal expansion coefficient; represents turbulence Mach number.
2.2.3. Initial Conditions
- When studying carbon monoxide (CO) concentration after blasting, assuming that the carbon monoxide gas was instantaneously filled and evenly distributed within a distance after the tunnel face at one concentration, this distance was called smoke casting distance. The CO mass fraction within the smoke casting distance was calculated by:where C is the CO mass fraction; the mG is the weight of explosive for one blast, given as 240.9 kg; the b is volume of harmful gas produced by 1 kg explosive blasting, given as 0.04 m³/kg; the L is smoke casting distance, given by 15 + mG/5 as 63.18 m after calculation; the S is square of tunnel excavation, given as 65.60 m². Then, the CO mass fraction was 0.00224. Species Transport model was applied to compute how to transport CO around the tunnel airflow.
- The main source of dust diffusion in this study is the gunite lining. The largest dust comes from spraying to the roof, which rebounds into the tunnel space, and continuously spreads out of the tunnel with the wind flow. During this period, settlement may occur. In this research, it is assumed that the dust settles After reaching the ground, dust was caught and stopped flying in the air. Using a discrete phase model (DPM) to compute dust particles transportation, the velocity of rebounded dust was around 60 m/s; the mass flow was 0.06 kg/s. The dust pollution source was a 3-m width range on the tunnel wall, shown in Figure 3.
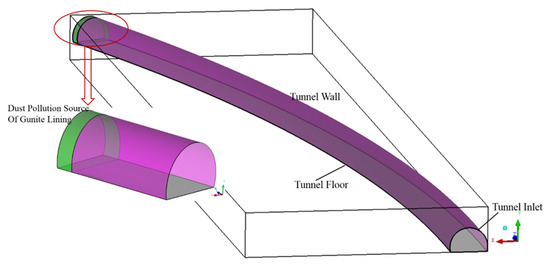
Figure 3.
Schematic Diagram of dust pollution source.
Dust diffusion uses the SIMPLE algorithm to calculate the two-phase flow field, and the pressure dispersion was used in the Standard format. The inlet is the air duct inlet, the boundary condition was set to velocity-inlet, the wind speed was 12.18 m/s, the outlet was the tunnel opening, and the boundary condition adopted the pressure-out boundary. Using the two-phase flow model in the discrete phase model, setting the dust source term, the mass flow rate of dust particles was 0.06 kg/m3, and the particle size distribution was measured during shotcreting operations at the tunnel site. The particle size of the dust particles floating in the air was roughly distributed between 0~200 μm. The parameters of discrete phase model calculation are listed in Table 3. The parameters of dust source of DPM calculation are listed in Table 4.

Table 3.
Parameters of discrete phase model.

Table 4.
Parameters of dust source in DPM calculation.
- 3.
- For the based tunnel in this research, the total power of diesel engines during tunnel mucking was 402.9 KW. However, considering nitric oxide would be oxidized, the gas source would be set to release nitrogen dioxide directly. Converting the mass flow of NO into NO2, the total mass flow of NO2 from gas sources was 0.00035 kg/s. Assuming there were three NO2 gas sources (excavator, tipper, and spraying machine), the schematic diagram is shown in Figure 4.
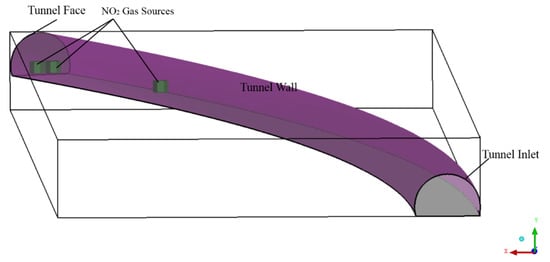
Figure 4.
Schematic diagram of NO2 gas sources locations.
2.2.4. Boundary Conditions
The ventilation duct nozzle was set as the velocity inlet boundary, and the airflow was fresh air with evenly distributed velocity. Tunnel outlet was the outlet boundary, set as pressure outlet. The tunnel wall, tunnel floor, ventilation duct wall and others were set as fixed wall surfaces and no slip boundary conditions; further, all walls were considered adiabatic and isothermal.
3. Results
3.1. Carbon Monoxide Concentration in Tunnel after Blasting
Blasting carbon monoxide transported from the zone of smoke cast distance to the tunnel outlet with ventilation airflow. Chinese national standard of carbon monoxide concentration during tunnel construction is less than 0.0024%, or no more than 30 mg/m3 after 30 min. The time required for carbon monoxide concentration in the spiral tunnel to reach the regulations is listed in Table 5.

Table 5.
Time required for carbon monoxide concentration to reach the regulations after blasting.
The results of variance analysis are shown in Table 6.

Table 6.
Analysis of variance of dilution CO concentration factors.
According to the F distribution table in mathematical statistics, the hanging position and speed of the air duct had a significant impact, while the distance between the air duct and the tunnel face had no significant impact on the carbon monoxide concentration in the dilution tunnel.
In order to find the order of influence on the degree of carbon monoxide concentration, the range analysis of various factors of CO concentration is shown in Figure 5.
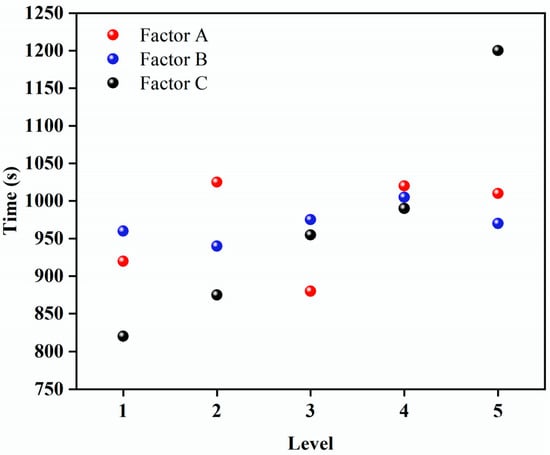
Figure 5.
Range analysis of various factors on diluting CO concentration after blasting.
As can be seen from Figure 5, the influence of ventilation speed is the biggest. When the ventilation speed is 27.65 m/s, the ventilation efficiency is the highest. Hanging position of the ventilation duct would significantly affect the time required. When the ventilation duct is located at right haunch, the time required was shortest. The distance between the ventilation duct and the tunnel face has little effect on the CO concentration in the dilution tunnel, but the distance of 10 m is better than the other distances. The degree of effects of the factors is: Factor C > Factor A > Factor B. Therefore, based on the investigation of the CO concentration after the tunnel blasting and the field construction experience, the optimal ventilation duct is set as follows: the air duct is located at the right arch haunch, the ventilation speed is 27.65 m/s, and the distance between the ventilation duct and the tunnel surface should be 15~25 m.
3.2. Dust Concentration in Tunnel during Gunite Lining
In the process of gunite lining, dust would be produced constantly due to concrete pulp sprayed on the tunnel wall. The simulation results showed the concentration of dust would exceed the limit. The dust concentration under steady state is listed in Table 7, and the variance analysis is shown in Table 8.

Table 7.
Concentration of dust at steady stage during gunite lining.

Table 8.
Variance analysis on concentration of dust at steady stage during gunite lining.
The range analysis result is graphically presented in Figure 6. The degree of effects of the factors was: Factor C > Factor A > Factor B.
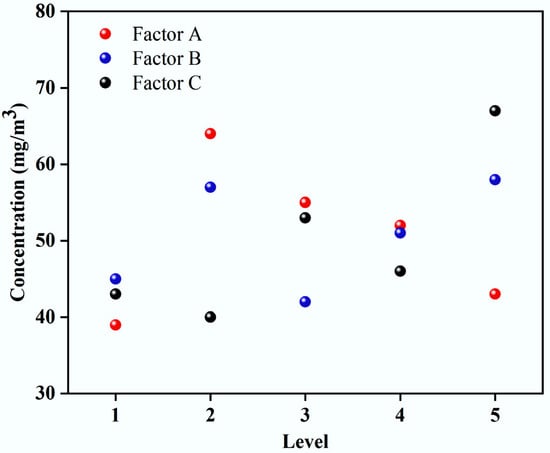
Figure 6.
Range of dust concentration of shotcrete after stabilization.
According to the size of R, it can be judged that the importance of the factors affecting the concentration of sprayed dust at the height of human breathing after stabilization is as follows: air supply wind speed of the air duct > hanging position of the air duct > distance from the air duct to the face of the face. The order of influencing factors of carbon monoxide concentration and dust concentration was the same. It can be seen from the distance distribution diagram that the wind speed had the greatest impact on the dust concentration in the tunnel. The second is the hanging position of the air duct, which also has a more obvious tendency to the spread of sprayed dust. The distance from the air duct outlet to the face also had a great influence on the dust concentration.
The wind speed at the outlet of the wind tube was level 2 (wind speed 25.39 m/s). The sprayed dust concentration was the lowest at the height of human breathing in the tunnel, and the dust removal effect was the best; the wind tube hanging position was the factor for the wind tube located on the vault. At the outer arch of the midline, the sprayed dust concentration was the lowest at the height of human breathing in the tunnel, and the dust concentration was highest at the inner arch waist of the midline, and the dust concentration at the outer arch waist was moderate. The internal dust concentration was the lowest and the dust removal effect was the best.
Taking significant level as α = 0.05, the significance levels of various factors were αA = 0.699 > 0.05, αB = 0.483 > 0.05 and αC = 0.743 > 0.05. The results showed that the hanging position of the air duct, the distance from the air duct outlet to the tunnel face and the air supply speed of the air duct were not significant factors affecting the dust concentration in the tunnel. The reason is that the dust is a particle flow, which is less affected by the wind flow structure than gas, and the particle flow diffusion is difficult to control; large particles are easy to settle, and small particles spread around in the wind and become suspended in the air. The influencing factors were complex; too large or too small wind speed was not conducive to dust settling. If the wind speed was too high, the dust will be raised by the wind. It was judged that the greater the wind speed, the more likely the diffusion will occur. Therefore, three factors—the hanging position of the air duct, the distance from the air duct to the face of the face, and the wind speed at the outlet of the air duct—had a significant effect on the diffusion of carbon monoxide gas after blasting, but no significant influence on the diffusion of dust had been found.
4. Spiral Tunnel Ventilation System Optimization
According to the extreme value difference analysis and variance analysis of the orthogonal test of carbon monoxide concentration and dust concentration, the following conclusions can be drawn.
The influencing factors of carbon monoxide concentration and dust concentration are the air supply wind speed of the air tube, the hanging position of the air tube, and the distance from the air tube to the face of the face.
In the analysis of variance, for the carbon monoxide concentration in the tunnel after blasting to drop to the standard time, the hanging position of the air duct and the air supply wind speed of the air duct have a significant impact; the air supply wind speed of the air duct has a greater influence, while the air duct reaches the face of the tunnel. The distance from the air duct outlet to the face had no significant effect on the time when the concentration of carbon monoxide in the tunnel dropped to the standard. For the dust concentration at the height of human breathing during the spraying process, the air supply wind speed, the hanging position of the air tube, and the distance from the air tube to the face of the tunnel are not affected.
Combining several analysis methods, we should focus on the indicator of the carbon monoxide concentration in the tunnel reaching the standard after blasting to determine the best air duct layout. According to the calculation results, the optimal air duct layout is A3B2C1, that is, the air duct is suspended at the arch waist outside the midline, the distance between the air duct and the tunnel face is about 15 m, and the wind speed is 27.65 m/s. However, the increase in wind speed makes the dust in the tunnel serious, which is not conducive to the dust settling during the shotcreting process. It also means that the air volume increases, and the energy consumption and investment increase accordingly. The on-site construction still needs to take into account the economy and the dust. The factor of wind speed is appropriately selected and adjusted, and it was not the case that the higher the wind speed, the better.
Therefore, the recommended layout of the air duct used on site is as follows: the air duct is suspended from the center line outside the waist, the air duct is about 15–20 m away from the tunnel face, and the wind speed is about 23–25 m/s to achieve the best ventilation effect.
5. Enlightenment of Current Research Work
In this paper, the effects of the hanging position of the air duct, the distance from the air duct to the face, and the air supply speed of the air duct on the CO concentration and dust concentration in the spiral tunnel were studied. Then, the ventilation scheme of the spiral tunnel construction is optimized. The above research results can promote the mastery of the distribution law of the wind flow field, CO concentration and dust concentration in the spiral tunnel. Meanwhile, the results can find the order of influencing factors on CO concentration and dust concentration in spiral tunnel. We can propose reasonable ventilation methods or related technologies to improve the ventilation effect and improve the ventilation quality and provide effective reference for ventilation problems during the construction of other spiral tunnels.
In this study, the influence of the hanging position of the air duct, the distance from the air outlet of the air duct to the face and the air supply speed of the air duct on the pollutants in the tunnel construction were studied. However, the curvature of the spiral tunnel in this paper is fixed, thus the relationship between the ventilation effect and the curvature should be studied in the future. Meanwhile, the influence of the hanging position of the air duct, the distance from the air outlet of the air duct to the face and the air supply speed of the air duct on the pollutants in the tunnel construction were studied. However, there are few studies on the influence of mechanical equipment in the tunnel on the wind flow. Therefore, it is necessary to carry out research on the influence of multiple factors on pollutants in spiral tunnel construction. In addition, the physical model of spiral tunnel needs to be established to verify the effectiveness of numerical simulation.
6. Conclusions
After determining the ventilation quality evaluation indicators and the main influencing factors, each factor was set to five reasonable levels; 25 groups of tests were designed using the orthogonal experiment method, and numerical software was used to simulate calculations. The following main conclusions are drawn:
- For the time required for the concentration of carbon monoxide in the tunnel to drop to the standard after blasting, the distance from the air duct to the tunnel face has no significant effect on it.
- For the dust concentration at the height of human respiration during the spraying process, the three factors of air duct speed, the hanging position of the air duct, and the distance from the air duct to the face have certain influence, but the effect is not significant.
- The optimal ventilation layout calculated is that the air duct is suspended on the outer side of the midline and the air duct is about 15 m away from the tunnel face, and the wind speed is 27.65 m/s. However, considering the economic cost and the problem of dust in the tunnel, the best ventilation scheme recommended for spiral tunnels in the context of this project is for the air duct to be suspended at the outer arch of the center line, the distance between the air duct and the tunnel face to be about 15–20 m, and the wind speed to be around 23–25 m/s.
- The ventilation optimization results of the spiral tunnel can improve the ventilation effect and the ventilation quality and provide a reference for the ventilation problems in the construction of other spiral tunnels. In addition, it is necessary to establish a physical model of a spiral tunnel to study the influence of various factors on pollutants in spiral tunnel construction.
Author Contributions
P.Z.: writing—original draft preparation; J.B.: formal analysis; Z.W.: reviewing and editing; T.C.: reviewing and editing; W.L. and Y.L.: supervision. All authors have read and agreed to the published version of the manuscript.
Funding
Financial support for this research was provided by the National Natural Science Foundation of China (52074048).
Institutional Review Board Statement
Not applicable.
Informed Consent Statement
Not applicable.
Data Availability Statement
The data used to support the findings of this study are included within the article.
Conflicts of Interest
The authors declare no conflict of interest.
References
- Jiang, Y.F.; Yu, J.; Zhou, P. Influence of traffic on the temperature field of tunnel in cold region: A case study on the world’s longest highway spiral tunnel. Undergr. Space 2022, 43, 103–109. [Google Scholar] [CrossRef]
- Shao, S.; Yang, X.G.; Zhou, J.W. Numerical analysis of different ventilation schemes during the construction process of inclined tunnel groups at the Changheba Hydropower Station, China. Tunn. Undergr. Space Technol. 2016, 59, 157–169. [Google Scholar] [CrossRef]
- Li, Q.; Chen, C.; Deng, Y.W.; Li, J.M. Influence of traffic force on pollutant dispersion of CO, NO and particle matter (PM2.5) measured in an urban tunnel in Changsha, China. Tunn. Undergr. Space Technol. 2015, 49, 400–407. [Google Scholar] [CrossRef]
- Gary, B. Hemphill. In Practical Tunnel Construction; John Wiley & Sons: Hoboken, NJ, USA, 2013. [Google Scholar]
- Fang, Y.; Fan, J.; Kenneally, B. Air flow behavior and gas dispersion in the recirculation ventilation system of a twin-tunnel construction. Tunn. Undergr. Space Technol. 2016, 58, 30–39. [Google Scholar] [CrossRef]
- Rong, L.; Liang, W.; Song, R.; Zhang, Z. Research on Ventilation Layout in Jet-Flow Gallery Ventilation System in a Twin-Tunnel Construction. In Proceedings of the 11th International Mine Ventilation Congress; Springer: Singapore, 2019; pp. 42–48. [Google Scholar]
- Deng, Y.W.; Chen, C.; Li, Q. Measurements of real-world vehicle CO and NOx fleet average emissions in urban tunnels of two cities in China. Atmos. Environ. 2015, 122, 417–426. [Google Scholar] [CrossRef]
- Chang, X.; Chai, J.; Luo, J. Tunnel ventilation during construction and diffusion of hazardous gases studied by numerical simulations. Build. Environ. 2020, 177, 106902. [Google Scholar] [CrossRef]
- Geng, F.; Luo, G.; Zhou, F.B.; Zhao, P.T. Numerical investigation of dust dispersion in a coal roadway with hybrid ventilation system. Powder Technol. 2017, 313, 260–271. [Google Scholar] [CrossRef]
- Hu, S.; Qi, L. Influences of ventilation velocity on dust dispersion in coal roadways. Powder Technol. 2020, 360, 683–694. [Google Scholar] [CrossRef]
- Zhou, W.; Wen, N.; Liu, X. Optimization of dust removal performance of ventilation system in tunnel constructed using shield tunneling machine. Build. Environ. 2020, 173, 106745. [Google Scholar] [CrossRef]
- Tao, L.; Wei, X. Numerical Simulation Study on Impact of Slope on Smoke Temperature Distribution and Smoke Spread Pattern in Spiral Tunnel Fires. AIP Conf. Proc. 2017, 1834, 40036. [Google Scholar]
- He, J. Numerical Simulation Research on Fire Accident Ventilation of Tunnel with Small Radius Curve. Ph.D. Thesis, Central South University, Changsha, China, 2008. [Google Scholar]
- Chow, W.K.; Gao, Y.; Zhao, J.H. Smoke Movement in Tilted Tunnel Fires with Longitudinal Ventilation. Fire Saf. J. 2015, 75, 14–22. [Google Scholar] [CrossRef]
- Chow, N.; Chow, W.K.; Gao, Y. A Study on Tilted Tunnel Fire Under Natural Ventilation. Fire Saf. J. 2016, 81, 44–57. [Google Scholar] [CrossRef]
- Oka, Y.; Imazeki, O. Temperature Distribution within a Ceiling Jet Propagating in an Inclined Flat-Ceilinged Tunnel with Natural Ventilation. Fire Saf. J. 2015, 71, 20–33. [Google Scholar] [CrossRef]
- Zhao, Z.C. Research on Construction Ventilation Technology of Highway Tunnel Pipe Press. Ph.D. Thesis, Southwest Jiaotong University, Chengdu, China, 2013. [Google Scholar]
- Wang, X. Analysis of dust concentration influence factor in coal roadway driving. J. Saf. Sci. Technol. 2011, 7, 75–79. [Google Scholar]
- Šekularac, M. Experimental Determination of Tunnel Ventilation Axial Ducted Fan Performance. Therm. Sci. 2016, 20, 209–221. [Google Scholar] [CrossRef]
- Ma, Z.L.; Shao, C.F.; Zhang, S.R. Characteristics of traffic accidents in Chinese freeway tunnels. Tunn. Undergr. Space Technol. 2009, 24, 350–355. [Google Scholar] [CrossRef]
- Fang, P.; Chen, X.; Tang, Z.; Huang, J. Current research status on air pollutant emission characteristics and control technology of marine diesel engine. Chem. Ind. Eng. Prog. 2017, 3, 1067–1076. [Google Scholar]
- Matsuura, K.; Kanayama, H.; Tsukikawa, H. Numerical Simulation of Leaking Hydrogen Dispersion Behavior in A Partially Open Space. Int. J. Hydrogen Energy 2008, 33, 240–247. [Google Scholar] [CrossRef]
- Parra, M.T.; Villafruela, J.M.; Castro, F. Numerical and experimental analysis of different ventilation systems in deep mines. Build. Environ. 2006, 41, 87–93. [Google Scholar] [CrossRef]
Publisher’s Note: MDPI stays neutral with regard to jurisdictional claims in published maps and institutional affiliations. |
© 2022 by the authors. Licensee MDPI, Basel, Switzerland. This article is an open access article distributed under the terms and conditions of the Creative Commons Attribution (CC BY) license (https://creativecommons.org/licenses/by/4.0/).