Article

Investigation of Urban Design Approaches in Renewal Areas with Hybrid Decision Model

by
Merve Koçak Güngör
1,*,
Bülent Bostancı
2,
Neşe Yılmaz Bakır
1 and
Umut Doğan
1
1
Department of Urban & Regional Planning, Erciyes University, 38280 Kayseri, Turkey
2
Department of Geomatics, Erciyes University, 38280 Kayseri, Turkey
*
Author to whom correspondence should be addressed.
Sustainability 2022, 14(17), 10543; https://doi.org/10.3390/su141710543
Submission received: 16 June 2022 / Revised: 20 August 2022 / Accepted: 22 August 2022 / Published: 24 August 2022
(This article belongs to the Special Issue Shaping towards Sustainability in Architecture and Civil Engineering)

Abstract

:
Generally, urban renewal practices in developing countries are formed by economic concerns and by ignoring the design dimension. As a result, these conditions create unqualified urban spaces in terms of livability. In this study, to analyze and evaluate this problem, a criterion framework and a hybrid spatial decision model are formed for improving the design quality of renewal projects. The authors defined 37 urban design criteria through literature research, expert opinions, and self-assessments. A multidisciplinary focus group was held and a paired comparison form was prepared to determine the criterion weights and suitability values with the used the fuzzy DEMATEL and weighted linear combination method. The values analyzed using ArcGIS 10.2 and the suitability values are shown on the map. As a result, it has been determined that even the highest valued among the examined renewal projects could not meet even 50% of the defined urban design quality standard. The results have emphasized that the urban renewal projects without area-specific and appropriate design solutions reveal that they cannot develop qualified places. Within the scope of realizing more qualified urban places, design criteria should also be taken into account in the project design processes. In future studies, this model can be used in determining the area-specific and appropriate design solution for spatial decision-makers.

1. Introduction

Urban renewal had become an ensemble of physical, socio-cultural, and economic interventions because of the collapse of the inner urban areas during the urbanism process. In this process, “developing urban areas able to respond better to the changing conditions of the time” had become one of the main aims of urban renewal [1]. Improving the conditions of slums by developing livable housing sites is among the most common applications of the urban renewal processes. According to the literature, a successful renewal application, together with the renovation of the building stock, should also have the ability to solve social, economic, and physical spatial problems related to the sites [2,3,4]. However, urban renewal projects are often criticized because of the predominance of economic concerns rather than the social, spatial problems [5]. On the other hand, the discipline of urban design, beyond being merely “a tool for creating a beautiful city”, has become a tool that can provide solutions to urban problems. With this aspect, it is thought that more qualified urban environments can be created with the application of the urban design approach to urban renewal projects [6,7].
Urban design constitutes an important part of the urban renewal process [3,8,9]. An urban design project is partly a plan and partly a project; it is an aesthetic and legal tool in the process that defines the public–urban space structure. Moreover, the enhancement of life quality by improving urban spaces and creating aesthetic urban spaces that will facilitate the needs of users are among the main objectives of urban design [10]. The rehabilitation and renewal of collapsed and dysfunctional urban areas will be possible with urban design approaches. In this context, it is inevitable that urban design, which has a direct connection with urban renewal, is one of the main actors in the renewal process. The development of unique design criteria for urban renewal areas is considered a positive process for the success of the project. It is accepted that increasing the quality of life and improving the physical space in line with changing conditions and user preferences in the urban renewal areas discussed in the study is possible with the determination of urban design principles and criteria.
In the literature on design approaches in urban renewal practice, some studies set principles on the realization of sustainable and successful urban renewal projects [9,11,12,13] and developing spatial decision support systems (SDSS) [14,15] for this purpose. A prominent study [11] focuses on developing a systematic decision-making approach aiming to assist the urban renewal project, as well as using a fuzzy set theory combining the PROMETHEE approach in determining the priority of projects. In that study, the scoring was created from the aspect of urban sustainability, whereas the expected revenue was calculated from an economic aspect and there was a subjective scale for social and environmental aspects. Lee and Chan (2008) discussed the urban renewal practices in Hong Kong in terms of a solution to the urban decay problem [12]. From this aspect, they aimed to set reliable and sustainable design principles by employing the analytical hierarchy process (AHP) method. Another study determined the perceptions of the residents of a neighborhood. The study focused on a large-scale urban transformation project in Barcelona. The project’s effect and significance on the “welfare level” have been examined using the concept mapping method [9].
The main agenda of urban studies has been keeping the urban density in balance as a result of the COVID-19 process, horizontal balanced growth instead of vertical structuring [16,17], pedestrian- and bicycle-oriented transportation areas reshaping urban areas [18], the balanced distribution of urban services [19,20], and the increasing need for open public spaces [17]. In this context, expectations for the living conditions of individuals and the quality of their living environments have also changed [19,21,22,23,24,25,26,27,28]. Considering the studies carried out to improve urban living conditions and thus urban renewal and settlements, it is seen that the characteristics and adequacy of urban equipment in urban areas are questioned in terms of design criteria such as connection, comfort, image, use, activity, social life, transportation, and identity [29,30]. There are approaches in which the main objectives of design were limited to physical aspects such as character-identity, continuity and encapsulation, public field quality, ease of movement, adaptability, and diversity [8,31]. It was found that most of the urban renewal projects creating public pedestrian spaces and including more community-based programs had favorable and significant impacts on the residents’ quality of life [13,32,33].
In recent years, economic concerns have become more prominent in Turkish urban renewal practices. Besides, urban renewal projects are mostly improved separate from the urban plan in a fragmented way. Renewal projects and implementations that are generally carried out on a large scale with the need for renewal are seen as construction projects that will benefit the maximum profit per land, rather than a design problem. On the other hand, in developed cities throughout the world, the focus is on reusing urban land, which has been structured in terms of sustainability. In parallel with the increasing importance of urban renewal projects at the local level, the characteristics of the new environment, created via the renewal, have started to be increasingly questioned from various aspects.
When reviewing the related literature, we found that there are many studies about examining project approaches in urban renewal zones in terms of design criteria [9,11,12,14,34,35]. However, we came across no studies which examined the map-based study incorporating a spatial decision-support system. Therefore, this study, differing by the method it employs and the way it examines the subject, fills an important void in the literature.
Therefore, this study focusing on the urban renewal project areas of the Turkish cities, which are shaped by urban plans, evaluates the “design” dimension of these projects. In this study, a hybrid method, which is uncommon in the literature, was utilized. With the results of this study, a foundation of general evaluation has been established regarding the urban design levels of renewal areas. Incomplete and negative conditions affecting the design dimension were re-discussed with the current situation reading and an infrastructure that will guide the city planners and other relevant actors has emerged. In line with this perspective, an evaluation of the 13 project areas that stand out with their planned development and which have the quality of being a sample has been made. The main assumption in the use of a hybrid model in this evaluation process is that, unlike traditional methods, it is fast, versatile, quickly adapted to different areas and can be further developed. At the same time, the visual presentation of the findings (map–schema–table) is also a practical tool for decision-making actors. All the project areas within the scope of the study boundaries have emerged as visualized maps in a way to compare the success levels of design quality with each other. For this reason, this method has been an important step in determining the spatial characteristics of the renewal areas. The obtained results can be used to identify existing problems and propose solutions. The emergence of problematic plans and project approaches can also help to support urban planning decisions aimed at improving design processes.
In the following sections, first, the characteristics of the selected urban renewal projects, data collection and data processing are detailed in the Materials and Methods section. In the Method section, fuzzy DEMATEL and weighted linear combination (WLC), as well as their integration, are explained. In the Application section, the evaluation of urban design approaches in renewal areas was carried out within the scope of the proposed hybrid method. In the Results and Conclusions section, the research findings were evaluated and discussed through the design approaches that have been obtained.

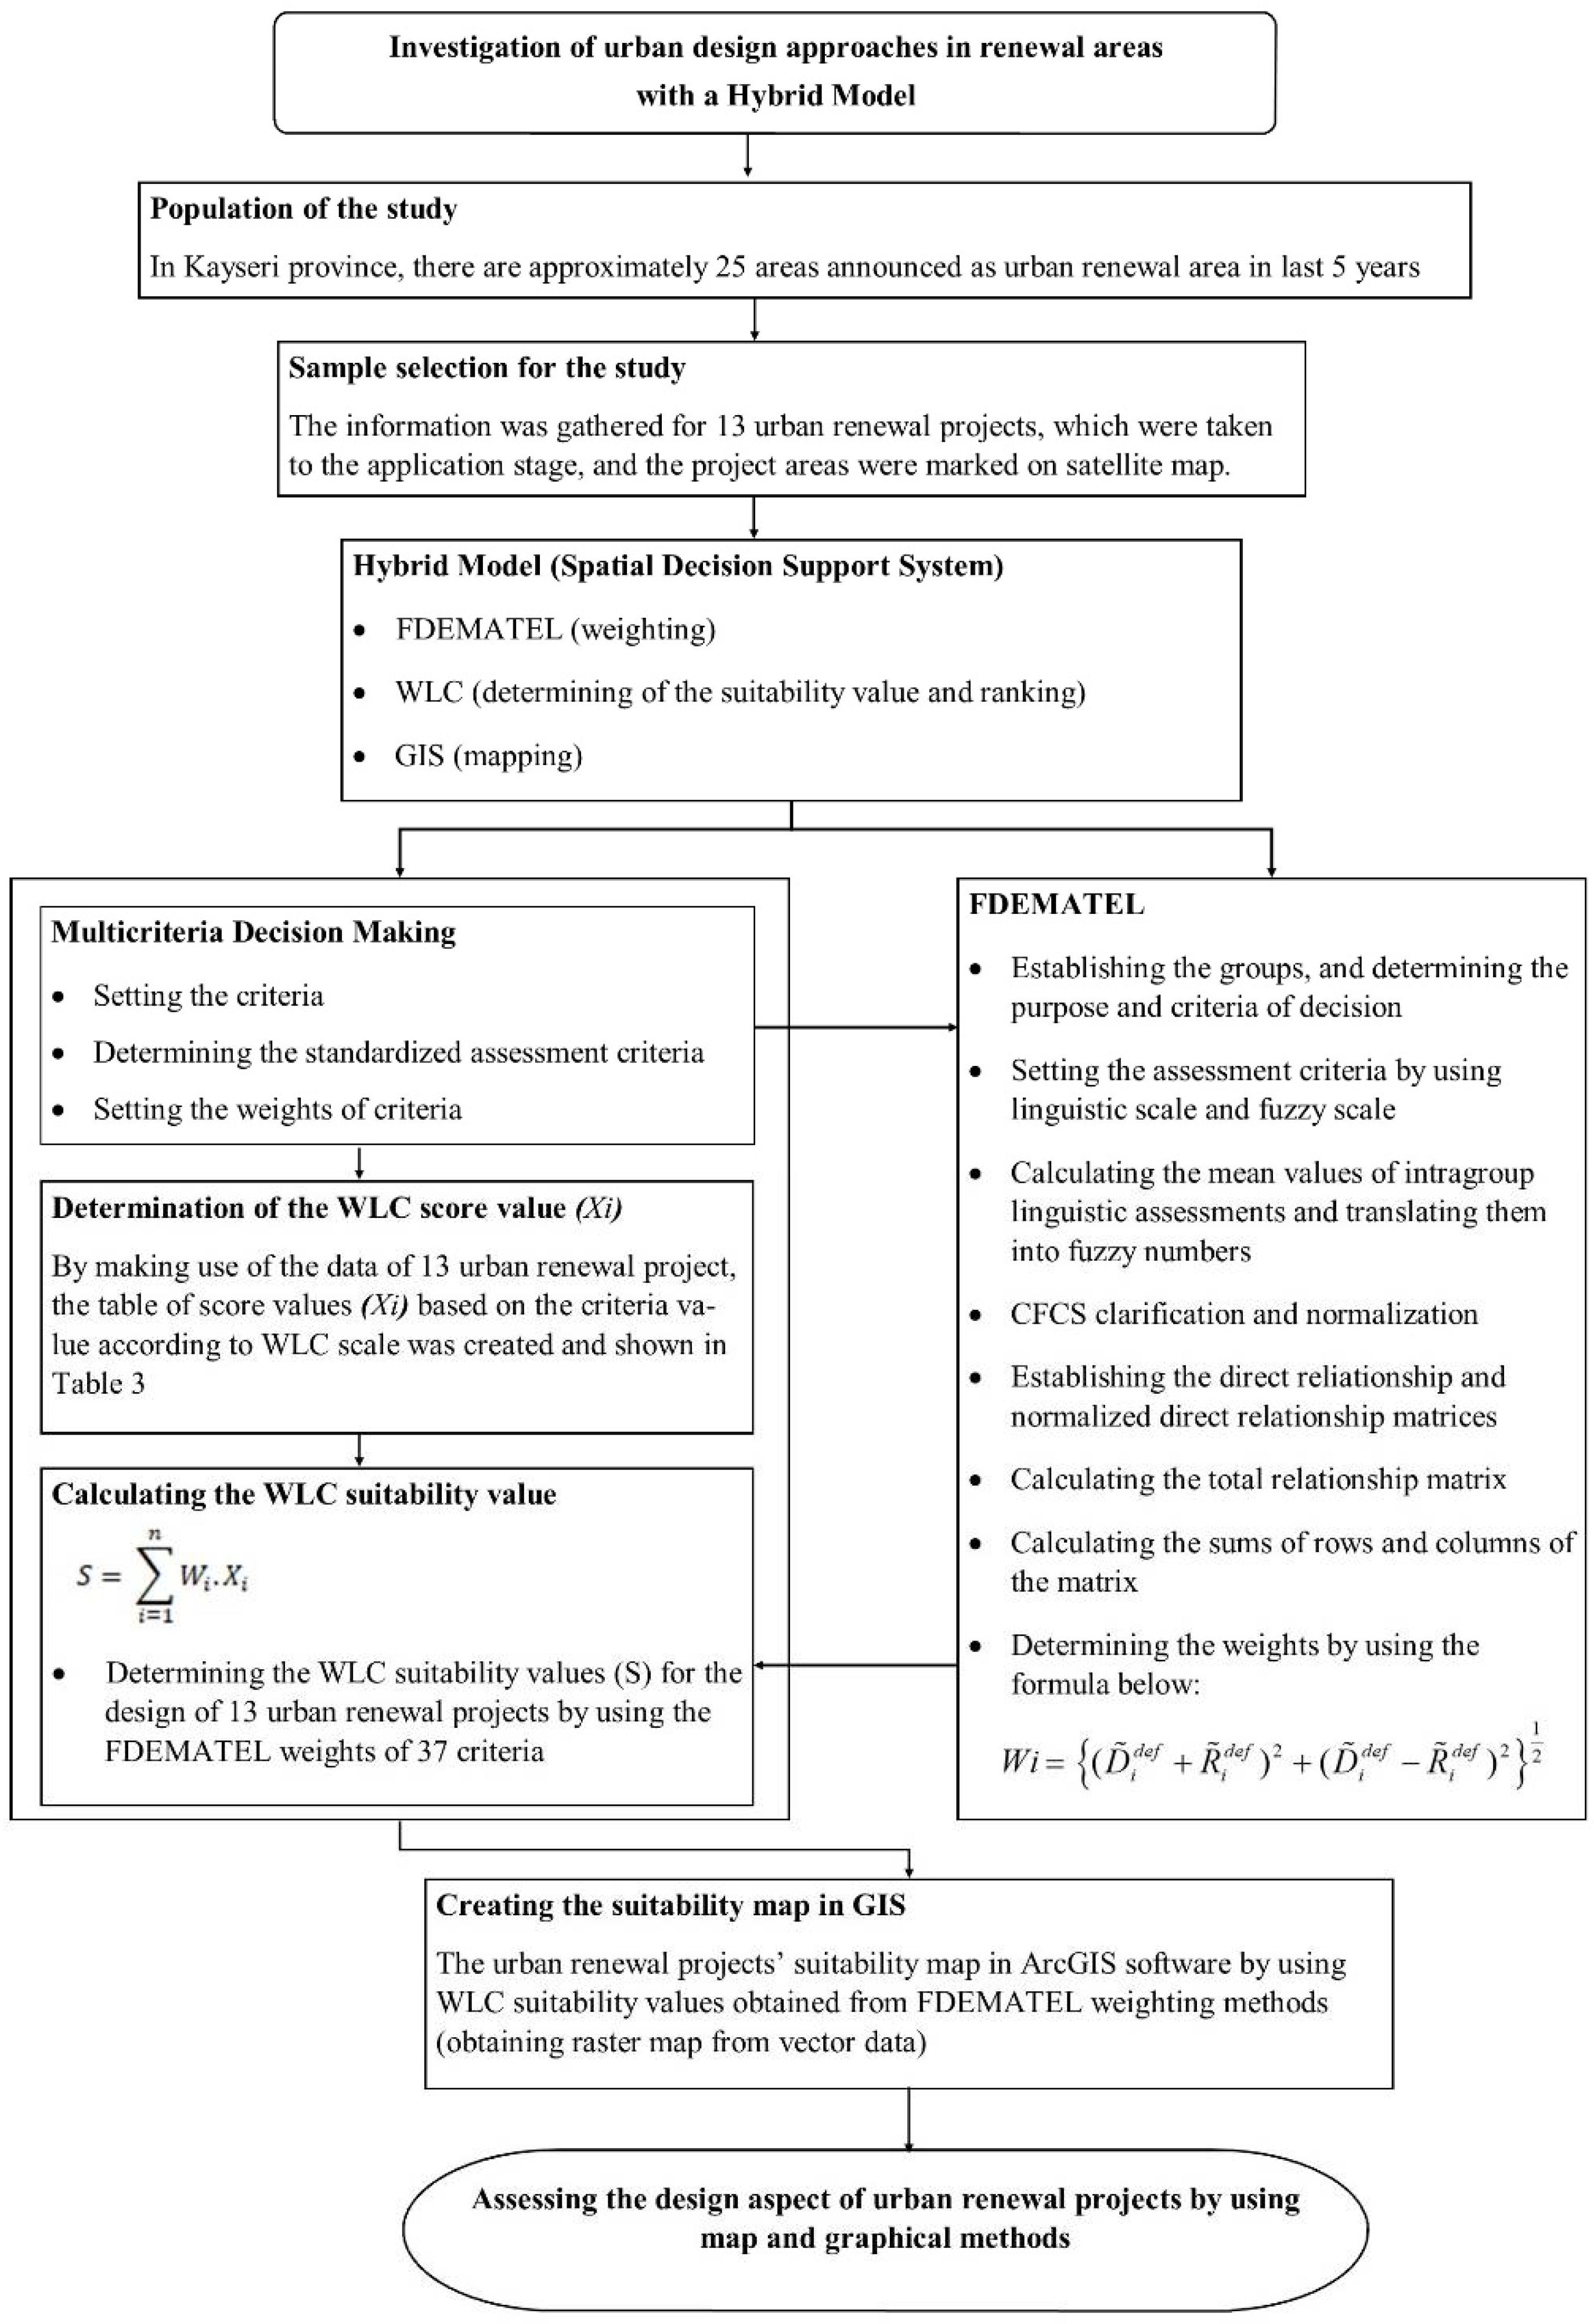
2. Materials and Methods

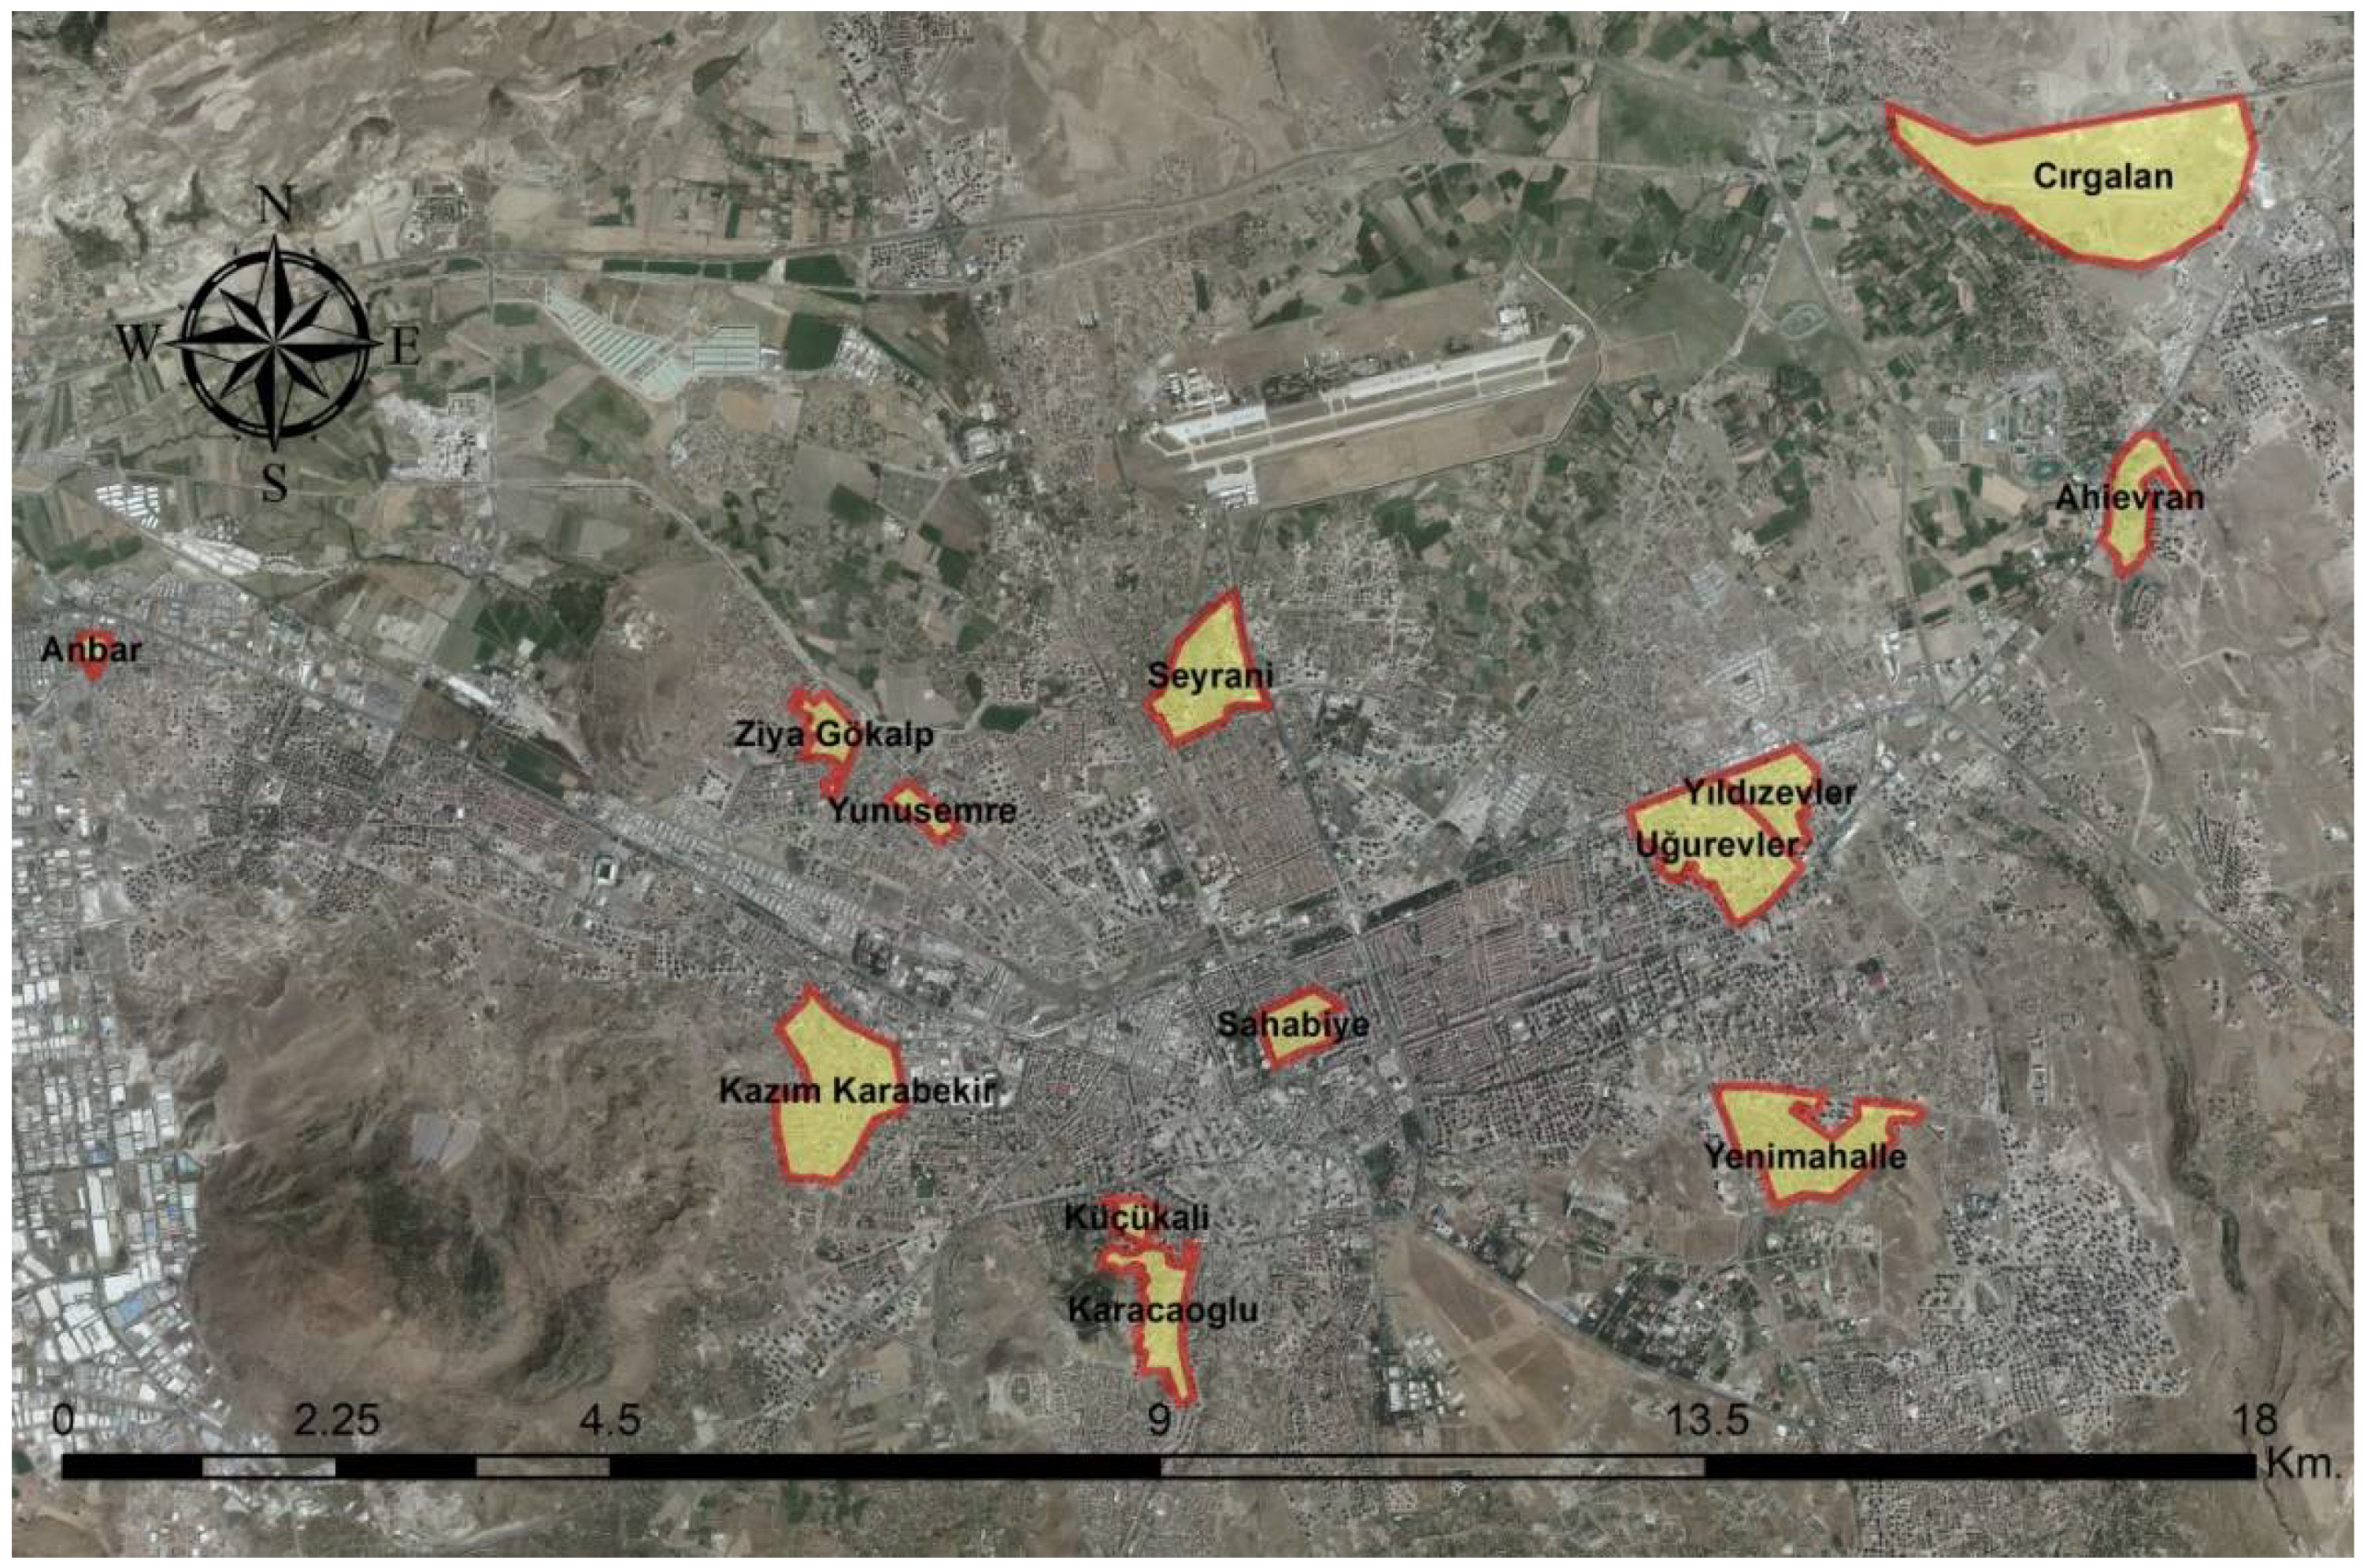
2.1. Urban Renewal Projects in the Study Area

Since it is one of the largest cities in Central Anatolia, receiving intense migration because of industry and commerce, a rapid change and renewal occurred in Kayseri. In parallel with this process of change, it can be seen that the number of urban renewal projects significantly increased since 2000. Considering the historical process, it can be stated that the regions that are closer to the center or having a locational advantage have been increasingly redeveloped since 1980. From this aspect, the shanty areas that are located at a central position and have strong transportation connections and locational advantages started to be rapidly transformed. Therefore, the most important issue in the agenda of the city became the urban renewal projects.
The first urban renewal projects in Kayseri were carried out by contractors at the parcel level. Renewal practices have increased in Kayseri and the country, depending on the developments in the laws in the 2000s. Cırkalan, Uğurevler, Seyrani, Ahi Evran, Yunusemre, Argıncık, Yeşil Mahalle, ZiyaGökalp, Kuşcu, Oruçreis, Mithatpaşa, Erkilet, Yıldızevler and Uğurevler neighborhoods were declared to be urban renewal areas under the conditions specified in the Municipalities Law: 5393, No. 73 [36], in Kocasinan district. In the Melikgazi district, the planning process of the Kazım Karabekir and Anbar neighborhoods was almost completed in accordance with Law No. 6306 on Renewal of Areas under Disaster Risk [37] (Table 1).
In this process, 593.21 hectares of land have been transformed in Kayseri city. This has affected 21,000 users and accelerated in the city. Urban renewal implementation has also been performed for the 13 neighborhoods in Melikgazi and Kocasinan districts. All of the above-mentioned urban renewal projects listed in Table 1, which were designed in line with the different approaches and provisions in the law and located in different locations in the province of Kayseri, were evaluated within the scope of this research.

2.2. Data Collection and Processing

Projects and reports related to 13 urban renewal areas have been examined within the framework of face-to-face interviews and reviews conducted in the archives of the directorates from Kayseri Metropolitan Municipality, Melikgazi Municipality and Kocasinan Municipality Urban Renewal Branch. All the information obtained related to the urban renewal areas was evaluated in terms of the literature search, the opinions of the experts working on this subject in municipalities and the authors, and the main and sub-criteria considered important in urban design in Kayseri province were determined. The Excel spreadsheet program was used to set the data for weight determination purposes. Fuzzy data based on focus group evaluations of the study areas (using a five-point scale) were transferred to the Excel spreadsheet. The boundaries of 13 urban renewal areas from Kayseri Metropolitan Municipality were obtained in a CAD environment and converted into a GIS environment.

2.3. Method

This study on the formation of unqualified urban spaces in terms of livability/habitability focuses on renewal projects in Kayseri. To evaluate the multidimensional information set on these projects, different methods, not often encountered in the literature, were used together. To improve the design quality of renewal projects, a criteria framework and a hybrid spatial decision model were created. In this model, a total of 37 urban design criteria were set as the main and sub-criteria. The current literature, expert opinions, and the partnership of the authors were involved in the determination of these criteria. Although they may vary according to different research subjects or researchers, the design criteria generally accepted in the literature have been used. At the same time, a focus group is a multidisciplinary group formed of different occupational experts who take an active role in urban renewal projects. A matched comparison form was prepared to determine the weights and suitability values of the determined criteria and FDEMATEL and WLC methods were applied. Then, the values analyzed using ArcGIS 10.2 and suitability values were visualized on the map with tables and transformed into interpretable information for decision-makers. As a result, among the reviewed renovation projects, those with the highest and lowest design criteria value are presented clearly and comparably. The emergence of the positive and negative aspects of the projects is important in terms of realization of more qualified urban spaces. In future studies, this model can be used as a practical method for spatial decision makers to determine the site-specific and appropriate design solutions.
Studies combining GIS and decision-making methods with location-based SDSS are becoming increasingly prevalent these days. SDSS are computer-based systems that facilitate the decision-making process for GIS-based spatial problems and include decision algorithms. It allows decision-makers to determine the most suitable solution for the location by combining spatial criteria and attribute information. SDSS can be used in site selection, area analysis, residence valuation, facility setup, land use and planning and route selection [38].
In this study, which evaluates urban renewal projects with the design dimension, a hybrid model, in which a fuzzy multi-criteria decision-making technique and solution-oriented WLC on GIS were used together, was followed. Through the use of the hybrid method, the obtained qualitative data was quantitatively expressed and evaluated on a map basis. This situation will provide a visual interpretation of GIS analysis and will facilitate the communication between the designer and the user while making design decisions.
The DEMATEL method, created on the basis of graphic theory, enables making analyses on the criteria and solving problems with the visualization method. Compared to other methods, it provides flexibility in defining the coefficient matrix between the criteria and this facilitates assessment of the expert [34,39,40]. Due to its ease of interpretation and strong visualization, FDEMATEL was chosen in the study to determine the expert criterion weights. In addition, the WLC method, which is frequently used in the literature, was preferred to combine the obtained weights with the score values with the help of GIS analysis and to order the results on the map visually.
This research, which aims to evaluate urban renewal projects in terms of urban design criteria by using FDEMATEL and WLC, consists of 13 urban renewal projects in the Kayseri urban center. The detailed workflow chart of the approach adopted in this study is presented in Figure 1.
Within this scope, the FDEMATEL was selected for flexible weighting based on a cause–effect analysis between the criteria specified below and the WLC method used for effective visual ordering, also explained below.

2.3.1. Fuzzy DEMATEL

Decision-making is the process of defining the decision goal, creating the widest possible range of alternatives, evaluating the alternatives and monitoring the results to achieve the decision goals by choosing the most appropriate alternative [41]. The decision-making process is affected by uncertainties and decision-makers often have to make decisions based on uncertain information [42]. Fuzzy theory, introduced by Zadeh [43], is a mathematical way of defining classes of materials in real life to compensate for the traditional deficiency of binary logic. Since theory can transform the ambiguities of human thought into certain values, it is very useful to overcome such ambiguities. Fuzzy sets theory, which is used to remove uncertainty in decision making, provides general mathematical approaches. The fuzzy theory introduces the concept of a membership function to deal with different language variables [43]. There is a certain uncertainty in terms of people’s thoughts, inferences and perceptions. The theory aims to solve uncertain or fuzzy data in the environment [44]. Fuzzy sets are defined by membership functions. According to the membership function of fuzzy set A, the membership of each criterion in a set is determined by a number between 0 and 1. If an x criterion definitely belongs to set A, then µA(x) = 1; if it certainly does not belong, then µA(x) = 0. A high degree of membership indicates that the degree of the belonging of the x criterion to set A is higher [45]. Uncertainty in real-world applications is related to the environment. Thus, to minimize subjective bias, MCDM methods are expanded by taking into account the concepts of fuzzy cluster theory [46]. Since a single method is not sufficient in this study, which aims to compare urban design approaches in urban renewal areas, an integrated approach is needed to solve the problem addressed. Therefore, fuzzy linguistic modeling was used to represent and process flexible information.
DEMATEL’s aim is to transform the relationship between the criteria from a complex system to causal dimensions, that is, into an understandable structural model of this system [47]. Due to the method, while evaluating decision problems the cause-and-effect relationships of the criteria can be clearly seen [48]. The final product of the DEMATEL process is a visual representation of an individual mind map in which the questionnaire assessor organizes his thoughts [49,50,51]. The fuzzy DEMATEL method is a quantitative analysis method based on the expert assessment that measures the degree of the effect between factors through fuzzy semantic variables [52]. Combined with a fuzzy logic structure, it is a strong approach for determining weights and alternatives in decision making because of its visualization features of cause-and-effect relationships and connections between factors [53,54]. By dividing the factors into two groups of cause and effect, decision problems are easier to plan and solve [55].
Determining the appropriate multi-criteria decision-making approach from the list of available methods for a particular application is a difficult task [56]. Although some methods seem more appropriate under certain conditions and scenarios, there is not a single method that can address all problems [57]. In general, the choice of the MCDM method is a serious problem, and when the number of criteria increases, the solution is often uncertain and difficult to find [58]. The DEMATEL method used in the study is widely used to obtain the cause-and-effect diagram of interdependent factors. This method is superior to traditional techniques because it reveals the relationships between the criteria, ranks the criteria according to the type of relationships, and reveals the intensity of their effects on each criterion [59]. In addition to the above-mentioned advantages, the fuzzy DEMATEL method provides the expert group with more flexibility in evaluating the criteria. While consistency control should be performed in the AHP method to evaluate the criteria according to superiority, the DEMATEL method provides more flexibility and convenience to the focus group since it evaluates the criteria according to the degree of impact.
There are many normalization methods for MCDM problems and an appropriate defuzzification method is needed to obtain the correct result. The CFCS method proposed by Opricovic and Tzeng [41] ensures that left and right scores are taken into account by fuzzy min and fuzzy max and a weighted average value is obtained as a total score according to membership functions [60]. This method is based on the output of the fuzzy set, which can convert the fuzzy number into exact scores. Chen et al. [61] stated that the CFCS method can give a better exact value compared to other defuzzification methods.
While calculating the results of the evaluations made by the experts among the factors, converting the Fuzzy data into crisp scores (CFCS) defuzzification method can be used to convert the fuzzy data into exact numbers. As a result of this process, the direct relationship matrix is obtained [41]. The process of the fuzzy DEMATEL method is explained in detail below [62]:
  • Step 1: An expert group is formed and the number of goals and criteria to be achieved pursuant to the decision is determined.
  • Step 2: The evaluation scale is developed. The fuzzy DEMATEL linguistic scale used in the study of Wu and Lee [63] is given in Table 2.
  • Step 3: The mean of the linguistic evaluations of decision-makers is obtained as a result of the evaluations made within the group. These linguistic evaluations are converted into fuzzy numbers according to the scale. In this step of the fuzzy DEMATEL analysis, fuzzy coefficients matrix Aij is created based on the mean of linguistic evaluations collected from experts as shown in Table 2.
A i j = [ a 11 a 12 a 1 m a 21 a 22 a 2 m a n 1 a n 2 a n m ]   i   =   1 ,   2 , ,   m   a n d   j   =   1 ,   2 , ,   n
A i j : coefficients matrix.
In this matrix, m is the number of assessors and n is the number of criteria. aij = (lij, mij, uij) is represented by the triangular fuzzy number, and the lower limit (l), middle value (m) and upper limit (u) of the triangular fuzzy number. These values are the degree of fuzziness of the effect determined by the i assessors for the j criterion.
  • Step 4: With the converting the fuzzy data into crisp scores (CFCS) defuzzification method, normalization is performed for matrix A and fuzzy numbers are converted to single values [41,52].
4.1
Normalization calculation is performed for lower, middle and upper values in each alternative. (Calculate left and right normalized values.)
R = max j u i j ,
L = min j l i j ,
Δ = R L
x l j = ( l i j L ) Δ
x m j = ( m i j L ) Δ
x u j = ( u i j L ) Δ
R: Maximum upper bound value in each column of matrix A.
L: Minimum bottom bound value in each column of matrix A.
Δ : Maximum upper bound value—minimum upper bound value.
x l j : Normalization of the bottom value.
x m j : Normalization of the middle value.
x u j : Normalization of the upper value.
4.2
Determination of normalized values on the right and left for defuzzification; compute left (ls) and right (rs) normalized values; for j = 1, 2, …, n
x j l s = x m j 1 + x m j x l j
x j r s = x u j 1 + x u j x m j
x j l s : Left normalized values.
x j r s : Right normalized values.
Total normalized crisp values:
x j c r i s p = [ x j l s ( 1 x j l s ) + x j r s x j r s ] 1 x j l s + x j r s
x j c r i s p : compute total normalized crisp values.
4.3
Calculate crisp values for defuzzification
x i j c r i s p = L + x i j c r i s p Δ
x i j c r i s p : compute crisp values.
  • Step 5: From the obtained values, Equations (12) and (13) and the normalized direct relation matrix are determined.
X ˜ = X ˜ ( 1 ) X ˜ ( 2 ) X ˜ ( p ) p
X ˜ = [ x ˜ 11 x ˜ 12 x ˜ 1 n x ˜ 21 x ˜ 22 x ˜ 2 n x ˜ n 1 x ˜ n 2 x ˜ n n ]
X ˜ : normalized direct relation matrix.
  • Step 6: The total relationship matrix ( ) is determined. After obtaining the normalized direct relationship matrix, the total relationship matrix is determined using Equations (14) and (15). This equation is represented by the unit matrix (I).
T ˜ = lim W ( X ˜ + X ˜ 2 + + X ˜ W ) = X ˜ ( I X ˜ ) 1
T ˜ = [ t ˜ 11 t ˜ 12 t ˜ 1 n t ˜ 21 t ˜ 22 t ˜ 2 n t ˜ n 1 t ˜ n 2 t ˜ n n ]
I: Unit matrix. T ˜ : Total relationship matrix.
  • Step 7: After the total relation matrix is found, the sum of columns and rows in the matrix are obtained by the formulas given in Equations (16) and (17).
D ˜ i = j = 1 n t ˜ i j , i = 1 , 2 , , n
R ˜ i = i = 1 n t ˜ i j , j = 1 , 2 , , n
D ˜ i : Sum of rows in total relationship matrix. R ˜ i : Sum of columns in total relationship matrix.
  • Step 8: The values found in step 7 are replaced in Equation (18), and the result weights of the criteria are calculated.
ω i = { ( D ˜ i d e f + R ˜ i d e f ) 2 + ( D ˜ i d e f R ˜ i d e f ) 2 } 1 2
ω i : The weight vector for the criteria

2.3.2. Weighted Linear Combination (WLC)

The WLC technique, which is one of the most commonly used decision models in GIS, is a decision rule developed to derive composite maps using GIS [64]. In other words, raster layers representing multiple criteria (factors) with different weights or relative importance can be combined as a single layer [12]. The WLC model is commonly used in problems involving location selection or area analysis. It provides flexibility in combining many factors and is based on the weighted average [65]. The weighted total score (suitability value) of the alternative is derived from the product of the value of the weight assigned to each criterion and the score values of the criteria. The alternative with the highest weighted total score in all alternatives is chosen as the best [66].
The method provides the result raster layer by combining the raster layers belonging to the criteria in any GIS software with site selection/spatial analysis capabilities [67]. If there are m alternatives and n criteria in the layers to be combined, scoring (score value) is made separately for each alternative. In addition, for each criterion, weights showing its importance with decision-making methods pursuant to expert opinions are calculated. The weighted total score for alternatives is calculated with Equation (19) [68,69]:
A ( i ) = j = 1 n a ( i , j ) · w ( j ) , i = 1 , 2 , , m
where a ( i , j ) : score value of the alternative i according to j criteria; w ( j ) : the weight of criterion j; and A ( i ) : total suitability value of alternative i.
The closer the suitability value of the alternative is to 1, the greater the suitability in site selection or area analysis. In some applications, for the criteria that affect the result, it may be necessary to make a calculation by adding the limitation situation on a location basis ( ) to the formula. This part of the formula takes the value 0 if there is a limitation in the criteria, and 1 if there is none. Equation (20) can be written for such applications [70].
A ( i ) = j = 1 n a ( i , j ) · w ( j ) j = 1 m C ( j )

2.3.3. Integration of Fuzzy DEMATEL and WLC Method

Calculation of weights will be realized with fuzzy DEMATEL while the sequencing of alternatives over suitability value will be performed with the WLC method. With ArcGIS 10.2 software, we planned to show the renewal areas on the satellite map according to the suitability value. In this context, the integration of methods is considered to be carried out in four steps:
  • A fuzzy coefficient matrix based on arithmetic averages will be created by the expert group by comparing the main and sub-criteria within the scope of the linguistic scale given in Table 2.
  • The defuzzification process will be performed by applying the fuzzy data into crisp scores (CFCs) method developed by Opricovic and Tzeng [41] to the fuzzy A coefficients matrix.
  • Using the total relationship matrix obtained from the defuzzification process, the weights of the main and sub-criteria will be calculated with Equation (18) given in step 8 of the fuzzy DEMATEL method.
  • The obtained criteria weights will be included as input to the WLC method to be applied in the ArcGIS 10.2 program. These weights and the score values converted to the 0–1 range (in the 0–1 range) for the criteria given in Table 3 will be combined with Equation (19) and the GIS-based total suitability value (Ai) will be calculated for each alternative renewal area. With the GIS-based suitability values obtained, renewal areas will be evaluated between 0 (very bad) and 1 (very good) scores in terms of urban design and the results will be visualized on the map.

3. Application

The sample of this study, which aims at assessing the urban renewal projects from the aspect of design and mapping the urban renewal projects by using FDEMATEL and WLC in terms of design principles and criteria, consists of 13 urban renewal projects in the central district of Kayseri province (Figure 2).
It is observed that many different criteria have been used for evaluation from the 1960s to the present day in the relevant literature. Many criteria that are considered conceptually different may be complementary or interchangeable. For this reason, the evaluation criteria that many researchers agreed on were used when selecting the main criteria. Sub-criteria selection was made on the same grounds. They contain content that feeds the main criteria and has different dimensions. These are also the criteria accepted by many important researchers in the literature and used in their studies. Of course, many of the main and sub-criteria can be considered as evaluation criteria under different headings, but their widespread use in the literature has been taken into consideration. As a result, all criteria focused on evaluating the “design” approach of an urban renewal area with different approaches.
Urban development depends on a large number of measurable and unmeasurable variables that are interconnected. Fuzzy multi-criteria decision-making analysis has been widely used in dealing with decision-making problems involving multi-criteria evaluation/alternative selection, it has shown advantages especially in handling unmeasurable, qualitative criteria and quite reliable results have been obtained. Scholars state that purely economic data is not sufficient to evaluate the context of a particular situation/organization [71,72]. This study, which aims to evaluate urban transformation projects in terms of design approaches, has examined the relevant literature in the selection of criteria within the framework of evaluating the success of urban transformation applications and has developed an evaluation scale within the framework of non-financial criteria, taking into account that the financial benefits of the renewal projects can occur after the project process is concluded.
Non-financial attributes were determined in the selection of criteria, the biggest reason for this is that the renewal projects have not yet been completed and the project implementation processes are still in progress. When it comes to “Urban Design”, it is inevitable that concrete criteria that naturally concern physical formation are predominant. However, the intangible criteria that direct the physical formation are at least as important as the concrete criteria. In this regard, the proliferation and diversification of criteria in different studies may lead to more inclusive results. The criteria chosen in this study can be defined as compatible with urban renewal project evaluation strategies, comparable, reliable, objective, realistic, verifiable and applicable. Evaluation, comparison and ranking process based on “traditional concrete criteria” can be handled in different dimensions with the completion of the transformation projects. With the completion of the projects and the beginning of a certain population living in the project area, in addition to the traditional criteria, invisible-oriented criteria (such as perception, expectation, satisfaction, etc.) may be included in this research [71]. Within the framework of these studies, there are 37 sub-criteria that can be gathered under 7 main criteria. The main criteria are construction characteristics, project area characteristics, conformity to natural structure and green area/public area in project, social equipment areas, urban furniture and accessibility. The urban renewal projects examined in this study were analyzed in parallel with the score values and sub-criteria definitions specified in Table 3 and prepared in accordance with the literature review, expert opinion and author assessment.
The results of fuzzy numbers related to the selected criteria according to FDEMATEL formulas were found using Excel calculation functions and the Matlab calculation program and the criterion weights were determined. Data on the boundaries of 13 urban renewal areas were obtained from Kayseri Metropolitan Municipality in the form of CAD-based maps and they are converted into the ArcGIS 10.2 program format. The spatial database was created by joining the database prepared in Excel, where the rows show urban renewal areas and the columns sub-criteria, with the map of urban renewal areas created in ArcGIS. After the creation of the spatial database, the spatial analyst/weighted sum command, which solves the WLC method in the ArcGIS program, was used to obtain a spatial suitability map that evaluates urban renewal projects in terms of design criteria and ranks them according to the score value. The score values to be used in ordering the urban renewal projects in terms of design to obtain the suitability value are as follows: very bad = 0.00, bad = 0.25, medium = 0.50, good = 0.75 and very good = 1.00. The scores of the sub-criteria of the projects were entered into the attribute table in ArcGIS by creating a separate polygon layer for each renewal area. To obtain the weights in the application, the pairwise comparison assessment form was prepared. A focus group of eight people was formed consisting of city planners, architects and geomatics engineering from Erciyes University and Kadıköy Municipality of Istanbul (Table 4).
The focus group was asked to make pair wise comparisons between the criteria according to the fuzzy DEMATEL linguistic scale given in Table 2. The common decision, on which a consensus was reached, was converted into fuzzy values after determining the linguistic value. The linguistic scales determined for the main criteria are shown in Table 5.
In the fuzzy DEMATEL, the normalized direct relationship matrix X occurred for the main criteria is presented in Table 6 after calculations using Equations (1)–(13). This step was repeated for the sub-criteria.
The total relationship matrix T established by using the Equations (14) and (15) is presented in Table 7.
After the total relationship matrix, Equations (16) and (17) were used in calculating the sum of columns (R) and sum of rows (D), whereas Equation (18) was used in calculating the normalized Wi weights presented in Table 8.
The final weights of the sub-criteria, which were computed by using the same equations, are presented in Table 9. Since there are many sub-criteria tables in this paper, they are not shown separately.
The score values obtained from the evaluations and weights calculated with FDEMATEL in Table 3 were used in Equation (19) to calculate the WLC suitability value for each urban renewal project. While interpreting in accordance with the suitability values, the projects having values closer to 1 are considered as very good, whereas those having values closer to 0 are considered very bad (Table 10).
When the urban renewal projects are compared in terms of suitability values, it can be seen that the projects to be applied in the Ziya Gökalp, Seyrani and Ahievran neighborhoods (red zones) are more successful in terms of design (Figure 3).
Additionally, the projects were presented in a graph to make a general situation assessment. As a result, it was determined that all the urban renewal projects carried out in Kayseri province are below the average for design standards (0.50) (Figure 4).

4. Results and Conclusions

In the urban context, “design” processes, with their new content, seem to be the key to successful urban solutions in renewal. Projects developed with parameters appropriate to the local value of the cities have the potential to contribute greatly to the socio-spatial integration of citizens. With the GIS-based hybrid decision method used in the research, it has become possible to obtain visual results that can be used in the evaluation and ranking of the renewal projects within the scope of urban design criteria. The presented “hybrid decision model” approach is one that can account for uncertainties in urban renewal areas while also allowing for the generation of multiple alternatives. This approach is a useful decision-making tool that can evaluate many criteria and alternatives together and has the potential to systematically present this information to all decision-making actors. It also provides unique tools for developing a more successful project by incorporating urban design criteria that consider local characteristics. These tools serve as a guiding model for the local administration and other decision-makers where the project is implemented. Score values and weights of the urban design criteria that are determined for Turkey within the scope of the project may differ in other countries. In future studies, more criteria or alternatives can be developed according to the structure of the renewal area. It may also be possible to include other SDSS techniques or intuitive methods in the model.
In the study, it is seen that the projects analyzed as a result of GIS-based assessments by weighting with FDEMATEL and ordering with the WLC method are below the average value (0.50) in terms of urban design. Projects closest to average value are in the ZiyaGökalp, Seyrani and Ahi Evran neighborhoods. Factors such as the location of the project area, well-defined relations with the center, a better setting concerning green area-built area balance in a holistic approach compared to other projects and the adequacy of social reinforcement areas were useful in the formation of this result. The most critical factor in the projects examined is that they lack the approach toward strengthening the identity of the place and creating a sense of community. By recognizing local cultural factors that enrich economic and social life, a perspective that evaluates the public as a participant in protecting this culture could not be developed. The projects have been examined on a micro-scale, and their macro-level relationships and effects have not been evaluated. In areas with a dense construction after the renewal, inadequacies were observed in the rearrangement of the infrastructure and reinforcements of the region. The projects have been handled at the parcel scale, and an approach that focuses on the area and evaluates it with its environment has not been demonstrated. Design targets with an appropriate social program for post-project users have not been determined. It is crucial to evaluate the benefits of the project to the city along with the benefits it will provide to users.
Within the scope of the proposed method, FDEMATEL and WLC methods were successfully applied based on GIS to evaluate urban design approaches in the renewal areas in the city of Kayseri. Classical applications use methods such as fuzzy DEMATEL, fuzzy TOPSIS and fuzzy AHP, and weighting and sequencing processes are carried out through these methods. The biggest handicap of classical methods is that they lack spatial presentations. In such classical applications, only the performance level of urban renewal areas can be listed, but area-based spatial evaluations cannot be made on the map. In the hybrid method we applied, the weights were determined with the fuzzy DEMATEL method. However, since the WLC method used for sequencing is also a GIS-based method, it enables spatial evaluation and the presentation of the results on satellite maps. Since such hybrid methods require spatial data, they require the collection of spatial data. The limited data available in underdeveloped or developing countries and the fact that the researcher carries out the data collection stage delays the achievement of the application results and causes time losses. Although losing time and resources in the collection of spatial data is a problem for some countries, developments in the field of information and communication enable the data to be processed more accurately and the results of spatial analysis to be obtained more quickly. For example, with the GIS-based hybrid method used in the study, it will be possible to see in which regions of the city successful applications are obtained in terms of urban design and in which regions unsuccessful results are obtained. When we look at the renewal applications specific to the city of Kayseri from the perspective of urban design, it is seen that more successful results are achieved in the applications made in the southern regions of the city compared to those in the northern regions. Whether this result is due to the economic, physical or social structures of the regions is a separate research topic for decision makers. As a result, while the GIS-based hybrid method, which is used here, allows spatial analysis, classical methods can only perform sequencing. Today, map production with satellite techniques and unmanned aerial vehicles and easy spatial analysis on GIS software provides ease of access to geographical data. In the future, GIS-based hybrid methods proposed to evaluate urban design approaches in renewal areas within the scope of the study will be used in many different applications with spatial infrastructure, and will help local administrators and experts to make the right decision in urban renewal areas.
The main findings of the study are based on three main points: the creation of criteria for the design quality of urban renewal areas, the creation of a hybrid spatial decision-making model and the transfer of the values, which are obtained, to the reader through tables and maps. When the main findings are examined (Figure 4), the results are unsuccessful in terms of all numerical values (the scores corresponding to all criteria are below 0.50). It is obvious that one of the main reasons for this failure is the country’s urban planning and urban renewal policies. Countries that adapt spatial configuration, in other words, to their “urban design” processes, to their urban planning processes, have the practice of producing more qualified urban spaces. Of course, many factors such as the socio-economic status of the countries, geographical factors, cultural structures and the history of the planning are also important. However, the results in 13 areas examined in the scope of the study are striking samples in terms of “failure”. The main conclusion to be made here is the existence of the failures in the planning systems of countries. These values can also be considered as an indication that the concept of “design” that guides spatial decisions in the planning understanding has not yet been established in Turkey. In this sense, Turkey has similar characteristics with global southern cities. Scattered decision-making processes, informal relations in the triangle of state-market-citizen, speculation, conflict, chaos, rent and uncertainties are the common denominators of this similarity.
Along with the renewal of the physical environment, policies that emphasize social, environmental and economic values such as increasing education, workforce, and employment opportunities, creating programs to support local entrepreneurship, and developing strategies for diversifying economic activities suitable for the region should also be included in urban renewal projects. What should not be forgotten for a successful approach is that urban renewal is not only a construction activity but also an action that is based on the principle of establishing a sustainable city system in which continuity of unique identity is taken as an indispensable factor in the integrity of socioeconomic and physics-space.
The analysis of the standards that determine the spatial formation in urban design projects with the fuzzy spatial decision support system and the evaluation of the success levels can be considered the study’s contribution and originality. In the context of the practical meaning of the study, analyzing the standards that determine spatial formation in urban design projects with the fuzzy spatial decision support system and evaluating their success levels can be evaluated as the contribution and originality of the study. In the context of urban planning and urban design, this model provides a scientific tool for the transition from the decision to implementation. This method, which provides rapid intervention, inspection and renewal, provides the opportunity to test the design criteria to create a sustainable life specific to the place and thus provide feedback and intervention. While the designs put forward in the existing urban renewal projects offer a spatial formation/organization/design below the average, the hybrid method developed with this study will contribute to the creation of quality/livable places by integrating it with city plans.
Therefore, the method used in this study for urban design quality analysis is quite different from the results obtained with traditional methodologies. In traditional methods, there is a singular tool used instead of multiple tools, and one-way literature or a single expert opinion instead of a focus group. There is no possibility for rapid intervention, the opportunity for improvement is more stable and cumbersome. Evaluation of the criteria in the field develops unilaterally on the basis of traditional surveys, observations or expert opinions. The combination of various and multiple datasets is weak. Traditional reading methods have been inadequate, especially in the application areas that include the multi-faceted project decision process such as those in the renewal areas. The score values in the project samples can also be interpreted as a striking example of this situation.
In this context, understanding how the renewal areas are designed has been an important step toward determining the spatial qualities. The obtained results can be used to identify existing problems and propose solutions. With the emergence of problematic streets, it can also help support urban planning decisions aimed at improving the urban space quality. It is understood that some of the identified problems are due to the continued impact of past planning policies that have given little importance to spatial quality at the neighborhood scale.
As for the limitations of the research, it is thought that helpful guides and procedures can be provided in conceptualizing the “design” assessment at the neighborhood level, especially in developing countries where such a framework has not yet been designed.
There are a number of regulations that urban planners, architects, actors and all decision-makers can make to restructure cities to prevent and control the urban collapse process. As one of these regulations, at the end of the urban renewal applications, to gain more qualified urban environments, a design quality criteria approach should be developed for each renewal site through the local specific conditions of the area. Additionally, in future studies, the model produced by this study can be used in the development and evaluation of criteria frameworks for creating urban spaces compatible with extraordinary situations such as pandemics.

Author Contributions

Conceptualization, M.K.G., B.B., N.Y.B. and U.D.; writing—original draft preparation, M.K.G. and B.B.; writing—review and editing, M.K.G., B.B., N.Y.B. and U.D.; visualization, M.K.G., B.B., N.Y.B. and U.D. All authors have read and agreed to the published version of the manuscript.

Funding

This research received no external funding.

Institutional Review Board Statement

Not applicable.

Informed Consent Statement

Not applicable.

Data Availability Statement

Not applicable.

Conflicts of Interest

The authors declare no conflict of interest.

References

  1. Auböck, M. Open Spaces: The City; Planbox Publishing: Vienna, Austria, 1996. [Google Scholar]
  2. Elliott Ortega, K. Urban Design as Problem Solving: Design Thinking in the Rebuild by Design Resiliency Competition. Doctoral Dissertation, Massachusetts Institute of Technology, Cambridge, MA, USA, 2015. [Google Scholar]
  3. Lang, J. Urban Design: The American Experience; John Wiley & Sons: Hoboken, NJ, USA, 1994. [Google Scholar]
  4. Roberts, M.; Greed, C. Approaching Urban Design: The Design Process; Routledge: London, UK, 2014; Volume 5. [Google Scholar]
  5. Lin, S.-H.; Huang, X.; Fu, G.; Chen, J.-T.; Zhao, X.; Li, J.-H.; Tzeng, G.-H. Evaluating the sustainability of urban renewal projects based on a model of hybrid multiple-attribute decision-making. Land Use Policy 2021, 108, 105570. [Google Scholar] [CrossRef]
  6. Carmona, M.; Tiesdell, S.; Heath, T.; Oc, T. (Eds.) Public Places—Urban Spaces: The Dimensions of Urban Design; Elsevier: Oxford, UK, 2010. [Google Scholar]
  7. Yıldız, S.; Kıvrak, S.; Gültekin, A.B.; Arslan, G. Built environment design-social sustainability relation in urban renewal. Sustain. Cities Soc. 2020, 60, 102173. [Google Scholar] [CrossRef]
  8. Biddulph, M. Urban design, regeneration and the entrepreneurial city. Prog. Plan. 2011, 76, 63–103. [Google Scholar] [CrossRef]
  9. Mehdipanah, R.; Malmusi, D.; Muntaner, C.; Borrell, C. An evaluation of an urban renewal program and its effects on neighbourhood resident’s overall wellbeing using concept mapping. Health Place 2013, 23, 9–17. [Google Scholar] [CrossRef]
  10. Al-Hanbali, A.; Alsaaideh, B.; Kondoh, A. Using GIS-based weighted linear combination analysis and remote sensing techniques to select optimum solid waste disposal sites within Mafraq City, Jordan. J. Geogr. Inf. Syst. 2011, 33, 267–278. [Google Scholar] [CrossRef] [Green Version]
  11. Juan, Y.-K.; Roper, K.O.; Castro-Lacouture, D.; Kim, J.H. Optimal decision making on urban renewal projects. Manag. Decis. 2010, 48, 207–224. [Google Scholar] [CrossRef]
  12. Lee, G.K.L.; Chan, E.H.W. The Analytic Hierarchy Process (AHP) approach for assessment of urban renewal proposals. Soc. Indic. Res. 2008, 89, 155–168. [Google Scholar] [CrossRef]
  13. Yeang, K. Ecodesign: A Manual for Ecological Design; Wiley-Academy: London, UK, 2006. [Google Scholar]
  14. Peng, Y.; Lai, Y.; Li, X.; Zhang, X. An alternative model for measuring the sustainability of urban regeneration: The way forward. J. Clean. Prod. 2015, 109, 76–83. [Google Scholar] [CrossRef]
  15. Wang, H.; Shen, Q.; Tang, B.S.; Skitmore, M. An integrated approach to supporting land-use decisions in site redevelopment for urban renewal in Hong Kong. Habitat Int. 2013, 38, 70–80. [Google Scholar] [CrossRef] [Green Version]
  16. Liu, L. Emerging study on the transmission of the Novel Coronavirus (COVID-19) from urban perspective: Evidence from China. Cities 2020, 103, 102759. [Google Scholar] [CrossRef]
  17. Makhno, S. Life after Coronavirus: How Will the Pandemic Affect Our Homes. Dezeen. 2020. Available online: https://www.dezeen.com/2020/03/25/life-after-coronavirus-impact-homes-designarchitecture/ (accessed on 1 June 2020).
  18. Honey-Rosés, J.; Anguelovski, I.; Bohigas, J.; Chireh, V.; Daher, C.; Konijnendijk, C.; Nieuwenhuijsen, M. The Impact of COVID-19 on Public Space. A Review of the Emerging Questions. OSF Prepr. 2020, 5, 263–279. [Google Scholar]
  19. Wainwright, O. Smart lifts, lonely workers, no towers or tourists: Architecture after coronavirus. The Guardian, 21 December 2020. [Google Scholar]
  20. Sardeshpande, M.; Rupprecht, C.; Russo, A. Edible urban commons for resilient neighbourhoods in light of the pandemic. Cities 2021, 109, 103031. [Google Scholar] [CrossRef]
  21. Dejtiar, F. Is coronavirus pandemic accelerating the digitalization and automation of cities. ArchDaily, 12 July 2020. [Google Scholar]
  22. Dreessen, T. How COVID-19 will change the design of our cities. Ottowa Bus. J. 2020, 21, 2020. [Google Scholar]
  23. Kashdan, R. Six Ways Urban Spaces May Change Because of Coronavirus. 2020. Available online: https://www.bostonmagazine.com/property/2020/04/30/urban-spaces-coronavirus/ (accessed on 1 January 2021).
  24. Lubell, S. Commentary: Past pandemics changed the design of cities. Six ways COVID-19 could do the same. Los Angeles Times, 22 April 2020. [Google Scholar]
  25. Megahed, N.A.; Ghoneim, E.M. Antivirus-built environment: Lessons learned from COVID-19 pandemic. Sustain. Cities Soc. 2020, 61, 102350. [Google Scholar] [CrossRef]
  26. Muggah, R.; Ermacora, T. Opinion: Redesigning the COVID-19 City. Special Series—The Coronavirus Crisis; NPR Media Organization: Washington, DC, USA, 2020. [Google Scholar]
  27. Nicola, M.; Alsafi, Z.; Sohrabi, C.; Kerwan, A.; Al-Jabir, A.; Iosifidis, C.; Agha, M.; Agha, R. The socio-economic implications of the coronavirus and COVID-19 pandemic: A review. Int. J. Surg. 2020, 78, 185–193. [Google Scholar] [CrossRef]
  28. Novakovic, S. Will COVID-19 Spell the End of Urban Density? Don’t Bet on It; Azure Publishing Inc.: Toronto, ON, Canada, 2020. [Google Scholar]
  29. Çelen, B. Public Housing Projects and Systematic Management Design Principles and Social Facilities: Kayaşehir Case. Master’s Thesis, Graduate School of Natural and Applied Sciences, Mimar Sinan Fine Arts University, Istanbul, Terkey, 2016. (In Turkish). [Google Scholar]
  30. Batuman, B.; Baykan, D.A. Critique by design: Tackling urban renewal in the design studio. Urban Des. Int. 2014, 19, 199–214. [Google Scholar] [CrossRef] [Green Version]
  31. Cubillos-González, R.A. Sustainable urban design criteria in medium-sized, Colombian cities. New Des. Ideas 2017, 1, 59–70. [Google Scholar]
  32. Huang, L.; Zheng, W.; Hong, J.; Liu, Y.; Liu, G. Paths and strategies for sustainable urban renewal at the neighbourhood level: A framework for decision-making. Sustain. Cities Soc. 2020, 55, 102074. [Google Scholar] [CrossRef]
  33. Yung, E.H.; Conejos, S.; Chan, E.H. Social needs of the elderly and active aging in public open spaces in urban renewal. Cities 2016, 52, 114–122. [Google Scholar] [CrossRef]
  34. Wang, R.; Chuu, S. Group decision-making using a fuzzy linguistic approach for evaluating the flexibility in a manufacturing system. Eur. J. Oper. Res. 2004, 154, 563–572. [Google Scholar] [CrossRef]
  35. Wang, Y.; Li, J.; Zhang, G.; Li, Y.; Asare, M.H. Fuzzy evaluation of comprehensive benefit in urban renewal based on the perspective of core stakeholders. Habitat Int. 2017, 66, 163–170. [Google Scholar] [CrossRef]
  36. TBMM. The Law for Municipality (No. 5393); TBMM: Ankara, Turkey, 2005. (In Turkish) [Google Scholar]
  37. TBMM. The Law for Renewal of Disaster Risk Areas (No. 6306); TBMM: Ankara, Turkey, 2012. (In Turkish) [Google Scholar]
  38. Bostancı, B.; Zeydan, M.; Çete, M.; Demir, H.; Karaağaç, A. Decision Making for Site Selection Using Fuzzy Modeling. J. Urban Plan. Dev. 2016, 143, 05016010. [Google Scholar] [CrossRef]
  39. Gabus, A.; Fontela, E. World Problems, An Invitation to Further Thought within the Framework of DEMATEL; Battelle Geneva Research Centre: Geneva, Switzerland, 1972. [Google Scholar]
  40. Herrera, F.; Herrera-Viedma, E.; Martinez, L. A fusion approach for managing multi-granularity linguistic term sets in decision making. Fuzzy Sets Syst. 2000, 114, 43–58. [Google Scholar] [CrossRef]
  41. Opricovic, S.; Tzeng, G.H. Compromise solution by MCDM methods: A comparative analysis of VIKOR and TOPSIS. Eur. J. Oper. Res. 2004, 156, 445–455. [Google Scholar] [CrossRef]
  42. Promentilla, M.A.B.; Furuichi, T.; Ishii, K.; Tanikawa, N. A fuzzy analytic network process for multi-criteria evaluation of contaminated site remedial counter measures. J. Environ. Manag. 2008, 88, 479–495. [Google Scholar] [CrossRef]
  43. Zadeh, L.A. Fuzzy sets. Inf. Control 1965, 8, 338–353. [Google Scholar] [CrossRef] [Green Version]
  44. Chang, B.; Chang, C.W.; Wu, C.H. Fuzzy DEMATEL method for developing supplier selection criteria. Expert Syst. Appl. 2011, 38, 1850–1858. [Google Scholar] [CrossRef]
  45. Dağdeviren, M. Integrated modelling the performance evaluation process with fuzzy AHP. Sigma J. Eng. Nat. Sci. 2007, 25, 268–282. [Google Scholar]
  46. Gottwald, S. An early approach toward graded identity and graded membership in set theory. Fuzzy Sets Syst. 2010, 161, 2369–2379. [Google Scholar] [CrossRef]
  47. Dalalah, D.; Hayajneh, M.; Batieha, F. A fuzzy multi-criteria decision making model for supplier selection. Expert Syst. Appl. 2011, 38, 8384–8391. [Google Scholar] [CrossRef]
  48. Hsc, C.-Y.; Chen, K.-T.; Tzeng, G.-H. FMCDM with Fuzzy DEMATEL Approach for Customers’ Choice Behavior Model. Int. J. Fuzzy Syst. 2007, 9, 236–246. [Google Scholar]
  49. Kamaike, M. Design elements in the passenger car development: The classification and the influence analysis in case of recreational vehicle. Bull. Jpn. Soc. Sci. Des. 2001, 48, 29–38. [Google Scholar]
  50. Yuzawa, A. A state and subjects of TMO conception for city core vitalization countermeasure: A case study of Maebashi TMO Conception. Bull. Maebashi Inst. Technol. 2002, 5, 61–67. [Google Scholar]
  51. Mohammadi, H.; Nouri, I.; Ehsanifar, M. Applying fuzzy DEMATEL method to analyze supplier selection criteria (Case study: WagonPars Company). Int. Res. J. Financ. Econ. 2013, 115, 76–86. [Google Scholar]
  52. Kazancoglu, Y.; Kazancoglu, I.; Sagnak, M. Fuzzy DEMATEL-based green supply chain management performance: Application in cement industry. Ind. Manag. Data Syst. 2018, 118, 412–431. [Google Scholar] [CrossRef]
  53. Falatoonitoosi, E.; Leman, Z.; Sorooshian, S.; Salimi, M. Decision-making trial and evaluation laboratory. Res. J. Appl. Sci. Eng. Technol. 2013, 5, 3476–3480. [Google Scholar] [CrossRef]
  54. Vardopoulos, I. Critical sustainable development factors in the adaptive reuse of urban industrial buildings. A fuzzy DEMATEL approach. Sustain. Cities Soc. 2019, 50, 101684. [Google Scholar] [CrossRef]
  55. Aksakal, E.; Dağdeviren, M. Yetenek yönetimi temelli personel atama modeli ve çözüm önerisi. Gazi Üniversitesi Mühendislik Mimar. Fakültesi Derg. 2015, 30. [Google Scholar] [CrossRef] [Green Version]
  56. Ghaleb, A.M.; Kaid, H.; Alsamhan, A.; Mian, S.H.; Hidri, L. Assessment and comparison of various MCDM approaches in the selection of manufacturing process. Adv. Mater. Sci. Eng. 2020, 2020, 4039253. [Google Scholar] [CrossRef]
  57. Danesh, D.; Ryan, M.J.; Abbasi, A. A systematic comparison of multi-criteria decision making methods for the improvement of project portfolio management in complex organisations. Int. J. Manag. Decis. Mak. 2017, 16, 280–320. [Google Scholar]
  58. Triantaphyllou, E. Multi-criteria decision making methods. In Multi-Criteria Decision Making Methods: A Comparative Study; Springer: Boston, MA, USA, 2000; pp. 5–21. [Google Scholar]
  59. Seker, S.; Zavadskas, E.K. Application of fuzzy DEMATEL method for analyzing occupational risks on construction sites. Sustainability 2017, 9, 2083. [Google Scholar] [CrossRef] [Green Version]
  60. Abbasi, M.; Hosnavi, R.; Tabrizi, B. Application of fuzzy DEMATEL in risks evaluation of knowledge-based networks. J. Optim. 2013, 2013, 913467. [Google Scholar] [CrossRef]
  61. Chen, C.-Y.; Wu, T.-S.; Li, M.-L.; Wang, C.-T. Integration of Importance-Performance Analysis and Fuzzy Dematel. Int. J. Comput. Sci. Inf. Technol. 2018, 10, 19–38. [Google Scholar] [CrossRef]
  62. Zhang, X.; Su, J. A combined fuzzy DEMATEL and TOPSIS approach for estimating participants in knowledge-intensive crowdsourcing. Comput. Ind. Eng. 2019, 137, 106085. [Google Scholar] [CrossRef]
  63. Wu, W.-W.; Lee, Y.-T. Developing global managers’ competencies using the fuzzy DEMATEL method. Expert Syst. Appl. 2007, 32, 499–507. [Google Scholar] [CrossRef]
  64. Malczewski, J. On the use of weighted linear combination method in GIS: Common and best practice approaches. Trans. GIS 2000, 4, 5–22. [Google Scholar] [CrossRef]
  65. Sujatha, E.R.; Rajamanickam, G.V. Landslide hazard and risk mapping using the weighted linear combination model applied to the Tevankarai Stream Watershed, Kodaikkanal, India. Hum. Ecol. Risk Assess. Int. J. 2015, 21, 1445–1461. [Google Scholar] [CrossRef]
  66. Hwang, C.-L.; Yoon, K. Multiple Attribute Decision Making: Methods and Applications a State-Of-The-Art Survey; Springer Science & Business Media: Berlin, Germany, 2012; Volume 186. [Google Scholar]
  67. Drobne, S.; Lisec, A. Multi-attribute decision analysis in GIS: Weighted linear combination and ordered weighted averaging. Informatica 2009, 33, 459–474. [Google Scholar]
  68. Stanimirovic, I.P.; Zlatanovic, M.L.; Petkovic, M.D. On the linear weighted sum method for multi-objective optimization. Facta Acta Univ. 2011, 26, 49–63. [Google Scholar]
  69. Başkurt, Z.M.; Aydin, C.C. Nuclear power plant site selection by Weighted Linear Combination in GIS environment, Edirne, Turkey. Prog. Nucl. Energy 2018, 104, 85–101. [Google Scholar] [CrossRef]
  70. Zeydan, M.; Bostancı, B.; Oralhan, B. A new hybrid decision making approach for housing suitability mapping of an urban area. Math. Probl. Eng. 2018, 2018, 7038643. [Google Scholar] [CrossRef]
  71. Kim, D.-Y.; Kumar, V. A framework for prioritization of intellectual capital indicators in R&D. J. Intellect. Cap. 2009, 10, 277–293. [Google Scholar]
  72. Qureshi, M.N.; Kumar, P.; Kumar, D. Framework for benchmarking logistics performance using fuzzy AHP. Int. J. Bus. Perform. Supply Chain. Model. 2009, 1, 82–98. [Google Scholar] [CrossRef]
Figure 1. Workflow in assessing the urban renewal projects from the aspect of urban design.
Sustainability 14 10543 g001
Figure 2. Presentation of area, where the urban renewal projects will be implemented, on the satellite map.
Sustainability 14 10543 g002
Figure 3. Areal conformity map of urban renewal projects by WLC method.
Sustainability 14 10543 g003
Figure 4. Graph of urban renewal projects from the aspect of design.
Sustainability 14 10543 g004
Table 1. Urban Renewal Areas in Kayseri.
DistrictNeighborhoodArea (ha)Population (Person)
KocasinanAhievran25.5240
KocasinanCırkalan260.55397
KocasinanSahabiye505341
KocasinanSeyrani5.1340
KocasinanUğurevler87.236240
KocasinanYunus Emre7.3780
KocasinanYıldızevler271628
KocasinanZiya Gökalp23.251568
MelikgaziAnbar5.8268
MelikgaziKaracaoğlu3.7284
MelikgaziKüçük Ali3.5336
MelikgaziKazım Karabekir321392
MelikgaziYeni85.532752
Total593.2121,566
Table 2. Linguistic scale and fuzzy triangular numbers used for fuzzy DEMATEL [63].
Linguistic ScaleAbbreviationFuzzy Triangular Numbers
No EffectN(0.00, 0.00, 0.25)
Very Low Level EffectVL(0.00, 0.25, 0.50)
Low Level EffectL(0.25, 0.50, 0.75)
High Level EffectH(0.50, 0.75, 1.00)
Very High Level EffectVH(0.75, 1.00, 1.00)
Table 3. Urban renewal project design assessment criteria and score values.
CodeCriterionToo Bad
(0.00)
Bad
(0.25)
Medium
(0.50)
Good
(0.75)
Very Good
(1.00)
Description
C1.1Typologic Diversity12345Number of rooms
C1.2Height>1310–128–94–70–3Number of floors
C1.3Smart Systems12345Technological opportunities
C1.4Usage Diversity12345Diversity in area usage
C1.5Scale-RatioX/5 (-)X/4X/3X/2X/2 + 7X *
C2.1Ownership/
Identity
<25%25%50%75%100%Protection rate, Texture continuity
C2.2Noise>10181–10066–8041–650–40Decibel
C2.3Security<1234>5Number of securing devices/arrangements
C2.4Neighborhood Social Relationship<1234>5Neighborhood opportunities –Number of apartments in floor
C2.5Centrality>54321Proximity to the center (km)
C2.6User Diversity1234>5Suitability for varying users (disabled, child, old, etc.)
C2.7Density>801601–800600–401400–201<200Net density value
C3.1Slope>21%20–1615–1110–6<5Slope (%)
C3.2Climate12345Number of climate data
C3.3Direction/Insolation>54321Number of floor on South/Floor
C3.4Geological Status>54321Earthquake analysis score
C3.5Energy Efficiency<1234>5Number of energy efficiency solutions (isolation, solar energy, etc.)
C4.1Playground>501+401–500301–400201–3000–200Distance (m)
C4.2Parks>501+401–501301–401201–3010–200Distance (m)
C4.3Public Areas3579>11Diversity
C4.4Parking Areas<4040–6060–8080–100100%Number of solutions
C5.1Education>801>801800–601600–401400Distance (m)
C5.2Health>12511001–1250751–1000501–7500–500Distance (m)
C5.3Religion>501>801800–601600–401400Distance (m)
C5.4Commerce>501>801800–601401–200<200Distance (m)
C5.5Sociocultural>501>801800–601600–401400Distance (m)
C5.6Sports>501401–501301–401201–3010–200Distance (m)
C6.1Relaxation12345Presence of general urban furniture; all the sub-criteria will be given the same value
C6.2Illumination12345
C6.3Garbage12345
C6.4Material Quality12345
C6.5Technology12345
C7.1Bus12345Number of lines
C7.2Rail System>501>801800–601401–200<200Distance (m)
C7.3Private Vehicle>50 m30–40 m20–30 m20–0 mUndergroundDistance (m)
C7.4Pedestrian/Disabled12345Number of solutions
C7.5Non-motorized Vehicle12345Number of solutions
* X is analyzed by taking the distances between structures and the heights of neighboring buildings into consideration.
Table 4. General characteristics of the members of the focus group.
MemberAgeSexEducationOccupationInstitutionExpertise
A36MalePh.D.Urban Planner/AcademicErciyes
University
Urban Design, Urban Renewal, Urban Projects
B36FemalePh.D.Architect/AcademicErciyes UniversityUrban Design, Urban Projects
C37FemalePh.D.Architect/AcademicErciyes UniversityUrban Renewal, Urban Design, Urban Projects
D38MalePh.D.Architect/AcademicErciyes UniversityUrban Renewal, Urban Design, Urban Projects
E33FemalePh.D.Urban Planner/AcademicErciyes UniversityUrban Renewal Areas, Large-Scale Urban Project Areas
F37MalePh.D.Urban PlannerKadıköy Municipality-İstanbulUrban Renewal Projects, Urban Project Areas
G40MalePh.D.Survey Engineer/AcademicErciyes UniversityGIS, Urban Projects, Urban Renewal
H48MalePh.D.Survey Engineer/AcademicErciyes UniversityGIS, Urban Project Areas, Urban Renewal
Table 5. Linguistic scale for main criteria.
Criterion NameC1C2C3C4C5C6C7
C1Construction Characteristics HVHLNNN
C2Project Area CharacteristicsH VHVHHLVH
C3Conformity to Natural StructureVHH HNNH
C4Green Area/Public AreaVLLVL HVHN
C5Social Reinforcement AreaNHLH LH
C6Urban FurnitureNVLNHVL N
C7AccessibilityHVHHHHN
Table 6. Normalized direct relationship matrix for main criteria (X).
C1C2C3C4C5C6C7
C10.000000.166670.219700.113640.007580.007580.00758
C20.166670.000000.219700.219700.166670.113640.21970
C30.219700.166670.000000.166670.007580.007580.16667
C40.060610.113640.060610.000000.166670.219700.00758
C50.007580.166670.113640.166670.000000.113640.16667
C60.007580.060610.007580.166670.060610.000000.00758
C70.166670.219700.166670.166670.166670.007580.00000
Table 7. Total relationship matrix for main criteria (T).
C1C2C3C4C5C6C7
C10.228270.412900.443180.400010.193590.171060.21047
C20.530540.501850.638840.734560.494480.401120.53146
C30.482670.510260.347980.538550.267340.223510.39075
C40.238640.356500.283330.302990.335640.370360.19597
C50.286050.497290.417680.543290.265050.327970.39847
C60.105940.192330.129040.306480.169510.111010.10355
C70.489970.627570.556690.627840.453520.278690.31682
Table 8. Main criteria weights calculated by using fuzzy DEMATEL.
CriteriaDRD + RD-RWiNormalized Wi
C12.05952.36214.4215−0.30264.43190.1219
C23.83293.09876.93150.73426.97030.1917
C32.76112.81675.5778−0.05575.57810.1534
C42.08343.45375.5371−1.37035.70420.1569
C52.73582.17914.91490.55674.94640.1360
C61.11791.88373.0016−0.76593.09770.0852
C73.35112.14755.49861.20365.62880.1548
Table 9. Weights calculated for main and sub-criteria by using fuzzy DEMATEL.
Main CriteriaCodeSub-Criteria NameWeight
(Intragroup)
Weight
(General)
Order of
Significance
C1: Construction Characteristics
(0.1219)
C1.1Structure Diversity0.24820.030314
C1.2Structure Heights0.23340.028518
C1.3Smart Systems0.08700.010636
C1.4Usage Diversity0.22300.027220
C1.5Scale-Ratio0.20840.025423
C2: Project Area Characteristics
(0.1917)
C2.1Ownership/Identity0.12320.023624
C2.2Noise0.10420.020030
C2.3Security0.15860.030413
C2.4Neighborhood-Social Relationship0.15120.029016
C2.5Centrality0.16480.031612
C2.6User Diversity0.14060.027021
C2.7Density0.15740.030215
C3: Conformity to Natural Structure
(0.1534)
C3.1Slope0.14890.022825
C3.2Climate0.14890.022826
C3.3Direction/Insolation0.28000.04303
C3.4Geological Status0.13220.020329
C3.5Energy Efficiency0.29000.04452
C4: Green Area/Public Area
(0.1569)
C4.1Playground0.25760.04045
C4.2Parks0.26910.04224
C4.3Public Areas0.29970.04701
C4.4Parking Lot0.17360.027219
C5: Social Reinforcement Area
(0.1360)
C5.1Education0.19470.026522
C5.2Health0.09600.013134
C5.3Religious Facilities0.02250.003137
C5.4Commerce0.21070.028717
C5.5Sociocultural0.24130.03289
C5.6Sports0.23470.031911
C6: Urban Furniture
(0.0852)
C6.1Relaxation0.25810.022027
C6.2Illumination0.18410.015733
C6.3Garbage0.13020.011135
C6.4Material Quality0.18940.016132
C6.5Technology0.23820.020328
C7: Accessibility
(0.1548)
C7.1Bus0.21940.03407
C7.2Rail System0.21110.032710
C7.3Private Vehicle0.11490.017831
C7.4Pedestrian/Disabled0.24010.03726
C7.5Non-motorized Vehicle0.21450.03328
Table 10. WLC Suitability Values Calculated for Urban Renewal Projects.
NeighborhoodWLC Suitability Value
Anbar0.28
Karacaoğlu0.32
Küçükali0.39
Kazım Karabekir0.34
Yeni0.30
Ahievran0.40
Cırkalan0.29
Sahabiye0.33
Seyrani0.42
Uğurevler0.34
Yunus Emre0.25
Yıldızevler0.28
Ziyagökalp0.43
Publisher’s Note: MDPI stays neutral with regard to jurisdictional claims in published maps and institutional affiliations.

