Article

Seasonal Variations in Grain Yield, Greenhouse Gas Emissions and Carbon Sequestration for Maize Cultivation in Bangladesh

by
Jatish Chandra Biswas
1,
Md. Mozammel Haque
2,
Md. Belal Hossain
2,
Md. Maniruzzaman
2,
Taslima Zahan
3,*,
Md. Mizanur Rahman
4,
Ranjit Sen
3,
Sheikh Ishtiaque
3,
Apurbo K. Chaki
3,
Imrul Mossadek Ahmed
3,
Shahrina Akhtar
1,
Faruque Ahmmed
3,
Md. Faruque Hossain
3,
Sohela Akhter
3,
Mohammad Kamruzzaman
2,
Jiban Krishna Biswas
1,
Amnah Mohammed Alsuhaibani
5,
Ahmed Gaber
6 and
Akbar Hossain
7,*
1
Krishi Gobeshona Foundation, BARC Complex, Dhaka 1215, Bangladesh
2
Bangladesh Rice Research Institute, Gazipur 1701, Bangladesh
3
Bangladesh Agricultural Research Institute, Gazipur 1701, Bangladesh
4
Department of Soil Science, Bangabandhu Sheikh Mujibur Rahman Agricultural University, Gazipur 1706, Bangladesh
5
Department of Physical Sport Science, College of Education, Princess Nourah bint Abdulrahman University, P.O. Box 84428, Riyadh 11671, Saudi Arabia
6
Department of Biology, College of Science, Taif University, P.O. Box 11099, Taif 21944, Saudi Arabia
7
Department of Agronomy, Bangladesh Wheat and Maize Research Institute, Dinajpur 5200, Bangladesh
*
Authors to whom correspondence should be addressed.
Sustainability 2022, 14(15), 9144; https://doi.org/10.3390/su14159144
Submission received: 13 June 2022 / Revised: 20 July 2022 / Accepted: 22 July 2022 / Published: 26 July 2022
(This article belongs to the Special Issue Greenhouse Gas Mitigation towards Sustainable Agriculture)

Abstract

:
Rationale: Greenhouse gas (GHG) emissions from crop agriculture are of great concern in the context of changing climatic conditions; however, in most cases, data based on lifecycle assessments are not available for grain yield variations or the carbon footprint of maize. The current study aimed to determine net carbon emissions and sequestration for maize grown in Bangladesh. Methods: The static closed-chamber technique was used to determine total GHG emissions using data on GHG emissions from maize fields and secondary sources for inputs. A secondary source for regional yield data was used in the current study. GHG emission intensity is defined as the ratio of total emissions to grain yield. The net GHG emission/carbon sequestration was determined by subtracting total GHG emissions (CO2 eq.) from net primary production (NPP). Results: Grain yields varied from 1590 to 9300 kg ha−1 in the wet season and from 680 to 11,820 kg ha−1 in the dry season. GHG emission intensities were 0.53–2.21 and 0.37–1.70 kg CO2 eq. kg−1 grain in the wet and dry seasons, respectively. In Bangladesh, the total estimated GHG emissions were 1.66–4.09 million tonnes (MT) CO2 eq. from 2015 to 2020, whereas the net total CO2 sequestration was 1.51–3.91 MT. The net CO2 sequestration rates were 984.3–5757.4 kg ha−1 in the wet season and 1188.62–5757.39 kg ha−1 in the dry season. This study observed spatial variations in carbon emissions and sequestration depending on growing seasons. In the rice–maize pattern, maize sequestered about 1.23 MT CO2 eq. per year−1, but rice emitted about 0.16 MT CO2 eq. per year−1. This study showed potential spatiotemporal variations in carbon footprints. Recommendation: Special care is needed to improve maize grain yields in the wet season. Fertiliser and water use efficiencies need to be improved to minimise GHG emissions under changing climatic conditions. Efforts to increase the area under cultivation with rice–maize or other non-rice crop-based cropping systems are needed to augment CO2 sequestration. The generation of a regional data bank on carbon footprints would be beneficial for combating the impact of climate change.

1. Introduction

In many countries, the quantity of cereal grains produced governs food and nutritional security. A good harvest depends on climatic variability, management options and soil fertility [1,2,3]. The influence of production environment is particularly evident outside the core production zone. Varietal differences are also responsible for yield variability depending on the environment, especially temperature, which plays a critical role [3,4,5,6]. Among many management options, fertiliser rate and application patterns not only influence grain yield but also modulate GHG emissions [4,7] and, thus, control the carbon footprint.
Carbon is the backbone of life processes and significantly influences soil [8] and atmospheric properties depending on its form. It is established that emissions of carbon in the form of CO2 and methane (CH4) from agriculture are contributing to global warming [9,10]. However, carbon balance can also be a good indicator of soil fertility and environmental pollution [11]. In developing countries, most of us are somewhat familiar with carbon emissions from agriculture (mostly from organic amendments, livestock and rice cultivation, and also from tropical deforestation) because of numerous pronouncements from different quarters of the globe [12,13]. Unfortunately, there are no adequate data, in many developing countries, for delineating scenarios on the emission or sequestration of carbon during the cultivation of major crops. Depending on crop husbandry, carbon emissions vary greatly and, thus, either net emissions or carbon sequestration are possible. For instance, the quantities of GHGs emitted from flooded paddy fields and rainfed rice fields are not similar to those of maize or wheat crop fields grown under upland conditions [14,15,16].
Rice and wheat are the dominant cereals in Bangladesh; maize is third in terms of area coverage. The area under maize cultivation is increasing because of its diversified uses and economic profitability. It covers about 0.47 million ha, yielding about 4.02 MT [17]. Maize is grown in the wet and dry seasons in Bangladesh utilising considerable amounts of inputs, including pesticides, fertilisers and irrigation water. The use of inputs at variable rates during crop culture influences GHG emissions from the field not only directly but also indirectly because GHG emissions are also generated during the production of the inputs [11]. Lifting-up irrigation waters using fossil fuels or electricity also influences GHG emissions [18]. Moreover, agricultural operations are not fully mechanised in Bangladesh; rather, different sources of energy are used for growing maize and in its post-harvesting processes [19]. Labour forces are also responsible for GHG emissions [20], and that fact has not yet been considered in the determination of total emissions from crop cultivation. However, even if labour forces were not utilised in crop culture, they would still emit GHGs. As the use of production inputs (fertilisers, agrochemicals, etc.) and their manufacturing greatly influence carbon emission patterns across countries and even within a country [21,22], it is necessary to determine the carbon footprint of maize based on a life cycle analysis (LCA).
Agriculture is contributing to the rise in global surface temperatures because of GHG emissions [10,22] that have variable warming potential [23]. On the other hand, crop plants fix CO2 during photosynthesis and store it in grains, straw, roots and in the soil as root exudates [24,25]. So, it needs to be determined whether there is net emission or carbon fixation by considering net primary production (NPP) and emissions under specific crop growing conditions [26,27,28]. Typically, all components of crop production practices are considered in calculating emissions, both direct and indirect, from agricultural crop fields. Currently, no such data are available in Bangladesh, where maize cultivation utilises energy from the human labour–animal–engine nexus. Moreover, GHG emission scenarios differ between tropical and temperate countries. Therefore, we measured GHG emissions from maize fields and estimated emissions and net carbon sequestration from 2015 to 2020 in Bangladesh, considering both direct and indirect emissions as well as NPP.

2. Materials and Methods

2.1. Experimental Procedures

The field experiment was conducted at the Bangladesh Agricultural Research Institute (BARI) farm in Gazipur, Bangladesh, during the dry seasons (rabi seasons) of 2018–2019 and 2019–2020. The soil belongs to the category of Grey Terrace soils of the Madhupur tract (AEZ-28). The recommended dose (RD) of nitrogen (225 kg ha−1) in the form of prilled urea (PU) at 225 kg N ha−1 was used. Phosphorus, K, S, Zn and B were applied at rates of 60, 110, 40, 4 and 1.4 kg ha−1 from DAP, MoP, gypsum, zinc sulphate and boric acid, respectively. All of the PKSZnB was applied at the time of final land preparation. One-third of the PU was applied one day before sowing, and the remaining two-thirds were applied by broadcasting in equal parts at 40 days after sowing (DAS) and at 75 DAS. The unit plot size was 4 m × 2.5 m. The tested crop was BARI Hybrid Maize-9. Maize seed was sown at 60 cm × 20 cm spacing in the first week of December of 2018 and 2019. All intercultural operations, such as irrigation, weeding, insect control, etc., were done as and when necessary. The harvesting of the maize was done in mid-April of 2019 and 2020. Data concerning maize area and yields were collected from the Bangladesh Bureau of Statistics for all growing seasons from 2015–2016 to 2019–2020 [29]. Since only grain yields were available from the BBS data, stover yields were determined from the existing literature [30,31] according to the following formula:
SYM   = G r a i n   y i e l d 0.723118
where SYM is the stover yield of maize in t ha−1.
Net below-ground carbon (C) was estimated according to Amos and Walters, 2006, as follows:
Net   below - ground   C   ( kg   ha - 1 )   =   Shoot   biomass   C   ( kg   ha - 1 )     0.29
Litter C deposition was taken as about 7.5 kg ha−1.

2.2. Greenhouse Gas Measurement

N2O and CO2 gas samples were collected from static closed chambers [28,32,33,34] placed between crop rows. The chamber size was 0.20 m × 0.20 m, and each chamber was equipped with a circulating fan and thermometer. Chambers were kept open at all times except during sample collectionat, 8:00 AM–12:00 noon in a single day at 7-day intervals. Gas samples were collected in 50 mL air-tight syringes at 0 and 30 min after closing the chamber and were then transferred into 20 mL air-evacuated glass vials sealed with a butyl rubber septum. Gas samples were analysed by gas chromatography (Shimadzu, GC-2014, Kyoto, Japan) equipped with a Porapak NQ column (Q 80–100 mesh). N2O and CO2 emissions were determined by ECD and TCD at 45 °C and 70 °C for CO2 and N2O, respectively. The injector and detector were adjusted at 75 °C and 270 °C, respectively, for CO2 and 80 °C and 320 °C, respectively, for N2O. Argon and helium were the carrier gases, and air and H2 were used as burning gases.
Gas fluxes were estimated according to Lou et al. [35], as follows:
M   =   Q   × A B × Δ d Δ p × 273 T
where M is the emission rate of CO2 (mg m−2 hr−1) and N2O (μg m−2 hr−1), Q is the gas density of CO2 and N2O in mg cm3, W is chamber volume in m3, B is chamber surface in m2, Δd/Δp is the rate of increase in GHG concentrations in mg m−3 hr−1 and T is the chamber temperature (273 + mean temperature) in °C.
Seasonal fluxes of CO2 and N2O (SCCN) were estimated according to Singh et al. [36]:
SCCN   flux = f e ( Ui   ×   Vi )
where Ui indicates the rate of CO2 and N2O flux (g m−2 d−1) at the ith sampling interval, Vi represents the day numbers for the fth sampling interval and e is the sampling number.
About 30–62% of people emit CH4 [20]. We used a value of 45% of the labour force and calculated the CH4 they produced in 8 working hours. Finally, the GHG emission factors (kg CO2 eq. ha−1) were calculated as shown in Table 1. However, the data sources were lacking in many instances; in such cases, data were estimated based on the existing literature and expert judgement.
Based on field emission data, the net ecosystem C balance (NECB) in kg CO2 eq ha−1 was calculated according to [27,28,37] and the net primary product (NPP, above- and below-ground biomass, litter and rhizodeposits in kg ha−1) according to Smith et al. [26]:
NECB = NPP − Recosystem respiration − Harvest − CH4 + Manure/Fertiliser
NPP = NPPgrain + NPPstraw + NPProot + NPPlitter + NPPrhizodeposit
Net CO2 sequestration (NCS) in kg CO2 ha−1 was calculated as follows:
NCS = NECB − N2O emissions (kg CO2 eq ha−1) − IDE (kg CO2 eq ha−1)
where the harvest includes grain and straw, CH4 is the amount of methane as kg CO2 ha−1 and IDE is the indirect emissions (kg CO2 eq ha−1) in relation to crop production.
GHG emission intensity (GHGI) was estimated as per the following formula:
G H G I   ( k g   C O 2   e q   k g 1   g r a i n ) = T o t a l   e m i s s i o n s   ( k g   h a 1 ) G Y i
where GYi is the grain yield (kg ha−1) of the ith district (i = 1, 2, 3 …….. 64)
Carbon dioxide sequestration intensity (kg CO2 kg−1 grain) was determined as follows:
C O 2   s e q .   i n t e n s i t y = T o t a l   n e t   C O 2   s e q u e s t e r   ( k g   h a 1 ) G Y i
where GYi is the grain yield (kg ha−1) of the ith district (i = 1, 2, 3 …….. 64)
The net CO2 sequestration rate was calculated as follows:
C O 2 s e q .   r a t e   ( k g   h a 1 ) = C O 2 s e q .   i n t e n s i t y G r a i n   y i e l d   in   each   district  
Total GHG emissions were calculated as follows:
T o t a l   G H G   e m i s s i o n s = M e a s u r e d   e m i s s i o n s   ( k g   h a 1 ) A r e a   ( h a )
Total net CO2 sequestration was determined by multiplying equation number 10 by area coverage.

2.3. Statistical Tools Used in the Current Study

Descriptive statistics were mostly used to show the variations in GHG emissions and net CO2 fixation in relation to maize. Quantum Geographic Information System (QGIS) version 2.18 was used to show the spatial distribution of total GHG emissions and net CO2 fixation in different districts of Bangladesh.

3. Results

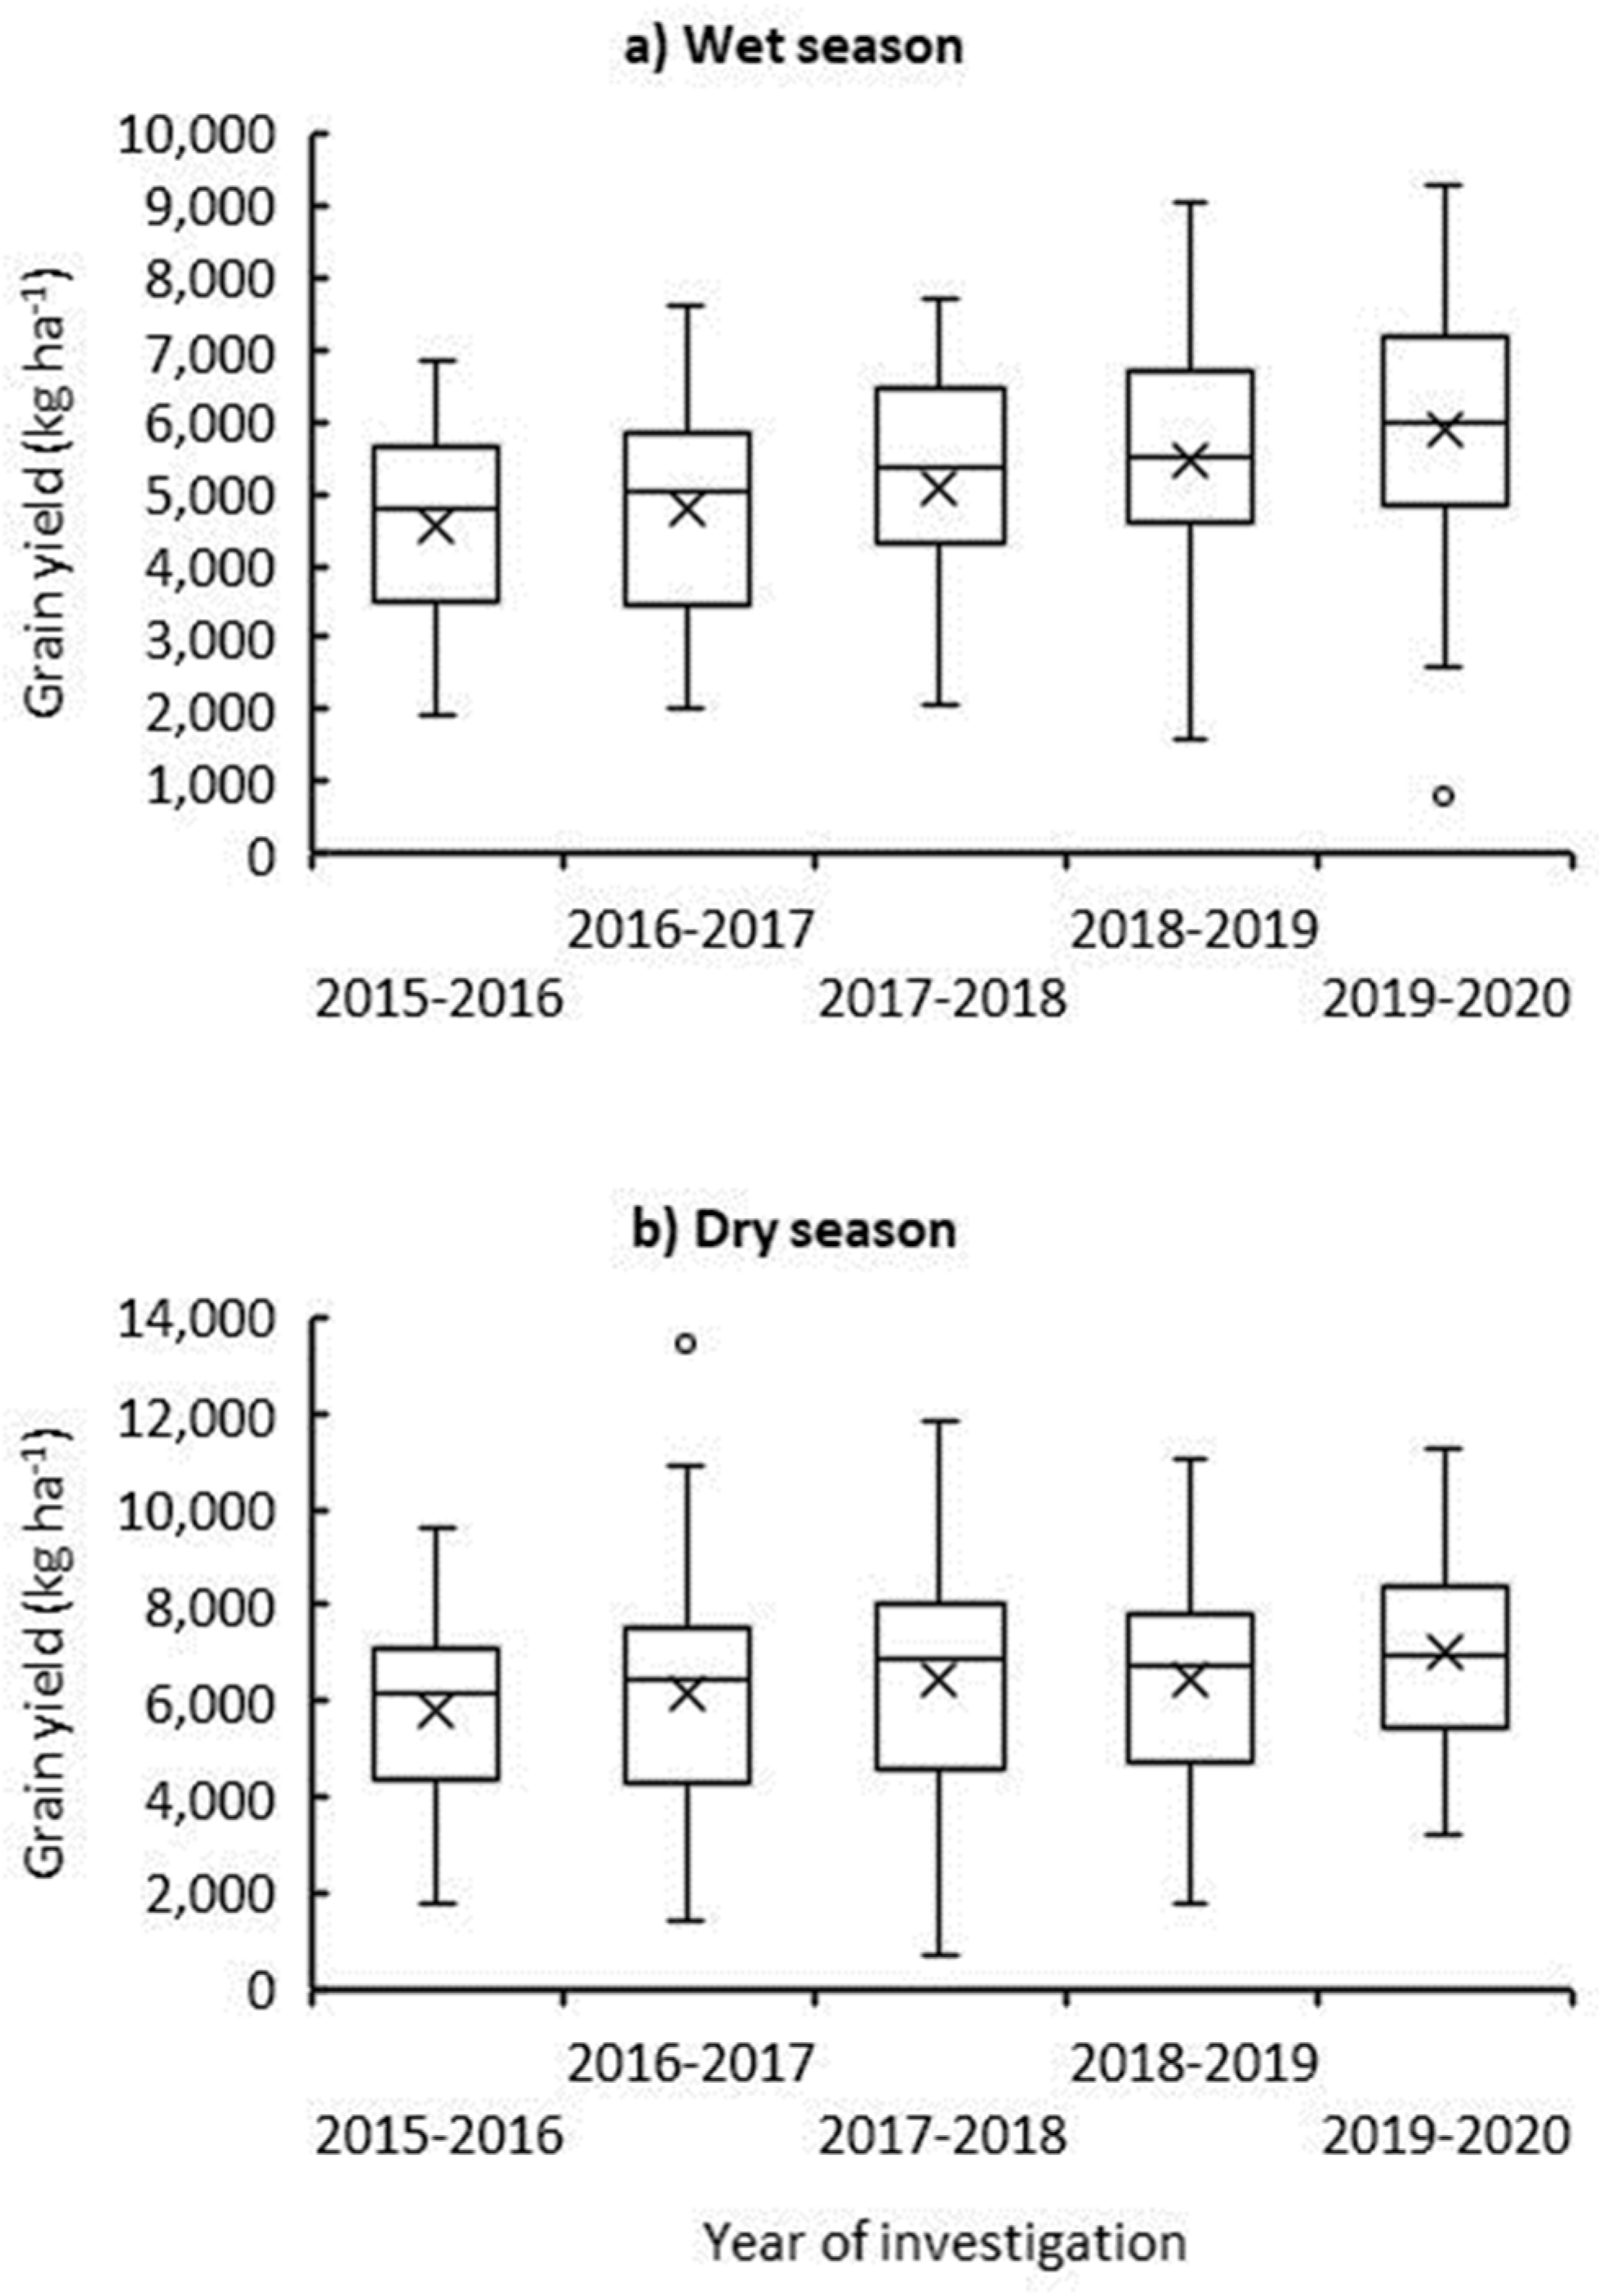
3.1. Seasonal Grain Yield Variability

The grain yield of maize varied significantly with the growing seasons over the years (Figure 1). Ignoring the outlier values, the grain yield varied from 4810 to 5970 kg ha−1 in the wet season, considering the 50th percentile, while it varied from 6144 to 6964 kg ha−1 in the dry season (Figure 1a,b). Similarly, the range of the yield varied from 5652 to 7157 and from 7096 to 8386 kg ha−1 in the wet and dry seasons, respectively, considering 75th percentile. However, there were wide variations in grain yields, which ranged from 1590 to 9300 kg ha−1 in the wet season and from 680 to 11,820 kg ha−1 in the dry season, excluding outliers.
Table 1. Greenhouse gas emissions during maize cultivation.
ItemsEmissions
(kg ha−1)
Comments
Land preparation156.146About 80% of the land was prepared by a power tiller and 20% by a tractor [19]. About 45% of labour force emits CH4 at 1.12 kg CO2 capita−1 man-day−1 (adapted from https://badgut.org). Diesel-burning emissions of 3.56 kg CO2 L−1 [38].
Seed (21 kg ha−1)23.52Seed rate 21–23 kg ha−1 [39] and CO2 eq emissions of 1.12 kg ha−1 [40].
Seeding10.08About 20 man-days ha−1 for manual seeding. About 45% of labour force emits CH4 at 1.12 kg CO2 eq. man-day1.
Fertilisers2152.702Fertiliser at 484–214–166 kg ha−1 for urea, TSP and MoP, respectively [41]. One-fifth of urea is generally imported. For imported and manufactured urea, the GHGs were 0.93 and 4 kg CO2 kg−1, respectively, and 1.29 kg CO2 eq kg−1 for TSP and 1.47 kg CO2 eq kg−1 for MoP [42,43].
Irrigation-3x1594.13The average water requirement for maize is 398.56 mm ha−1 [44]. GHG emissions were estimated based on [18].
Insecticide-2x69.44About 250 mL ha−1 was used for one spray. The emissions considered were 21.7 kg CO2 eq. ha−1 [45].
Weeding-2x21.28About 42 man-day ha−1 for hand weeding [17].
Harvesting15.68Harvesting is mostly done manually and requires about 31 man-day ha−1.
Shelling/Threshing115.380496% of maize is threshed by machine [46] and the rest is threshed manually. Diesel burning emits 3.56 kg CO2 eq. ha−1 [38].
Steel-embedded emissions for thresher3.375Emissions at 2.7 kg CO2 eq. kg−1 steel [42]. In 5 years, open-drum threshing for 300 ha and close-drum for 600 ha.
Total indirect4161.733
Field-measured
N2O (as CO2 eq.)111.3
Respiratory CO2673.64
Total direct784.94
Grand total4946.673

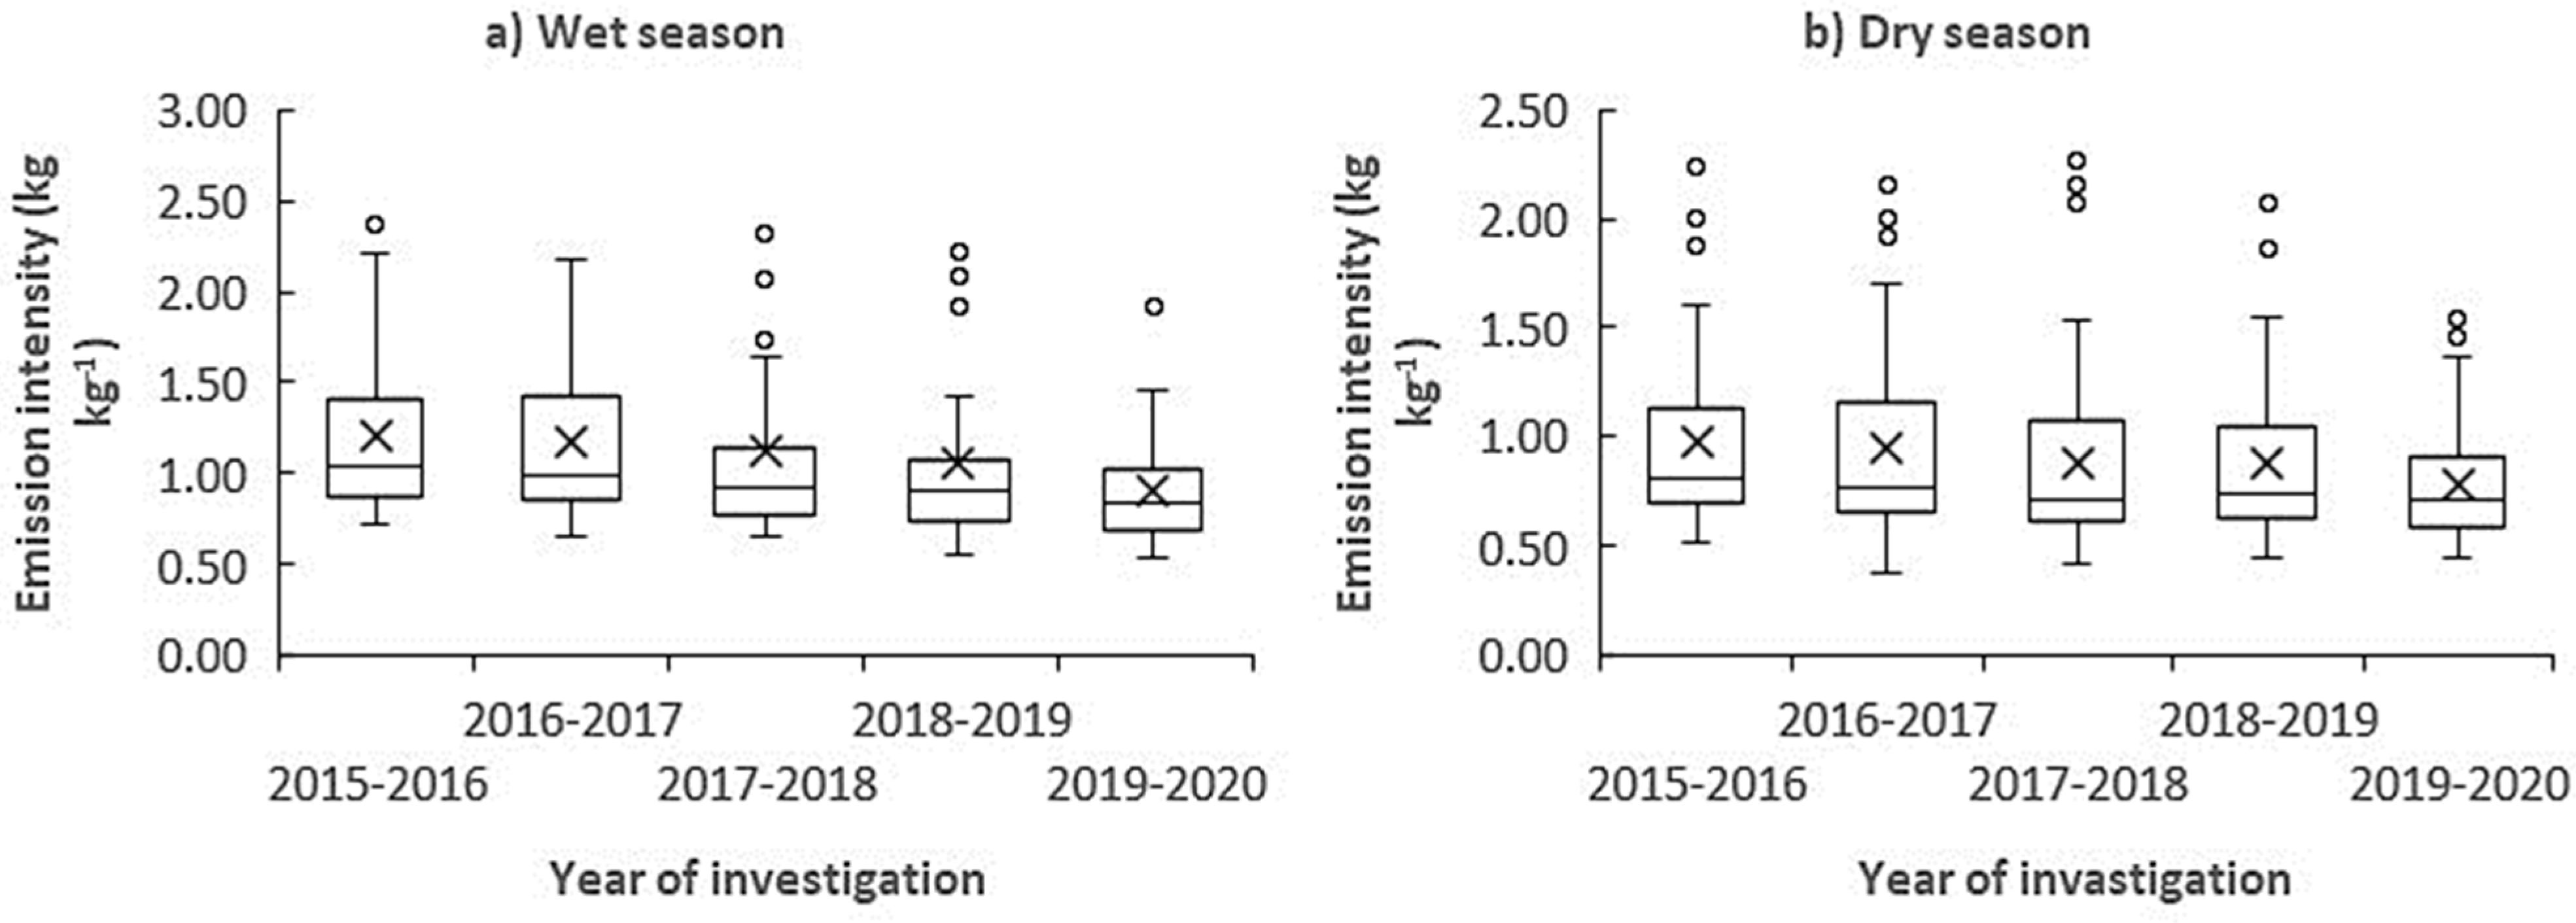
3.2. Seasonal GHG Emission Intensity

There were significant variations in GHG emission intensity in the growing seasons over the years. As a whole, GHG emission intensity varied from 0.53 to 2.21kg CO2 eq. kg−1 grain yield in the wet season, excluding outlier values (Figure 2a), and it varied from 0.37 to 1.70 kg kg−1 in the dry season (Figure 2b). Considering the 50th percentile, the emission intensity was 0.83–1.03 kg kg−1 in the wet season and 0.71–0.81 kg kg−1 in the dry season. Similarly, it was 1.02–1.43 kg kg−1 in the wet season and 0.91–1.15 kg kg−1 in the dry season when considering the 75th percentile.

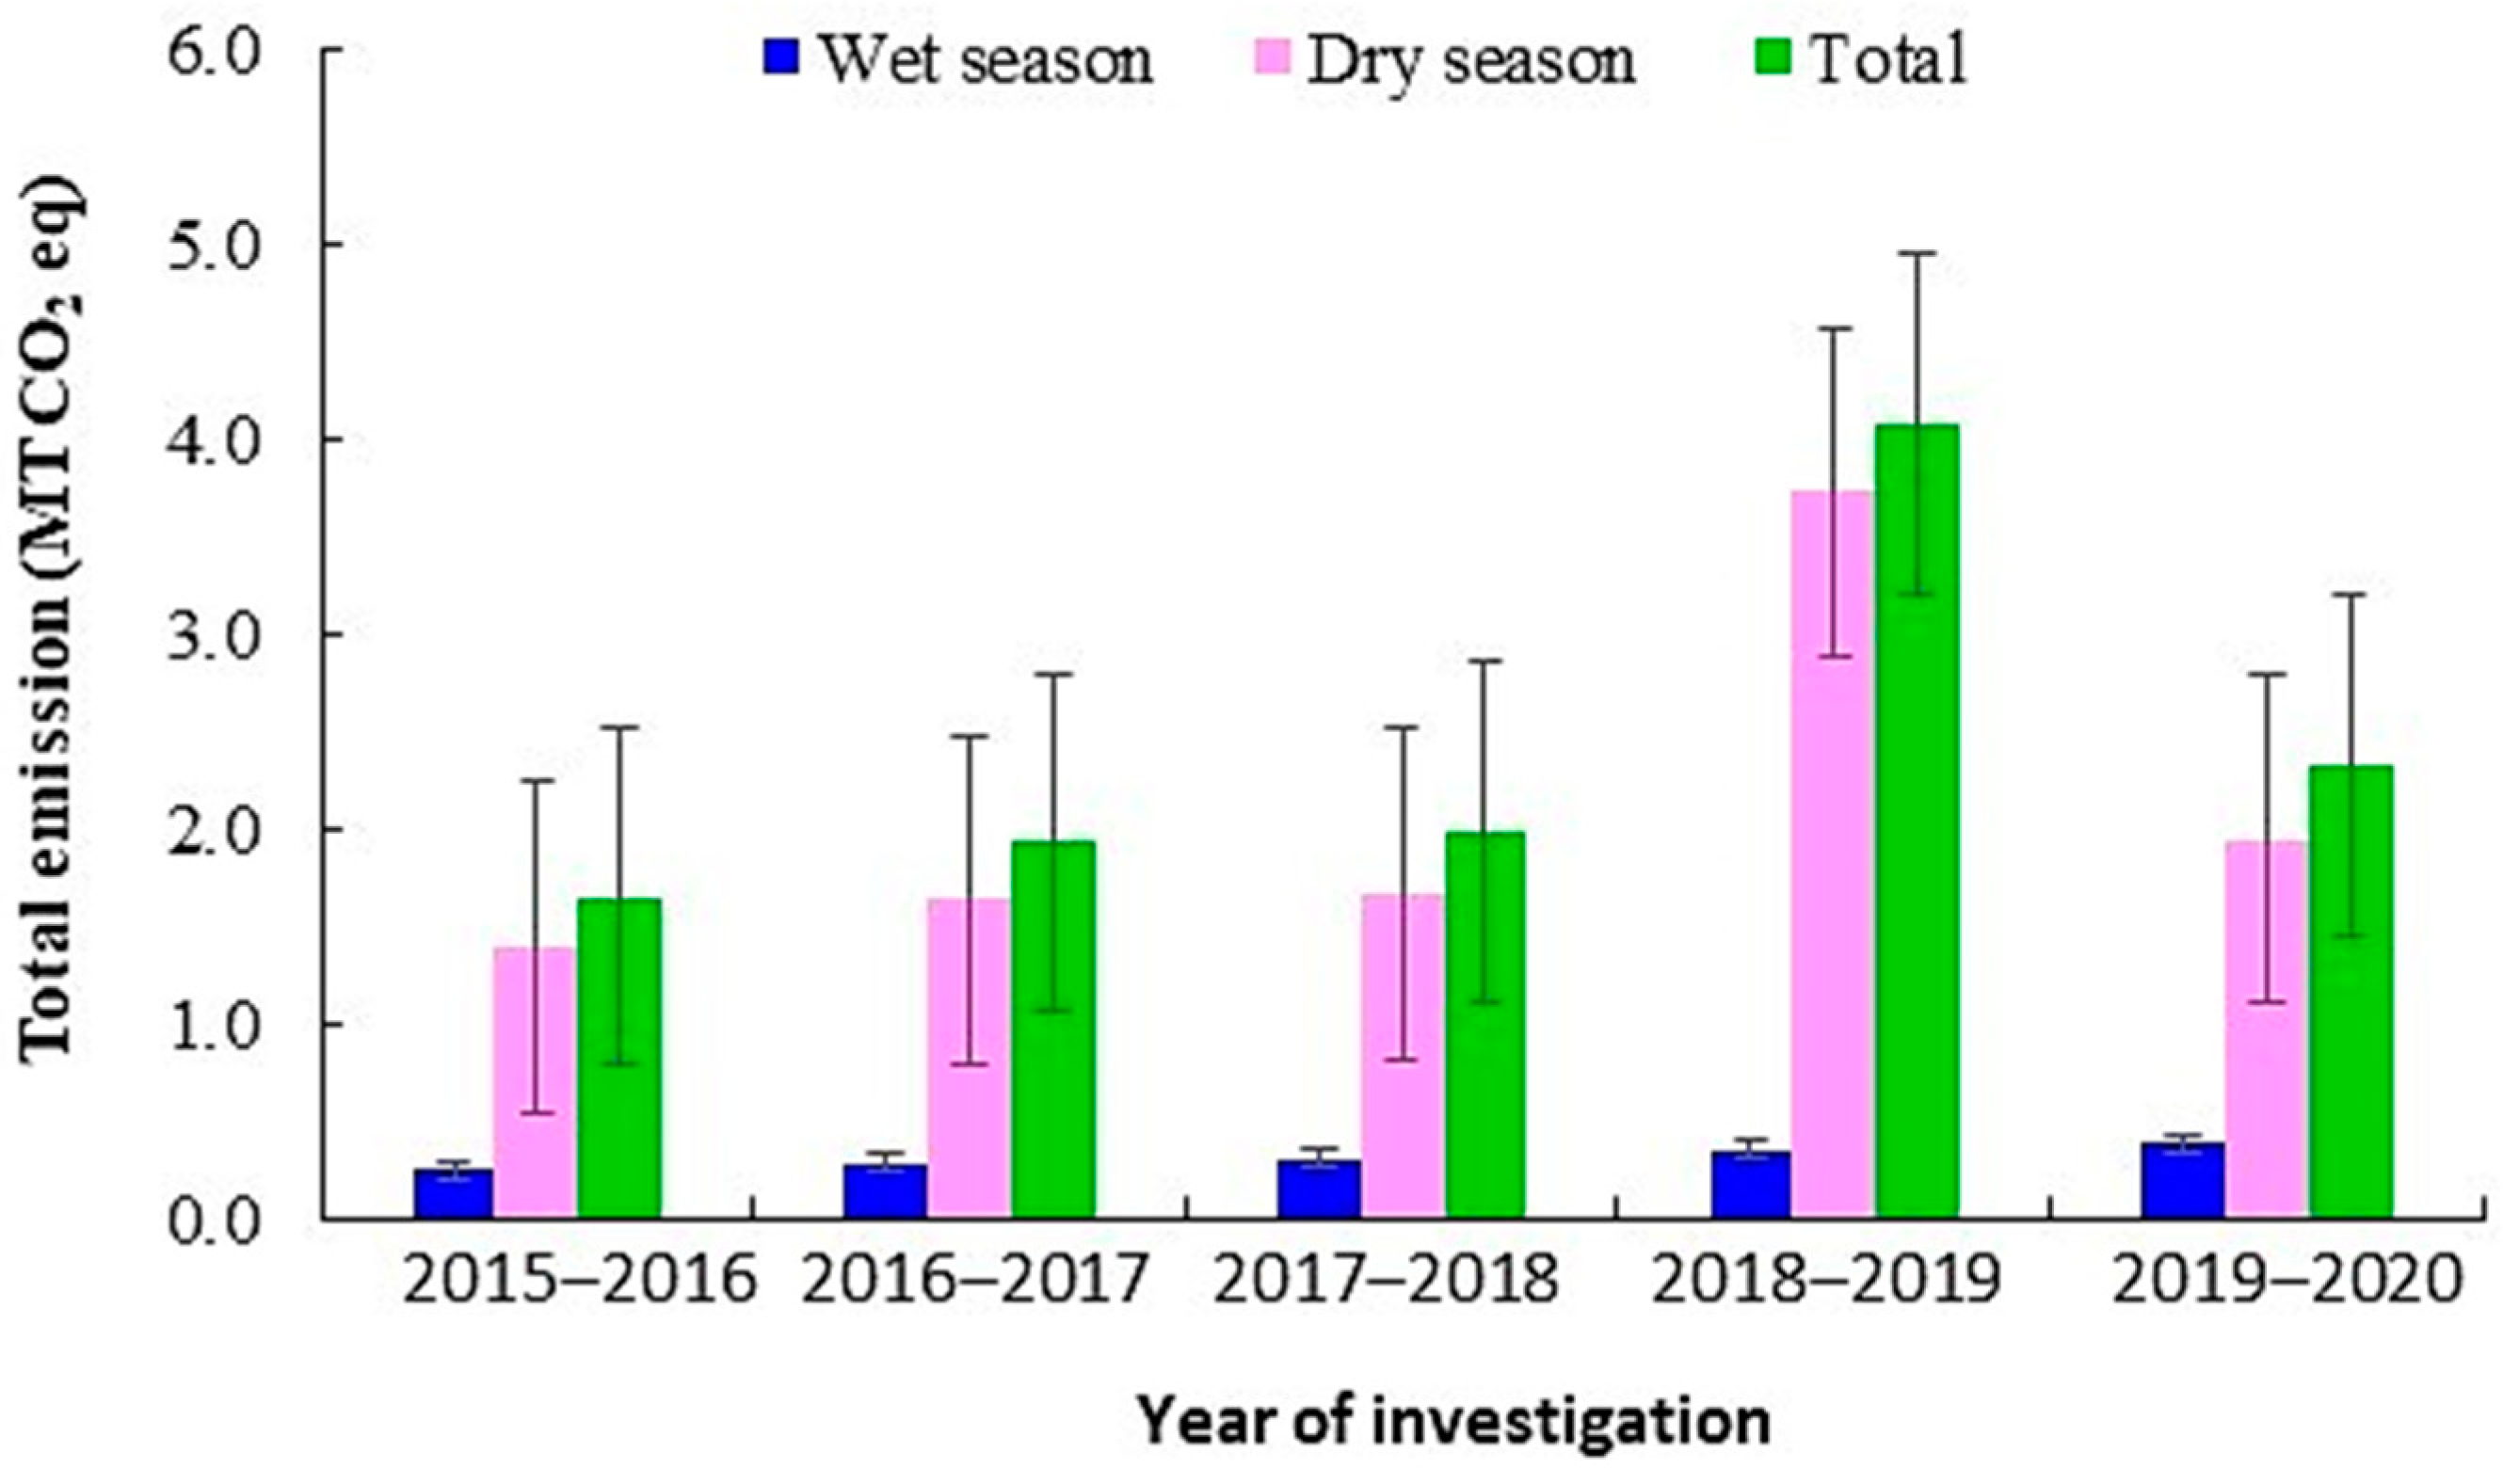
3.3. Seasonal Total GHG Emissions

Total GHG emissions during maize cultivation varied greatly. In the wet season, total GHG emissions varied from 0.26 to 0.39 MT over the years studied, although such variations ranged from 1.40 to 3.73 MT in the dry season (Figure 3). Considering both growing seasons, the total GHG emissions ranged from 1.66 to 4.09 MT.

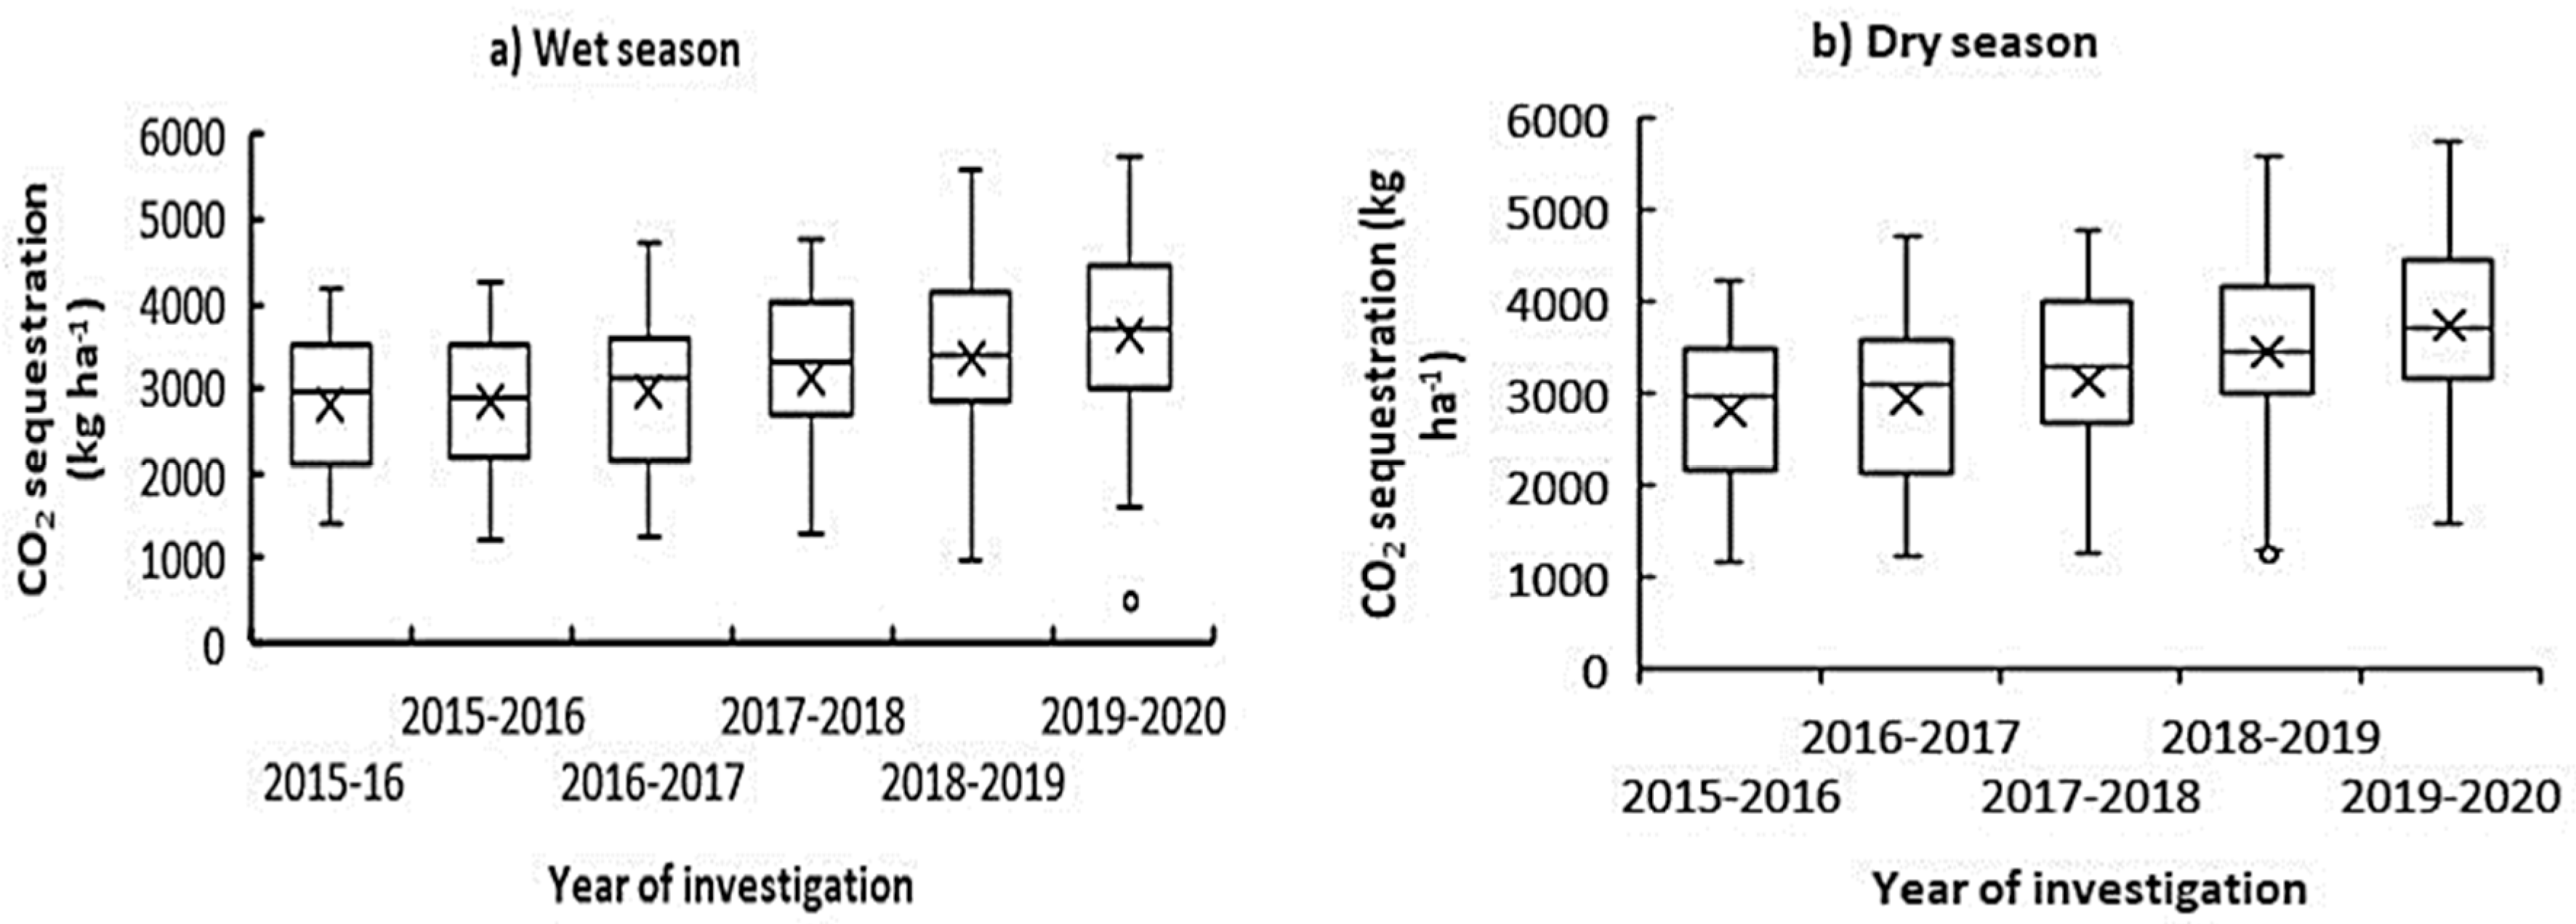
3.4. Net Carbon Sequestration Rate

The net carbon sequestration rate, as with CO2, varied significantly over the growing seasons during the 2015–2020 period (Figure 4). In the wet season, the net CO2 sequestration rate ranged from 2977.75 to 3695.87 kg ha−1 considering the 50th percentile and from 3499.32 to 4431.02 kg ha−1 based on the 75th percentile. However, in the same season, the minimum net CO2 sequestration rate was 984.33 kg ha−1 and the maximum rate was 5757.38 kg ha−1, excluding the outlier values. The net CO2 sequestration rate in the dry season ranged from 2977.75 to 3726.83 kg ha−1 considering the 50th percentile and from 3499.32 to 4475.33 kg ha−1 based on the 75th percentile, although the minimum sequestration rate was 1188.62 kg ha−1 and the highest rate was 5757.39 kg ha−1.

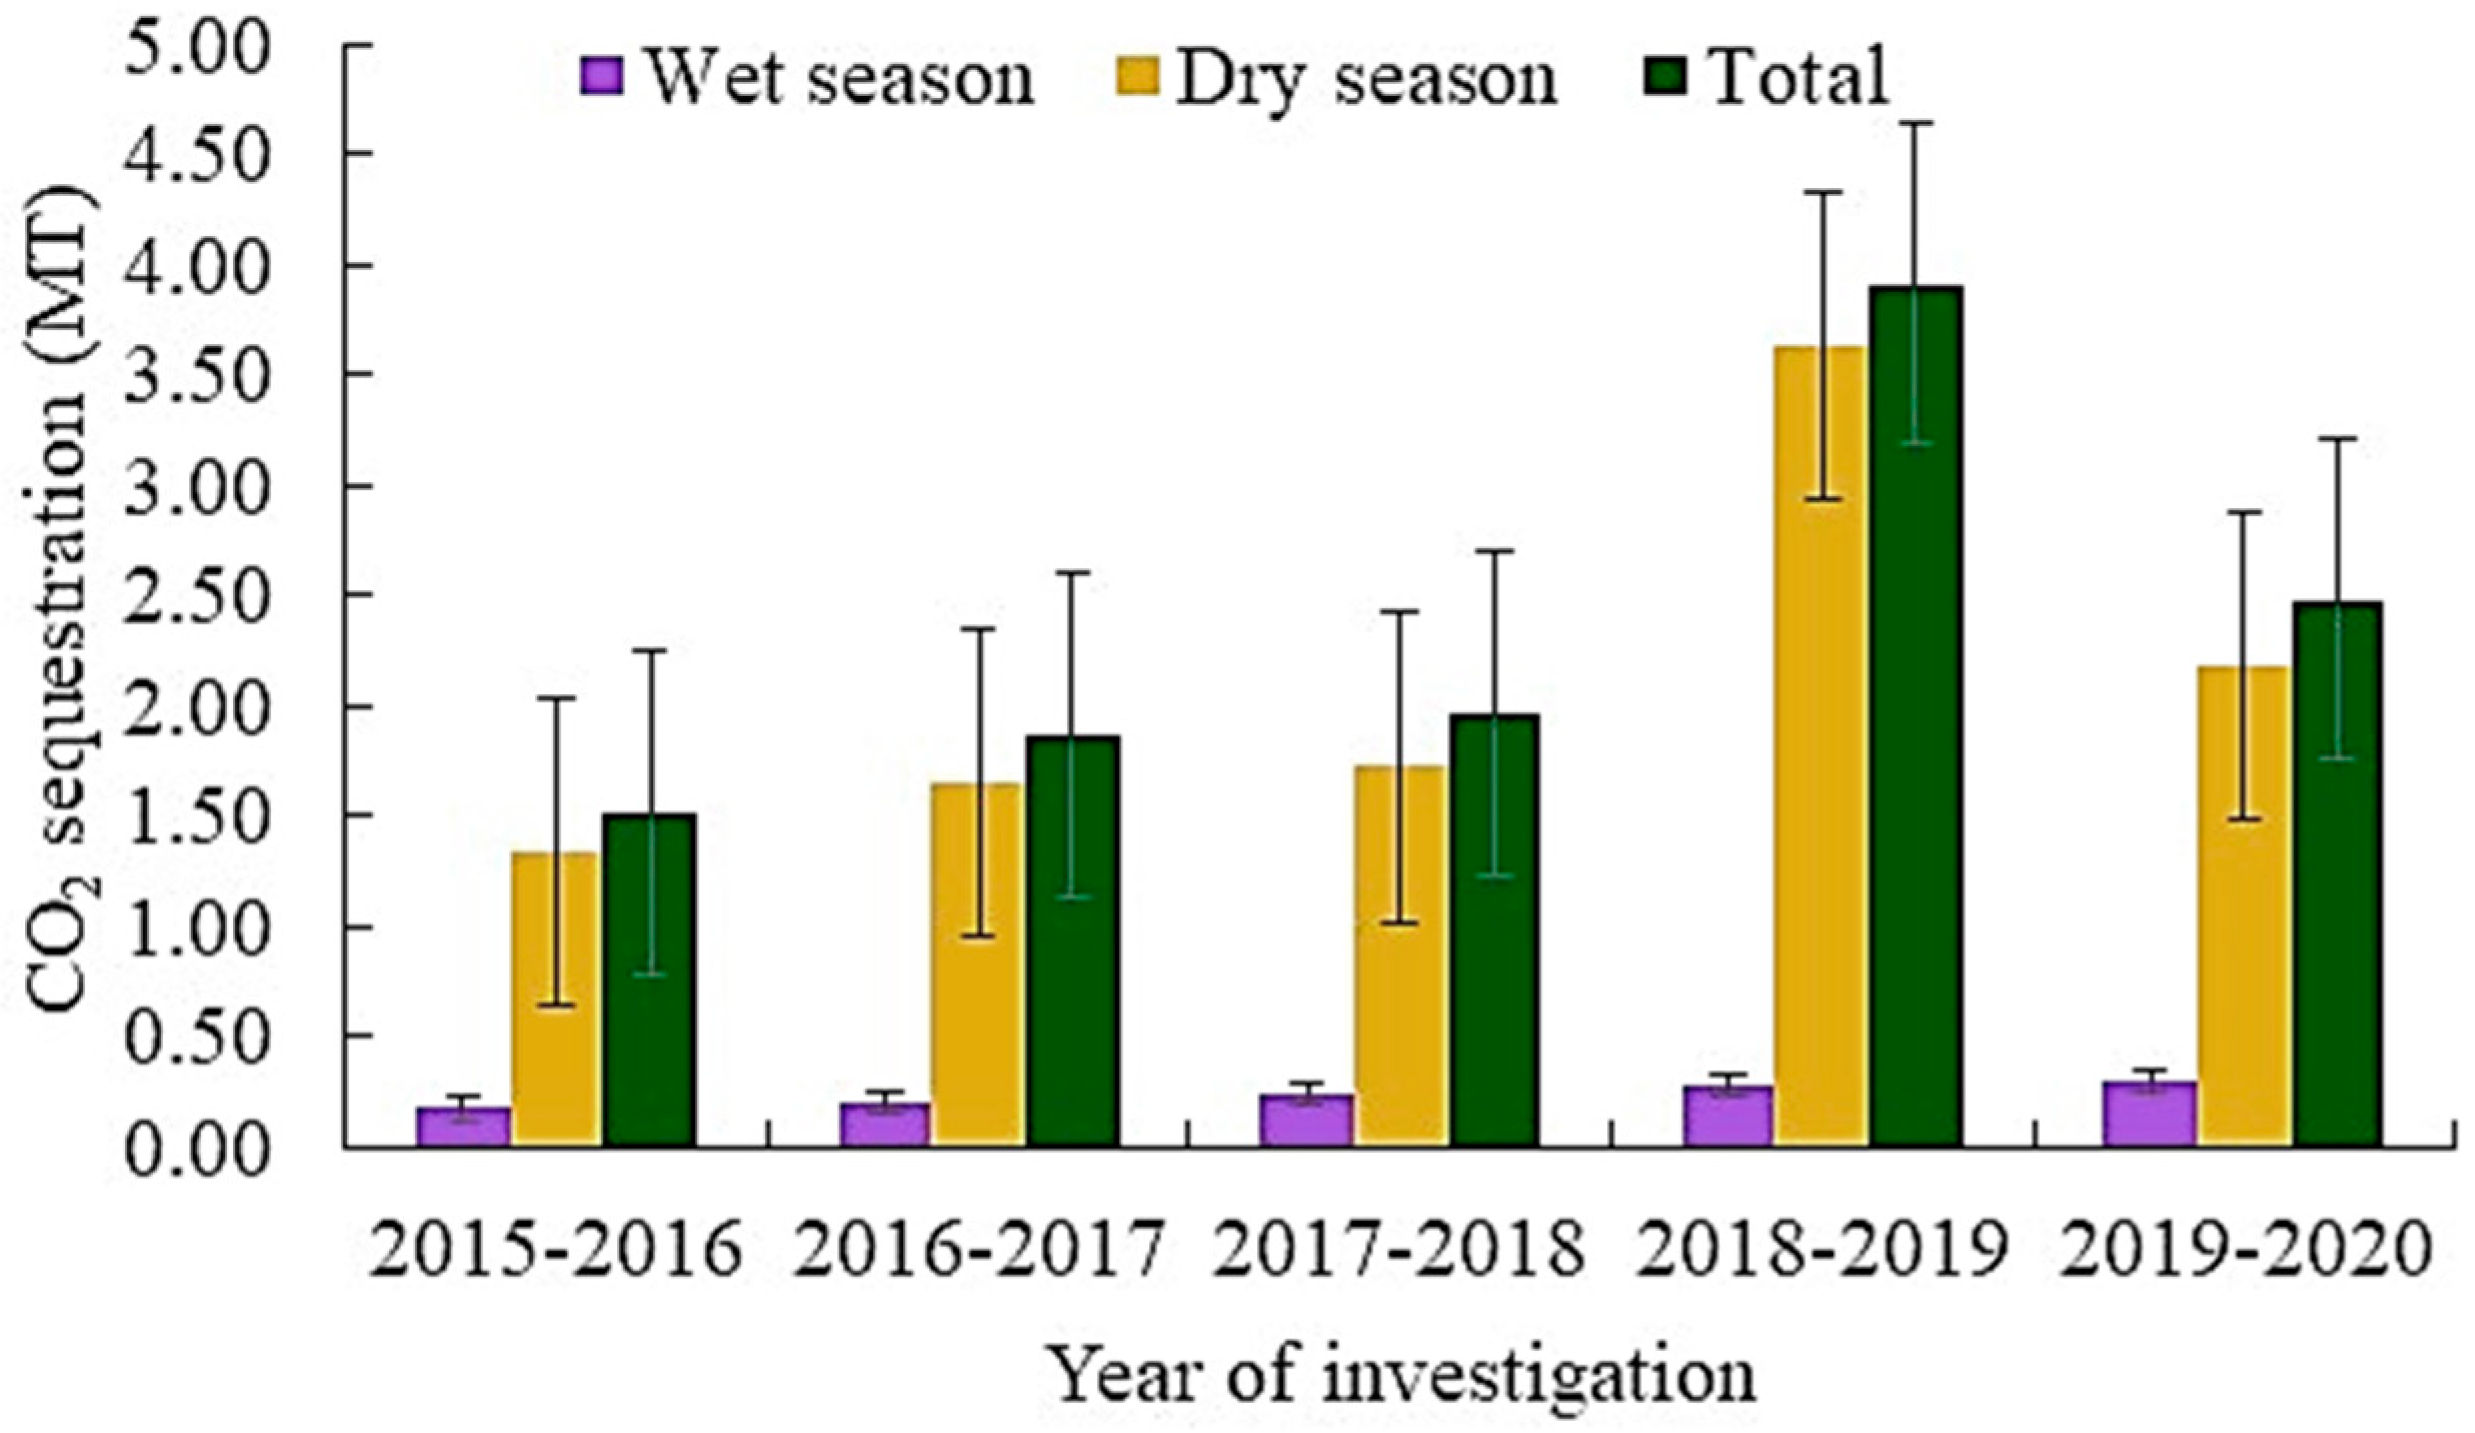
3.5. Total Net CO2 Sequestration

Total net CO2 sequestration varied significantly between growing seasons over the years studied (Figure 5). In the wet season, net total CO2 sequestration varied from about 0.18 to 0.30 MT, and it was 1.33–3.63 MT in the dry season. Considering both growing seasons, the net total CO2 sequestration for 2015–2020 was 1.51–3.91 MT in Bangladesh.

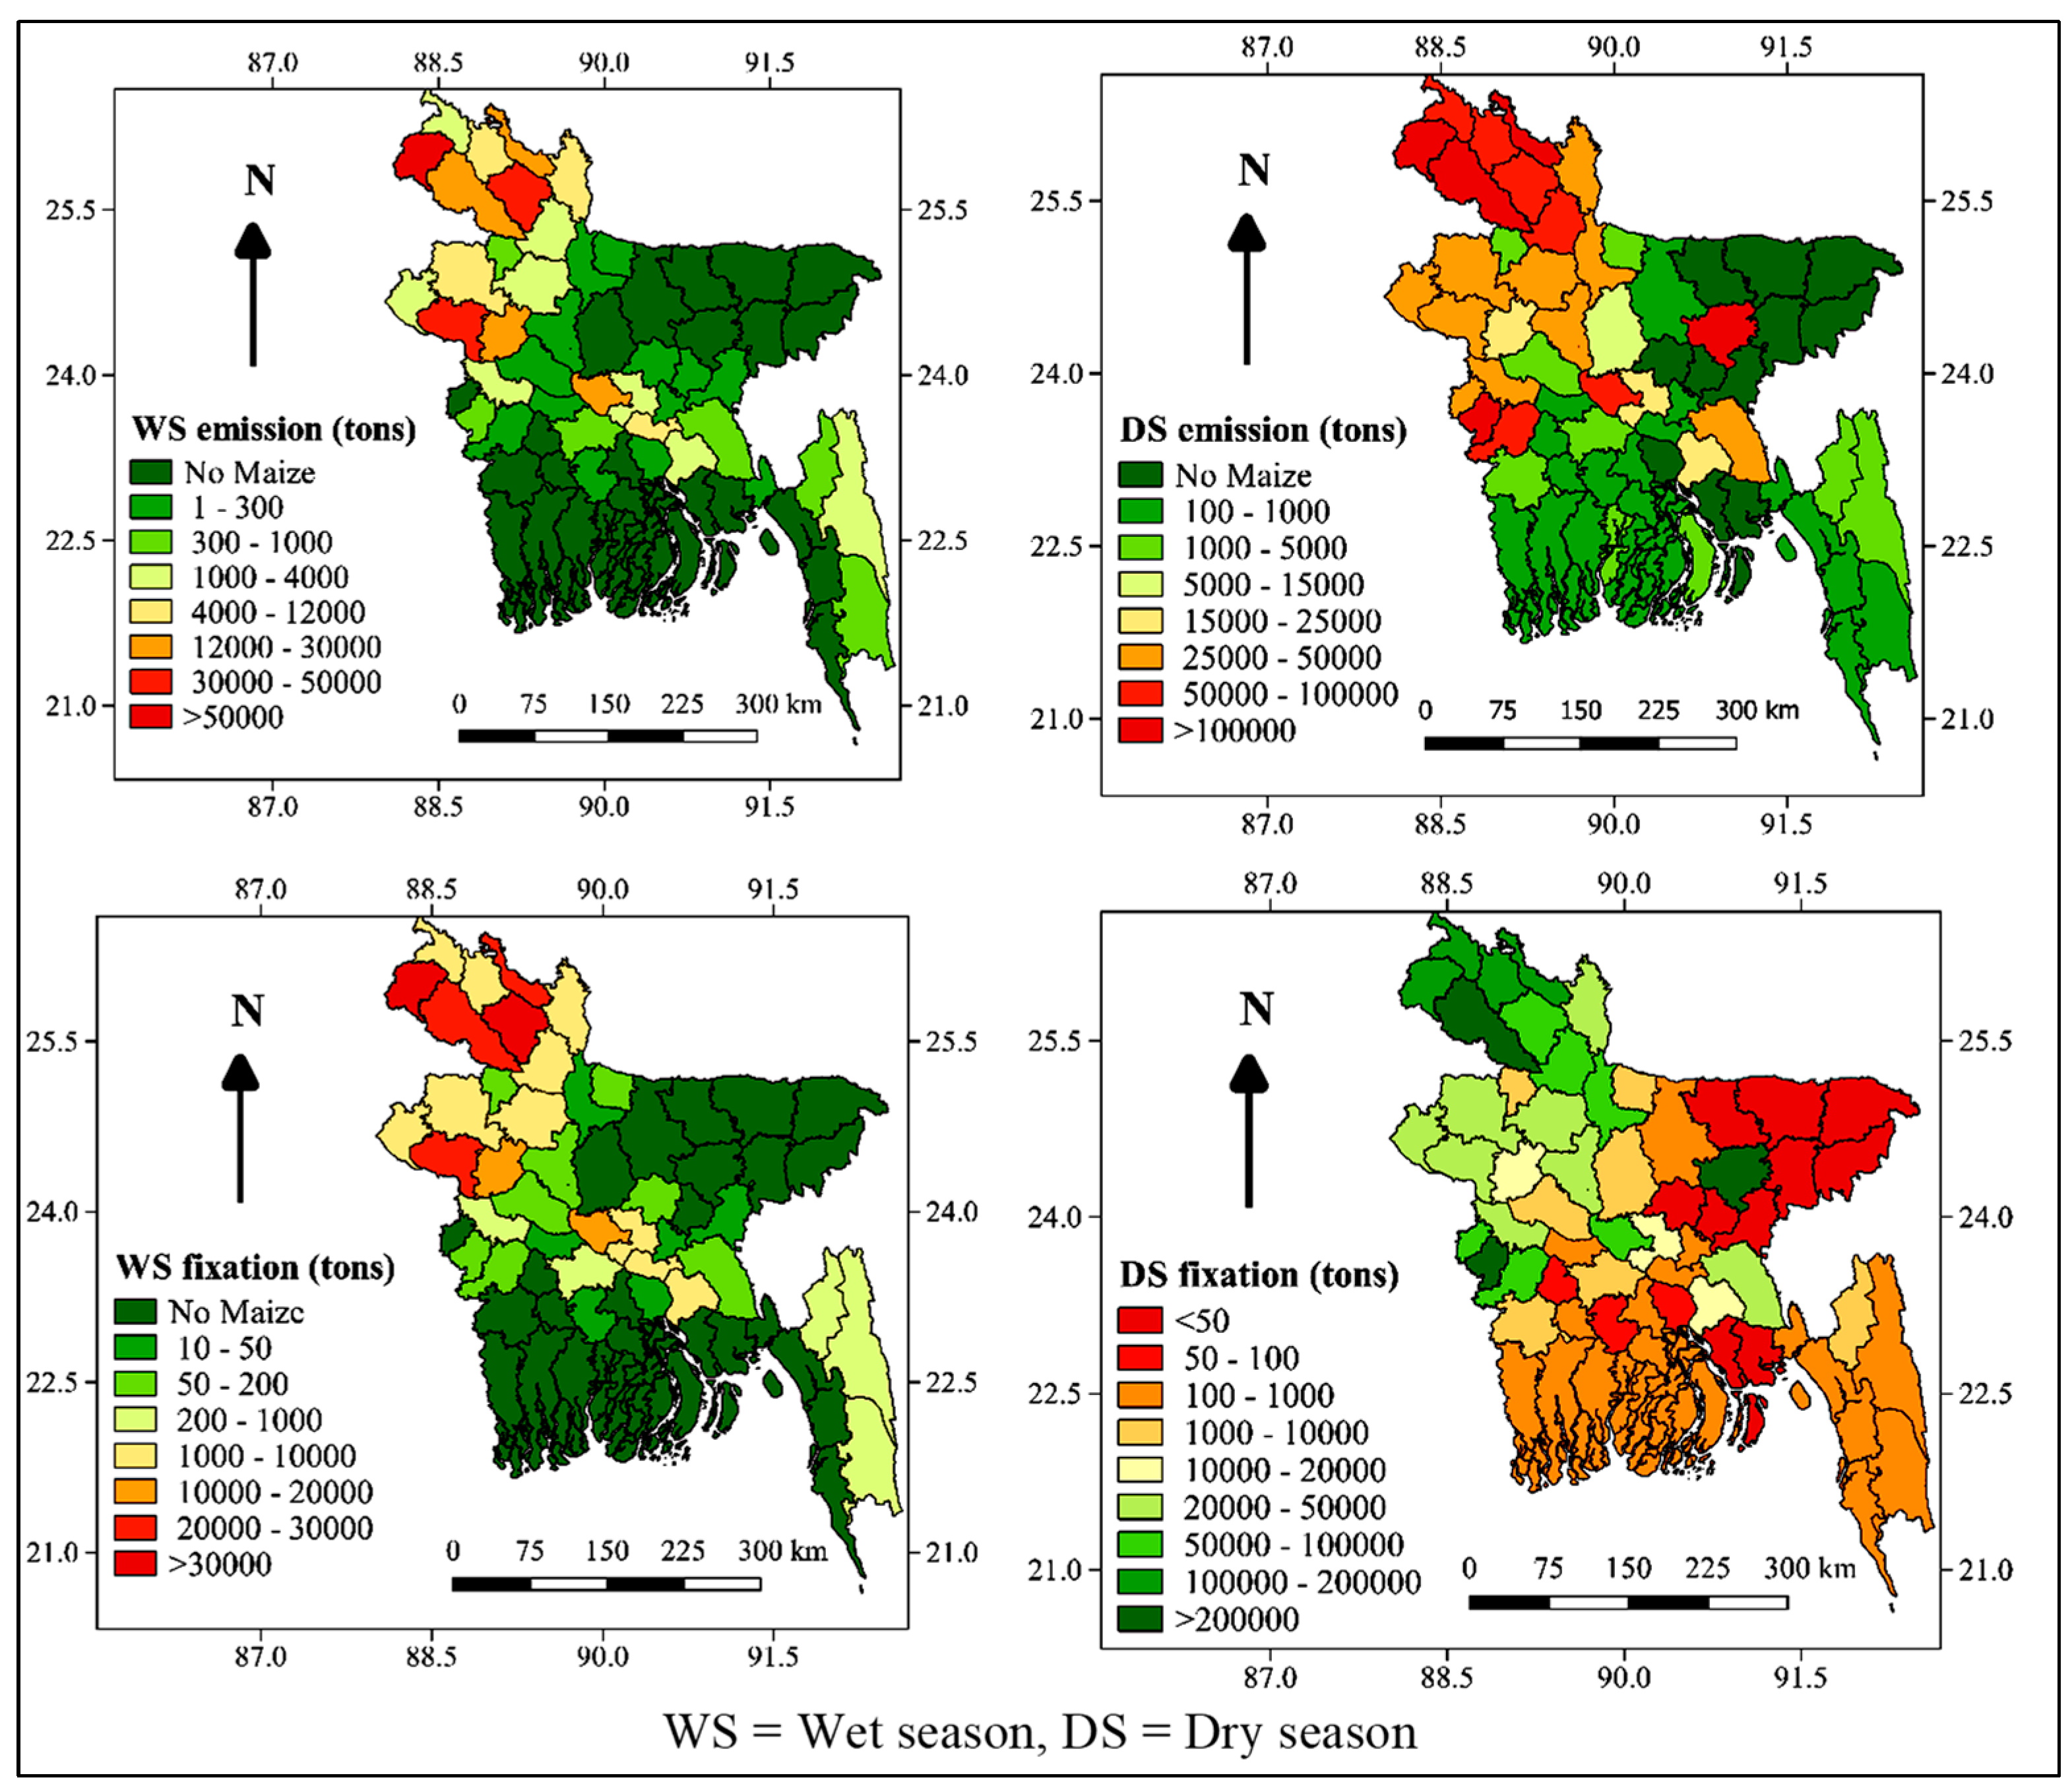
3.6. Spatio-Temporal Distribution of Carbon Emissions and Sequestration

The distribution of average total emissions in each district (i.e., administrative unit) varied greatly depending on the growing seasons. Most emissions were from the northern and north-west parts of the country, as well as the central region, with minor amounts from the hilly regions of the country (Figure 6).
Depending on the location of maize cultivation, the average emissions for 2015–2020 ranged from 1 tonne to >50,000 tonnes in the wet season and from 100 tonnes to >100,000 tonnes in the dry season. In a similar fashion, the total net CO2 sequestration was distributed in the same production zones and varied from 10 to >30,000 tonnes in the wet season and from <50 to >200,000 tonnes in the dry season.

4. Discussion

4.1. Grain Yield Variability

The grain yield of any crop varies depending on multiple factors, such as input management, sowing time and crop suitability. In our study, we found a large variability in grain yield, mostly because of differences in production zones and growing seasons. Growing maize in unfavourable regions, such as the southern part of the country, gives a comparatively lower yield than in major production zones in the northern, north-west and central parts of the country. Favourable production zones are located in the northern, north-western and central regions of the country, where grain yields varied from about 6.22 to 9.30 t ha−1 in the wet season and from 7.12 to 11.26 t ha−1 in the dry season. In contrast, unfavourable maize growing regions (mostly low-lying and heavily textured soil areas) provided grain yields of maize ranging from 1.92 to <6.00 t ha−1 in the wet season and from 3.12 to <7.00 t ha−1 in the dry season. Weather variability, soil moisture status and fertiliser management greatly contribute to maize yield variability. Similar findings were reported by Ahmed et al. [2] and Stuch et al. [47]. Ray et al. [1] reported that about 32–39% and even >60% of yield variations are explainable by climate variability. In future, crop yields will be mostly reduced because of temperature and precipitation variations over the locations in the globe [48] (Konduri et al., 2020in which efficient irrigation water management will be a crucial factor for sustainable agriculture [49] (Shirmohammadi Chelan et al., 2020). In the wet season, maize is generally exposed to higher temperatures than in the dry season, and conditions are thus unfavourable for higher grain yields in the wet season. A maximum temperature above 29 °C for long periods sharply decreases maize yields [6,50]. Generally, the cooler temperatures in the dry season (about 12–27 °C for night–day temperatures from November to March) compared to the wet season (about 25–32 °C for night–day temperatures from June to September) and the clear sunshine conditions favour the physiological processes of maize; thus, high grain yields are attained in the dry season. A mean optimum temperature of 20–22 °C during the whole growing season is synergistic for getting a high yield of maize [51], and that temperature range generally prevails in Bangladesh during the dry season. However, a rise in mean temperature of 1 °C can reduce maize yields by 3–13% [52], which justifies the yield reductions observed during the wet season in Bangladesh.

4.2. GHG Emission Intensity

During the study period, the GHG intensity was 1.09 ± 0.46 kg CO2 eq kg−1 grain in the wet season and 0.89 ± 0.40 kg CO2 eq kg−1 grain in the dry season. This seasonal variation in GHG intensities was related to the grain yields of maize. We found a lower GHG intensity than what was recorded in China (1.76 kg CO2 eq kg−1 grain) as per the report of Zhang et al. [11], but a higher intensity than the report in [21]. The latter authors only reported a range from −0.027 to 0.436 kg CO2 eq kg−1 grain in the United States of America. In India, the GHG intensity for maize cultivation was 0.71 kg CO2 eq kg−1 grain [53], which was very similar to our findings for dry-season maize. In general, grain yields were higher in the dry season than in the wet season and, thus, a lower GHG intensity was observed in the dry season. As stated earlier, grain yields were higher in the north, north-west and central parts of Bangladesh, and these higher grain yields were responsible for the lower GHG intensity in those areas compared to other maize-growing regions in the country.

4.3. Total GHG Emissions

We found 4946.7 kg ha−1 CO2 eq. emissions (Table 1) in relation to maize cultivation; this figure was used for total emissions because there were no regional data available in Bangladesh.
Moreover, the fertilisers used by the farmers and other cultural practices may be different for growing maize in different regions of the country; that variable has been ignored in the present investigation. A few references are provided here in support of our data on per-unit GHG emissions. For example, Zhang et al. [11] reported significantly higher emissions (14,857.33 kg CO2 eq ha−1) for maize cultivation in China, mainly because of mechanised cultivation and the excessive use of fertilisers. Based on field-measured data, Jain et al. [53] reported emissions of 3428.33 kg CO2 eq ha−1 for maize cultivation in India. Jayasundara et al. [54] found emissions of 1862–3742 kg CO2 ha−1 in Canada based on a lifecycle-based assessment. However, Camargo et al. [55] reported a general range of 2440–4200 kg CO2 eq ha−1 emissions during maize cultivation. Thus, the above-mentioned literature shows that our finding falls within the established range of GHG emissions globally. Since total GHG emissions in this study were determined based on a lifecycle (field-measured + input-related) assessment and area coverage, there were huge variations in total emissions in both the wet and dry seasons as a whole. Our estimation provides an incentive to policy planners for future action on grain yield improvement and GHG-reduction strategies.

4.4. Net Carbon Sequestration Rate

We found a rate of 4964.43 kg CO2 ha−1 sequestration based on a lifecycle assessment, and the estimated CO2 sequestration ranged from 237.72 to 6761.46 kg ha−1 depending on the maize growing season. Our findings are comparable with the existing literature, such as Holka and Beńkowski [56], who reported a rate of 1000–1700 kg CO2 ha−1 sequestration for a tonne of grain production. Khorramdel et al. [57] found a rate of about 30–15,033 kg CO2 ha−1 depending on the level of inputs used, whereas [42] reported comparatively higher amounts of carbon absorption (23,466–34,503 kg CO2 ha−1) with summer maize production depending on the tillage system and stover management. Such wide variations in CO2 sequestration are related to soil fertility, weather patterns, the use of inputs and crop management practices in different corners of the globe. Terrestrial plants sequester about 123 gigatonnes of CO2 during photosynthesis [24], and maize contributes to this noble function under changing climatic conditions.

4.5. Total Net CO2 Sequestration

Net CO2 sequestration is the balance between inputs and outputs, and such an assessment was conducted in the present investigation. Total net CO2 sequestration was 1.51–3.91 MT for 2015–2020 in relation to maize cultivation, indicating that maize production contributes in minimising CO2 emissions from crop agriculture in Bangladesh. It is also implied that net CO2 sequestration takes place in other maize-growing countries around the world. Since total net CO2 absorption depends on total biomass production and root deposition, amounts vary in different parts of the world. As maize is grown in rotation with rice (either before or after rice) in about 247,505 ha year−1 in Bangladesh [58], it can sequester about 1.23 MT CO2 eq year−1 (4964.43 × 247,505), indicating that emissions from rice fields are minimised under a rice–maize cropping system (Table 2) compared to a rice–rice cropping system.
In another study, about 660 kg CO2 ha−1 net emissions were recorded from irrigated rice fields [61], indicating that net emissions from rice fields under rice–maize patterns are only about 0.16 MT CO2 eq year−1, which is far below the CO2 sequestration by maize in the same system. Our findings indicate that total carbon emissions and sequestration should be determined in order to obtain a clear picture of GHG emissions from crop agriculture. Unless we consider the balance between the total input and output of carbon, data does not reflect the total scenario of GHG emissions from crop agriculture in a particular country.

4.6. Spatio-Temporal Distribution of Carbon Emissions and Sequestration

Just as maize areas in Bangladesh change depending on growing seasons over the years, carbon emissions and sequestration patterns also vary greatly. Based on the average values for 2015–2020, it was found that GHG emissions and carbon sequestration were mostly concentrated in the north, north-west, central and hilly regions of the country (Figure 6). In general, higher levels of emissions and sequestration were observed in the dry season than in the wet season. Multiple factors were responsible for such variations. For example, soil organic matter content [28,60], tillage systems and soil moisture [16,34] influence GHG emissions and crop yields and, thus, carbon sequestration. Tiefenbacher et al. [25] also reported that carbon sequestration is significantly influenced by soil properties and the crop management practices adopted by growers. Moreover, total biomass production and grain yields are significantly influenced by weather, edaphic factors and crop husbandry. The compound effects of those variables resulted in large variations in maize grain yield, ranging from <2.0 t ha−1 to >11.0 t ha−1 (Figure 1); this, in turn, led to large variations in total carbon sequestration in different regions of the country.

5. Conclusions

Region-specific data on GHG emissions from maize fields and carbon sequestration are not available in Bangladesh. We generated GHG emission data from field research at BARI, Gazipur, and we utilised those data for the whole country, considering the grain yields of maize as well as area coverage. There were variations in grain yields, GHG emission intensities and net CO2 sequestration depending on growing seasons and locations in the country. In general, GHG emission intensity was lower in favourable maize production zones than in other areas, indicating that yield gaps existed that need to be minimised. However, the estimated net CO2 sequestration outweighed the net total emissions for all maize-growing regions of the country, indicating that maize and other upland crops in rice-based cropping systems are beneficial not only for minimising GHG emissions but also for nutrition security in Bangladesh, along with many other developing countries around the globe. As the data is limiting for such types of studies in various countries, emphasis should be placed by the global community on generating data on GHG emissions for the major food crops of the world. Such initiative may provide opportunities for adopting strategies to reduce GHG emissions from agriculture under changing climatic conditions.

Author Contributions

All authors contributed to the study’s conception and design. Contributions to material preparation, data collection and analysis, and software were made by J.C.B., M.M.H., M.B.H., M.M., T.Z., M.M.R., R.S., S.I., A.K.C., I.M.A., S.A. (Shahrina Akhtar), F.A. and M.F.H. The first draft of the manuscript was written by J.C.B., M.M.H., M.B.H., M.M., T.Z., A.G., A.M.A. and A.H. Supervision and editing were performed by S.A. (Sohela Akhter), M.K., J.K.B. and A.H. All authors commented on previous versions of the manuscript. All authors have read and agreed to the published version of the manuscript.

Funding

This research was financially supported by the Krishi Gobeshona Foundation (KGF), the Bangladesh Agricultural Research Council (BARC) Complex, New Airport Road, Farmgate, Dhaka, through the second phase of the CRP-II project. In addition, the study was also partially funded by Princess Nourah bint Abdulrahman University Researchers Supporting Project number (PNURSP2022R65), Princess Nourah bint Abdulrahman University, Riyadh, Saudi Arabia.

Institutional Review Board Statement

We hereby declare that this manuscript contains no material that has been accepted for the award of any degree or diploma in any university, and that, to the best of our knowledge and belief, the manuscript contains no copy of any material previously published or written by another person, except where due reference is made in the text. We do not have any conflicts of interest.

Informed Consent Statement

We do not have any person’s data in any form. We do not have any individual person’s data in any form.

Data Availability Statement

The data that support the findings of this study are openly available on request.

Acknowledgments

The authors appreciate the partial support for this study provided by the Princess Nourah bint Abdulrahman University Researchers Supporting Project number (PNURSP2022R65), Princess Nourah bint Abdulrahman University, Riyadh, Saudi Arabia for partially supporting the study.

Conflicts of Interest

The authors declare no conflict of interest.

References

  1. Ray, D.K.; Gerber, J.S.; MacDonald, G.K.; West, P.C. Climate variation explains a third of global crop yield variability. Nat. Com. 2015, 6, 5989. [Google Scholar] [CrossRef] [PubMed] [Green Version]
  2. Ahmed, I.; Rahman, M.H.U.; Ahmed, S.; Hussain, J.; Ullah, A.; Judge, J. Assessing the impact of climate variability on maize using simulation modeling under semi-arid environment of Punjab, Pakistan. Environ. Sci. Pollu. Res. 2018, 25, 28413–28430. [Google Scholar] [CrossRef] [PubMed]
  3. Golla, B.; Tadesse, B.; Chalsisa, D.; Bayisa, E. Effect of sowing time and environmental variation on yield of different maize varieties. Open J. Plant Sci. 2018, 3, 041–045. [Google Scholar] [CrossRef] [Green Version]
  4. Kumar, R.; Karmakar, S.; Minz, A.; Singh, J.; Kumar, A.; Kumar, A. Assessment of Greenhouse Gases Emission in Maize-Wheat Cropping System Under Varied N Fertilizer Application Using Cool Farm Tool. Front. Environ. Sci. 2021, 9, 710108. [Google Scholar] [CrossRef]
  5. Butts-Wilmsmeyer, C.J.; Seebauer, J.R.; Singleton, L.; Below, F.E. Weather during key growth stages explains grain quality and yield of maize. Agronomy 2019, 9, 16. [Google Scholar] [CrossRef] [Green Version]
  6. Hoffman, A.L.; Kemanian, A.R.; Forest, C.E. The response of maize, sorghum and soybean yield to growing-phase climate revealed with machine learning. Environ. Res. Lett. 2020, 15, 094013. [Google Scholar] [CrossRef]
  7. Smith, P.; Martina, D.; Cai, Z.; Gwary, D.; Janzen, H.; Kumar, P.; McCarl, B.; Ogle, S.; O’Mara, F.; Rice, C.; et al. Greenhouse gas mitigation in agriculture. Philos. Trans. R. Soc. B 2017, 363, 789–813. [Google Scholar] [CrossRef] [Green Version]
  8. Rice, C.W. Carbon cycle in soils|Dynamics and management. In Encyclopedia of Soils in the Environment; Hillel, D., Ed.; Elsevier: Amsterdam, The Netherlands, 2005; pp. 164–170. ISBN 9780123485304. [Google Scholar] [CrossRef]
  9. Raich, J.W.; Potter, C.S. Global patterns of carbon dioxide emissions from soils. Glob. Biogeochem. Cycles 1995, 9, 23–36. [Google Scholar] [CrossRef] [Green Version]
  10. FAO (Food and Agriculture Organization of the United Nations). Emissions due to agriculture. In Global, Regional and Country Trends 2000–2018; FAOSTAT Analytical Brief Series No 18.; FAO: Rome, Italy, 2020. [Google Scholar]
  11. Zhang, D.; Shen, J.; Zhang, F.; Li, Y.; Zhang, W. Carbon footprint of grain production in China. Sci. Rep. 2017, 7, 4126. [Google Scholar] [CrossRef] [Green Version]
  12. Lotze-Campe, H. Climate change, population growth and crop production: An overview. In Crop Adaptation to Climate Change, 1st ed.; Yadav, S.S., Redden, R.J., Hatfield, J.L., Lotze-Campen, H., Hall, A.E., Eds.; JohnWiley & Sons, Ltd.: Hoboken, NJ, USA, 2011. [Google Scholar]
  13. Hossain, M.S.; Arshad, M.; Qian, L.; Zhao, M.; Mehmood, Y.; Kächele, H. Economic impact of climate change on crop farming in Bangladesh: An application of Ricardian method. Ecol. Econ. 2019, 164, 106354. [Google Scholar] [CrossRef]
  14. Johnson, M.D.; Rutland, C.T.; Richardson, J.W.; Outlaw, J.L.; Nixon, C.J. Greenhouse gas emissions from U.S. grain farms. J. Crop Improv. 2016, 30, 447–477. [Google Scholar] [CrossRef]
  15. Haque, M.M.; Biswas, J.C. Emission factors and global warming potential as influenced by fertilizer management for the cultivation of rice under varied growing seasons. Environ. Res. 2021, 197, 111156. [Google Scholar] [CrossRef] [PubMed]
  16. Haque, M.M.; Biswas, J.C.; Salahin, N.; Alam, K.M.; Akhter, S.; Akhtar, S.; Maniruzzaman, M.; Hossain, S.M. Tillage systems influence on greenhouse gas emission factor and global warming potential under rice-mustard-rice cropping system. Arch. Agron. Soil Sci. 2022. [Google Scholar] [CrossRef]
  17. BBS (Bangladesh Bureau of Statistics). Statistical Year Book of Bangladesh, 39th ed.; Statistics Division, Ministry of Planning: Dhaka, Bangladesh, 2019; pp. 141–167.
  18. Maniruzzaman, M.; Biswas, J.C.; Hossain, M.B.; Roy, D.; Yesmin, M.S.; Kundu, P.K.; Haque, M.M.; Naher, U.A.; Rahman, M.M.; Akhter, S. Irrigation water-energy nexus: GHG emissions in Bangladesh. In First Annual Report on CRP-II project, Second Phase; Krishi Gobeshona Foundation: Dhaka, Bangladesh, 2021; p. 505. [Google Scholar]
  19. Hossen, M.A.; Talukder, M.R.A.; Mamun, M.R.A.; Paul, S.; Rahman, M.M.; Miaruddin, M.; Ali, M.A.; Islam, M.N. Mechanization status, promotional activities and government strategies of Thailand and Vietnam in comparison to Bangladesh. AgriEngineering 2020, 2, 489–510. [Google Scholar] [CrossRef]
  20. Sahakian, A.B.; Jee, S.R.; Pimentel, M. Methane and the gastrointestinal tract. Dig. Dis. Sci. 2010, 55, 2135–2143. [Google Scholar] [CrossRef]
  21. Kim, S.; Dale, B.E.; Keck, P. Energy requirements and greenhouse gas emissions of maize production in the USA. Bioenerg. Res. 2014, 7, 753–764. [Google Scholar] [CrossRef]
  22. Hou, L.; Yang, Y.; Zhang, X.; Jiang, C. Carbon footprint for wheat and maize production modulated by farm size: A study in the North China plain. Int. J. Clim. Change Strateg. Manag. 2021, 13, 302–319. [Google Scholar] [CrossRef]
  23. IPCC (Intergovernmental Panel on Climate Change). Climate Change 2014: Synthesis Report. In Contribution of Working Groups I, II and III to the Fifth Assessment Report of the Intergovernmental Panel on Climate Change; IPCC: Geneva, Switzerland, 2014; pp. 1–151. [Google Scholar]
  24. Jansson, C.; Faiola, C.; Wingler, A.; Zhu, X.G.; Kravchenko, A.; de Graaff, M.-A.; Ogden, A.J.; Handakumbura, P.P.; Werner, C.; Beckles, D.M. Crops for carbon farming. Front. Plant Sci. 2021, 12, 636709. [Google Scholar] [CrossRef]
  25. Tiefenbacher, A.; Sandén, T.; Haslmayr, H.-P.; Miloczki, J.; Wenzel, W.; Spiegel, H. Optimizing carbon sequestration in croplands: A synthesis. Agronomy 2021, 11, 882. [Google Scholar] [CrossRef]
  26. Smith, P.; Lanigan, G.; Kutsch, W.L.; Buchmann, N.; Eugster, W.; Aubinet, M.; Ceschi, E.; Béziat, P.; Yeluripati, J.B.; Osborne, B.; et al. Measurements necessary for assessing the net ecosystem carbon budget of croplands. Agric. Ecosyst. Environ. 2010, 139, 302–315. [Google Scholar] [CrossRef]
  27. Ma, Y.C.; Kong, X.W.; Yang, B.; Zhang, X.L.; Yan, X.Y.; Yang, J.C.; Xiong, Z.Q. Net global warming potential and greenhouse gas intensity of annual rice-wheat rotations with integrated soil crop system management. Agric. Ecosyst. Environ. 2013, 164, 209–219. [Google Scholar] [CrossRef] [Green Version]
  28. Yao, Z.; Zheng, X.; Liu, C.; Lin, S.; Zuo, Q.; Butterbach-Bahl, K. Improving rice production sustainability by reducing water demand and greenhouse gas emissions with biodegradable films. Sci. Rep. 2017, 7, 39855. [Google Scholar] [CrossRef] [PubMed] [Green Version]
  29. BBS (Bangladesh Bureau of Statistics). Yearbook of Agricultural Statistics, 31st Series; Statistics and Informatics Division, Ministry of Planning: Dhaka, Bangladesh, 2020; pp. 86–90. [Google Scholar]
  30. Alam, M.M.; Basher, M.M.; Karim, A.; Rahman, M.A.; Islam, M.R. Effect of rate of nitrogen fertilizer and population density on the yield and yield attributes of maize (Zea mays). Pak. J. Biol. Sci. 2003, 6, 1770–1773. [Google Scholar] [CrossRef] [Green Version]
  31. Hasan, M.R.; Rahman, R.; Hasan, A.K.; Paul, S.K.; Alam, A.H.M.J. Effect of variety and spacing on the yield performance of maize (Zea mays L.) in old Brahmaputra floodplain area of Bangladesh. Arch. Agric. Environ. Sci. 2018, 3, 270–274. [Google Scholar] [CrossRef]
  32. Haque, M.M.; Biswas, J.C.; Maniruzaman, M.; Akhter, S.; Kabir, M.S. Carbon sequestration in paddy soil as influenced by organic and inorganic amendments. Carbon Manag. 2020, 11, 231–239. [Google Scholar] [CrossRef]
  33. Haque, M.M.; Biswas, J.C.; Hwang, H.Y.; Kim, P.J. Annual net carbon budget in rice soil. Nutr. Cycl. Agroecosyst. 2020, 116, 31–40. [Google Scholar] [CrossRef]
  34. Haque, M.M.; Biswas, J.C.; Maniruzzaman, M.; Hossain, M.B.; Islam, M.R. Water management and soil amendment for reducing emission factor and global warming potential but improving rice yield. Paddy Water Environ. 2021, 19, 515–527. [Google Scholar] [CrossRef]
  35. Lou, Y.; Li, Z.; Zhang, T.; Liang, Y. CO2 emissions from subtropical arable soils of China. Soil Biol. Biochem. 2004, 36, 1835–1842. [Google Scholar] [CrossRef]
  36. Singh, S.; Singh, J.; Kashyap, A. Methane flux from irrigated rice fields in relation to crop growth and N-fertilization. Soil Biol. Biochem. 1999, 31, 1219–1228. [Google Scholar] [CrossRef]
  37. Zhang, X.; Fan, C.; Ma, Y.; Liu, Y.; Li, L.; Zhou, Q.; Xiong, Z. Two approaches for net ecosystem carbon budgets and soil carbon sequestration in a rice-wheat rotation system in China. Nutr. Cyc. Agroecosys. 2014, 100, 301–313. [Google Scholar] [CrossRef]
  38. Flessa, H.; Ruser, R.; Dorsch, P.; Kamp, T.; Jimenez, M.A.; Munch, J.C.; Beese, F. Integrated evaluation of greenhouse gas emissions (CO2, CH4, N2O) from two farming systems in southern Germany. Agric. Ecosys. Environ. 2002, 91, 175–189. [Google Scholar] [CrossRef]
  39. Karim, M.; Moniruzzaman, R.; Alam, Q.M. Economics of maize production in some selected areas of Bangladesh. Bangladesh J. Agril. Res. 2010, 35, 83–93. [Google Scholar] [CrossRef] [Green Version]
  40. Van Huang, N.; Migo, M.V.; Quilloy, R.; Chivenge, P.; Gummert, M. Life cycle assessment applied in rice production and residue management. In Sustainable Rice Straw Management; Gummert, M., Hung, N., Chivenge, P., Douthwaite, B., Eds.; Springer: Cham, Switzerland, 2020. [Google Scholar] [CrossRef] [Green Version]
  41. Adnan, K.M.M.; Sarker, S.A.; Tama, R.A.Z.; Pooja, P. Profit efficiency and influencing factors for the inefficiency of maize production in Bangladesh. J. Agric. Food Res. 2021, 5, 100161. [Google Scholar] [CrossRef]
  42. Gathorne-Hardy, A.; Reddy, D.N.; Venkatanarayana, M.; Harris-White, B. A life cycle assessment (LCA) of greenhouse gas emissions from SRI and flooded rice production in SE India. Taiwan Water Conserv. 2013, 61, 110–125. [Google Scholar]
  43. FAO (Food and Agriculture Organization of the United Nations). Global database of GHG emissions related to feed crops: A lifecycle inventory, version 1. In Livestock Environmental Assessment and Performance Partnership; FAO: Rome, Italy, 2017. [Google Scholar]
  44. Rahman, M.M.; Mahmud, M.G.A.; Ferdous, H.M.; Sultana, N.; Sayed, A. Assessment of irrigation water requirement of maize crop for different tillage practices in Bangladesh. Am. J. Exp. Agric. 2016, 10, 1–10. [Google Scholar] [CrossRef]
  45. Barber, A. Seven Case Study Farms: Total Energy & Carbon Indicators for New Zealand Arable & Outdoor Vegetable Production; AgriLINK New Zealand Ltd.: Pukekohe, New Zealand, 2004. [Google Scholar]
  46. Hossain, M.I. Present status and prospect of appropriate mechanization for wheat and maize cultivation in Bangladesh. In Proceedings of the Integration of Maize in Rice-Wheat System with Conservation Agriculture and Nutrient Management for Climate Resilient SUSTAINABLE productivity, BARI, Gazipur, Bangladesh, 24 August 2017. [Google Scholar]
  47. Stuch, B.; Alcamo, J.; Schaldach, R. Projected climate change impacts on mean and year-to-year variability of yield of key smallholder crops in Sub-Saharan Africa. Clim. Dev. 2021, 13, 268–282. [Google Scholar] [CrossRef]
  48. Konduri, V.S.; Vandal, T.J.; Ganguly, S.; Ganguly, A.R. Data science for weather impacts on crop yield. Data Science for Weather Impacts on Crop Yield. Front. Sustain. Food Syst. 2020, 4, 52. [Google Scholar] [CrossRef]
  49. Shirmohammadi, B.; Malekian, A.; Salajegheh, A.; Taheri, B.; Azarnivand, H.; Malek, Z.; Verburg, P.H. Impacts of future climate and land use change on water yield in a semiarid basin in Iran. Land Degrad. Dev. 2020, 31, 1252–1264. [Google Scholar] [CrossRef]
  50. Schauberger, B.; Archontoulis, S.; Arneth, A.; Balkovic, J.; Ciais, P.; Deryng, D.; Elliott, J.; Folberth, C.; Khabarov, N.; Müller, C. Consistent negative response of US crops to high temperatures in observations and crop models. Nat. Commun. 2017, 8, 13931. [Google Scholar] [CrossRef] [Green Version]
  51. Waqas, M.A.; Wang, X.; Zafar, S.A.; Noor, M.A.; Hussain, H.A.; Nawaz, M.A.; Farook, M. Thermal stresses in maize: Effects and management strategies. Plants 2021, 10, 293. [Google Scholar] [CrossRef]
  52. Izaurralde, R.C.; Thomson, A.M.; Morgan, J.; Fay, P.; Polley, H.; Hatfield, J.L. Climate impacts on agriculture: Implications for forage and rangeland production. Agron. J. 2011, 103, 371–381. [Google Scholar] [CrossRef] [Green Version]
  53. Jain, N.; Arora, P.; Tomer, R.; Mishra, S.V.; Bhatia, A.; Pathak, H.; Chakraborty, D.; Kumar, V.; Dubey, D.S.; Harit, R.C.; et al. Greenhouse gas emission from soils under major crops in northwest India. Sci. Total Environ. 2016, 542, 551–561. [Google Scholar] [CrossRef] [PubMed]
  54. Jayasundara, S.; Wagner-Riddle, C.; Dias, G.; Kariyapperuma, K.A. Energy and greenhouse intensity of corn (Zea mays L.) production in Ontario: A regional assessment. Can. J. Soil Sci. 2014, 94, 77–95. [Google Scholar] [CrossRef]
  55. Camargo, G.G.T.; Ryan, M.R.; Richard, T.L. Energy use and greenhouse gas emissions from crop production using the farm energy analysis tool. BioScience 2013, 63, 263–273. [Google Scholar] [CrossRef] [Green Version]
  56. Holka, M.; Bieńkowski, J. Carbon footprint and life-cycle costs of maize production in conventional and non-conventional tillage systems. Agronomy 2020, 10, 1877. [Google Scholar] [CrossRef]
  57. Khorramdel, S.; Koocheki, A.; Mahallati, M.N.; Khorasani, R.; Ghorbani, R. Evaluation of carbon sequestration potential in corn fields with different management systems. Soil Tillage Res. 2013, 133, 25–31. [Google Scholar] [CrossRef]
  58. Feng, Q.; Xu, J.; Zhang, Y.; Li, X.; Xu, J.; Han, H.; Ning, T.; Lal, R.; Li, Z. CO2 fixation in above-ground biomass of summer maize under different tillage and straw management treatments. Sci. Rep. 2017, 7, 16888. [Google Scholar] [CrossRef] [Green Version]
  59. Nasim, M.; Shahidullah, S.M.; Saha, A.; Muttaleb, M.A.; Aditya, T.L.; Ali, M.A.; Kabir, M.S. Distribution of crops and cropping patterns in Bangladesh. Bangladesh Rice J. 2017, 21, 1–55. [Google Scholar] [CrossRef] [Green Version]
  60. Biswas, J.C.; Maniruzzaman, M.; Haque, M.M.; Hossain, M.B.; Naher, U.A.; Akhtar, S.; Rahman, M.M.; Akhter, S.; Ahmed, F.; Biswas, J.K. Greenhouse gas emissions from paddy fields in Bangladesh compared to top twenty rice producing countries and emission reduction strategies. Paddy Water Environ. 2022, 20, 381–393. [Google Scholar] [CrossRef]
  61. Ray, R.L.; Griffin, R.W.; Fares, A.; Elhassan, A.; Awal, R.; Woldesenbet, S.; Risch, E. Soil CO2 emission in response to organic amendments, temperature, and rainfall. Sci. Rep. 2020, 10, 5849. [Google Scholar] [CrossRef] [Green Version]
Figure 1. Variability in maize grain yields, 2015–2020, Bangladesh.
Sustainability 14 09144 g001
Figure 2. GHG emission (CO2 eq) intensity in the wet and dry seasons over the years studied in Bangladesh.
Sustainability 14 09144 g002
Figure 3. Total estimated GHG emissions during maize cultivation in Bangladesh. Error bars indicate standard deviations.
Sustainability 14 09144 g003
Figure 4. Net carbon dioxide sequestration rates during maize cultivation in Bangladesh.
Sustainability 14 09144 g004
Figure 5. Total net CO2 sequestration during maize cultivation in Bangladesh. Error bars indicate standard deviations.
Sustainability 14 09144 g005
Figure 6. Average GHG emissions and net CO2 sequestration in the wet and dry seasons of 2015–2020 during maize cultivation in Bangladesh.
Sustainability 14 09144 g006
Table 2. Area coverage and estimated GHG emissions (CO2 eq) and carbon sequestration in rice–maize cropping patterns in Bangladesh.
PatternsArea (ha)Paddy Field Emissions (Tonnes)CO2 Sequestration by Maize (Tonnes)
Maize−Fallow−T. Aman101,46066,963.60503,691.18
Potato−Maize−T. Aman47,69031,475.40236,753.72
Maize−Jute−T. Aman21,32514,074.50105,866.49
Maize−Vegetable−T. Aman18101194.608985.62
Wheat−Maize−T. Aman16,32010,771.2081,019.52
Maize−Aus−Fallow13,6158985.9067,590.73
Potato−Maize−Aus43002838.0021,347.05
Tobacco−Maize−T. Aman74704930.2037,084.30
Vegetable−Maize−T. Aman45002970.0022,339.94
Maize−B. Aman50303319.8024,971.09
Maize−Mung bean−T. Aman49003234.0024,325.71
Maize−Maize−T. Aman30702026.2015,240.80
Maize−Aus−Vegetable30001980.0014,893.29
Maize−Aus−T. Aman29701960.2014,744.36
Lentil−Maize−T. Aman29201927.2014,496.14
Maize−Sesame−T. Aman18351211.109109.73
Onion−Maize−T. Aman1490983.407397.00
Maize−Boro−T. Aman1400924.006950.20
Maize−Aus−Black gram1370904.206801.27
Boro−Maize−Fallow410270.602035.42
Potato+Maize−B. Aman410270.602035.42
Potato+Maize−Vegetable−T. Aman210138.601042.53
Total247,505163,353.30122,8721.53
Source: [59,60].
Publisher’s Note: MDPI stays neutral with regard to jurisdictional claims in published maps and institutional affiliations.

