Article

Vehicle Price Classification and Prediction Using Machine Learning in the IoT Smart Manufacturing Era

by
Fadi Al-Turjman
1,2,
Adedoyin A. Hussain
3,*,
Sinem Alturjman
1,2 and
Chadi Altrjman
2,4
1
Artificial Intelligence Engineering Department, AI and Robotics Institute, Near East University, Mersin 10, Nicosia 99138, Turkey
2
Research Center for AI and IoT, Faculty of Engineering, University of Kyrenia, Mersin 10, Kyrenia 99320, Turkey
3
Computer Engineering Department, Research Centre for AI and IoT, Near East University, Mersin 10, Nicosia 99138, Turkey
4
Department of Chemical Engineering, University of Waterloo, Waterloo, ON N2L 3G1, Canada
*
Author to whom correspondence should be addressed.
Sustainability 2022, 14(15), 9147; https://doi.org/10.3390/su14159147
Submission received: 25 March 2022 / Revised: 19 July 2022 / Accepted: 20 July 2022 / Published: 26 July 2022

Abstract

:
In this paper, machine learning (ML) strategies have been utilized in predicting vehicles’ prices and good deals. Vehicle value prediction has been considered one of the most significant research topics with the rise of IoT for sustainability. This is because it requires observable exertion and massive field information. Towards generating a model that anticipates the vehicles’ price, we applied three ML methods (neural network, decision tree, support vector machine, and linear regression). However, the referenced methods have been applied to function together as a group in a hybrid model. The information utilized was gathered from an information and computer science school that houses different datasets. Separate exhibitions of several ML techniques were contrasted to reveal which one is suitable for the accessible information index. Various difficulties and challenges associated with this design have also been discussed. Moreover, the model was experimented, and a 90% precision was achieved. This potential result can help in providing precise vehicle deals in the emerging Internet of Things (IoT) for the sustainability paradigm.

1. Introduction

Each person has one business or the other in this world. Businesses nowadays have to be sustainable to meet financial backing. The business achievement is controlled by its deals and the exhibition of its item and, additionally, it is mainly distinguished by its deals [1]. Consequently, in improving the norm of the systems, business strategies and procedures are utilized. The procedure advances certain key terms, for example, benefit and misfortune. All these key terms are identified with the term sales. Sales expectation is one of the aces in business that may open the doors for obtaining information about the current market patterns and the approaches to vanquish the market. Sustainable market planning is the initial phase in businesses in each action they perform and subsequently realize what lies ahead as far as deals enormously helping in this planning procedure [2,3,4,5]. Deals expectation is an enormous advantage for income and buying [6]. Deals expectation gives the business ideas about the amount to purchase and how much not to purchase, what are the hazards that can be taken as far as income, how to design a spending plan, showcase patterns, a review of new items concurring with the associations capacity, what changes may occur if the arrangement comes up short, etc.
Machine learning suits this point more effectively in predicting sales [7,8,9,10,11,12,13]. Nowadays, machine learning is commonly used in sustainability. Numerous countries are hoping to turn into the main markets for car innovation. Given a few vehicle advertising insights, delineated in Figure 1, car innovation may be well on the way to increase in specific districts. While anticipating the cost of vehicles, we need whole various highlights and factors. The most noteworthy component is the brand and model of the vehicle, and the mileage assumes a significant job in foreseeing the cost of the vehicle. The most well-known element for vehicles is the kind of fuel and the volume of fuel which it expends for every mile. This specific informational index may profoundly influence the cost of a vehicle. Furthermore, we have to consider the cost of fuel, since it might change regularly [14,15,16,17]. Predicting the resale estimation of a vehicle is not a direct task. Some extraordinary factors that buyers interface critically in Mauritius are close to past owners, whether or not the vehicle had been locked in with certified incidents, and whether it is a lady-driven vehicle. There are trite data that the estimation of exchange vehicles depends upon different factors. The look and feel of the vehicle irrefutably contribute a lot to the expense. As ought to be self-evident, the cost depends upon incalculable components. Amazingly, all of these components are not commonly available and the buyer must choose the decision to purchase at a particular cost subject to barely any segments figuratively speaking. The exact vehicle esteem figure incorporates ace data, since the cost, when in doubt, depends upon various features and factors. Estimating these deals in vehicle businesses can be performed with a different assortment of innovations and one among them is the machine learning strategy. That may help in ordering the expectation of a car. It gives the maker an enormous lift in planning it, obtaining extra parts, obtaining key parts, lessening the waste items, and following its income model, its age, and different other activities. The classifiers utilized, for example, regression and SVM, furnish us with exact expectation results. Vehicle sales, prices, and deals have been used interchangeably in this paper. In this paper, we applied various strategies and procedures to accomplish the higher accuracy of the trade-in vehicle value forecast.
The main contributions can be highlighted as conducting proper literature concerning the topic in view, the collection of real data with proper cleaning, proposing several ML techniques for the prediction process, depicting and analyzing the experimental result obtained, and selecting the best approach suitable for the vehicle price prediction, and, finally, discussing major challenges and issues.
With the explanation behind this work, its structure is presented as follows. The review to evaluate the frameworks and strategies used, which includes related research, is presented in Section 2. However, Section 3 portrays the procedure and the materials used in conducting this experiment. Section 4 explains and puts forward the result obtained from the assessment. Lastly, Section 5 finishes the paper, which includes the commitment and the summary presented in this paper.

2. Literature Review
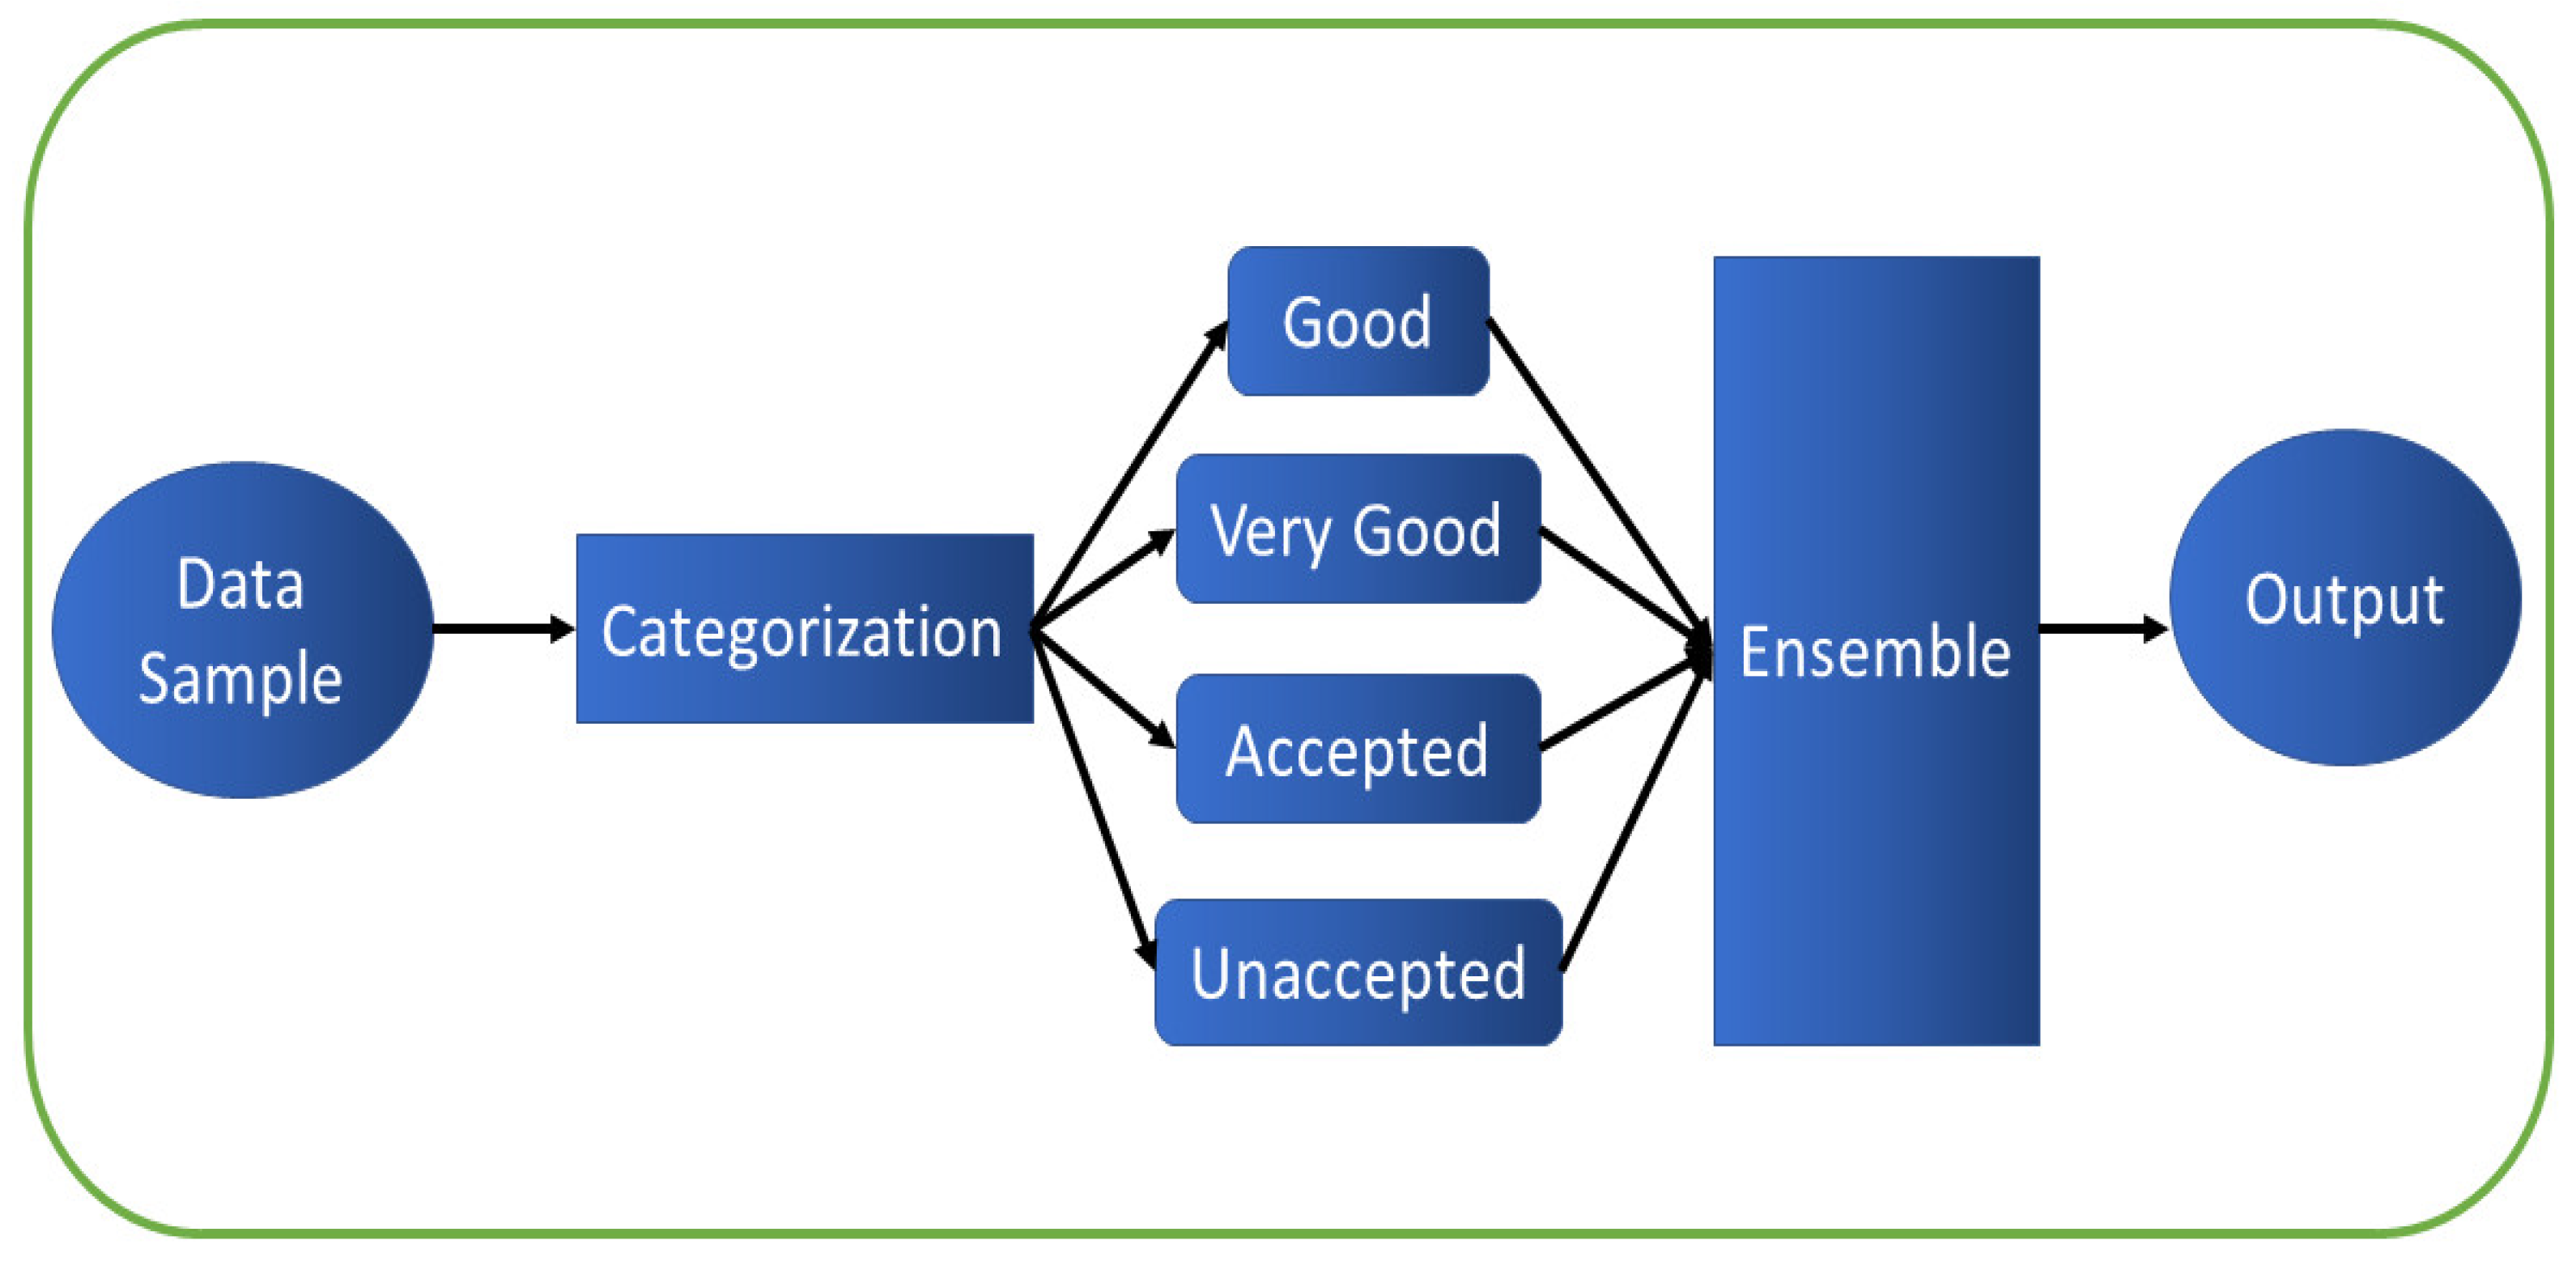
Vehicle deal forecast and ML is a work area that examines the improvement that occurs in the scholarly community and organizations with the guide of ML computations in foreseeing these deals for financial sustainability. Creators in [19] used a fluffy-based information structure to anticipate the expense of vehicle exchange. Only three elements were explicit: vehicle brand, creation year, and motor sort were considered in this assessment [20]. The proposed structure made a similar result when appearing differently with essential regression methodologies. Vehicle merchants in the USA sell an immense number of vehicles reliably through leasing [21]. Most of these vehicles are returned close to the completion of the leasing period and ought to be traded. Selling these vehicles at the right expense has major money-related issues for them to flourish. Along these lines, the Optimal Distribution of Auction Vehicles (ODAV) structure was made by creators in [21]. This structure does not simply check the best expense for trading the vehicles; moreover, it gives an urge on where to sell the vehicle. Since the United States is an immense country, the territory where the vehicle is sold in such a manner has a non-irrelevant impact on the selling cost of vehicles. A k-NN model was used for deciding the expense. Since this system was started in 2003, more than 2 million vehicles have been scattered through this structure [22,23,24].
Creators in [25] proposed another model reliant on the neural system framework to evaluate the private exchange of vehicles. The essential features used in this assessment are mileage, creator, and life expectancy. The model was moved up to manage nonlinear associations, which is incomprehensible with straight relapse procedures. It was found that this model was reasonably definite in predicting the extra estimation of vehicle exchange. This system gives encounters into the best expenses for vehicles, similar to the zone where it very well may be normal for pickups. Creators in [25] additionally proposed a model that is amassed using ANN at the cost desired for a vehicle exchange. They contemplated a couple of properties: speed, life length, and brand. The proposed model was gathered so it could oversee nonlinear relations in data with past models that were utilizing the relapse procedures. The model had the choice to envision the expenses of vehicles with the best precision over other direct models.
In addition, Pudaruth et al. [26] applied different ML calculations; to be specific: k-NN, numerous regression operations, naive Bayes, and a decision tree for vehicle value forecast in Mauritius. The dataset used to make a forecast model was gathered physically from neighborhood papers within one month, as time can noticeably affect the cost of the vehicle. They examined the accompanying properties: brand, model, cubic limit, and speed. In any case, the creator discovered that decision trees and naive Bayes could not anticipate and characterize numeric qualities. Moreover, the predetermined number of dataset examples could not give high grouping exhibitions, for example, correctness under 70% [27].
Creators in [28] built up a model for vehicle esteem gauges by using various relapse activities. The dataset was made for two months and consolidated the following features: cost, cubic breaking point, outside concealing, and so forth. In the wake of applying feature decisions, the makers thought about simple engine sort, esteem, model year, and model as data features. With the given course of action, makers had the alternative to achieve the desired exactness of 98%.
In the related work, as shown above, the authors proposed an estimated model subjected to the single ML computation. Regardless, it is noticeable that the lone ML estimation approach did not give astounding desired results and could be redesigned by storing up various ML methods in a company for financial sustainability.

3. Methodology

The most needed element for the forecast is brand and model, period of use of the vehicle, and mileage of the vehicle. Considering various highlights and factors with the assistance of a well-structured dataset, the vehicle deals expectation will be carried out precisely. Utilizing various highlights, such as entryway number, kind of transmission, measurements, security, whether it has route planning, and impact of the vehicle cost, were also considered. The fuel type utilized in the vehicle per mile exceptionally influences the cost of a vehicle because of a regular change in the cost of fuel. In this paper, we applied various strategies and methods to accomplish higher accuracy of the vehicle deals expectation. The method for vehicle prediction as described in this paper consists of a few stages, which appear in Figure 2. We show the steps below:
  • Data purifying and an assortment of notable datasets of the evaluations of car production.
  • The method of ML is chosen.
  • The model for vehicle prediction is obtained from the past information being handled.
  • The acquired result is broken down and visualized.

3.1. Data Description

The data are gathered from information and a computer science school that houses different datasets [29]. During the winter season, the period itself has a high effect on the cost of the vehicles. The model assesses vehicles, as indicated by the accompanying data structure: PRICE, overall price; CAR, car acceptability; MAINT, the maintenance price; buying, buying price; TECH, characteristics of technicality; persons, quantity of persons to carry; COMFORT, comfort; doors, number of doors; safety, evaluated wellbeing of the vehicle; lug_boot, capacity of the boot. Other than the objective idea (CAR), it incorporates three main attributes: COMFORT, PRICE, and TECH. Thus, the Database of Car Evaluation contains models with auxiliary data but straightforwardly relates it with five main attributes: maint, buying, persons, doors, and lug_boot. These selected attributes proffer the main elements when it comes to sales of cars. Due to the realized fundamental ideal structure, the database might be especially helpful for testing productive enlistment and structure disclosure techniques. After crude information has been gathered and put away in a structured format, the information preprocessing step was applied. A large number of the traits were inadequate and they do not contain helpful data for expectation. Subsequently, it is significant to expel them from the dataset. The gathered crude informational collection contains 1728 samples with 5 main attributes. The information was cleaned and spared into a CSV file format. Table 1 shows a speedy instance of the dataset with its characteristics. Buying signifies the price of purchasing the vehicle, maintenance signifies the cost of maintaining the vehicle, door signifies the number of doors the car has, persons signifies the number of people it can accommodate, luggage boot signifies the size of the boot, and class signifies the class of the vehicle. While Figure 3 shows the statistical characteristics of the class against the buying price, Figure 4 shows the correlation of each attribute against the other. It depicts a weak correlation regarding some attributes. Based on the experimentation carried out, it shows the results were productive after several parameter tunings regardless of the weak correlation.
Categorial values were converted to numerical values. Thus, values such as buying, maint, and class were converted to a number value, as machine learning deals with numerical values proficiently. Label encoder was used for this conversion, which is a package associated with the python programing language. The working process is that the categorical values were selected based on their data type and, finally, converting it appropriately using the python API known as label encoder.

3.2. Machine Learning Method Selection

In this paper, we use ML techniques in foreseeing unequivocally vehicle sales. On this recorded vehicle dataset for vehicle sales, techniques of supervised learning will be used in choosing a judicious model, which will set up the structure for the improvement of the framework for the vehicle forecast. Foreseeing vehicle execution is supposed to be one of the drifting issues; moreover, it addresses an inflexible assignment of data mining in instruction. Regression and SVM is one of the broadly utilized methods, and it is applied to obtain a judicious model that can be used to predict future data records. The strategy consolidates training and testing. In the readiness step, the planning dataset is separated utilizing the regression model. The guideline purpose of using the SVM is so that it will, in general, be successfully explained and unraveled. These techniques were selected due to their efficiency in prediction as discussed in the literature. Thus, the SVM and LR generate their efficiency from labeled data and on their tuning classification prowess. The NN mimics the human brain and it has widely been used for prediction. Hence, it works best on a large dataset and learning projection.
These are machine learning techniques selected because of their implementation in solving classification problems. It is expected that the selected technique will yield a productive result. The selected models have their pros and cons when it comes to classification. In the results, more insights will be given on the accuracy and the justification of each model.

3.3. Experimental Approach

During the test stage, before using the ML strategy, an examination was carried out on social occasions on the data to quickly recognize vehicles with a particular kind of lead. The task of data gathering was compulsory, since it is fundamentally the principal stage in mining data. During this errand, it presents the opportunity of perceiving similitudes with similar characteristics, which can be applied as a starting point to explore future gauges. In the resulting stage, using the regression against the characteristics of the vehicle evaluations, we can obtain the proportion of vehicles that will be recognized. The machine learning techniques utilized are LR, SVM, and NN. The entire informational collection gathered in this exploration was split into (90%) training and (10%) testing, then enhanced by using the K-fold cross-validation. Then, cross-validation was applied, followed by the bagging ensemble method to deduce which model fits best. Following this, we attempted it with various assessments and characteristics. The outcomes will be discussed in the accompanying section.
The parameter tuning used is the randomized search because of its mode of implementation. The process works by choosing its parameter randomly on the grid space instead of the process trying every combination possible. This mode of implementation is efficient when the goal is obtaining a good solution in as little time as possible. The random search mainly depends on its iteration value. The amount of iteration was set to 150 to maintain a balance so it does not become too high or too low to maintain a lower computation time.
Their primary center is to cause the vendor to comprehend the cycle that happens when there is an intense change and how the progressions occur. The association that occurs between any two fixed parts, which are likewise instituted as factors, and the technique used to characterize or figure the weightage of their bond is called regression investigation. At the primer level, the information age fills in as a key to comprehending this model. This is because of the alteration of indicators and the antagonistic impact it has on the standard variable. The LR works by looking for a linear relationship between the target and the feature variables. Thus, as utilized in this work, the resulting section will discuss how linearly separable the results are.
For input informational index, the SVM can settle on a paired choice and choose in which among the two classifications the information test has a place. Support Vector Machine can be utilized for tackling arrangement and relapse issues. In situations when input information is not marked, SVM calculation cannot be applied. The SVM calculation is prepared to mark input information into two classifications that are partitioned by the broadest zone conceivable between classifications. For unlabeled information, it is important to apply the SVM approach. The SVM was utilized with a fixed kernel initially for its hyperplane; subsequently, each fixed value was tuned because the kernel is the main determinant of how well the model will perform.
The decision tree (DT) is a machine learning supervised technique; it is used for building classification models. It consists of a tree-like structure where the outcomes are the leaf nodes. Meanwhile, other nodes aside from the leaf nodes are the decision nodes. In this case, a further split can be made based on each classification on a no/yes question. The goal here is to deduce a model that can predict the target variable by training it on simple decision rules based on the given data. In this case, the data split is determined by entropy.
Neural networks are the AI model that attempts to tackle issues similar to how the human brain does. In the human mind, neurons are associated with axons, while, in NN, the weights are utilized for associations between other neurons. Rather than neurons, the NN is utilizing weights, otherwise called perceptions. By changing the loads between neurons, the framework can be prepared for a better result. Data go through neurons utilizing associations between them, which is the weight, from one neuron datum to all the neurons associated with it. Initially, default values were used to see its initial results, and, subsequentially, each weight was tuned and the Relu activation function was used.
The bagging ensemble approach will assist in finding a solitary model that will give the best result. Instead of making one model and trusting this model, the bagging approach considers a myriad of techniques, and the models will be averaged to deduce the best one.

3.4. Computational Environment

The analyses completed in this paper were executed utilizing the VScode, which is an open-source condition that impels the usage of SL procedures. Tensorflow for VScode is a library that puts forth numerous careful capacities for regression and characterization errands. Specifically, the library utilizes straight regression, NN, KNN, and SVM bundles. Even though the current usage was not operated considering execution yet, it nevertheless summed up the examples and the best models. The experiment was assessed on a PC with 2.6 GHz and 8 GB RAM.

4. Results

Here, the goal is not to construe the farsighted limits of the model but to anticipate the vehicle deals concerning some properties and contrast the exactness of different models, as discussed in the previous section. The used models can give financial sustainability to businesses. However, this is with the purpose of giving a straightforward portrayal and summing up the best models. Hence, the entire dataset will be utilized when contrasting it with different models. The arrangements of the properties are buying, maintenance, door, persons, and luggage boot against the acceptability, which is acc. The single ML classifier approach that has been utilized in every single past examination was likewise tried in this exploration. The entire informational collection gathered in this exploration has been part of training (90%) and testing (10%) and, afterward, applying the K-fold cross-validation, which will be discussed in the accompanying section. Regression, DT, NN, and Support Vector Machine classifier models were manufactured. The SVM can be utilized for taking care of arrangements and relapse issues. For input informational collection, the SVM can settle on a double choice and choose which among the two classes the information test has a place. The SVM calculation is prepared to mark input information into two classifications that are isolated by the most stretched-out territory conceivable between classes. In situations where input information is not marked, SVM calculation cannot be applied.

Models’ Accuracy

The point here is not to reason the capacity of expectation for each model, but to give a basic portrayal that gives the distinctions in the precision of the SL models and pick the best. Hence, all qualities will be utilized in this execution. Table 2 shows the difference in each model on just a single classifier.
The results appearing in Table 2 affirm that the solitary classifier approach is not dependable on the expectation of vehicle prediction. Along these lines, in this paper, an ensemble strategy of vehicle cost forecast was proposed. To apply a group of ML classifiers, another characteristic, which is “Acceptability” with values: good, very good, accepted, and unaccepted, has been added to the informational index; this is based on the customer’s liking to the car/vehicle. These characteristics partition vehicles into these value classifications (good, very good, accepted, and unaccepted). Group strategy joins three ML calculations that were applied in the main analysis as a single classifier: LR, DT, SVM, and NN. The LR was applied in the general dataset to test how precisely the classifier can predict tests into the expressed vehicle classes. The LR is an estimator that fits various classifiers and utilizes averaging to improve the prescient exactness and power over-fitting.
After the models are manufactured, they all have been amassed into the last prediction framework, which appears in Figure 5. Cross-validation is a method to assess prescient models by apportioning the first sample into a preparation set to prepare the model and a test set to test it. In cross-validation (k-folds), the first example is randomly divided into k equivalent-size subsamples. The cross-validation measure is then processed 10-fold, with every one of the k subsamples utilized precisely once as the approval data. The k results from the folds would then be able to be consolidated to deliver a solitary assessment. Then, they are all ensembled using the bagging approach to obtain the best result. Thus, for the instance of cross-validation, the SVM accomplished the most accurate precision on all subsets, while DT and NN performed better in the second and third place, respectively. Thus, for the instance of 90% dataset split, the SVM accomplished the most accurate precision, which are good, accepted, and unaccepted subsets, while NN performed better in the very good subset, as shown in Table 3. The last forecast framework empowers potential vehicle purchasers to gauge the cost of the ideal vehicle. The proposed forecast model is assessed on the test level and the model accomplished general precision of up to 90%. This demonstrates a blend of numerous AI classifiers that fortifies the grouping execution in general.
Table 4 shows the results compared with other works. The table is improved with several relevant parameters to the utilized predicting models. All the models utilized the same attributes and folds to remove all attributes of bias. The results show that the best model is the SVM, with 90% accuracy when compared to the least, which is the LR with 84%. The results show that tuning each parameter or considering various other justifiable parameters can lead to a better result, just like the NN compared to its single classifier.

5. Conclusions

Vehicle deals forecast gives the business minds’ consideration, the sum to buy and how much not to buy, the risk that can be taken that is similar to salary, how to configure a spending plan, grandstand designs, new equipment agreeing with the affiliations limit, what changes may happen if the course of action misses the mark, and so forth. This is an interesting topic in this era of IoT and sustainability. Vehicle sales expectations are challenging due to the high number of characteristics that ought to be taken into account for an accurate forecast. Thus, the main advances in the expectation procedure are the preprocessing and assortment of the data. In this examination, cleaning information was vital in maintaining significant data for ML calculations. The information cleaning is a process that builds expectation execution but is deficient for the cases of complex instructive files, such as the one in this assessment. ML techniques, such as linear regression, DT, NN, and SVM, were attempted. Furthermore, unequivocal information conclusions were explored. The results obtained reveal that it is viable in achieving a high exactness of prediction. Using a single ML technique on the informational index precision was not persuasive. In this way, the troupe of various ML implementations is proposed and this mix of ML strategies obtains an exactness of 90%, with SVM being the best model after utilizing the ensemble method. This is a noteworthy advancement compared to a single ML approach. The results show the best model is the SVM, with 90% accuracy when compared to the least, which is the LR. The results show that tuning each parameter or considering various other justifiable parameters can lead to a better result, just like the NN compared to its single classifier. In any case, the weakness of the proposed system is that it consumes essentially more computational resources than a single AI count. The result shows that the SVM has an efficient classifying power if utilized properly. Even though this structure has achieved great execution in a vehicle deal estimate, there are still a few limitations that need to be addressed; our emphasis in the future investigation is to test this system to work viably with various instructive lists. Likewise, more examination is to be conducted to provide more understanding of why and how a few properties influence the forecast presentation. This investigation is said to build vehicle forecasts in the era of IoT and sustainability significantly whenever taken into thought.

Author Contributions

Formal analysis, C.A.; Funding acquisition, S.A.; Writing—original draft, A.A.H.; Writing—review and editing, F.A.-T. All authors have read and agreed to the published version of the manuscript.

Funding

This research received no external funding.

Institutional Review Board Statement

Not applicable.

Informed Consent Statement

Not applicable.

Data Availability Statement

Not applicable.

Acknowledgments

I want to acknowledge all authors for their outstanding contribution to this work.

Conflicts of Interest

The authors declare no conflict of interest.

Abbreviations

TermsMeaning
ICTInformation and Communication Technologies
ODAV Optimal Distribution of Auction Vehicles
ANNArtificial Neural Network
MFMatrix Factorization
MLMachine Learning
NNNeural Networks
LRLinear Regression
SLSupervised Learning
VSVirtual Studio
SVMSupport vector machine

References

  1. National Transport Authority. 2014. Available online: http://nta.gov.mu/English/Statistics/Pages/Archive.aspx (accessed on 15 January 2014).
  2. Yao, B.; Feng, T. Machine Learning in Automotive Industry. Adv. Mech. Eng. 2018. [Google Scholar] [CrossRef]
  3. Theissler, A.; Pérez-Velázquez, J.; Kettelgerdes, M.; Elger, G. Predictive maintenance enabled by machine learning: Use cases and challenges in the automotive industry. Reliab. Eng. Syst. Saf. 2021, 215, 107864. [Google Scholar] [CrossRef]
  4. Ali, S.E.A.; Rizvi, S.S.H.; Lai, F.; Ali, R.F.; Jan, A.A. Predicting Delinquency on Mortgage Loans: An Exhaustive Parametric Comparison of Machine Learning Techniques. Int. J. Ind. Eng. Manag. 2021, 12, 1–13. [Google Scholar]
  5. Zivlak, N.; Rakic, S.; Marjanovic, U.; Ciric, D.; Bogojevic, B. The Role of Digital Servitization in Transition Economy: An SNA Approach. Teh. Vjesn. 2021, 28, 1912–1919. [Google Scholar]
  6. Motors Mega. 2014. Available online: http://motors.mega.mu/news/2013/12/17/auto-market-8-decrease-sales-newcars/ (accessed on 17 January 2014).
  7. Hussain, A.A.; Bouachir, O.; Al-Turjman, F.; Aloqaily, M. AI Techniques for COVID-19. IEEE Access 2020, 8, 128776–128795. [Google Scholar] [CrossRef] [PubMed]
  8. Al-Turjman, F.; Nawaz, M.H.; Ulusar, U.D. Intelligence in the Internet of Medical Things era: A systematic review of current and future trends. Comput. Commun. 2019, 150, 644–660. [Google Scholar] [CrossRef]
  9. Milošević, M.; Živić, N.; Andjelković, I. Early churn prediction with personalized targeting in mobile social games. Expert Syst. Appl. 2017, 83, 326–332. [Google Scholar] [CrossRef]
  10. Monburinon, N.; Chertchom, P.; Kaewkiriya, T.; Rungpheung, S.; Buya, S.; Boonpou, P. Prediction of prices for used car by using regression models. In Proceedings of the 2018 5th International Conference on Business and Industrial Research (ICBIR), Bangkok, Thailand, 17–18 May 2018; pp. 115–119. [Google Scholar]
  11. Madhuvanthi, K.; Nallakaruppan, M.K.; Senthilkumar, N.C.; Siva Rama Krishnan, S. Car sales prediction using machine learning algorithms. Int. J. Innov. Technol. Explor. Eng. 2019, 8, 1039–1050. [Google Scholar]
  12. Hussain, A.A.; Al-Turjman, F. Resource Allocation in Volunteered Cloud Computing and Battling COVID-19; CRC Press: Boca Raton, FL, USA, 2020. [Google Scholar] [CrossRef]
  13. Singh, Y.; Bhatia, P.K.; Sangwan, O. A review of studies on machine learning techniques. Int. J. Comput. Sci. Secur. 2007, 1, 70–84. [Google Scholar]
  14. Agencija Za Statistiku BiH. (n.d.). Available online: http://www.bhas.ba (accessed on 18 July 2018).
  15. Ahmed Hussain, A.; Dimililer, K. Student Grade Prediction Using Machine Learning in Iot Era. In Proceedings of the Forthcoming Networks and Sustainability in the IoT Era, First EAI International Conference, FoNeS—IoT 2020, Virtual Event, 1–2 October 2020. [Google Scholar]
  16. Ullah, Z.; Al-Turjman, F.; Mostarda, L.; Gagliardi, R. Applications of Artificial Intelligence And Machine Learning in Smart Cities. Elsevier Comput. Commun. J. 2020, 154, 313–323. [Google Scholar] [CrossRef]
  17. Al-Turjman, F.; Baali, I. Machine Learning for Wearable IoT-based Applications: A Survey. Trans. Emerg. Telecommun. Technol. 2019, e3635. [Google Scholar] [CrossRef]
  18. Lutsey, N. Transition to a Global Zero-Emission Vehicle Fleet: A Collaborative Agenda for Governments. 2015. Available online: https://theicct.org/sites/default/files/publications/ICCT_GlobalZEVAlliance_201509.pdf (accessed on 24 March 2022).
  19. Wu, J.D.; Hsu, C.C.; Chen, H.C. An expert system of price forecasting for used cars using adaptive neuro-fuzzy inference. Expert Syst. Appl. 2009, 36, 7809–7817. [Google Scholar] [CrossRef]
  20. Jin, J.; Sun, W.; Al-Turjman, F.; Khan, M.; Yang, X. Activity Pattern Mining for Healthcare. IEEE Access 2020, 8, 56730–56738. [Google Scholar] [CrossRef]
  21. Du, J.; Xie, L.; Schroeder, S. Practice Prize Paper—PIN Optimal Distribution of Auction Vehicles System: Applying Price Forecasting, Elasticity Estimation and Genetic Algorithms to Used-Vehicle Distribution. Mark. Sci. 2009, 28, 637–644. [Google Scholar] [CrossRef]
  22. Al-Turjman, F.; Lemayian, J. Intelligence, Security, and Vehicular Sensor Networks in Internet of Things (IoT)-enabled Smart-cities: An Overview. Elsevier Comput. Electr. Eng. J. 2020, 87, 106776. [Google Scholar] [CrossRef]
  23. Bohanec, M.; Borštnar, M.K.; Robnik-Šikonja, M. Explaining machine learning models in sales predictions. Expert Syst. Appl. 2017, 71, 416–428. [Google Scholar] [CrossRef]
  24. Safar, A.; Safar, M. Intelligent Flower Detection System Using Machine Learning. In Advances in Intelligent Systems and Computing; Intelligent Systems and Applications; IntelliSys 2019; Bi, Y., Bhatia, R., Kapoor, S., Eds.; Springer: Cham, Switzerland, 2020; Volume 1038. [Google Scholar] [CrossRef]
  25. Gonggi, S. New model for residual value prediction of used cars based on BP neural network and non-linear curve fit. In Proceedings of the 3rd IEEE International Conference on Measuring Technology and Mechatronics Automation (ICMTMA), Shanghai, China, 6–7 January 2011; IEEE Computer Society: Washington, DC, USA, 2011; Volume 2, pp. 682–685. [Google Scholar]
  26. Pudaruth, S. Predicting the price of used cars using machine learning techniques. Int. J. Inf. Comput. Technol. 2014, 4, 753–764. [Google Scholar]
  27. Al-Turjman, F.; Malekoo, A. Smart Parking in IoT-enabled Cities: A Survey. Elsevier Sustain. Cities Soc. 2019, 49, 101608. [Google Scholar] [CrossRef]
  28. Noor, K.; Jan, S. Vehicle Price Prediction System using Machine Learning Techniques. Int. J. Comput. Appl. 2017, 167, 27–31. [Google Scholar] [CrossRef]
  29. Dua, D.; Graff, C. UCI Machine Learning Repository; University of California, School of Information and Computer Science: Irvine, CA, USA, 2019; Available online: http://archive.ics.uci.edu/ml (accessed on 24 March 2022).
  30. Samruddhi, K.; Ashok Kumar, R. Used Car Price Prediction using K-Nearest Neighbor Based Model. Int. J. Innov. Res. Appl. Sci. Eng. 2020, 4, 686–689. [Google Scholar] [CrossRef]
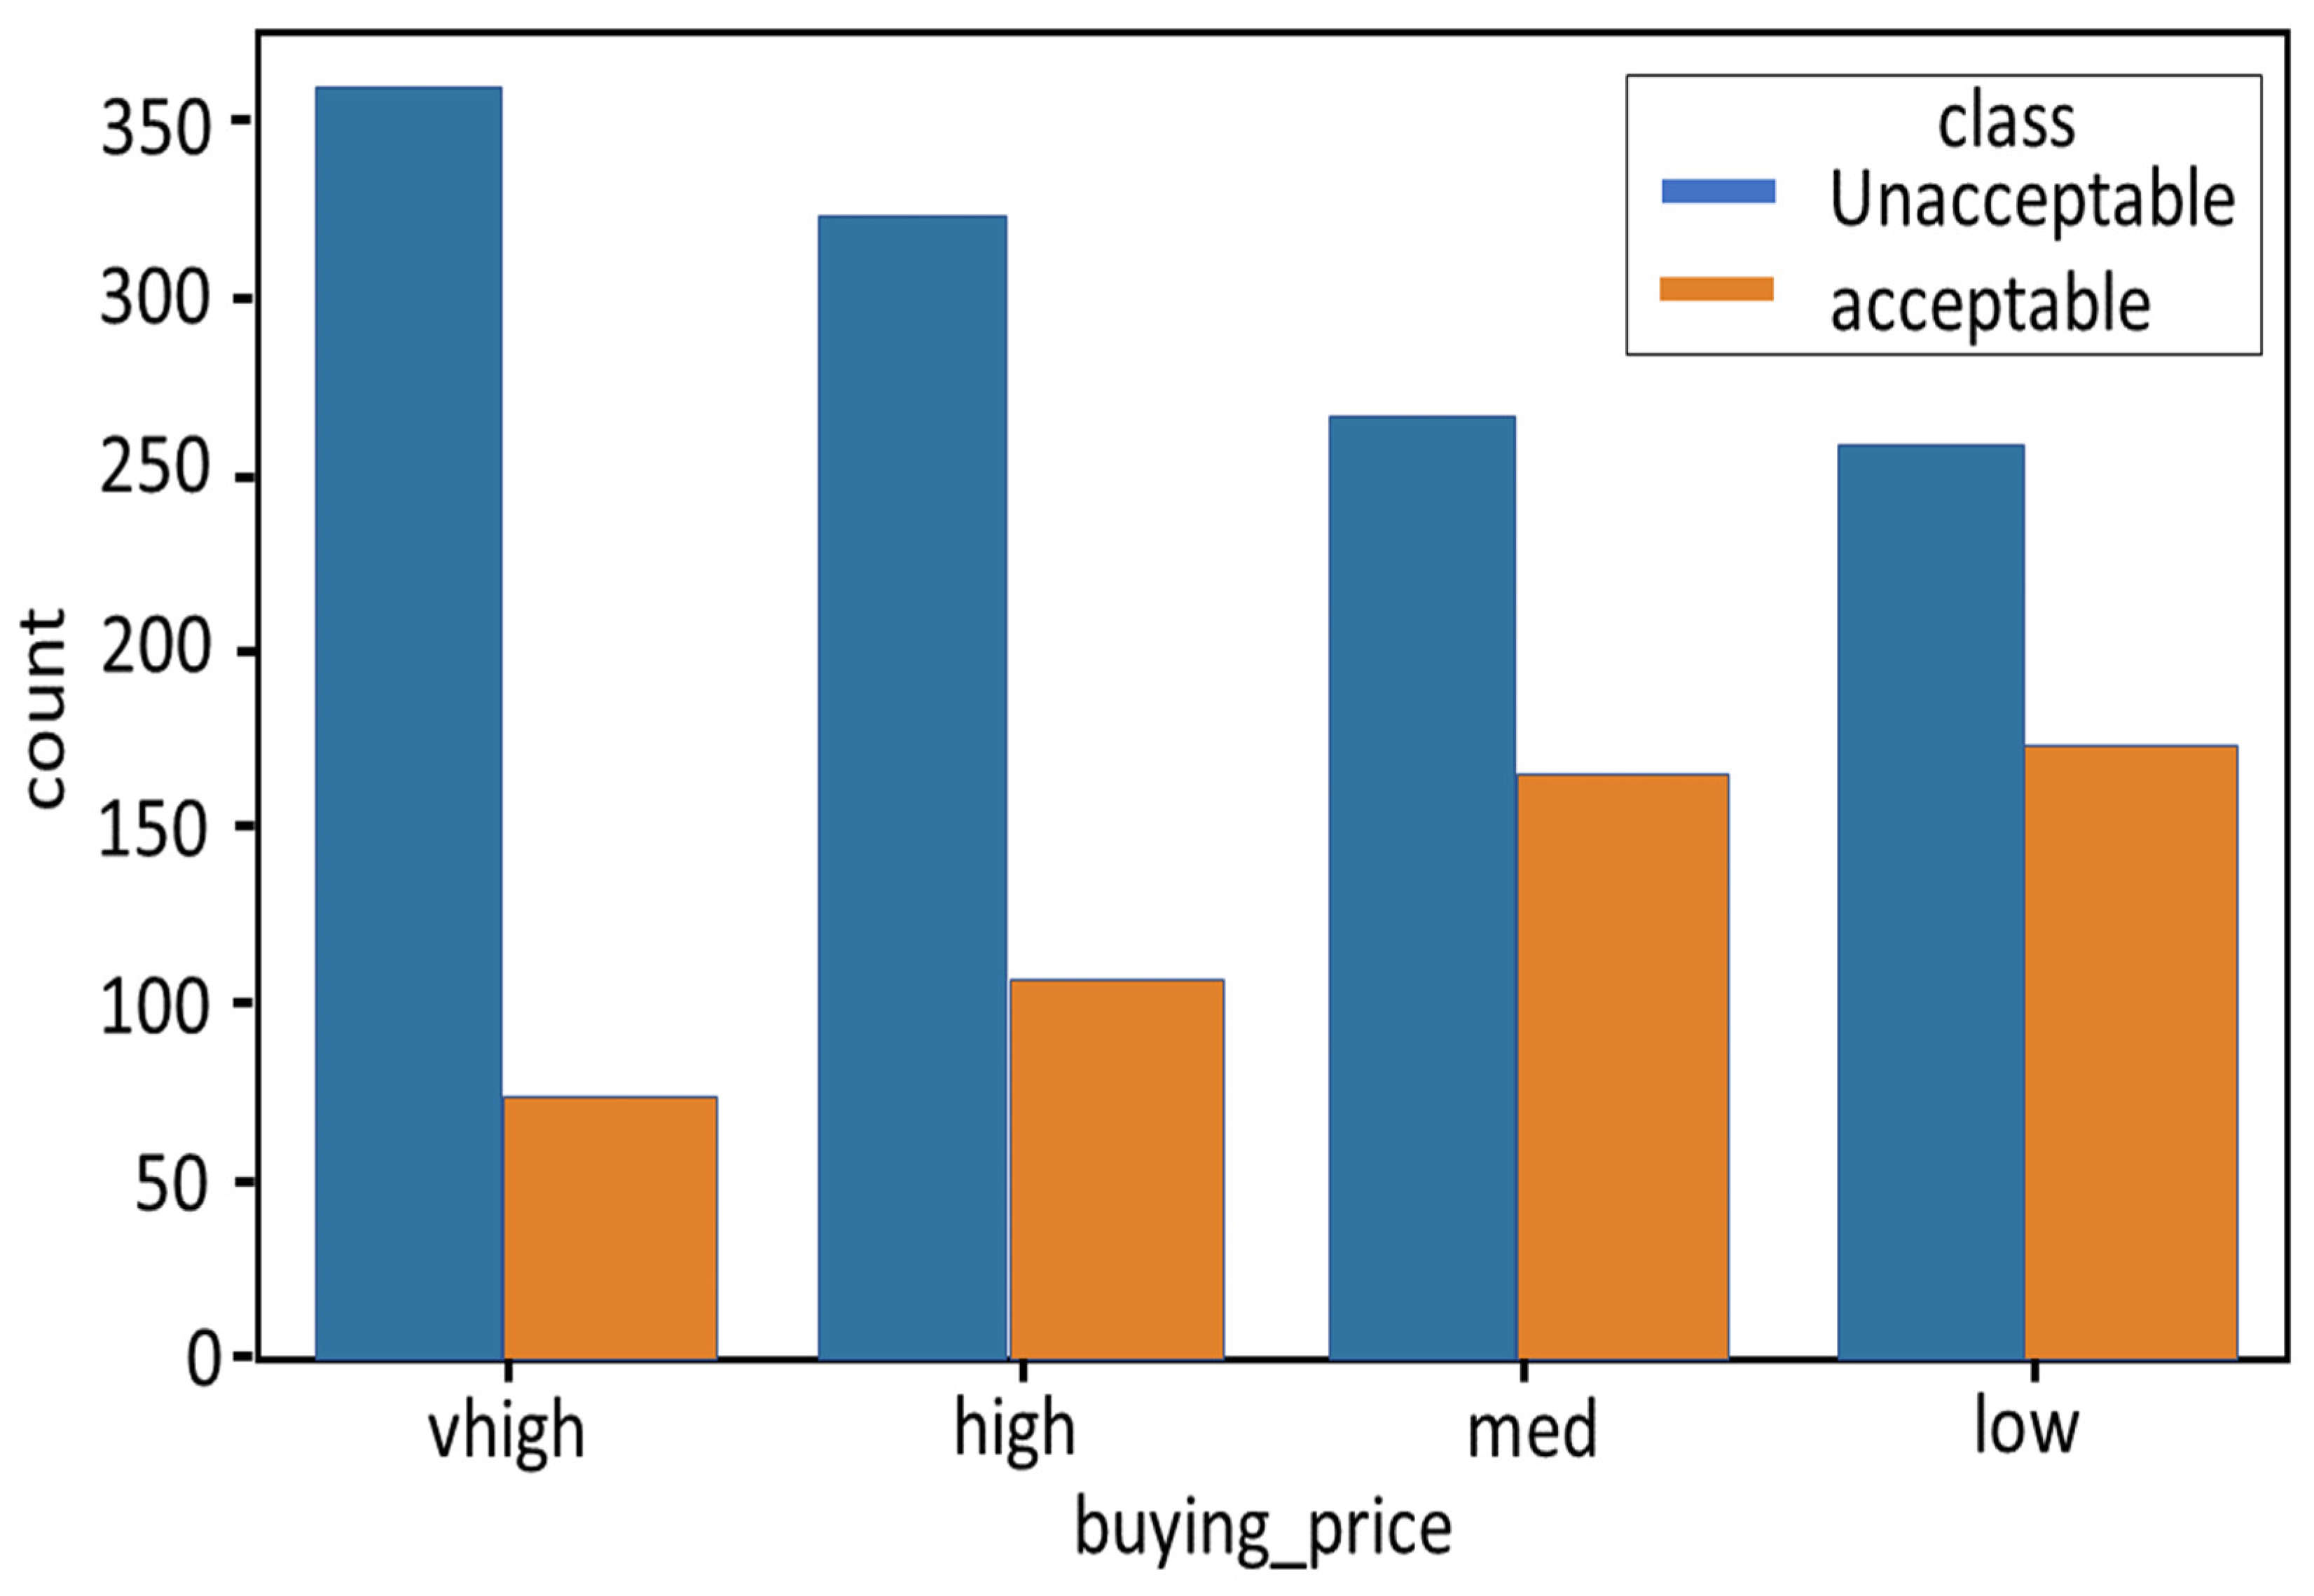
Figure 1. Illustration of the annual global car sales [18].
Sustainability 14 09147 g001
Figure 2. Methodology approaches.
Sustainability 14 09147 g002
Figure 3. A statistical view of the class against the buying price.
Sustainability 14 09147 g003
Figure 4. A statistical view of the correlation.
Sustainability 14 09147 g004
Figure 5. Depicting the 90% split prediction model.
Sustainability 14 09147 g005
Table 1. Samples of the dataset.
NumberBuyingMaintenanceDoorPersonsLuggage BootClass
0Very HighVery High22SmallUnacceptable
1Very HighVery High22SmallUnacceptable
2Very HighVery High22SmallUnacceptable
3Very HighVery High23MediumUnacceptable
4Very HighVery High22MediumUnacceptable
Table 2. Approach on a single classifier.
ModelsAccuracy (%)Error (%)
LR0.410.8
SVM0.490.10
DT0.450.6
NN0.420.7
Table 3. Accuracies of various models with 90% split.
ModelsLRSVMDTNN
Good/90% split0.810.860.850.83
10-fold cross-validation0.790.860.860.81
Very Good/90% split0.820.830.820.86
10-fold cross-validation0.760.780.750.79
Accepted/90% split0.840.900.880.85
10-fold cross-validation0.770.790.780.78
Unaccepted/90% split0.840.880.850.85
10-fold cross-validation0.780.820.810.81
Table 4. Experimental result comparison with other models (%).
AuthorsRecallPrecisionF1 ScoreAccuracy
[26] DT---0.66
[30] KNN---0.85
This paper (SVM)0.920.890.910.90
This paper (NN)0.880.870.870.86
This paper (DT)0.890.880.890.88
This paper (LR)0.870.860.870.84
Publisher’s Note: MDPI stays neutral with regard to jurisdictional claims in published maps and institutional affiliations.

