Abstract
Mining activities generate a large amount of solid waste called tailings, and it often contains a certain number of heavy metals, depending on the different types of minerals. To avoid disasters caused by the diffusion of tailings and their infiltration into surface water, mines often use tailings ponds as a surface coverage structure. This study mainly focused on the shear strength of surface coverage isolation layer soil under low normal stress. The soil isolation layers with different values of dry bulk density, water content, bentonite content, and Pb(II) ion concentration were treated with direct shear strength under normal stress at 12.5, 25, 50, and 100 kPa. It was found that when the dry bulk density was increased from 1.1 g/cm3 to 1.3 g/cm3, the shear strength increased by 49.3%~117.2%, and when the water content was decreased from 24% to 16%, the shear strength increased by one to three times. With the addition of bentonite in proportions from 18% to 30%, shear strength increased by 1.9 to 116.9 kPa, and the degree of improvement was related to both dry bulk density and water content; the specimens with bentonite added were more sensitive to Pb(II) ion concentration, and when the specimen with 24% bentonite addition was compared with the specimen without the addition of bentonite, both under a Pb(II) ion concentration of 5 mg/L, the shear strength decreased by 8.1~35.6 kPa, the internal friction angle decreased by 0.5~9.7°, the cohesion force decreased by 5.8~37.7 kPa, and the shear modulus decreased by 5~12 kPa/mm. Therefore, in order to maintain good mechanical properties in the surface covering structure, it is necessary to maintain a high dry bulk density, low water content, and bentonite content of no less than 24%.
1. Introduction
Metal and non-metal mineral resources play a very important role in a country’s development, but the extraction of mineral resources also poses serious environmental problems while promoting the economy. In mining activities, a certain number of heavy metals is produced, and with the development of mineral resources, some heavy metals are enriched in tailings ponds, thus forming heavy metal tailings ponds which occupy a large amount of land resources, while at the same time also causing serious ecological damage and environmental pollution to the mine and its surrounding environment [1,2,3]. If the tailings pond solid waste leachates, such as waste rock and tailings, are allowed to be directly discharged or the tailings are allowed to escape with the wind, a large number of heavy metals are enriched in the soil around the mining area. If they are diffused from the soil to other parts of the ecosystem, such as groundwater and crops, this could endanger human health through the food chain [4,5,6].
For this reason, experts and scholars have oriented their research toward alkaline-mixed isolation materials [7] and hardpan isolation layers [8] to prevent tailing oxidation and diffusion; moreover, a study focused on various reclamation methods [9], and the parameters of the surface coverage profile of tailings ponds [10] were also investigated to solve the problem and to prevent tailings from escaping, reducing surface water infiltration and weathering and acidification of tailings. The surface coverage structure is shown in Figure 1, whereby the isolation layer is constructed for the purposes of impermeability and the adsorption of heavy metal ions. In many studies, sodium-based bentonite has been an important modified material for the isolation and adsorption of Pb(II) ions. Adding bentonite can adsorb and fix Pb(II) ions [11,12] and can reduce the permeability of the isolation soil [13], lending the isolation soil good waterproofing and pollution interception performance. However, the addition of bentonite leads to the improvement of the compressive properties of loam or sandy soil [14,15,16]. Under lower normal stress, isolation soil made of soil–bentonite undergoes greater settlement compared to soil without the addition, resulting in shearing. Cracks caused by shear damage lead to a decline in the water resistance of the surface coverage structure and the leakage of heavy metal ions. This kind of damage is largely shear damage [17]. Therefore, it is necessary to study the shear strength properties of soil–bentonite materials to prevent geological hazards and environmental risks caused by isolation soil damage. To ensure the stable operation of the isolation layer, this study took the isolation layer in the surface coverage structure of the heavy metal tailings pond as the research object and studied the influence of different conditions and Pb(II) ion concentrations on the shear strength, as well as parameters of the isolation soil under low normal stress and its changing laws.
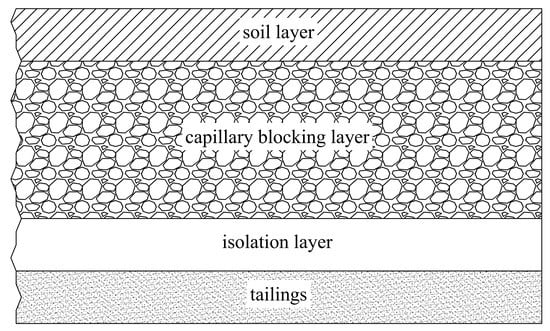
Figure 1.
Schematic diagram of surface coverage structure of a tailings pond.
2. Materials and Methods
2.1. Materials
The soil used in the experiment is from Jianshui County, Yunnan Province; it is reddish-brown, which is typical of the layer subjected to desiliconization, and rich in aluminum. It has a loose, crumb-like structure and many plant roots. The red soil used is found 0~40 cm below the surface of the mountain slope, and the natural soil water content is 20.54%. The natural dry bulk density is 1.18 g/cm3. The bentonite is from Lingshan County, Hebei Province; it is a white powder with the molecular formula of Nax(H2O)4 (AI2-xMg0.83) Si4O10) (OH)2 and is made by exchanging calcium-based bentonite with sodium ions. Its basic coefficient is 1.3, and its montmorillonite content reaches 63%. The optimum water content, maximum dry density, and liquid–plastic limit of the material are shown in Table 1. A Pb(II) ion standard solution of 1 mg/L was purchased from the China National Pharmaceutical Group for material analysis and testing.

Table 1.
Basic properties of materials.
The test specimen was made using a soil sample pressure device with a diameter of 61.8 mm and a height of 20 mm, produced by Changzhou 80 Future Intelligent Technology Co., Ltd., Changzhou, China. The bentonite was mixed into the soil in mass ratios of 0%, 18%, 24%, and 30%. The dry bulk density was 1.1, 1.2, and 1.3 g/cm3 and the water content was 16%, 20%, and 24%, whereby the 16% and 20% water content specimens were obtained by evaporating the 24% water content specimens at room temperature. The test specimens were all made with different concentrations of Pb(II) ion solutions and maintained for 10 days. According to the “Identification of Leaching Toxicity of Hazardous Waste Identification Standards” (GB 5085.3-2007), it was assumed in the experiment that the concentration of the leaching solution was related to the concentration of the unsaturated compacted soil and that when the Pb(II) ion concentration in the specimen was equal to that in the solution, chemical equilibrium had been achieved. On the basis of this assumption, the Pb(II) ion heavy metal solution concentrations used to treat the different specimens were selected as 0 mg/L, 0.2 mg/L, 1 mg/L, and 5 mg/L. To make contaminated specimens, the same method described above for the water content test group was used, replacing water with Pb(II) solution.
The names of each experimental group are shown in Table 2 below, where D represents the dry bulk density, B represents the content of bentonite, W represents the water content, and E represents the concentration of Pb(II) ions.

Table 2.
Detailed parameter names and interpretation of the experimental groups.
2.2. Method
The surface coverage structure is located on the top of the tailings pond and the isolation layer is buried at a very shallow depth beneath surface; therefore, the lateral pressure to which it is subjected is basically negligible, and a direct shear test is appropriate. The surface coverage structure is designed with a capillary blocking layer, one of the functions of which is to perform drainage, keeping the isolation layer from becoming saturated; therefore, it was decided that the direct shear test model would be undrained quick cut. In the direct shear test experiment, several samples of the same soil were subjected to different vertical pressures, the horizontal shear force was applied directly along the fixed shear plane to obtain the shear stress at failure, and then the shear resistance of the soil was determined according to Coulomb’s law.
The test used a ZJ strain-controlled electric direct shearing instrument manufactured by Nanjing Soil Instrument, as shown in Figure 2. The ring force coefficient is 1.588 mm/kPa, the shear strain rate is 0.8 mm/min, and the peak strength depends on the failure of the specimen or else corresponds to the maximum shear strain of 10%. The pressure of the overlying soil layer covered by the surface can be converted into equivalent stress, and the pressure gradients used in the laboratory experiments were 12.5, 25, 50, and 100 kPa. The drawing software used was Origin2017.
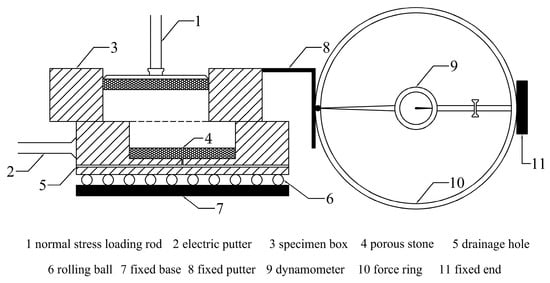
Figure 2.
Schematic diagram of direct shear instrument.
2.3. Theory
The most commonly used calculation formula for the shear stress and normal stress of rock and soil is the Mohr–Coulomb Formula [18]:
In this formula, τ (kPa) is the shear strength of the specimen under a certain normal stress and c (kPa) is the cohesion force inside the specimen, which is determined by the interaction force between soil particles and depends on the size and contact of the particles. σ (kPa) is the normal stress, which is the stress applied in the normal direction of the specimen, and φ (°) is the internal friction angle, which reflects the friction force of the soil particles inside the specimen. In addition, when discussing the shear strength of the specimen, its mechanical parameters and stress–strain curve can be used to reflect the influence of various factors on the shear strength of the specimen during the failure process.
3. Results and Discussion
3.1. Influence of Dry Bulk Density and Water Content
The bulk density affects compacted unsaturated soil such that the shear strength gradually increases with an increasing dry bulk density, and the degree of the increase decreases significantly with increasing water content. When the water content is around the natural water content (20%), the shear strength has a significant positive correlation with the dry bulk density, as shown in Figure 3. When the dry bulk density was 1.1 g/cm3, the shear strength of the specimen was 27.3, 35.3, 50.3, and 79.7 kPa in the range of 12.5~100 kPa; when the dry bulk density increased to 1.2 g/cm3, the shear strength was 35.7, 46.8, 60.9, and 90.5 kPa; and when the bulk density was 1.3 g/cm3, the shear strength was 55.3, 64.9, 83.7, and 116.2 kPa. Correspondingly, when the dry bulk density was 1.1 g/cm3, c was 29.86 kPa and the corresponding φ was 31.4°; when the bulk density increased to 1.2 g/cm3, c was 47.5 kPa and φ was 34.8°; and when the dry bulk density was 1.3 g/cm3, c was 57.5 kPa and φ was 37.5°; therefore, with increasing dry bulk density, the cohesion force and the internal friction angle increased. Zhang et al. [19] studied the variation law of shear strength with the dry bulk density of intermountain surface loam and found it to have the same trend as presented in our research. The main reason for this phenomenon is that the increase in dry bulk density changes the contact mode between soil particles. In the low bulk density state, the contact mode between the particles is point contact. In the high bulk density state, due to the dense particle distribution and extrusion, the point contact mode becomes a point–surface contact or a surface contact, which greatly increases the cohesion and internal friction angle, resulting in an increase in shear strength [20,21].
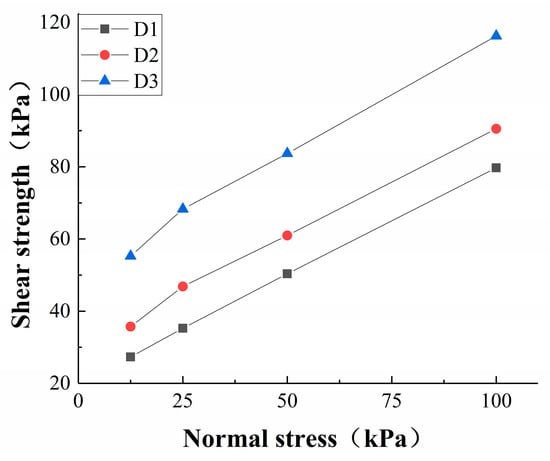
Figure 3.
Shear strength of B0W20 at different dry bulk densities.
The water content is negatively correlated with the shear strength of compacted unsaturated soil. The higher the water content, the lower the value to which shear strength decreases. The decrease in water content can effectively result in an increase in the shear strength of the soil. As shown in Figure 4, when the dry bulk density was 1.3 g/cm3, the Mohr–Coulomb line of the shear strength under the 16% water content condition was much higher than the shear strength of the other cases, and the changes in the c and φ values are shown in Table 3. Decreasing water content results in an increase in shear strength and increases the cohesion and the angle of internal friction. Taking D3 as an example, when the water content was decreased from 24% to 16%, c increased from 19.8 kPa to 111.7 kPa and φ increased by 16.1°. These results are similar to the research conclusions on the shear strength of specimens under high normal stress of 100~400 kPa presented by Huang et al. [22], where it was concluded that the reduction in water content changed the cohesion and the internal friction angle. The above phenomenon was also exhibited under the low normal stress of 100 kPa, and the Mohr–Coulomb line in this study was not linear. It can be seen from Figure 4 that with increasing normal stress, c increased while φ gradually decreased. Under the influence of water content and dry bulk density, the lower the dry bulk density and the greater the water content, the lower the shear strength. The change trend of the mechanical parameter c was positively correlated with the shear strength, although φ decreased. The amplitude ratio was smaller, and the change was relatively stable. In the case of low bulk density, since there are still many pore structures that are not filled at low bulk density, the particles are in a state of point contact, and the water content is not able to change their loose state [19]; therefore, it can be seen that shear strength and related parameters increase to a lesser extent.
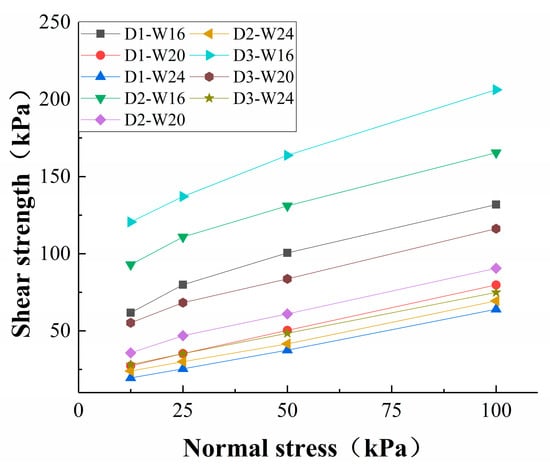
Figure 4.
Shear strength of B0 at different dry bulk densities.

Table 3.
Cohesion and internal friction angle of remodeled soil with different moisture content and bulk density.
In the experimental group of dry bulk density and water content, the Mohr–Coulomb curve was not a straight line but indicated lower shear strength under lower stress, as can be seen for D3-B16, D3-B20, D2-B16, and D1-B16. With increasing normal stress, the shear strength showed a nonlinear increase and the internal friction angle continued to decrease to the internal friction angle in the high-water-content experimental group, whereby the same phenomenon was described by Xiao et al. [23]. With increasing normal stress, the growth rate of the strength gradually decreased to a stable state. Under the normal stress of 0~50 kPa, the shear strength of the soil presented a nonlinear increase, and after reaching 50 kPa, it showed a stable linear increase.
In this experimental group, the Mohr–Coulomb curves fitted by the experimental groups with water contents of 16% and 20% were compared with the Mohr–Coulomb curve formed by connecting the 50~100 kPa line, and it was found that when the water content was greater than 20%, both c and φ were similar. In the research of Xiao et al. [23], there was also a Mohr–Coulomb curve formed by connecting two points. The values of c and φ decreased with increasing normal stress and tended to be stable. Combined with the content of this study, the slope of the 50~100 kPa segment, the internal friction angle, and cohesion results are listed for comparison, and the results are shown in Table 3.
On the basis of Figure 5 and Table 3, it can be found that in the two fitted Mohr–Coulomb curves, the full-phase curve in Figure 4 of 12.5~100 kPa is not linear but shows nonlinearity under low stress; therefore, the fitted Mohr–Coulomb curve was not very close to the real values measured by the test. After fitting the full-phase curve to a straight line (AC), the specific performance showed that the c value of AC was lower than the value of the 50~100 kPa curve (HC), and the φ value of the AC segment curve was higher than that of the HC curve. With decreasing water content, the φ value increased more, and in the specimen with a water content of 24%, it was found that the φ value became stable in this range, while both c and φ showed an increase with increasing dry bulk density and a decrease with decreasing water content.
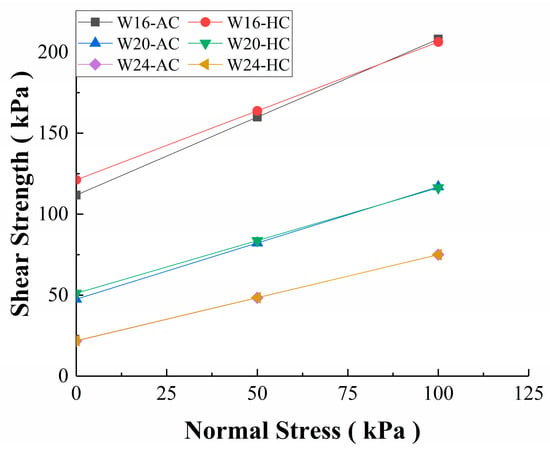
Figure 5.
Mohr–Coulomb curves fitted as AC and HC in B0D3.
According to the research conclusions of Huang et al. [22], when the normal stress is higher than 100 kPa, c and φ are greatly affected by water content. In this study, in the experimental group with 16% water content under the loading of different normal stresses in the range of 12.5~100 kPa, the φ value gradually decreased with increasing normal stress until a relatively stable value coinciding with the value of the linear Mohr–Coulomb curve was exhibited in the high stress stage; this same phenomenon was reported in the research by Xiao et al. Although the AC’s parameters have a certain deviation compared with the linear parameters, they reflect the specimen’s the actual value, so this paper discusses the actual value of c and φ within the range of 12.5~100 kPa.
3.2. Influence of Bentonite Content
The addition of bentonite can effectively increase the shear strength of unsaturated compacted soil. When the content of bentonite increased from 0% to 30%, the shear strength increased significantly in each water content stage, especially at low water content. Comparing Figure 5 with Figure 6, when the water content was 16%, and with increasing the normal stress, the shear strength of B18 compared with B0 increased from 2.6 kPa to 27.7 kPa, B24 increased from 4.1 kPa to 72.0 kPa, and B30 increased from 3.6 to 116.5 kPa. The c and φ values of the specimens were calculated using the method described above. The results are shown in Table 4. The improvement in shear strength was accompanied by an increase in cohesion and the internal friction angle. The experimental group with bentonite added, on the whole, showed a gradual decrease in internal friction angle and an increase in cohesion with increasing amount of bentonite added [24].
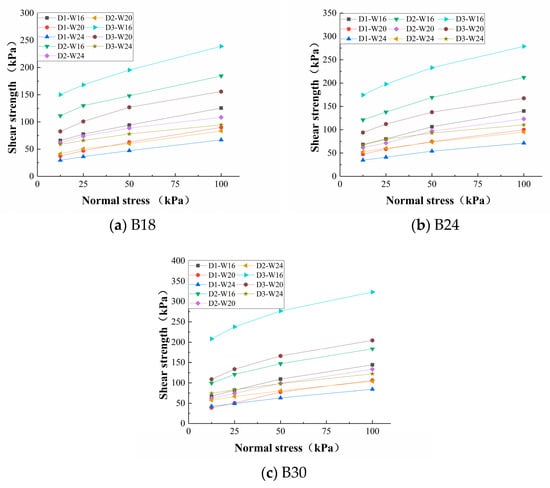
Figure 6.
Shear strength of B18~B30 at different values of dry bulk density and water content.

Table 4.
Cohesion and internal friction angle of specimens with different amounts of bentonite addition.
In different remodeled soil specimens, the increase in the shear strength of the specimens with the addition of bentonite occurs with increasing addition amount and increasing shear strength. In the experimental group with the same addition amount of bentonite, the internal friction angle and cohesion decreased with increasing water content, as shown in Table 4; bentonite itself has strong cohesion, and increasing the amount of bentonite added caused a higher expansion force, which was accompanied by an increase in the internal elastic energy of the soil and the ability to resist external forces, such that the content of bentonite increased from 18% to 30% while the internal friction angle and cohesion also increased gradually.
In addition, the particle size ratio is also one of the reasons for the change in shear strength and related parameters. The particle size composition of the B18~B30 specimens is different, and the particle size of the bentonite is 44 μm. The prepared soil is classified as silt. With the addition of bentonite, the particle composition of the remodeled expansive soil also changes. As shown in Table 5, the increase in bentonite content in the silt led to an increase in the internal friction angle. The reason for this phenomenon is that the specific surface area of the silt particles is larger than that of sand particles, and this increase in specific surface area is able to increase the force between the particles, resulting in matrix suction [25], and matric suction is well-known to be a factor in cohesion force. The increase in the number of silt particles also makes the originally loose soil structure denser, resulting in more effective contact between particles, and the occlusal force between smaller particles also increases [26]. Both of these effects result in changes in cohesion and internal friction angle from a macroscopic perspective. In this study, when the bentonite content of the silt was increased from 43.5% to 51.8%, the internal friction angle increased by 2.4~12.8° and the cohesion force increased by 1.49~60.8 kPa.

Table 5.
Cohesion and internal friction angle of specimens with different amounts of bentonite addition.
3.3. Influence of Pb(II) Concentration
The shear strength is regulated in remodeled soil treated by Pb(II) ions such that the higher the concentration, the lower the shear strength, and the degree of reduction in shear strength increases with increasing Pb(II) ion concentration.
In the Yunnan mountain red laterite experimental group without bentonite, the effect of Pb(II) ion concentration on the mechanical strength of the remodeled soil was very small, ranging from 3 kPa to no more than 8 kPa, and the influence on the internal friction angle of the experimental group was 0.2~0.67°. As can be seen in Figure 7, the curves of the samples in the contaminated group overlap with those in the uncontaminated experimental group. The maximum decrease in the D1 group was 3.7, 6.4, and 5.1 kPa, the maximum decrease in the D2 group was 3, 3.8, and 4.9 kPa, the maximum decrease in the D3 group was 7.4, 4.4, and 4.3 kPa, and the characteristics of the Mohr–Coulomb curve were almost the same as in the uncontaminated group, but under high normal stress, the decay rate of shear strength increased rapidly, and the results are similar to those of the test performed by Zha et al. investigating unconfined soil shear strength [27]. The damage to the specimens caused by Pb(II) ions comes from the replacement of cations in the clay mineral lattice of part of the bentonite with Pb(II) ions, while the displaced cations are distributed on the edges of the crystal, forming an unstable crystal structure and resulting in a decrease in mechanical strength [28]. In the low-stress section, the corrosion damage caused by Pb(II) ions is not obvious inside the specimen, while the high-stress stage is similar to the effect of magnification, amplifying the effect of damage and resulting in a slight decrease in the internal friction angle and cohesion force. The main mineral components of laterite are iron oxide and aluminum oxide and the sand content is 45.18%, both of which lead to a limitation of the damage caused by the reaction with Pb(II) ions. Because the main components of bentonite are silicon dioxide and aluminum oxide and it contains a small amount of calcium oxide and magnesium oxide, Pb(II) ion pollution chemically reacts with its chemical composition, thus reducing the mechanical strength of the specimen.
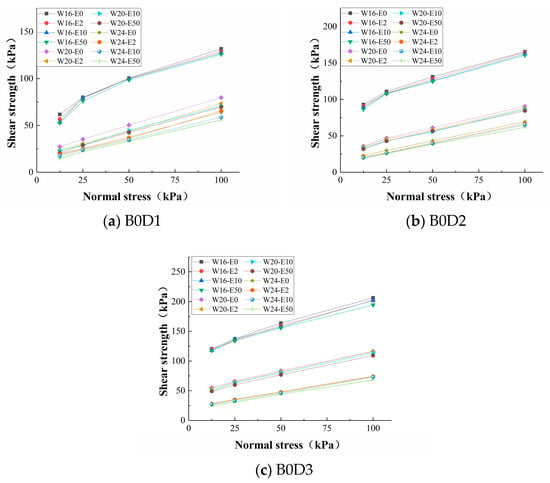
Figure 7.
Shear strength of B0 group treated with Pb(II) ions.
In the experimental group with the addition of bentonite addition, it can be clearly seen in Figure 8, Figure 9 and Figure 10 that with increasing Pb(II) ion concentration, the shear strength of the specimen under each normal stress decreased very quickly, especially in the higher dry bulk density treatment. With the increase in bentonite content from 0% to 30%, the degree of decrease in shear strength first increased and then decreased, while the shear strength of B24 decreased the most, at 56.1 kPa, which was the maximum reduction achieved in the contaminated soil. The shear strengths of the experimental groups with any amount of bentonite were greatly affected compared with the experimental group without bentonite, and the decrease showed an increasing trend with decreasing water content and increasing dry bulk density, as shown in Figure 7, Figure 8, Figure 9 and Figure 10.
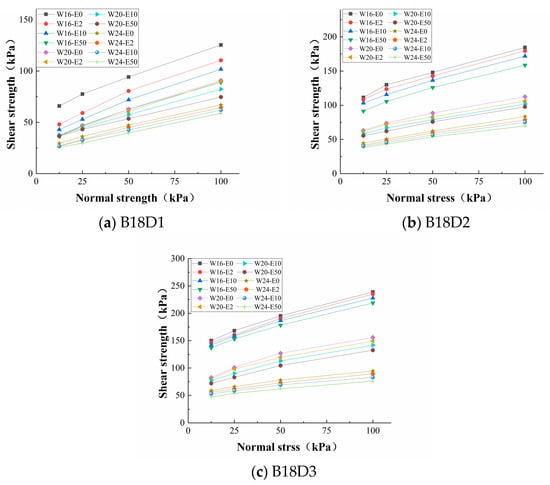
Figure 8.
Shear strength of group B18 treated with Pb(II) ions.
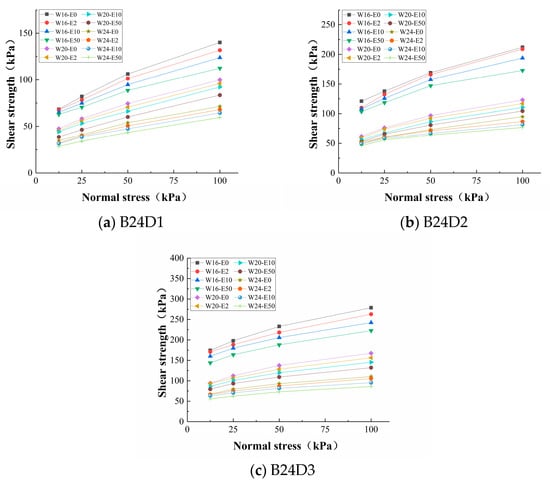
Figure 9.
Shear strength of group B24 treated with Pb(II) ions.
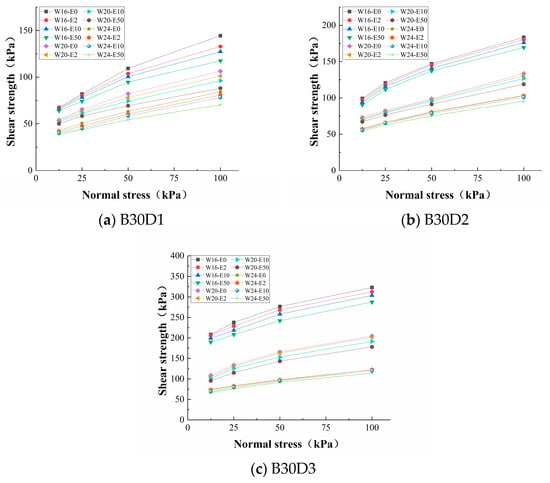
Figure 10.
Shear strength of group B30 treated with Pb(II) ions.
When treated with Pb(II) ions, the shear strength of each specimen decreased but this reduced shear strength was still greater than that of the experimental group without bentonite under the same treatment. At 50 kPa, the shear strength of B0-D3W16 treated with different concentrations of Pb(II) ions was 103.1, 100.5, 99.0, and 97.9 kPa, that of the B18-D3W16 group was 123.0, 119.9, 117.5, and 112.2 kPa, and that of the B24-D3W16 group is 146.7, 137.4, 129.5, and 118.3 kPa. The strength of the B30-D3W16 group was 174.2, 172, 162.5, and 152.3 kPa. It can be seen that the shear strengths of the experimental groups with bentonite added were greater than that of the experimental group without bentonite, even when damaged by Pb(II) ions.
When treated with the Pb(II) ion solution, the shear strength of the B24 experimental group decreased the most; the shear strength of the B18 experimental group decreased by 0.5~12.7 kPa, the B24 group decreased by 3.9~30.3 kPa, and the B30 group decreased by 2.2~22.4 kPa. The shear strength of the B18 experimental group showed an increasing trend, except that the D1W16 and D2W16 experimental groups showed a slight decrease after erosion compared with the experimental group without the addition of bentonite. The shear strength of the B18 groups treated with Pb(II) ions under a normal stress of 100 kPa increased by 4~20.6 kPa compared with the experimental group of B0. B24 increased by 2.3~38.4 kPa, and B30 increased by up to 73.5 kPa compared with B0. The above increments all increased with increasing dry bulk density and decreasing water content, which is consistent with the phenomenon previously described. The decrease in the shear strength of bentonite caused by the influence of Pb(II) ions tended to be stable when the addition of bentonite reached 24%, indicating that the maximum amount of bentonite is 24%, after which the effect of the Pb(II) ions on the shear strength of the specimen decreased and the increase in shear strength began to decay. Comparing groups with the same dry bulk density in Figure 7 and Figure 10, it can be seen from the degree of decrease in shear strength with Pb(II) pollution had a greater effect on specimens with lower water content and higher bulk density.
Pb(II) ions also had a certain influence on the mechanical parameters of the specimen. Taking the B24 experiment group as an example, as shown in Table 6, the values of c and φ of the Mohr–Coulomb curve of each treatment all showed a decrease with increasing Pb(II) ion concentration. When the water content was constant, the φ value of the specimen decreased by 0.5~3.9° when the Pb(II) ion concentration was 0.2 mol/L; it decreased by 1.8~7.1° when the Pb(II) ion concentration was 1 mg/L; and it decreased by 3.3~9.7° when the Pb(II) ion concentration was 5 mg/L. The lower the water content, the more susceptible the φ value was, as was the c value. The higher the dry bulk density, the more susceptible the c value was. Taking W16 as an example, when E50 and E0 are compared, the c value of D30 was reduced by 27.7 kPa, D2 was reduced by 12.8 kPa, and D1 was only reduced by 3.3 kPa. It can be seen that the c and φ values have high sensitivity to water content and bulk density.

Table 6.
Cohesion and internal friction angle of specimens with different amounts of bentonite added.
The damage caused by Pb(II) ions to the specimens, resulting in the decrease in mechanical strength, is amplified when the water content decreases. During the drying process of the specimens, the original micro-damage and particle contact changes, leading to a reduction in the internal forces, such as the bite force and matric suction [29], between soil particles. Essentially, as the concentration of Pb(II) ions increases, the internal defects of the soil increase under the interaction force, the flaky structure on the surface of the bentonite gradually disappears, and cracks appear on the surface of large particles and clay minerals inside the specimen. The structure of the expansive soil suffers continuous damage, the bonding between particles becomes smaller, and the heavy metal ions destroy the structure of clay minerals in the expansive soil, thus reducing the occlusion between large particles [30,31], and the increase in normal stress significantly deteriorates the internal defects; macroscopically, this defect manifests as a decrease in c and a decrease in φ.
3.4. Shear Strength and Displacement Characteristics
The stress–strain curve of the soil reflects the mechanical properties of the specimen under load from external force. The shear modulus, calculated using the slope of the elastic stage included in the stress–strain curve and the residual stress in the stable stage after the peak strength, can reflect the stress state of a specimen under different normal stresses and external forces during testing.
Figure 11a shows the stress–strain curve of each specimen in the B0W24 group when the normal stress is 25 kPa. It can be seen that with increasing dry bulk density, the peak value of the specimen increased and the shear modulus was 16.6, 24.2, and 28.6 kPa/mm. With a dry bulk density of 1.1 g/cm3 and 1.2 g/cm3, the peak strength of the specimens increased with increasing displacement and no fracture occurred within the limited range, so the residual strength cannot be read, while the residual strength of the specimen with a bulk density of 1.3 g/cm3 was 28.1 kPa. Figure 11b shows the stress–strain curves of specimens with different water contents in the B0D3 group under a normal stress of 25 kPa. It can be seen that with increasing water content, the brittleness of the specimens decreased and the ductility increased significantly, while the displacement of reaching peak strength increased with the water content from 2.2 mm at 16% water content to 2.6 mm at 20% water content and 3.2 mm at 24% water content. At the same time, the elastic modulus of the specimen decreased from 93.5 kPa/mm at 16% water content to 28.6 kPa/mm at 24% water content; the residual strength also decreased with increasing water content, with values of 63.99, 39.18, and 28.1 kPa, respectively. It can be seen that increasing the dry bulk density and decreasing water content could effectively result in an increased shear modulus and ductility in the soil, such that it has greater elasticity and can resist damage due to external forces, and the residual strength of the specimen could also be greatly improved after failure.
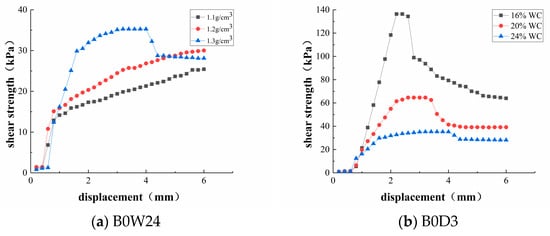
Figure 11.
Stress–strain curves of specimens under different values of bulk density and water content.
Figure 12 shows the stress–strain curves of specimens with different contents of bentonite in the D3W24 group at 25, 28.1, 29.9, 34.3, and 37.8 kPa, where it can be seen that the increase in the bentonite content caused a greater increase in the shear strength due to the increase in the shear modulus and the displacement of the shear elastic phase in the experimental group with bentonite increased by 0.4, 0.6, and 0.6 mm compared with the experimental group without the addition of bentonite; not only did the increment of shear strength increase but the elastic stage of the specimen was also prolonged. Therefore, the specimen with a high content of bentonite exhibits high shear strength. The mentioned changes in particle size composition and properties of bentonite are also responsible for the increase in shear strength. At the same time, the increase in the amount of bentonite led to the advance of the yield limit point, and the peak strength was 4 mm, 3.6 mm, 3.6 mm, and 3.2 mm when the amount of bentonite was increased; that is, although the shear strength of the bentonite specimen increased, the required failure displacement decreased significantly, indicating that the addition of bentonite greatly increased the brittleness of the specimen. After reaching the yield limit, the displacement of the residual stress decreased rapidly with increasing bentonite content.
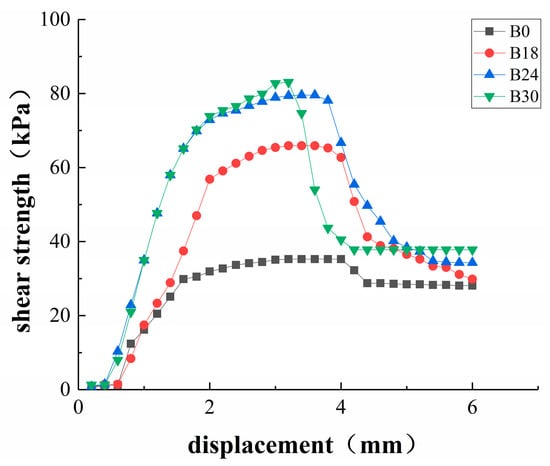
Figure 12.
Stress–strain curves of specimens with different bentonite contents.
In addition to reducing the cohesion and internal friction angle of the specimen, Pb(II) ions also had a great impact on the stress–strain characteristics of the specimens. Figure 13 shows the stress–strain characteristics of the specimens under different degrees of lead ion contamination in the D3B24 group. From the graph, it can be clearly seen that Pb(II) contamination decreased the brittleness of the specimen, and the displacement reaching the peak value of shear strength was obviously moved backward, increasing by 0.2~0.4 mm. In addition, after the specimen reached its peak strength, the instantaneous attenuation of shear strength gradually decreased with increasing normal stress. Under the stress of 12.5 kPa, with increasing concentration of lead ion contamination, the shear strength of specimen decreased rapidly within 0.4 mm displacement, with change rates of 26.2%, 41.4%, 44.8%, and 53.1%, respectively. This phenomenon gradually decreased with increasing normal stress. The change rates of E0~E50 within 0.4 mm at 25 kPa were 40.1%, 24.3%, 37.0%, and 45.7%, the change rates at 50 kPa were 40.0%, 26.2%, 33.7%, and 28.1%, and the change rates at 100 kPa were 11.5%, 22.5%, 16.9%, and 13.5%. This phenomenon is related to the densification of the specimen caused by the normal stress in the former discussion presented in this research. With an increasing concentration of Pb(II) ion contamination, the residual stress also showed a decreasing trend that is similar to the law of peak strength. When the normal stress was 12.5 kPa, the residual strengths of E0~E50 were 29.6 kPa, 21.2 kPa, 17.9 kPa, and 12.9 kPa, and with increasing normal stress, the residual strength of each treated specimen increased. When the Pb(II) ion pollution was 0.2 mg/L, the residual strengths under 12.5~100 kPa were 21.2 kPa, 25.6 kPa, 36.5 kPa, and 41.5 kPa, respectively.
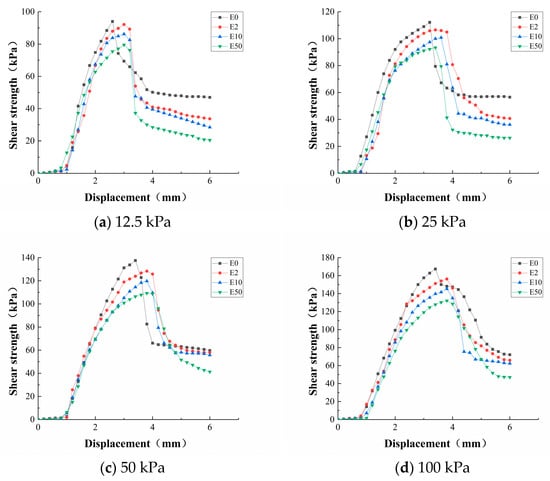
Figure 13.
Stress–strain curves of D3B24 specimens contaminated with different concentrations Pb(II) solution.
The slope of the straight line in the elastic phase gradually decreased with increasing Pb(II) ion concentration. It can be seen from Figure 13a,b that the Pb(II) ions had little effect on the elastic stage of the specimen at relatively low stress. In Figure 13a, the shear modulus had values of 55.7, 52.9, 52.3, and 50.9 kPa/mm, and with increasing Pb(II) ion concentration, it showed values of 60.5, 59.6, 56.5, and 55.5 kPa/mm in Figure 13b, but with increasing normal stress, the higher the concentration of Pb(II) ion contamination, the greater the decrease in the shear modulus of the specimen. In Figure 13c, with increasing Pb(II) ion concentration, the shear modulus of the specimen was 73.2, 70.8, 65.5, and 61.7 kPa/mm, and in Figure 13d, it was 75.7, 71.1, 65.4, and 63.7 kPa/mm. The higher the normal stress, the easier plastic failure occurs and the easier the shear strength of the specimen is damaged, which also explains why the shear strength decreased with increasing normal stress.
4. Conclusions
In this study, direct shear experiments were carried out under different conditions of dry bulk density, bentonite content, water content, and Pb(II) ion pollution concentration, focusing on the shear strength and shear characteristics of compacted unsaturated insulation soil. The conclusions are the following:
- (1)
- For isolation soil covering the surface of the tailings, the decrease in water content, the increase in dry bulk density, and the increase in bentonite content could effectively improve the mechanical strength and mechanical properties; the influence of lead ions on the shear strength and mechanical parameters of isolation soil without bentonite was limited, the decrease in shear strength was within 8 kPa, and the decrease in c and φ values did not exceed 5.1 kPa and 3°, respectively; however, it could significantly reduce the mechanical strength and characteristics of the specimens with bentonite, and the shear strength could be reduced by a maximum of 56.1 kPa. The cohesion and internal friction angle decreased by up to 30.3 kPa and 9.7°.
- (2)
- Increasing dry bulk density, decreasing water content, and increasing bentonite content could effectively increase the shear modulus and residual stress of the soil, and lead ions could reduce the shear modulus of the specimen and increase the plasticity of the specimen. The increase in shear strength was attenuated in the elastic phase of the specimen, which also led to a decrease in shear strength.
This study provides a certain mechanical theoretical basis for the construction of surface coverage structures for tailings ponds and proposed some engineering indicators. In our follow-up study, the micro-deformation of shear strength will be explored to provide a thorough theoretical explanation of the variation law of the mechanical strength of isolation soil.
Author Contributions
Conceptualization, Y.L. and Z.H.; methodology, Y.L.; software, Y.L.; validation, Y.L. and Z.H.; formal analysis, Y.L.; investigation, Y.L.; resources, Y.L.; data curation, Y.L.; writing—original draft preparation, Y.L.; writing—review and editing, Y.L.; visualization, Y.L.; supervision, Y.L. and Z.H.; project administration, Z.H.; funding acquisition, Z.H. All authors have read and agreed to the published version of the manuscript.
Funding
This research was funded by the National Key Research and Development Program, grant numbers: 2018YFC1801703.
Institutional Review Board Statement
Not applicable.
Informed Consent Statement
Not applicable.
Data Availability Statement
Not applicable.
Conflicts of Interest
The authors declare no conflict of interest.
References
- Cai, S.J.; Yang, P. Tailings problems and tailings utilization and treatments in the metal mines. Strateg. Study CAE 2000, 2, 89–92. [Google Scholar]
- Badiozamani, M.M.; Askari-Nasab, H. Integration of reclamation and tailings management in oil sands surface mine planning. Environ. Model. Softw. 2014, 51, 45–58. [Google Scholar] [CrossRef]
- Saborimanesh, N. Toward sustainable remediation of oil sands fine tailings-a review. J. Environ. Manag. 2021, 288, 112418. [Google Scholar] [CrossRef]
- Jin, W.J.; Wei, Z.Y. Research Progress on the benefit estimation of land reclamation and environment remediation for non-ferrous metal tailings pond. Res. Environ. Sci. 2019, 32, 1304–1313. [Google Scholar]
- Chen, Y.F.; Chen, Q. Migration, transformation and pollution control of Thalliumin Lead-Zinc tailings reservoir. Nonferrous Met. Eng. 2021, 11, 134–140. [Google Scholar]
- Li, Z.Y.; Ma, Z.W.; Tsering, J.K.; Yuan, Z.W.; Huang, L. A Review of Soil Heavy Metal Pollution from Mines in China: Pollution and Health Risk Assessment. Sci. Total Environ. 2014, 468–469, 843–853. [Google Scholar] [CrossRef]
- Kuka, K.; Franko, U.; Hanke, K.; Finkenbein, P. 8 Investigation of different amendments for dump reclamation in northern Vietnam. J. Geochem. Explor. 2013, 132, 41–53. [Google Scholar] [CrossRef]
- Alakangas, L.; Andersson, E.; Mueller, S. Neutralization/prevention of acid rock drainage using mixtures of alkaline by products and sulfidic mine wastes. Environ. Sci. Pollut. Res. 2013, 20, 7907–7916. [Google Scholar] [CrossRef]
- Ahn, J.S.; Song, H.; Yim, G.J.; Ji, S.W.; Kim, J.G. An engineered cover system for mine tailings using a hardpan layer: A solidification/stabilization method for layer and field performance evaluation. J. Hazard. Mater. 2011, 197, 153–160. [Google Scholar] [CrossRef]
- Xu, W.D.; Xu, X.C.; Rao, L.L. To Determine thickness of security cover layer in Uranium tailings. Environ. Sci. Technol. 2010, 33, 127–129. [Google Scholar]
- Gupt, C.B.; Yamsani, S.K.; Prakash, A.; Medhi, C.R.; Sreedeep, S. Appropriate liquid-to-solid ratio for sorption studies of bentonite. J. Environ. Eng. 2019, 145, 04018138. [Google Scholar] [CrossRef]
- Zhao, Z.; Xu, Z.J.; Qiu, X.Y.; Liu, T.X. Preparation of anion-cationic organic bentonite and its adsorption of lead ions. Chin. J. Environ. Eng. 2012, 6, 4405–4411. [Google Scholar]
- Jin, G.L.; Xu, H.Q.; Zhou, A.Z.; Jiang, P.M. Permeability of soil-bentonite cut-off wall backfill material. Mater. Lett. 2021, 305, 130775. [Google Scholar] [CrossRef]
- Qin, B.; Chen, Z.H.; Liu, Y.M.; Wang, J. Swelling-shrinkage behavior of Gaomiaozi bentonite. Chin. J. Geotech. Eng. 2008, 30, 1005–1010. [Google Scholar]
- Fan, R.D.; Du, Y.J.; Chen, Z.B.; Liu, S.Y. Compressibility and permeability characteristics of lead contaminated soil-bentonite vertical cutoff wall backfills. Chin. J. Geotech. Eng. 2013, 34, 841–848. [Google Scholar]
- Liu, Z.B.; Fang, W.; Chen, Z.L.; Yu, C. Experimental study of influence of Zinc ions on one-dimensional compressibility of bentonite. Rock Soil Mech. 2013, 34, 2211–2217. [Google Scholar]
- Xiao, J.; Yang, H.P.; Li, H.F.; Tang, X.Y. Shallow failure stability analysis of expansive soil slope. J. Traffic Transp. Eng. 2014, 14, 21–27. [Google Scholar]
- Hajiabdolmajid, V.; Kaiser, P.K.; Martin, C.D. Modelling brittle failure of rock. Int. J. Rock Mech. Min. Sci. 2002, 39, 731–741. [Google Scholar] [CrossRef]
- Zhang, J.L.; Shi, D.M.; Liu, Y.; Ren, Y.H.; Pu, C.J. Effects of soil bulk density and water content on shear strength of cultivated layer in purple soil sloping farmland. J. Soil Water Conserv. 2020, 34, 162–174. [Google Scholar]
- Ma, J.L.; Zhong, X.M.; Wang, Q.; Liu, Z.Z.; Chai, S.F.; Che, G.F. Experimental study on shear characteristics of compacted loess based on micro-structure. J. Disaster Prev. Mitig. Eng. 2021, 41, 350–356. [Google Scholar]
- Cheng, Z.; Rui, H.; Jian, Z. Particle contact characteristics of coarse-grained soils under normal contact. Eur. J. Environ. Civ. Eng. 2018, 22, 114–129. [Google Scholar] [CrossRef]
- Huang, K.; Wan, J.W.; Chen, G.; Zeng, Y. Testing study of relationship between water content and shear strength of unsaturated soils. Rock Soil Mech. 2012, 32, 2600–2604. [Google Scholar]
- Xiao, J.; Yang, H.; Zhang, J.; Tang, X. Properties of drained shear strength of expansive soil considering low stresses and its influencing factors. Int. J. Civ. Eng. 2018, 16, 1389–1398. [Google Scholar] [CrossRef]
- Ariffin, S.T.; Chan, C.M. Strength characteristics of lightly solidified dredged marine clay admixed with bentonite. In Proceedings of the AIP Conference Proceedings, Bali, Indonesia, 14–17 November 2017; American Institute of Physics Inc.: College Park, MD, USA, 2017; Volume 1903, p. 050015. [Google Scholar]
- Lin, H.Z.; Li, G.X.; Yu, Y.Z.; Lü, H. Influence of matric suction on shear strength behavior of unsaturated soils. Rock Soil Mech. 2007, 28, 1931–1936. [Google Scholar]
- Ozcan, O.; Ruhland, M.; Stahl, W. The effect of pressure, particle size and particle shape on the shear strength of very fine mineral filter cakes. Int. J. Miner. Process 2000, 59, 185–193. [Google Scholar] [CrossRef]
- Zha, F.S.; Liu, J.J.; Xia, L.; Cui, K.R. Engineering properties of heavy metal contaminated soil. Chin. J. Undergr. Space Eng. 2014, 10, 1982–1985. [Google Scholar]
- Turer, D. Effect of Heavy Metal and Alkali Contamination on the Swelling Properties of Kaolinite. Environ. Geol. 2007, 52, 421–425. [Google Scholar] [CrossRef]
- Hossain, M.A.; Yin, J.H. Behavior of a compacted completely decomposed granite soil from suction controlled direct shear tests. J. Geotech. Geoenviron. Eng. 2010, 136, 189–198. [Google Scholar] [CrossRef]
- Tang, J.S.; Liu, S.Y.; Tong, L.Y.; Shen, C.H. In-situ direct shear tests on shear strength indices of pebble and gravelly soil. Chin. J. Geotech. Eng. 2015, 37, 167–171. [Google Scholar]
- Gao, Q.; He, Z.W.; Hao, T.F. Experimental study on the effect of coarse-grained soil structure on shear strength. J. Liaoning Tech. Univ. 2020, 39, 226–230. [Google Scholar]
Publisher’s Note: MDPI stays neutral with regard to jurisdictional claims in published maps and institutional affiliations. |
© 2022 by the authors. Licensee MDPI, Basel, Switzerland. This article is an open access article distributed under the terms and conditions of the Creative Commons Attribution (CC BY) license (https://creativecommons.org/licenses/by/4.0/).