
Identifying Home System of Practices for Energy Use with K-Means Clustering Techniques


Abstract
:1. Introduction
2. Literature Review
2.1. Home System of Practice
2.2. Energy Demand Profiles
2.3. Energy Management
2.4. Research Gap
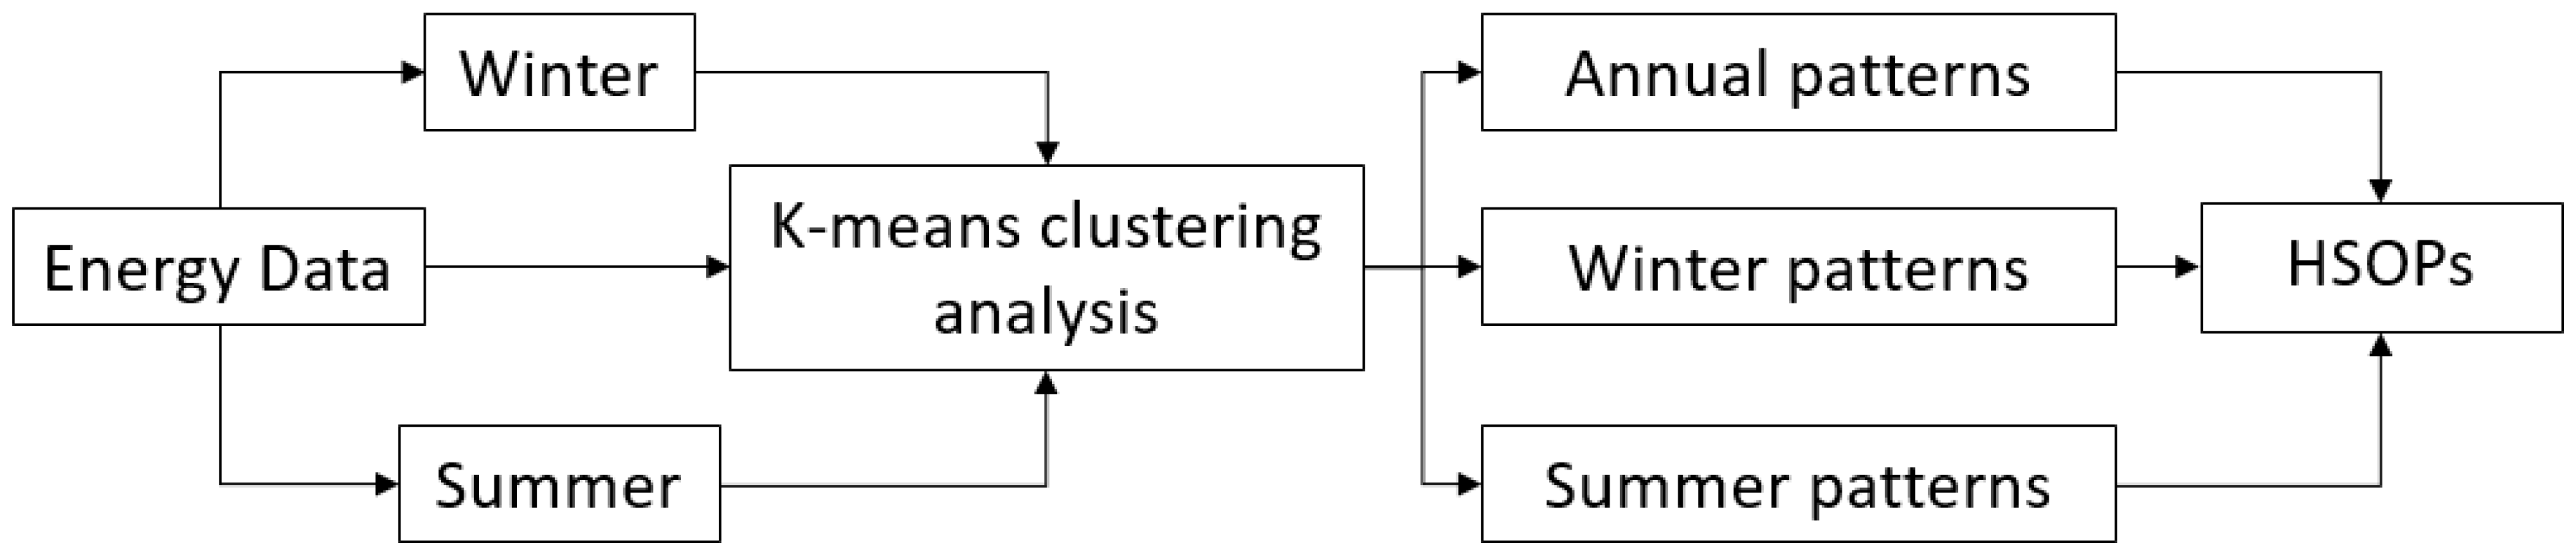
3. Methods
3.1. The Living Laboratory
3.2. Data Collection and Analysis
- Randomly select ‘k’ as the number of initial cluster centres
- Calculate the distance from each data object to each cluster centre and assign the objects to the clusters with the closest distance
- Assign all data objects and recalculate the centres of all the clusters
- Iterate Steps 2 and 3 until data objects are being assigned to the same cluster without any changes.
- Output the clusters
4. Results and Discussion
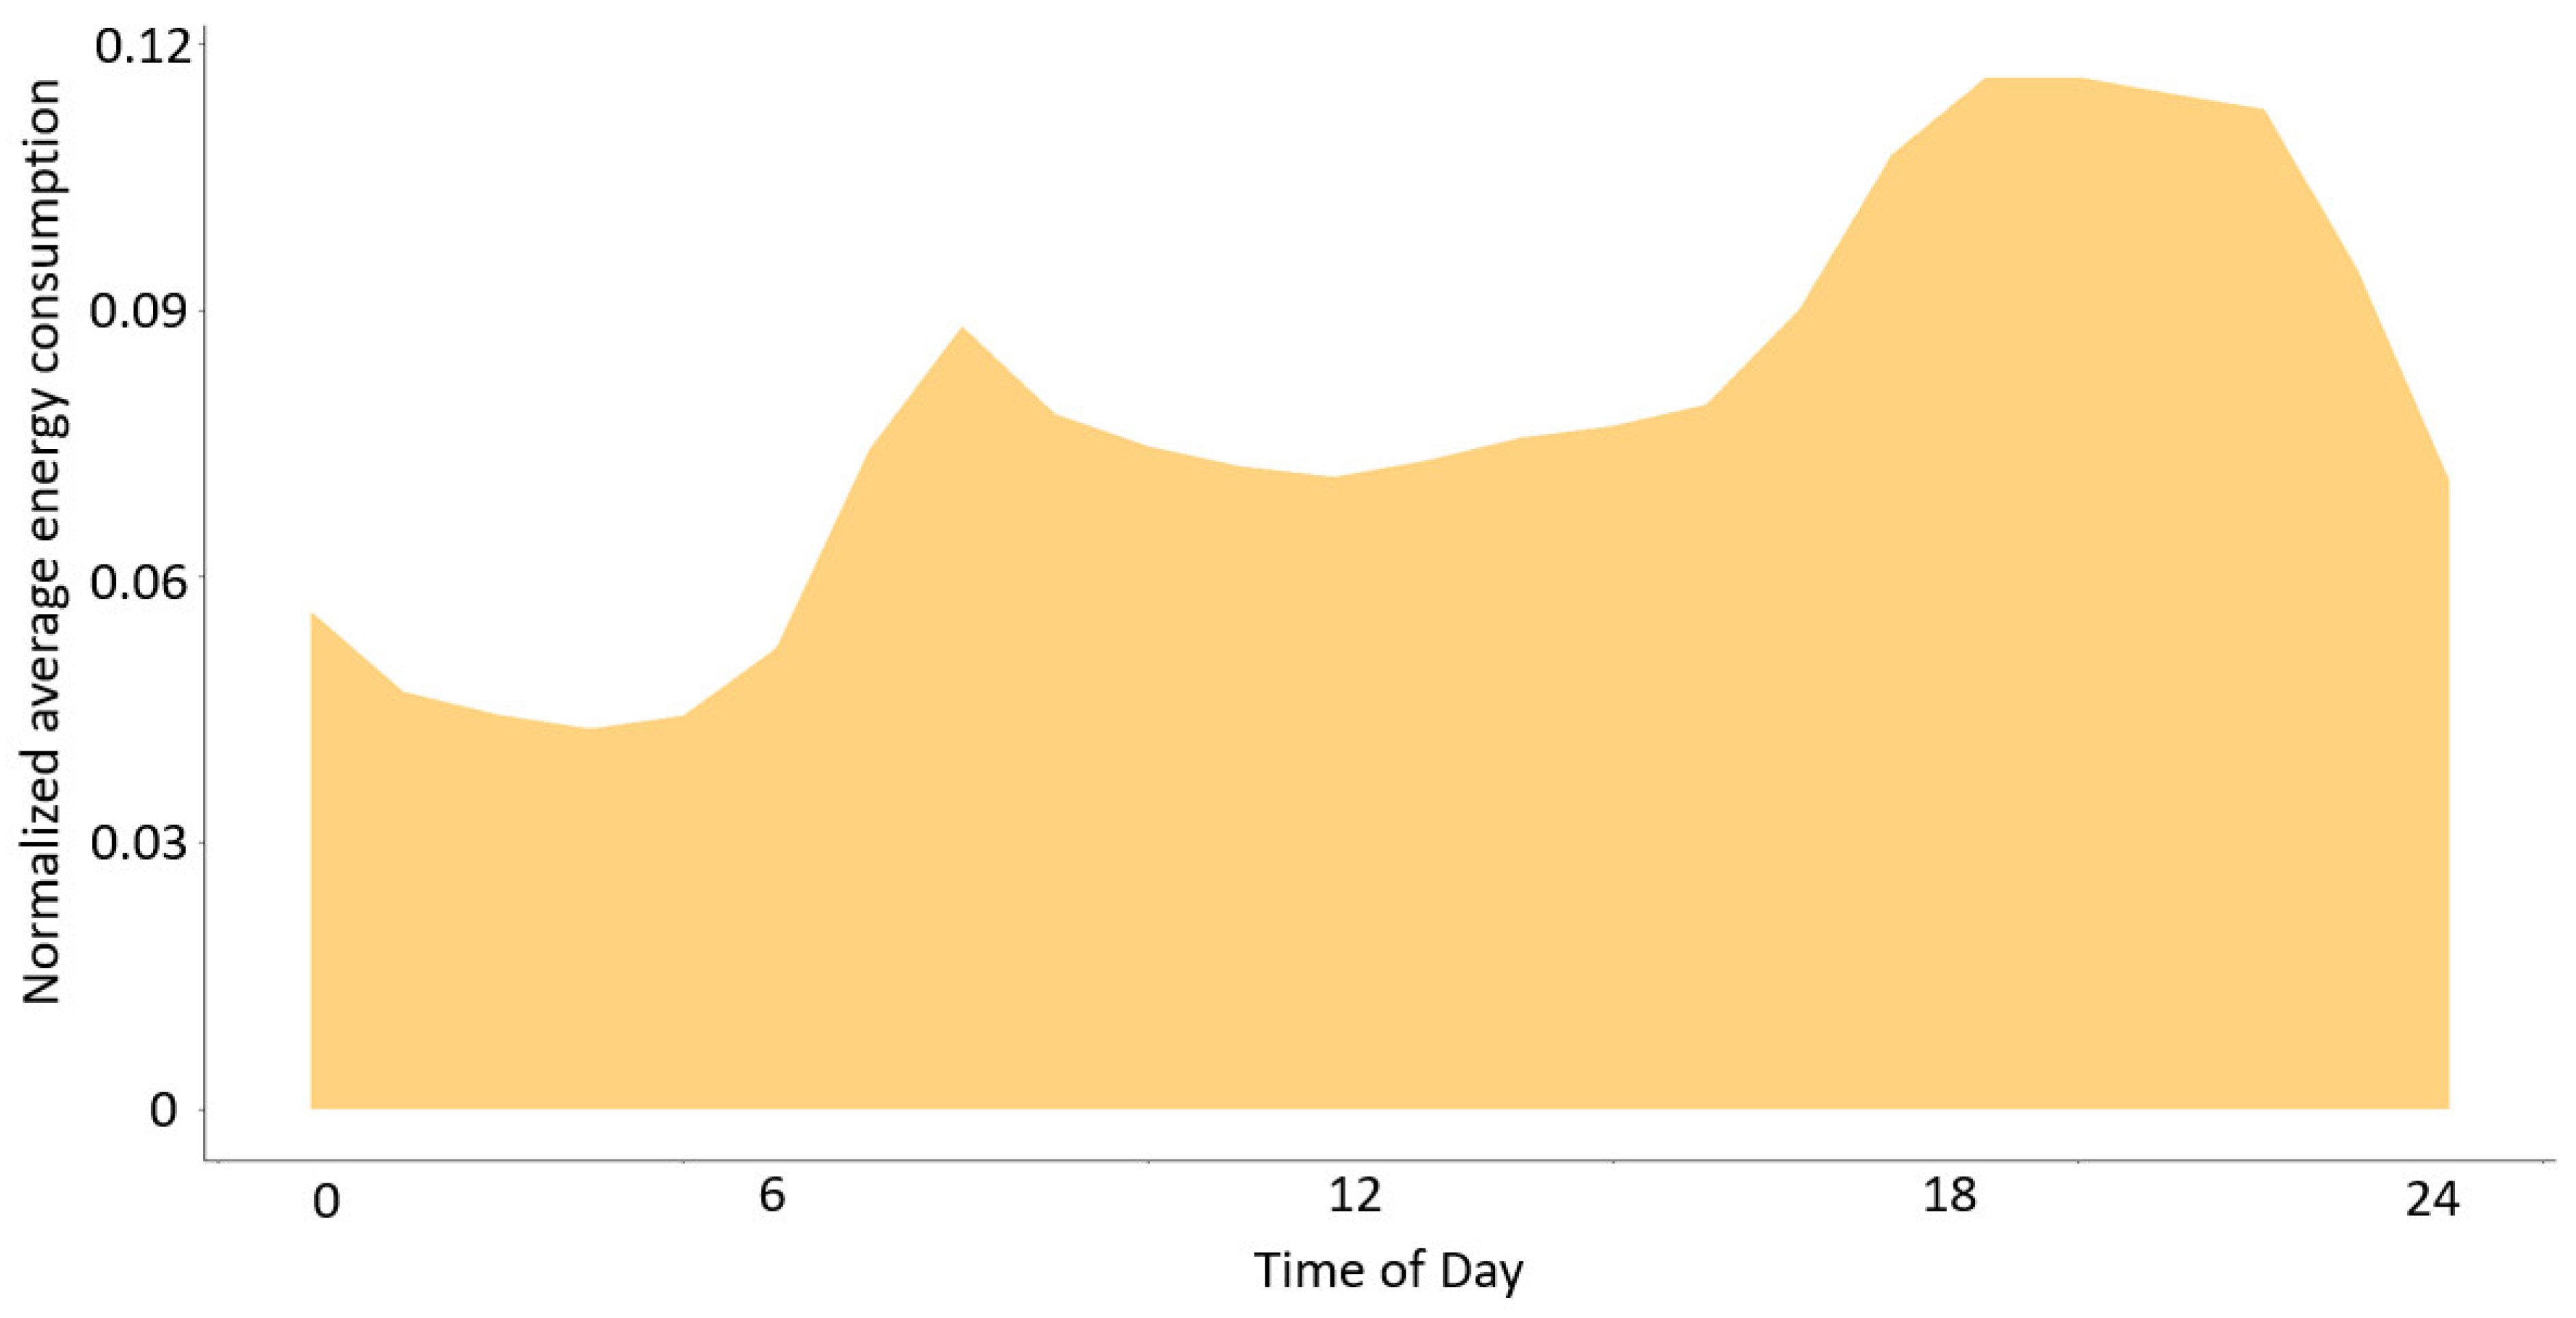
4.1. General Energy Consumption
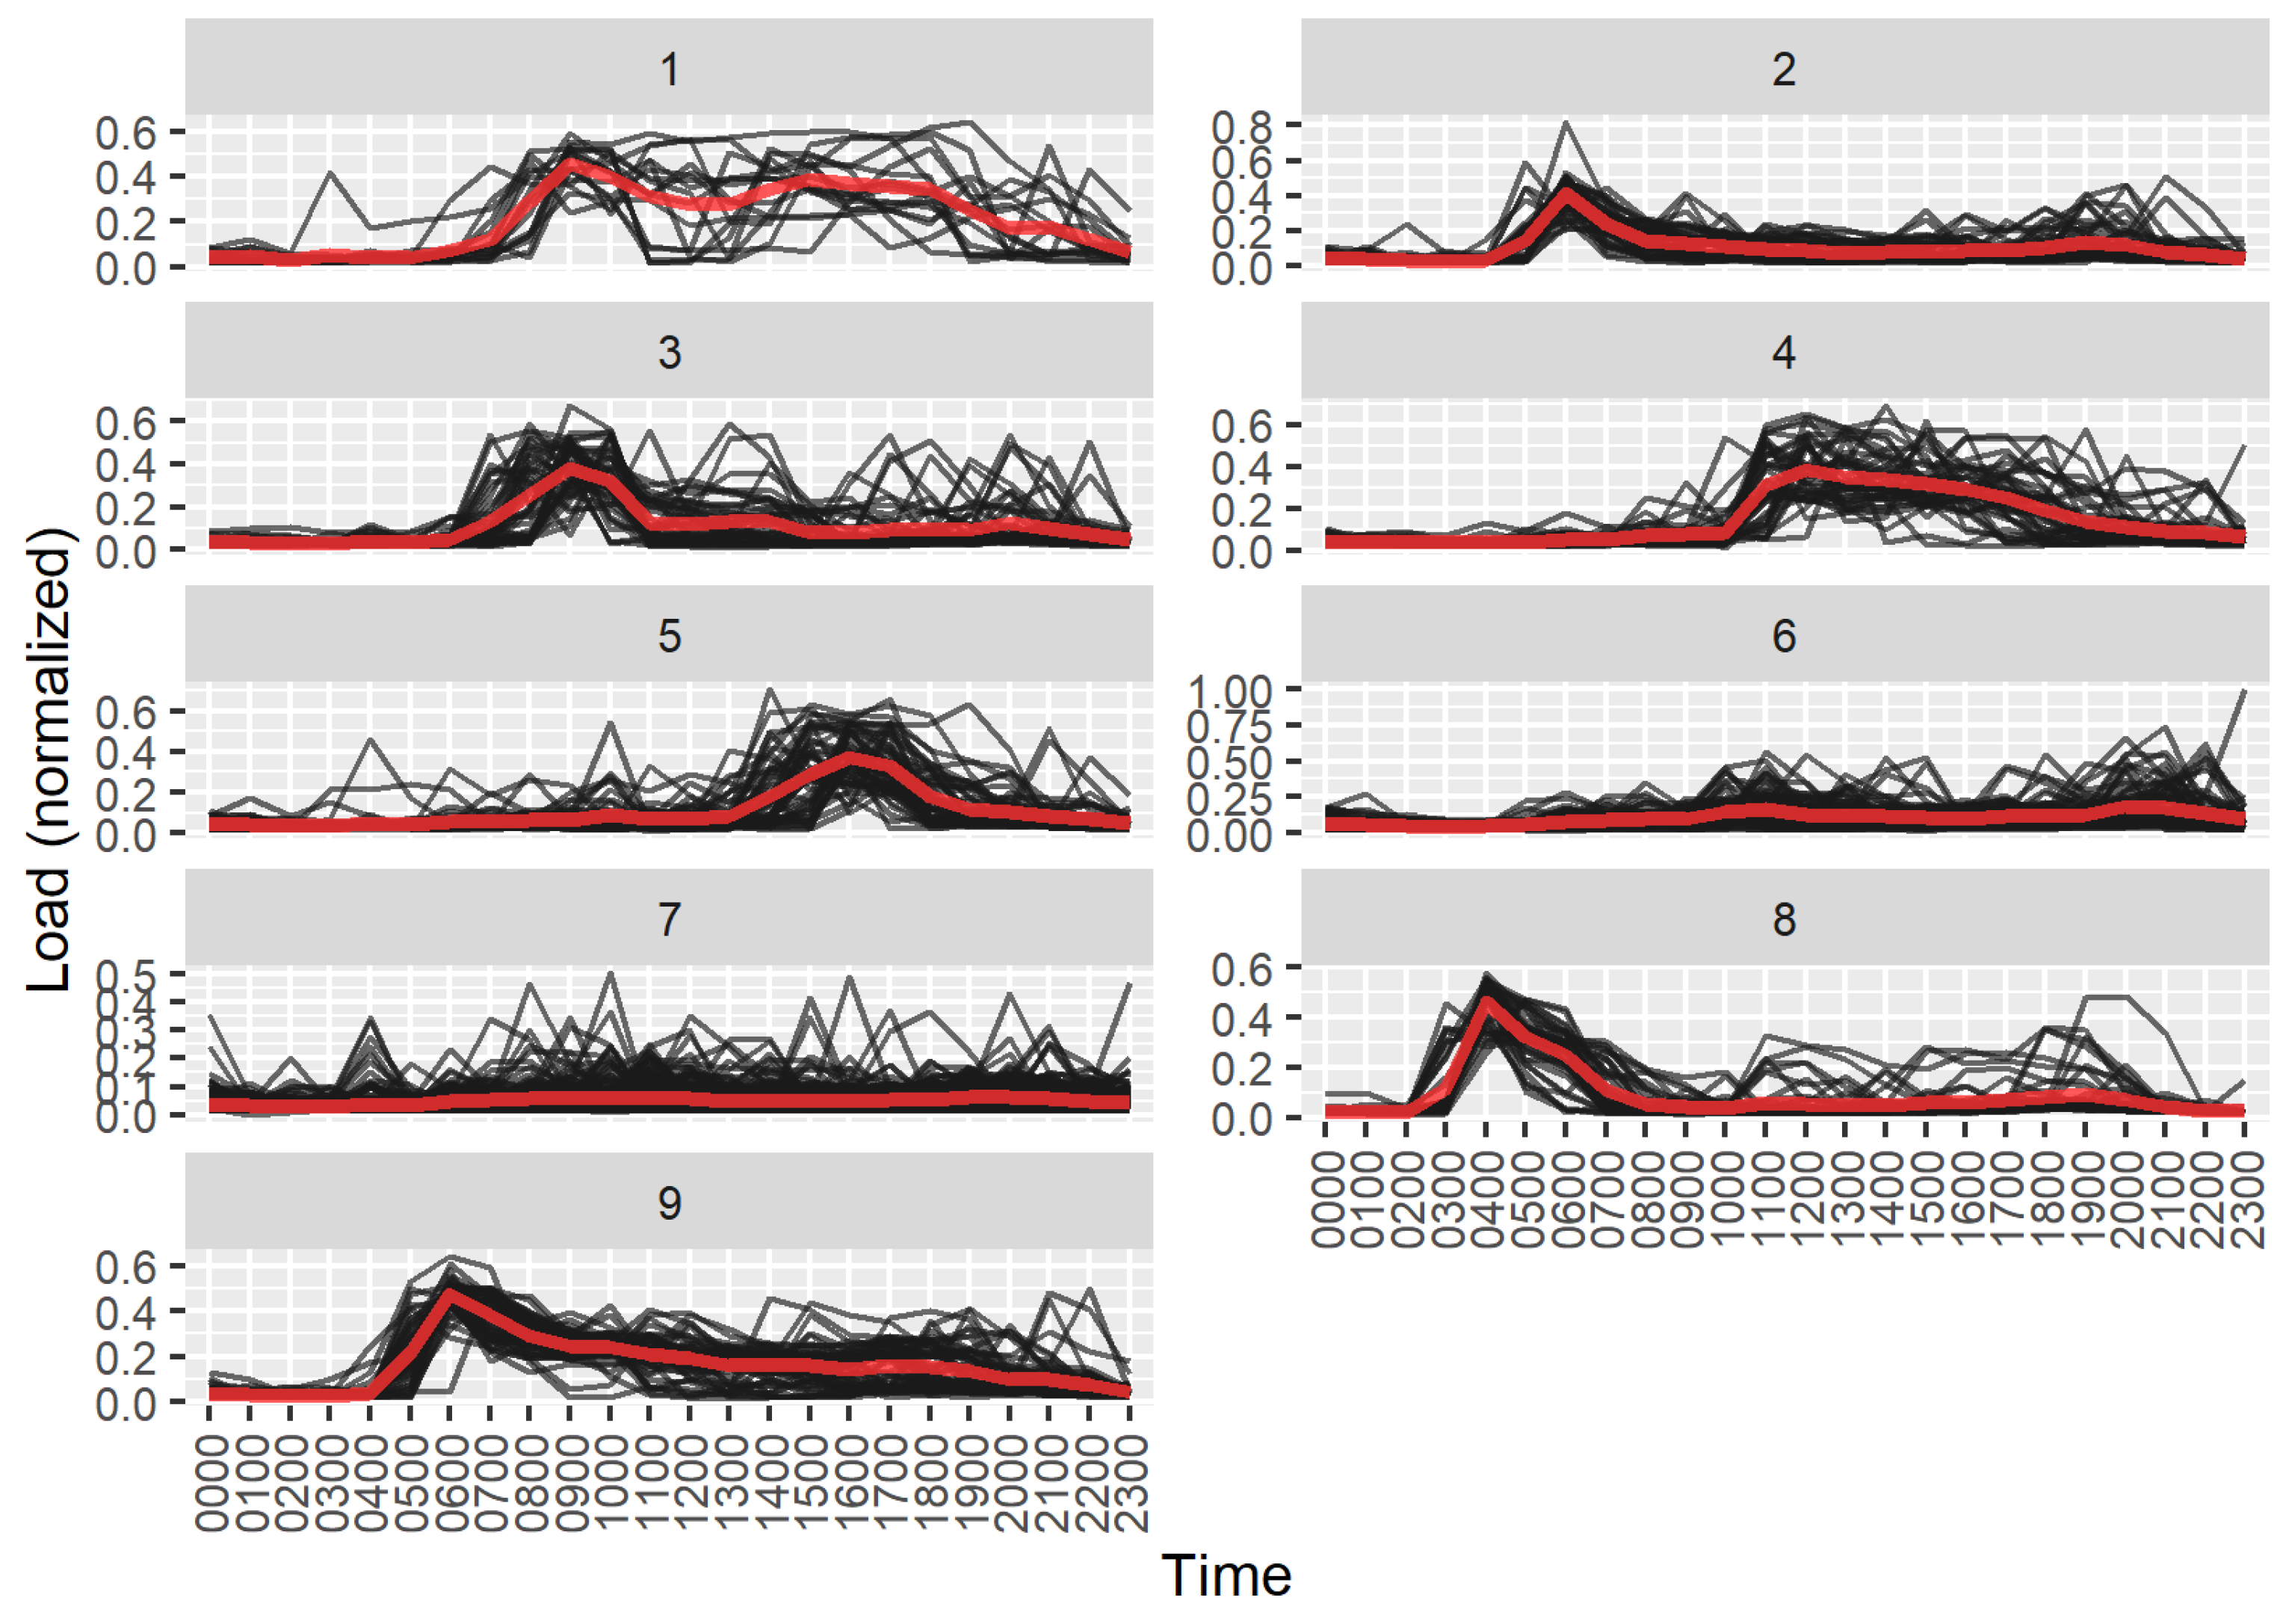
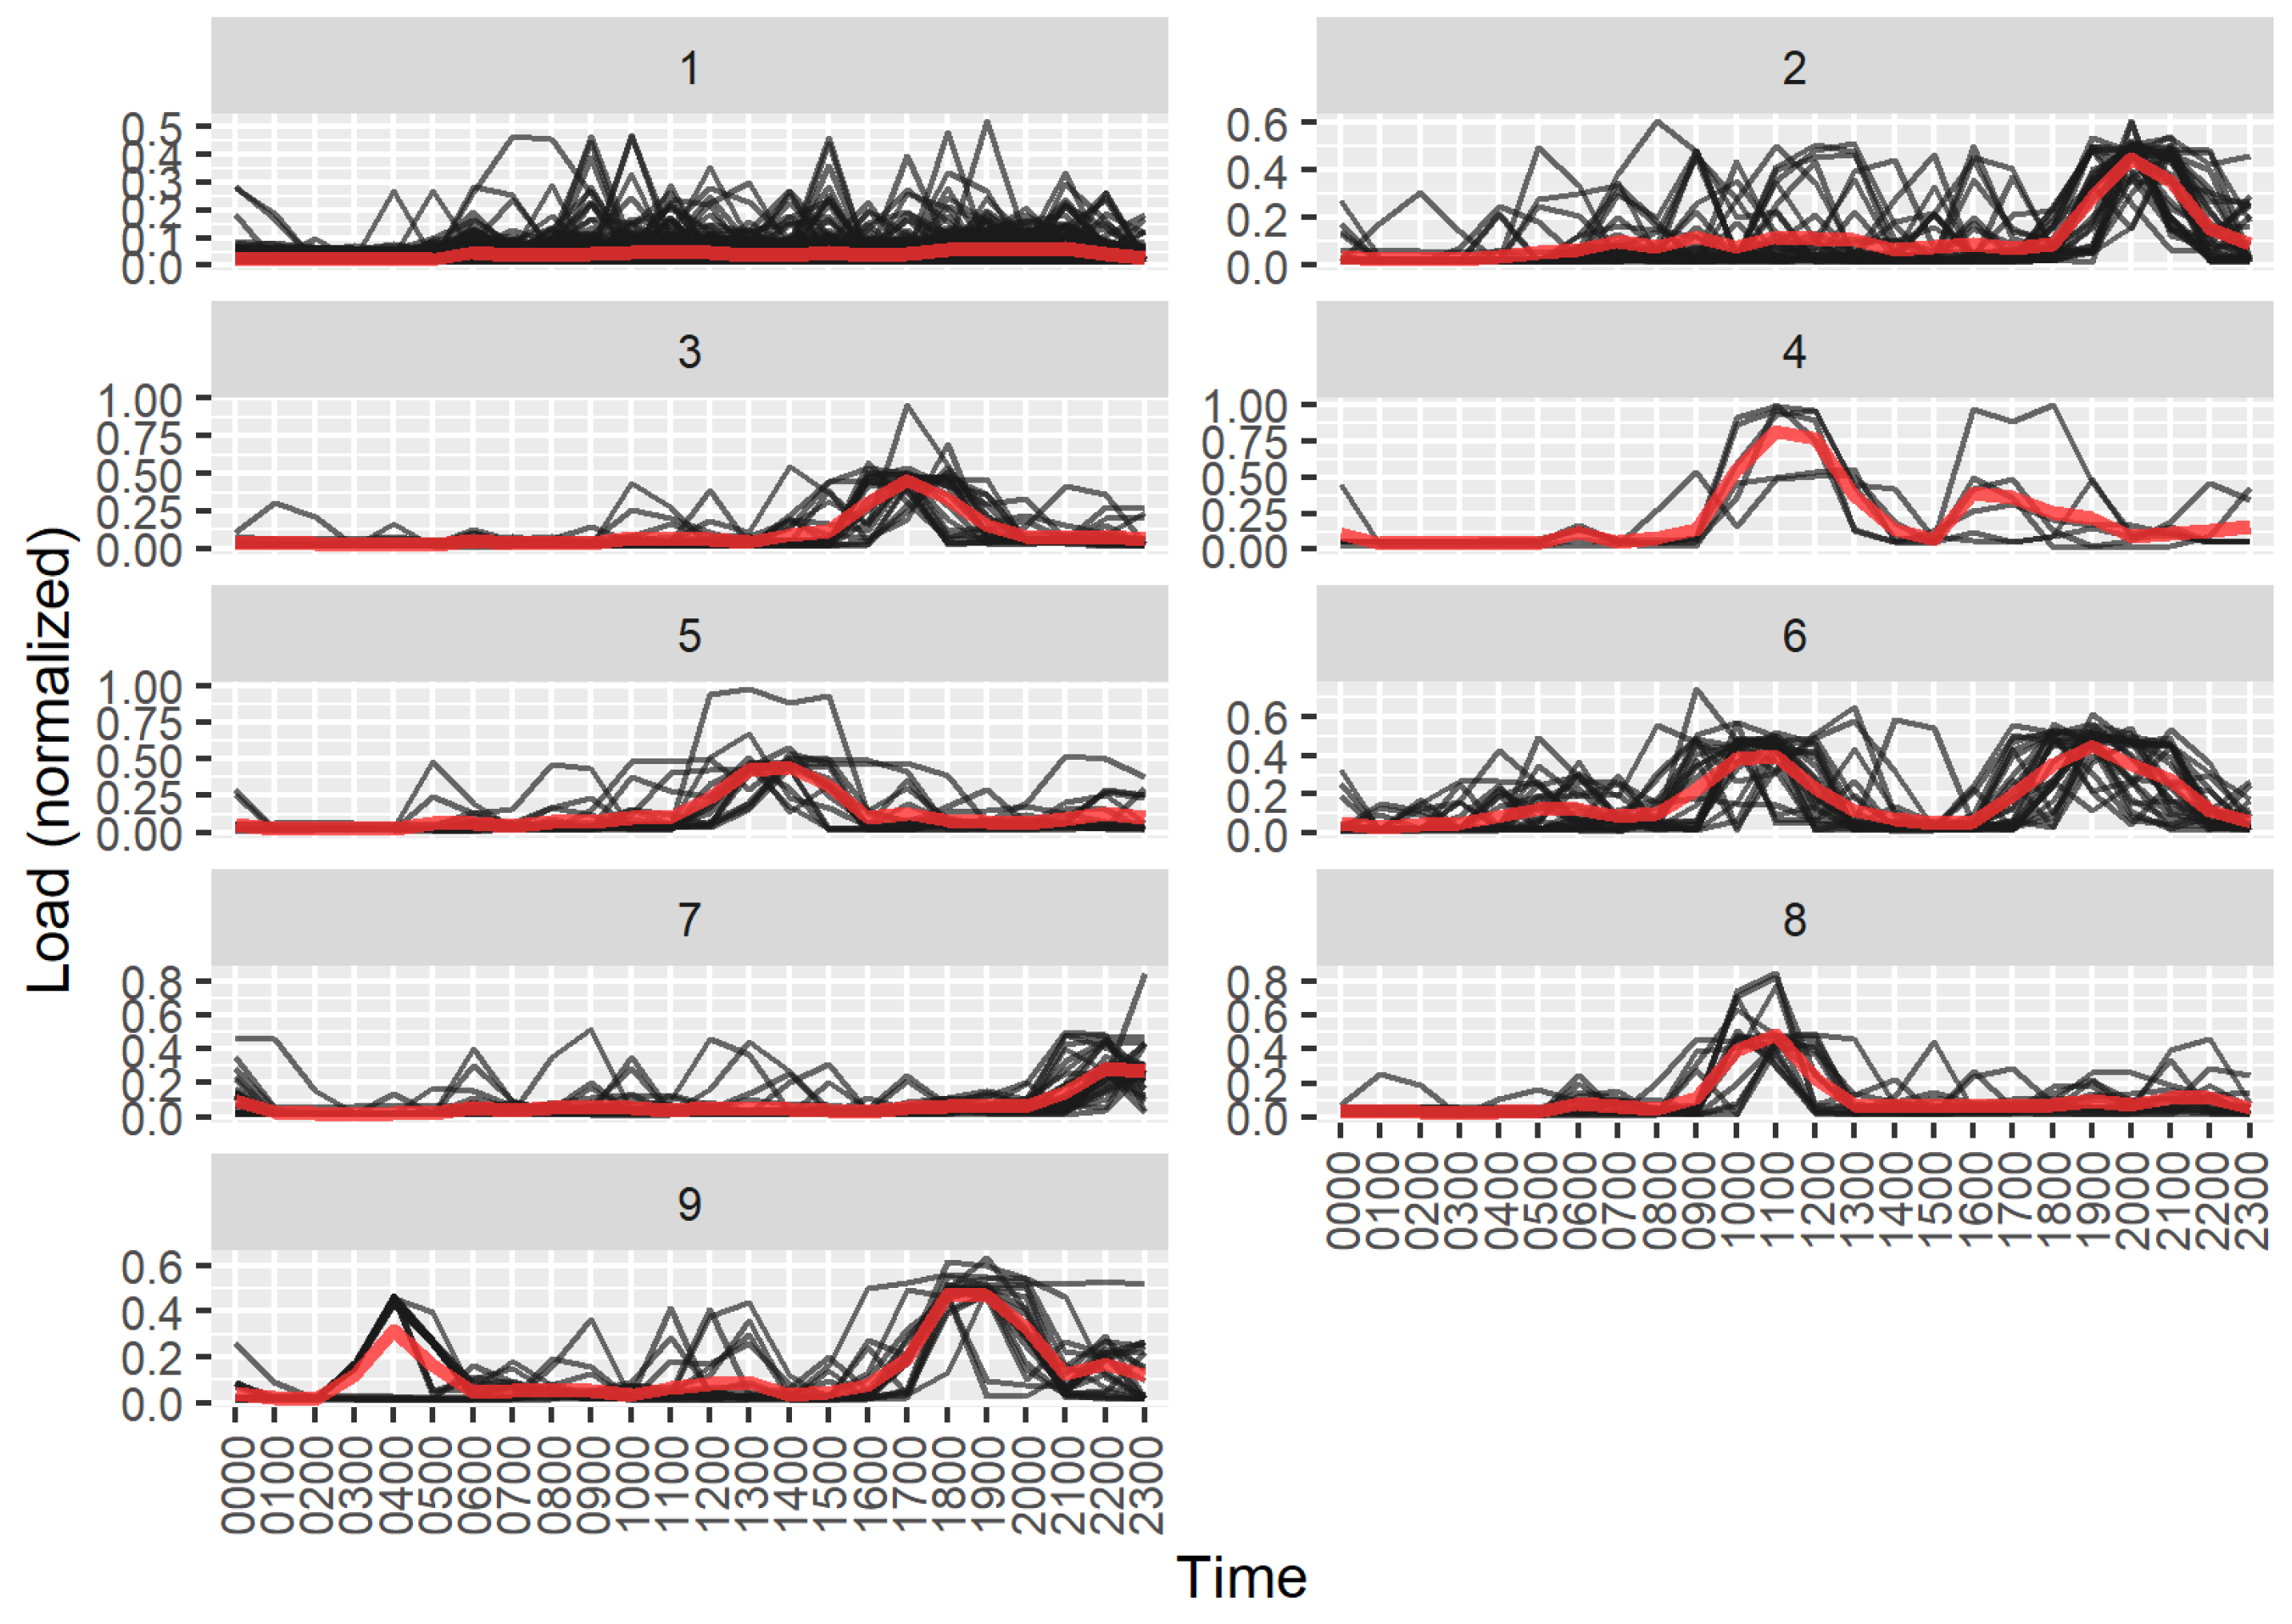
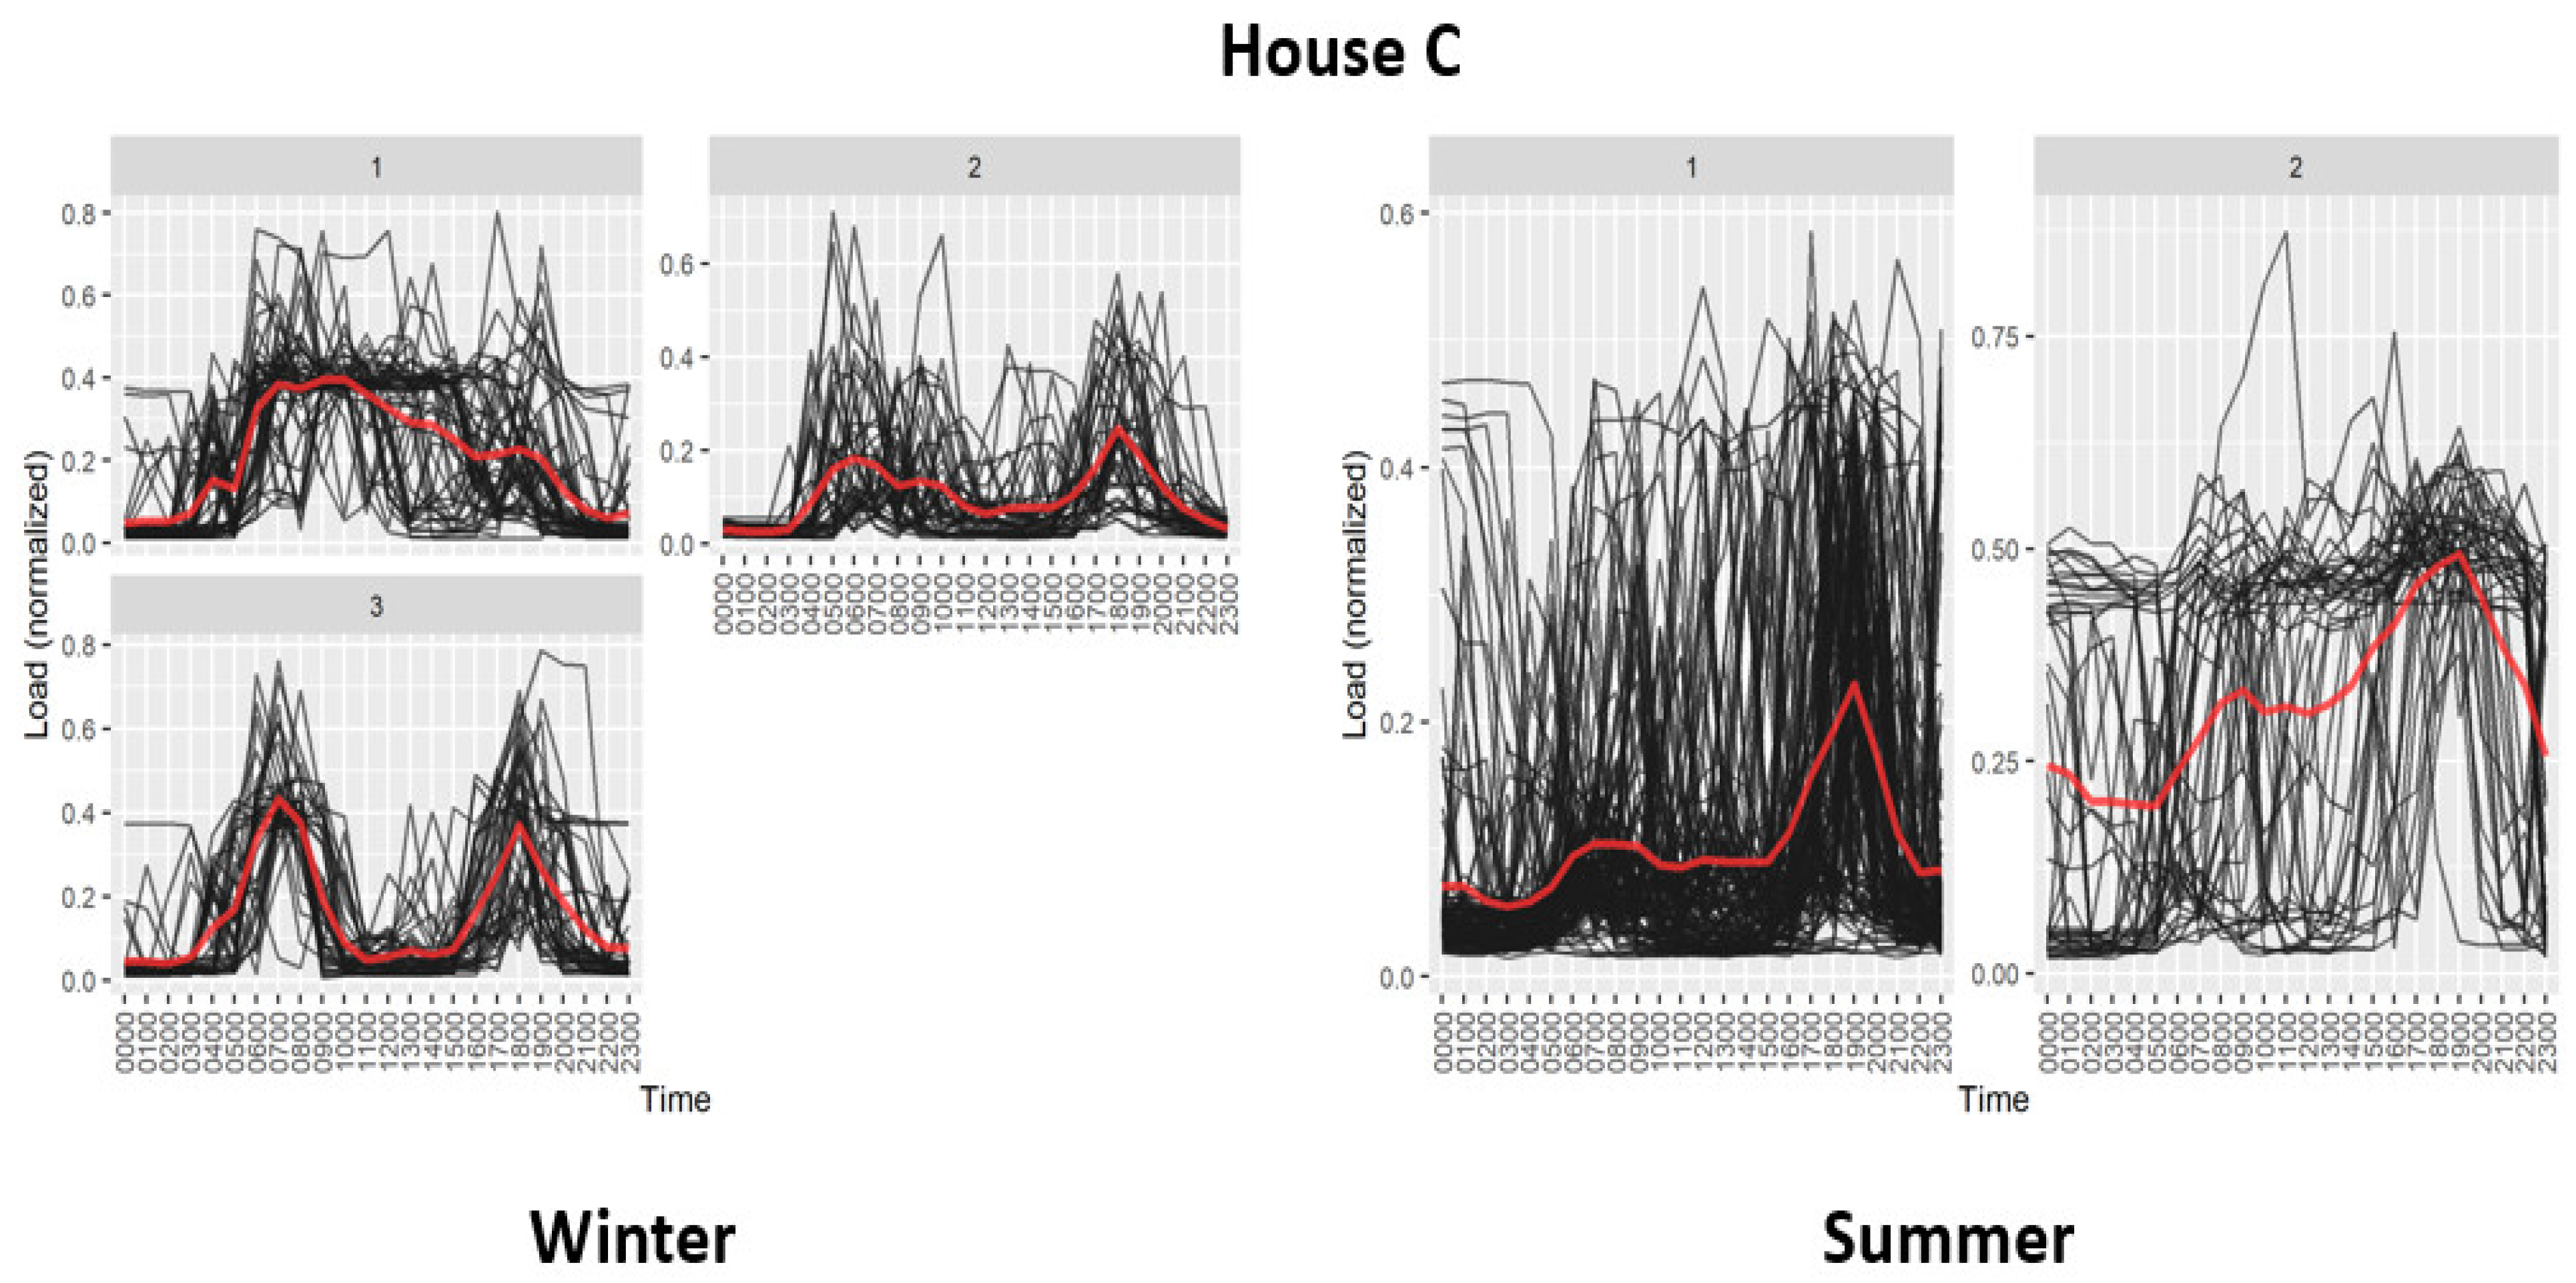
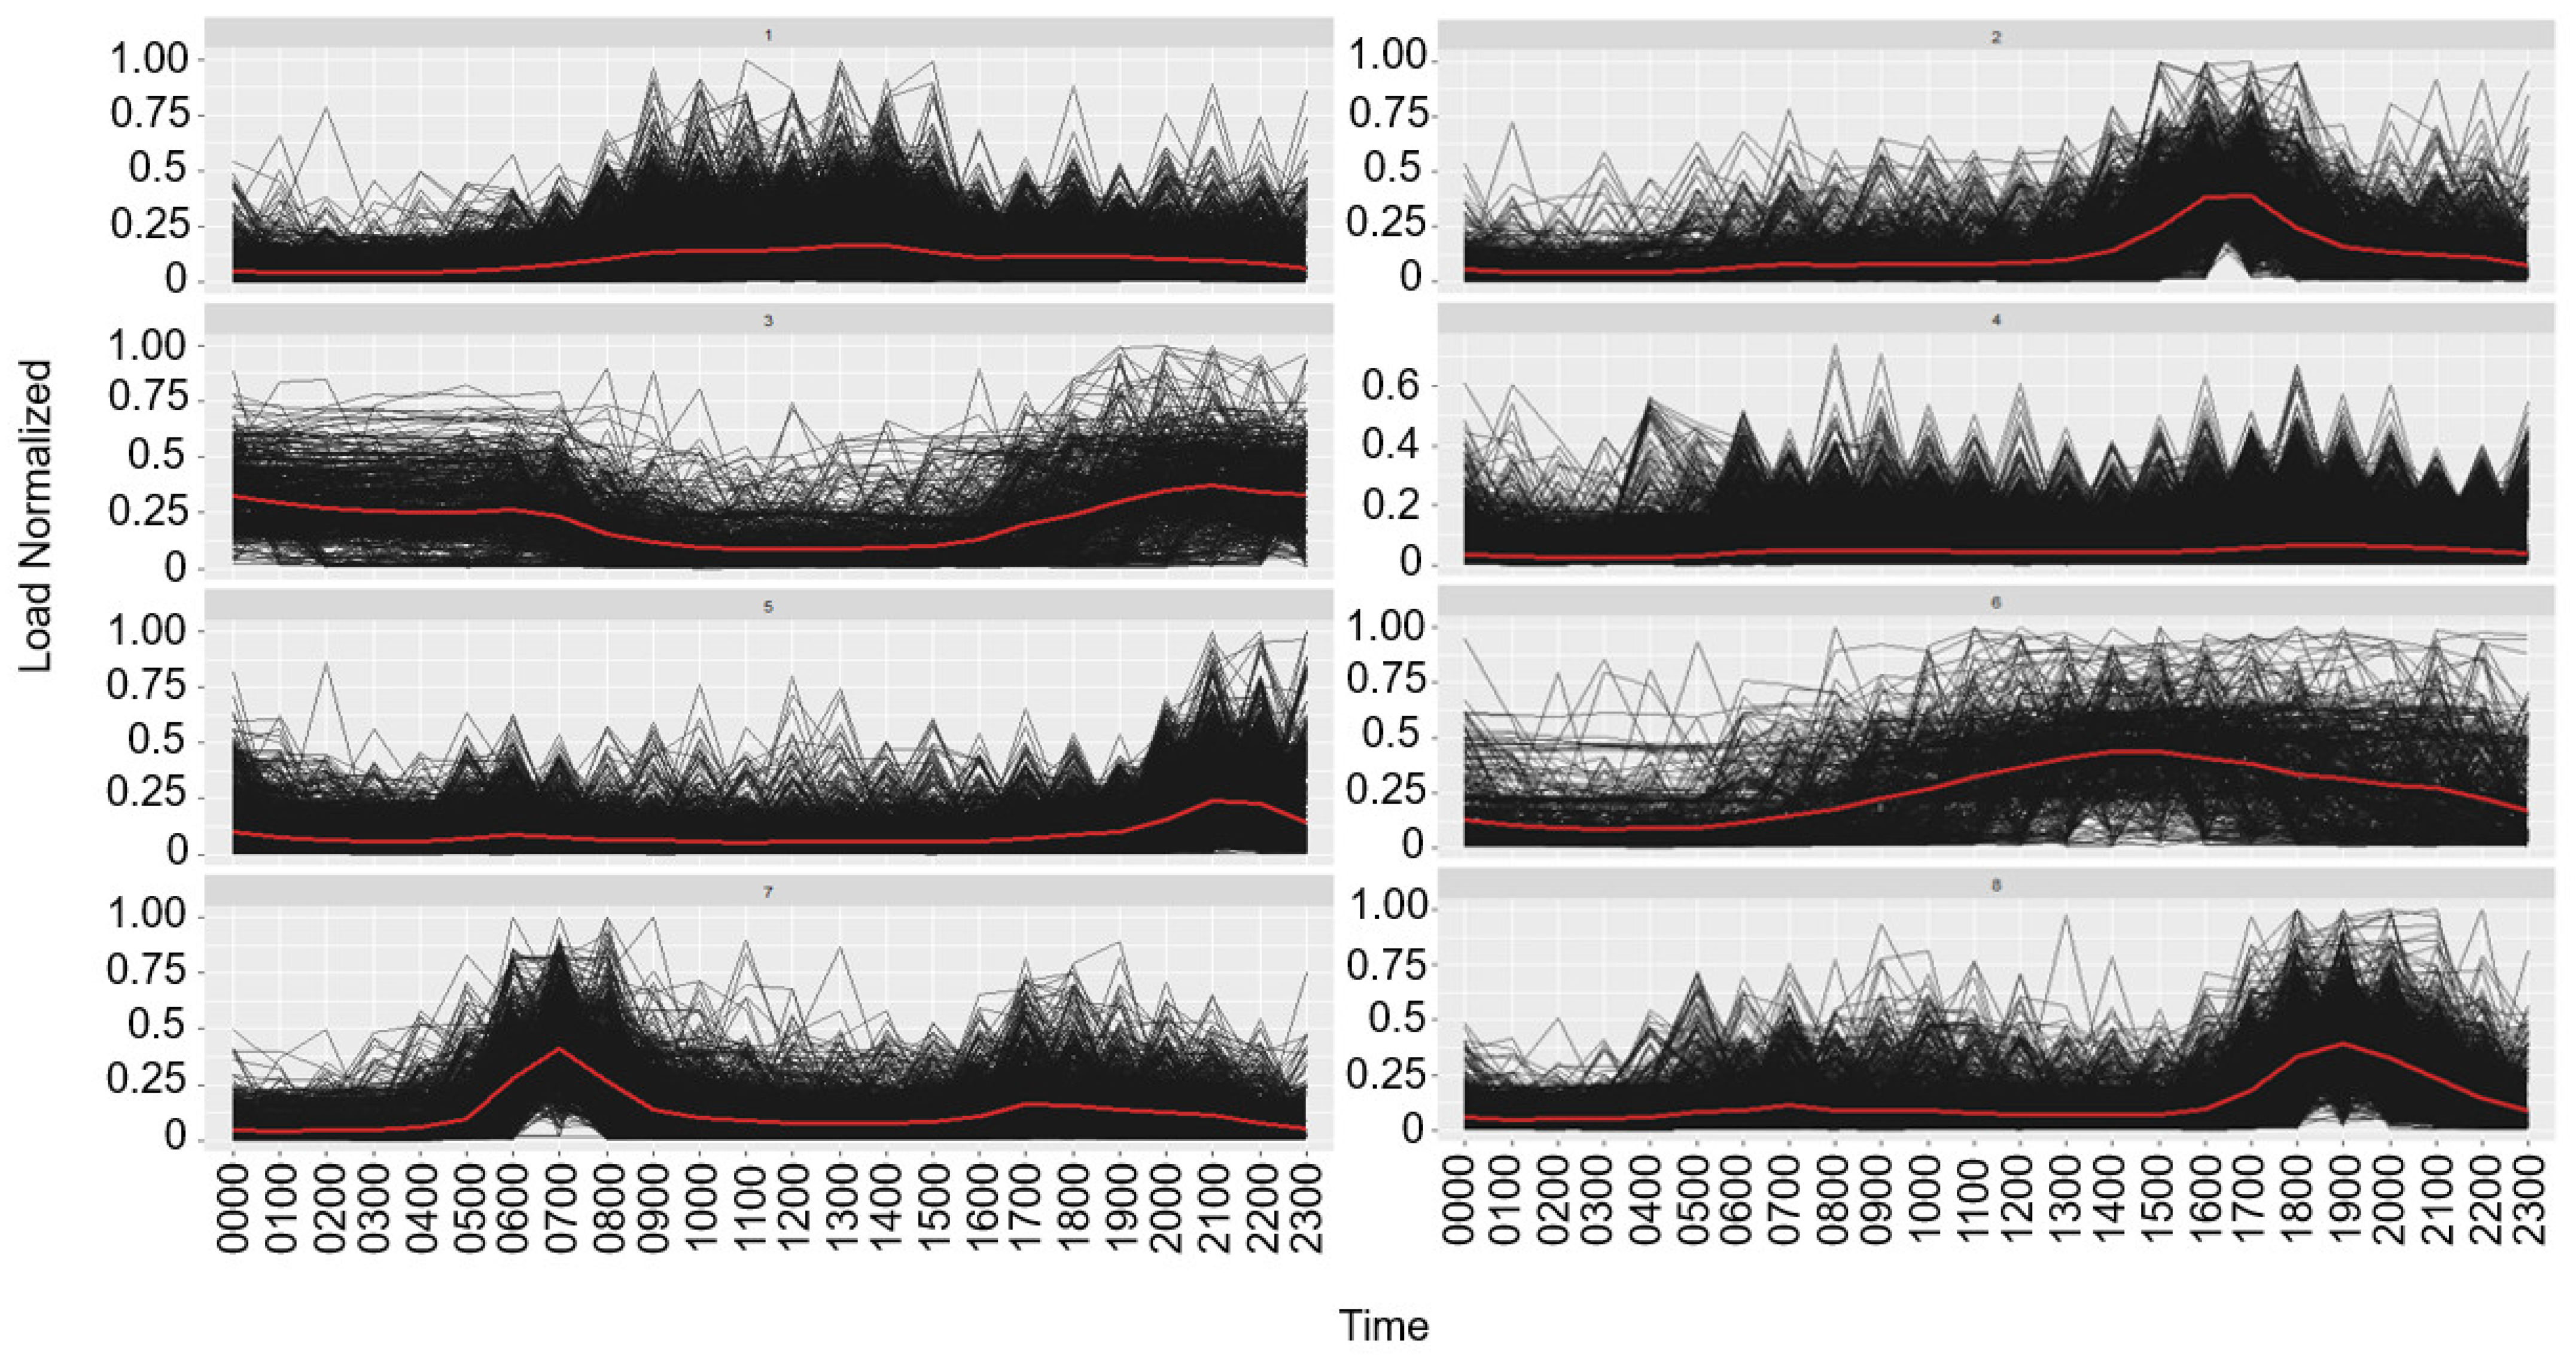
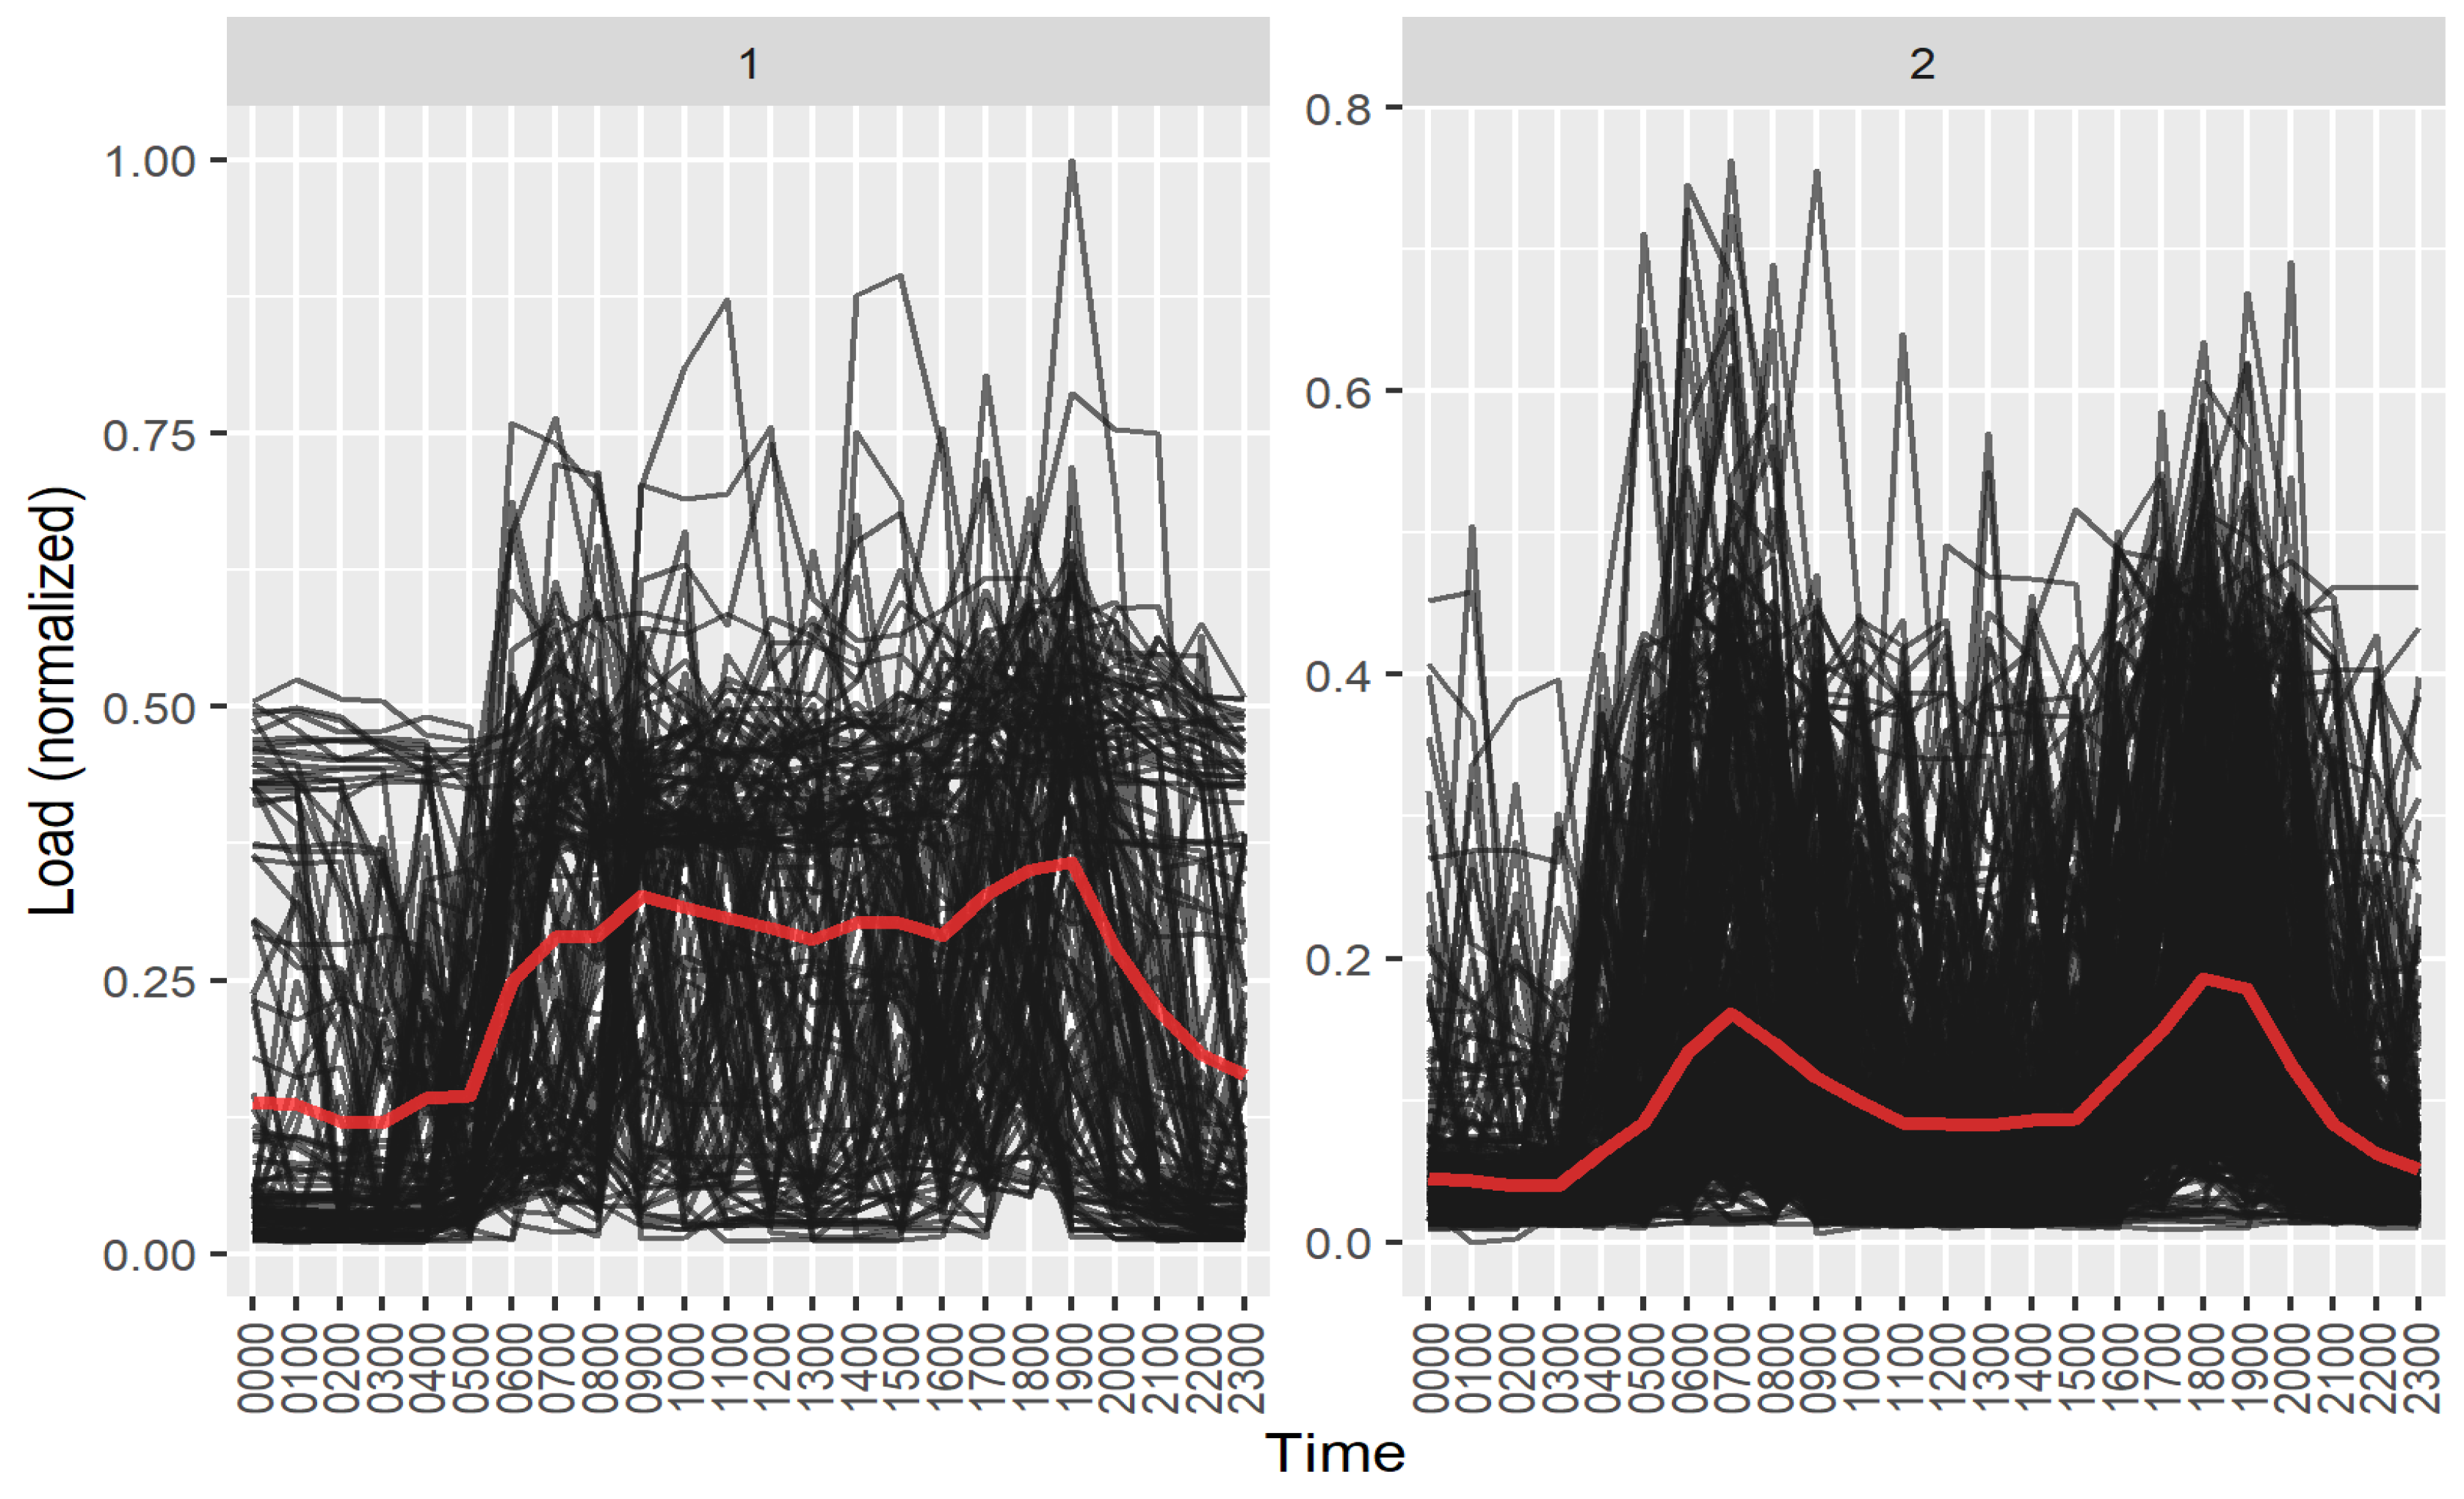
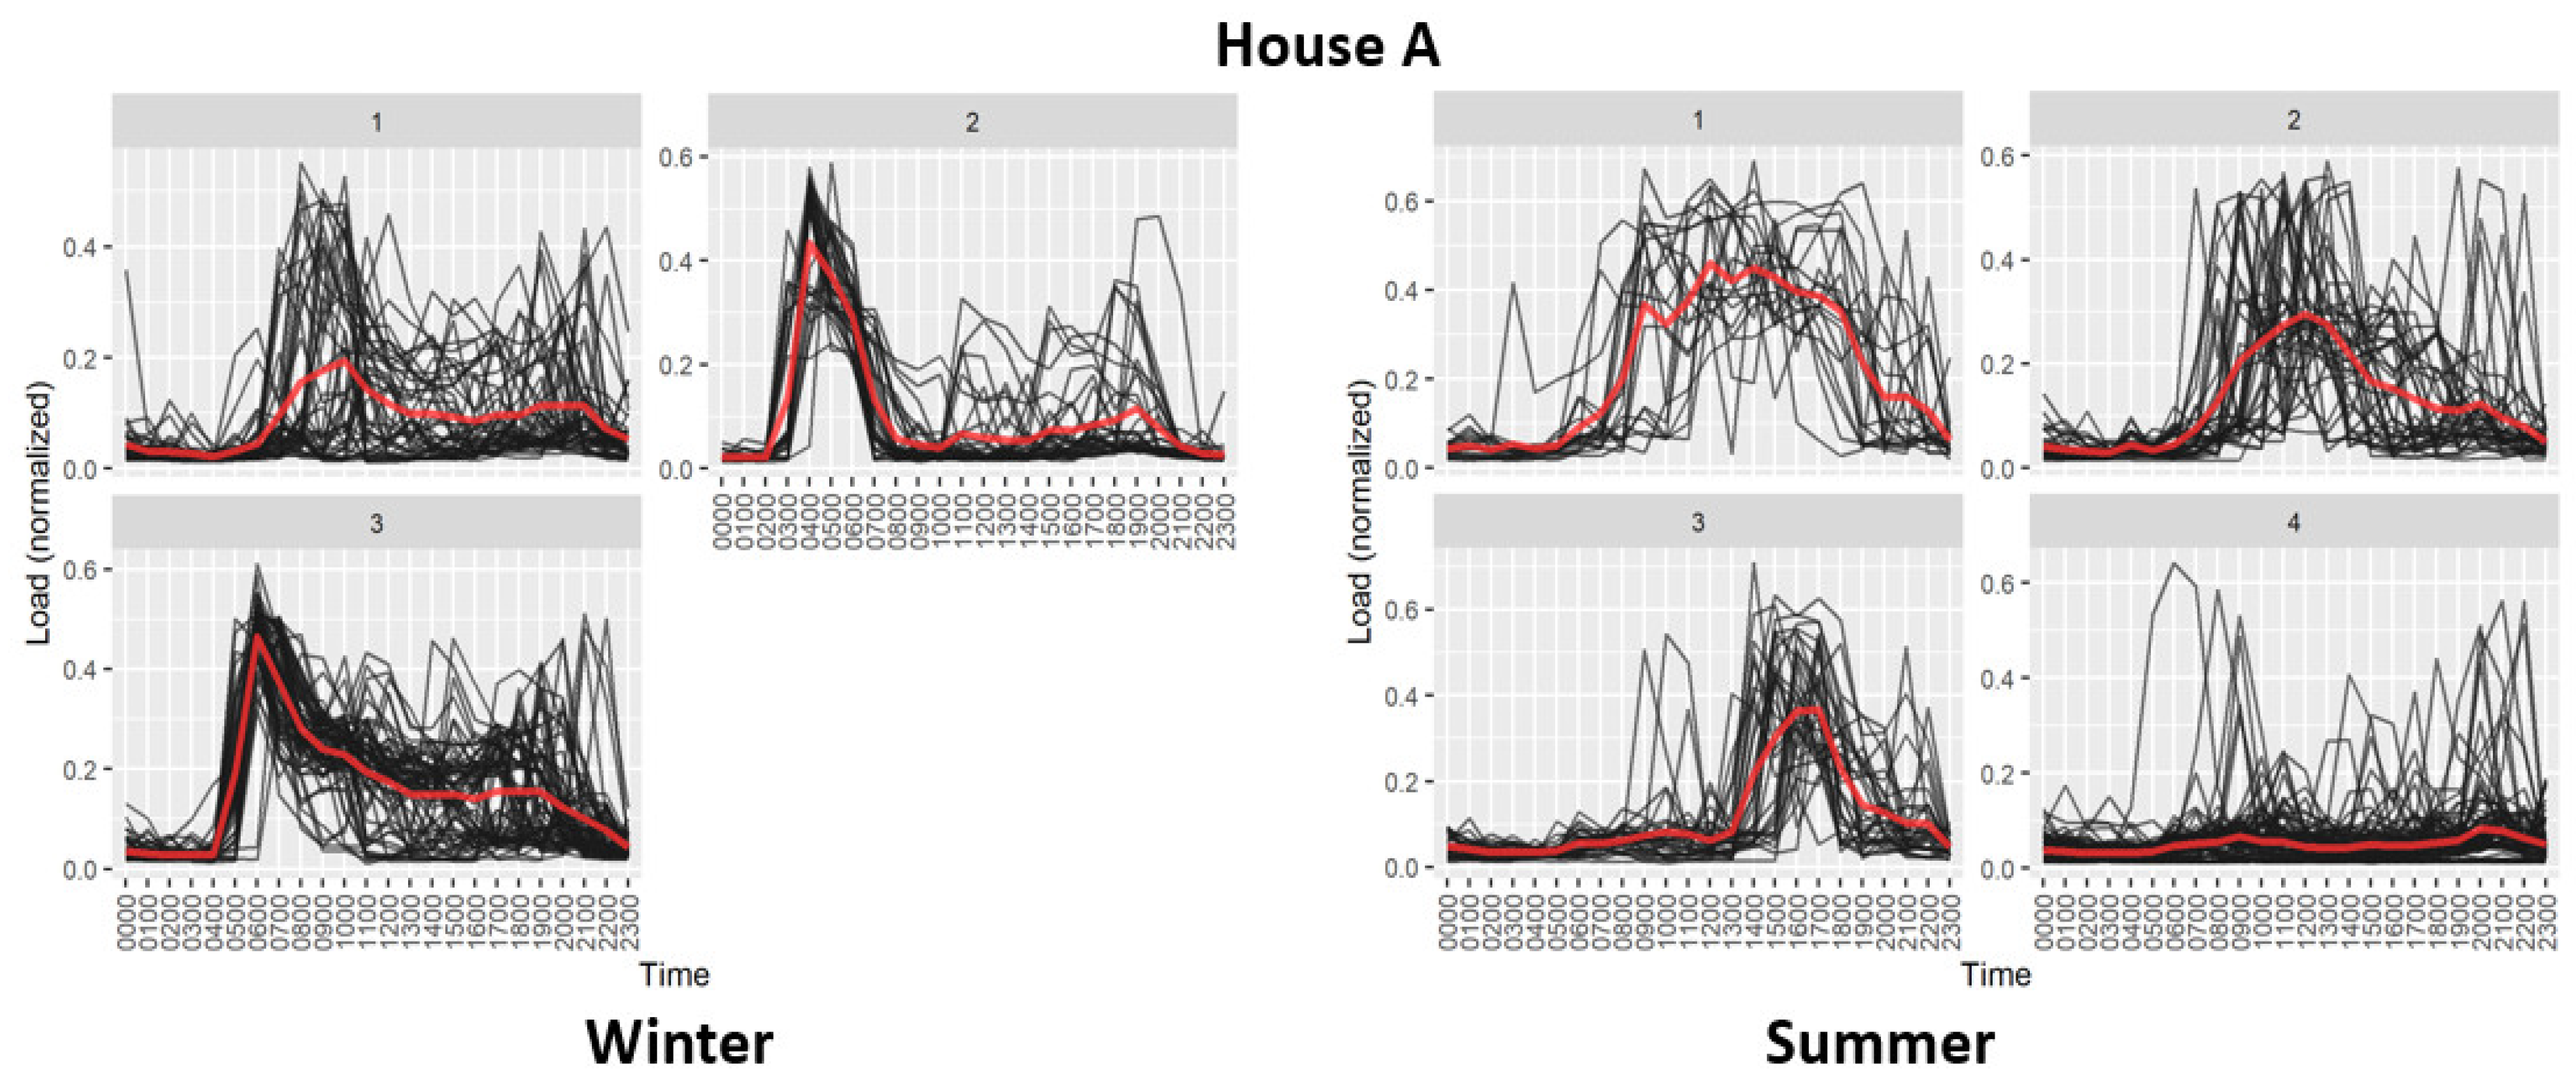
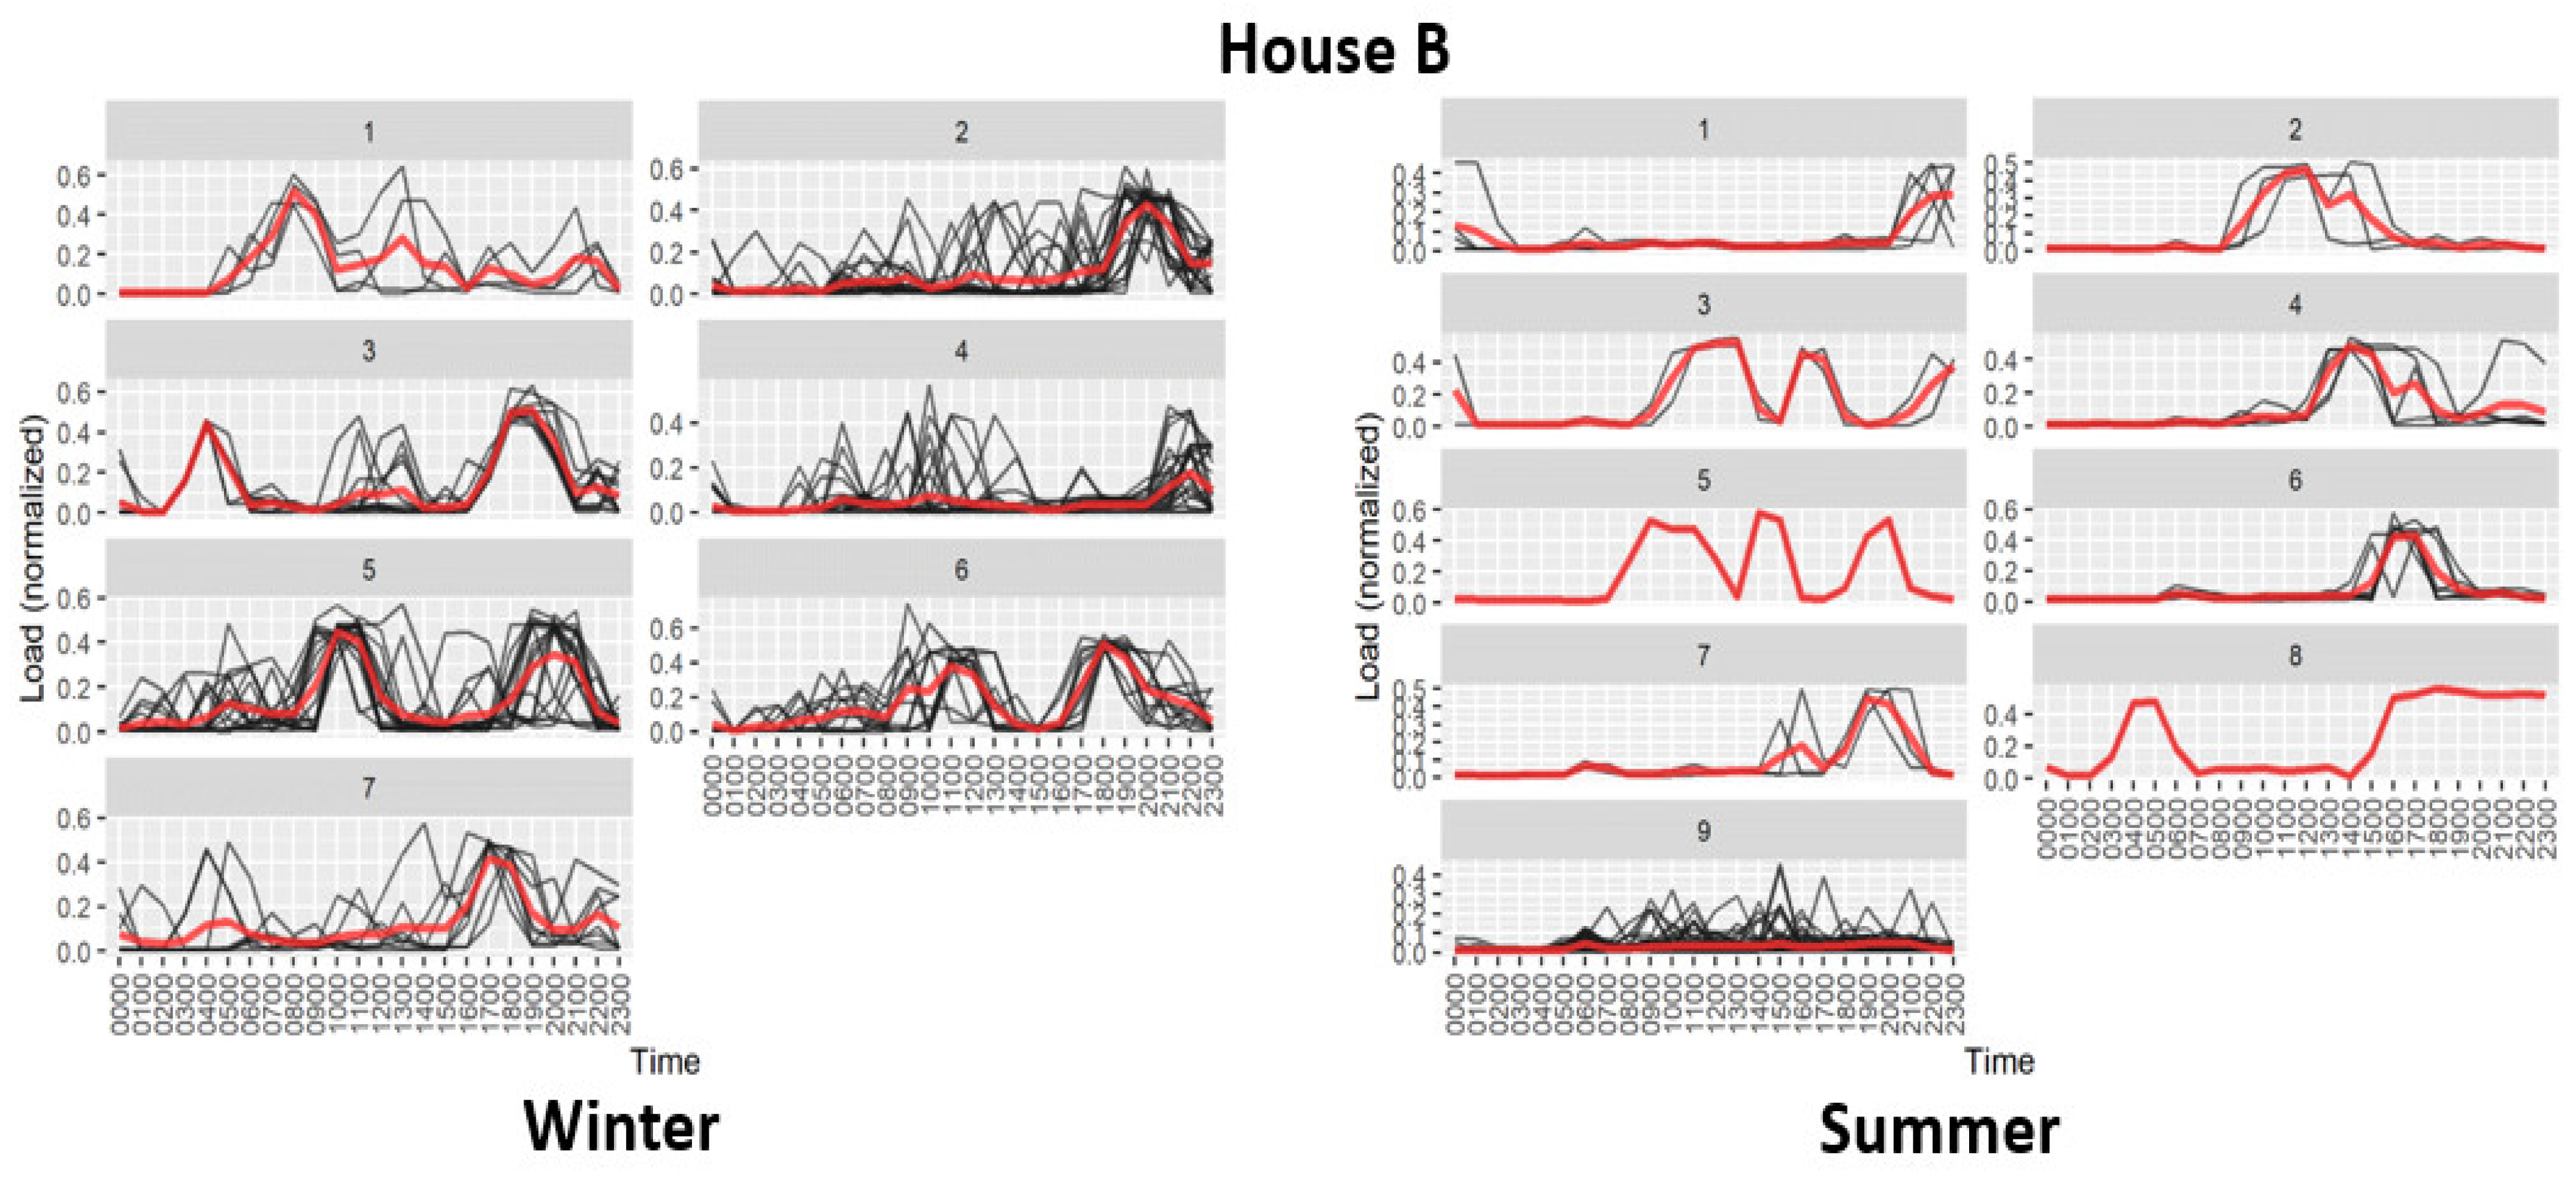
4.2. Pattern Identification
4.3. Household Contextual Factors
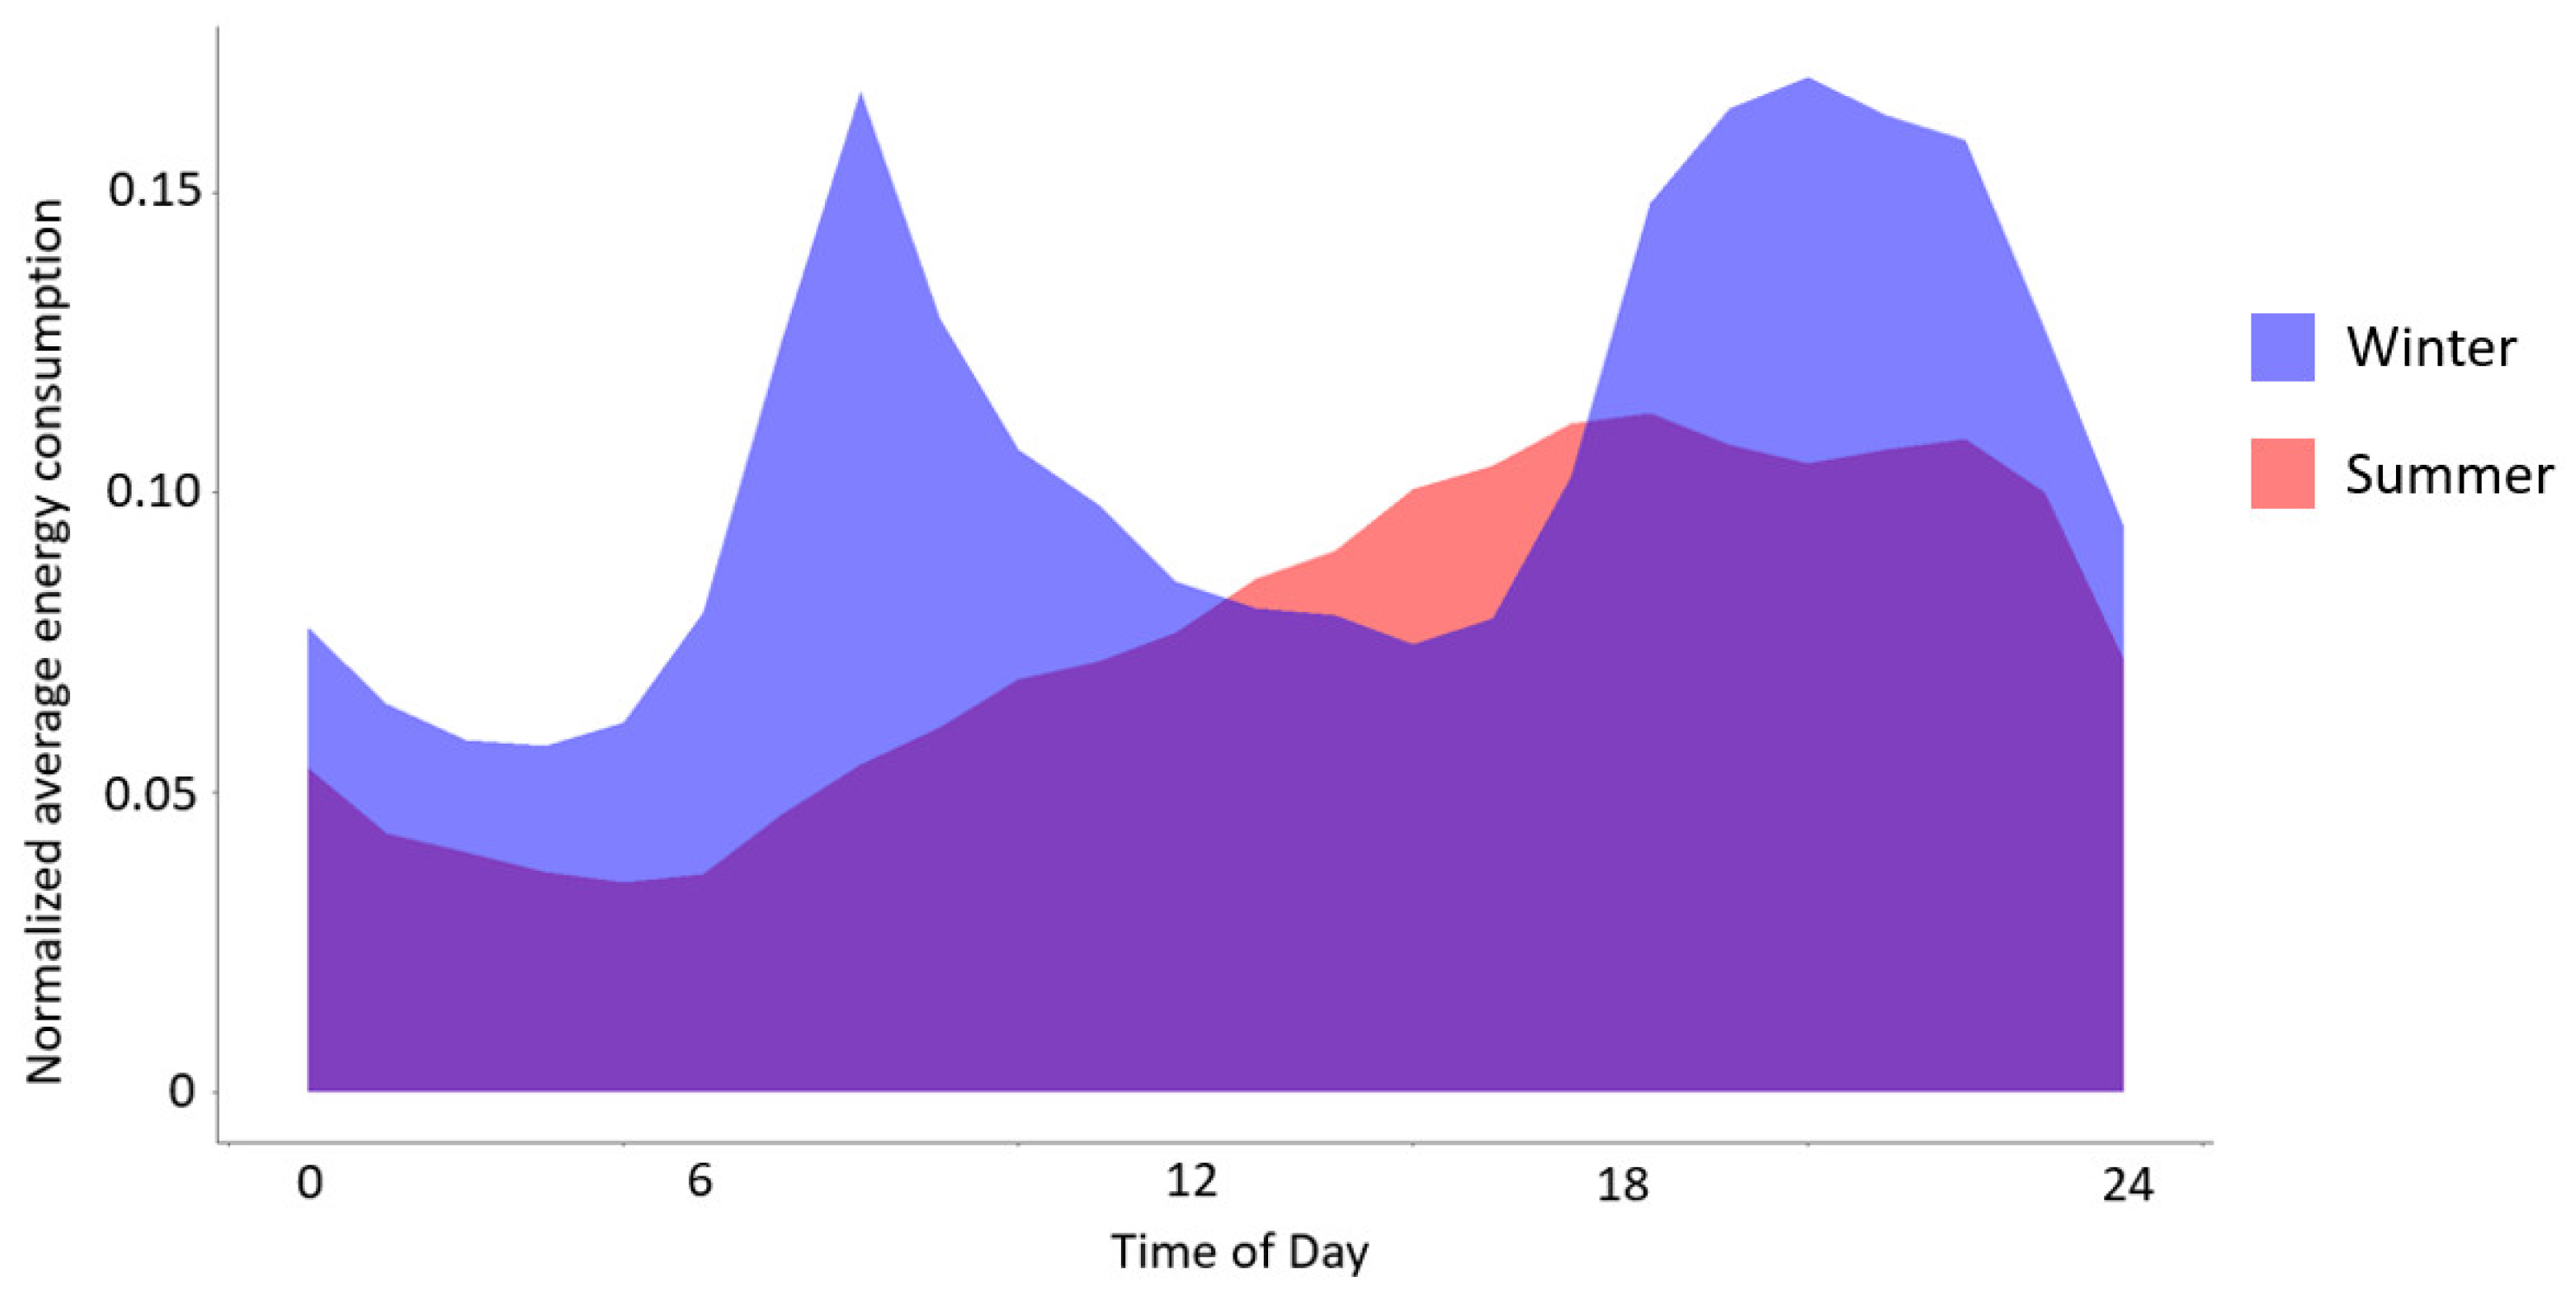
4.4. Heating and Cooling Practices
- 6.
- Precinct vs. Individual Household Analysis
5. Conclusions
Author Contributions
Funding
Informed Consent Statement
Data Availability Statement
Acknowledgments
Conflicts of Interest
References
- Morvaj, B.; Evins, R.; Carmeliet, J. Decarbonizing the electricity grid: The impact on urban energy systems, distribution grids and district heating potential. Appl. Energy 2017, 191, 125. [Google Scholar] [CrossRef]
- Gan, L.; Jiang, P.; Lev, B.; Zhou, X. Balancing of supply and demand of renewable energy power system: A review and bibliometric analysis. Sustain. Futures 2020, 2, 100013. [Google Scholar] [CrossRef]
- Vaishnav, P.; Fatimah, A.M. The Environmental Consequences of Electrifying Space Heating. Environ. Sci. Technol. 2020, 54, 9814–9823. [Google Scholar] [CrossRef] [PubMed]
- Pelenur, M. Household energy use: A study investigating viewpoints towards energy efficiency techologies and behaviour. Energy Effic. 2018, 11, 1825–1846. [Google Scholar] [CrossRef] [Green Version]
- Pothitou, M.; Varga, L.; Kolios, A.; Gu, S. Linking energy behaviour, attitude and habits with environmental predisposition and knowledge. Int. J. Sustain. Energy 2015, 36, 398–414. [Google Scholar] [CrossRef]
- Kurz, T.; Gardner, B.; Verplanken, B.; Abraham, C. Habitual behaviors or patterns of practice? Explaining and changing repetitive climate-relevant actions. WIREs Clim. Chang. 2015, 6, 113–128. [Google Scholar] [CrossRef] [Green Version]
- Bogin, D.; Kissinger, M.; Erell, E. Comparison of domestic lifestyle energy consumption cluster approaches. Energy Build. 2021, 253, 111537. [Google Scholar] [CrossRef]
- Gram-Hanssen, K. New needs for better understanding of household’s energy consumption—Behaviour, lifestyle or practices? Archit. Eng. Des. Manag. 2014, 10, 91–107. [Google Scholar] [CrossRef]
- Yilmaz, S.; Chambers, J.; Patel, M. Comparison of clustering approaches for domestic electricity load profile characterisation—Implications for demand side management. Energy 2019, 180, 665–677. [Google Scholar] [CrossRef]
- Du, J.; Pan, W. Diverse occupant behaviors and energy conservation opportunities for university student residences in Hong Kong. Build. Environ. 2021, 195, 107730. [Google Scholar] [CrossRef]
- Chatterton, T.; Wilson, C. The ‘Four Dimensions of Behaviour’s framework: A tool for characterising behaviours to help design better interventions. Transp. Plan. Technol. 2014, 37, 38–61. [Google Scholar] [CrossRef] [Green Version]
- Gram-Hanssen, K. Households’ Energy Use-Which is the More Important: Efficient Technologies or User Practices? In Proceedings of the World Renewable Energy Congress (WREC 2011), Linkoping, Sweden, 8–13 May 2011. [Google Scholar]
- Guy, S. Designing urban knowledge: Competing perspectives on energy and buildings. Environ. Plan. C Gov. Policy 2006, 24, 645–659. [Google Scholar] [CrossRef] [Green Version]
- Maassen, A. Social science perspectives on energy transitions. Proc. Inst. Civ. Eng. Energy 2009, 162, 161–167. [Google Scholar] [CrossRef]
- Spaargaren, G. Theories of practices: Agency, technology, and culture: Exploring the relevance of practice theories for the governance of sustainable consumption practices in the new world-order. Glob. Environ. Chang. 2011, 21, 813–822. [Google Scholar] [CrossRef]
- Spaargaren, G.; Martens, S.; Beckers, T.A. Sustainable technologies and everyday life. In User Behavior and Technology Development; Springer: Berlin/Heidelberg, Germany, 2006; pp. 107–118. [Google Scholar]
- Stephenson, J.; Barton, B.; Carrington, G.; Gnoth, D.; Lawson, R.; Thorsnes, P. Energy cultures: A framework for understanding energy behaviours. Energy Policy 2010, 38, 6120–6129. [Google Scholar] [CrossRef] [Green Version]
- Strengers, Y.; Maller, C. Integrating health, housing and energy policies: Social practices of cooling. Build. Res. Inf. 2011, 39, 154–168. [Google Scholar] [CrossRef]
- Pellegrino, M.; Wernert, C.; Chartier, A. Social Housing Net-Zero Energy Renovations with Energy Performance Contract: Incorporating Occupants’ Behaviour. Urban Plan. 2022, 7, 2183–7635. [Google Scholar] [CrossRef]
- Shove, E. Beyond the ABC: Climate change policy and theories of social change. Environ. Plan. A 2010, 42, 1273–1285. [Google Scholar] [CrossRef] [Green Version]
- Eon, C.; Breadsell, J.K.; Morrison, G.M.; Byrne, J. The home as a system of practice and its implications for energy and water metabolism. Sustain. Prod. Consum. 2018, 13, 48–59. [Google Scholar] [CrossRef] [Green Version]
- Moser, K.; Harder, J.; Koo, S.G. Internet of Things in Home Automation and Energy Efficient Smart Home Technologies. In Proceedings of the 2014 IEEE International Conference on Systems, Man, and Cybernetics (SMC), San Diego, CA, USA, 5–8 October 2014. [Google Scholar]
- Røpke, I. New technology in everyday life—Social processes and environmental impact. Ecol. Econ. 2001, 38, 403–422. [Google Scholar] [CrossRef]
- Hargreaves, T. Practice-ing behaviour change: Applying social practice theory to pro-environmental behaviour change. J. Consum. Cult. 2011, 11, 79–99. [Google Scholar] [CrossRef]
- Hand, M.; Shove, E.; Southerton, D. Explaining Showering: A Discussion of the Material, Conventional, and Temporal Dimensions of Practice. Sociol. Res. Online 2005, 10, 101–113. [Google Scholar] [CrossRef]
- Breadsell, J.; Eon, C.; Morrison, G.; Kashima, Y. Interlocking practices and their influence in the home. Environ. Plan. B Urban Anal. City Sci. 2019, 46, 1405–1421. [Google Scholar] [CrossRef]
- Hanmer, C.; Shipworth, M.; Shipworth, D.; Carter, E. How household thermal routines shape UK home heating demand patterns. Energy Effic. 2018, 12, 5–17. [Google Scholar] [CrossRef] [Green Version]
- Foulds, C.; Powell, J.; Seyfang, G. Investigating the performance of everyday domestic practices using building monitoring. Build. Res. Inf. 2013, 41, 622–636. [Google Scholar] [CrossRef]
- McKenna, E.; Richardson, I.; Thomson, M. Smart meter data: Balancing consumer privacy concerns with legitimate applications. Energy Policy 2012, 41, 807–814. [Google Scholar] [CrossRef] [Green Version]
- Higginson, S.; McKenna, E.; Hargreaves, T.; Chilvers, J.; Thomson, M. Diagramming social practice theory: An interdisciplinary experiment exploring practices as networks. Indoor Built Environ. 2015, 24, 950–969. [Google Scholar] [CrossRef] [Green Version]
- Shove, E.; Walker, G. What Is Energy For? Social Practice and Energy Demand. Theory Cult. Soc. 2014, 31, 41–58. [Google Scholar] [CrossRef] [Green Version]
- Breadsell, J.; Byrne, J.; Morrison, G. Household energy and water practices change post-occupancy in an Australian low-carbon development. Sustainability 2019, 11, 5559. [Google Scholar] [CrossRef] [Green Version]
- Eon, C.; Breadsell, J.; Morrison, G.; Byrne, J. Shifting Home Energy Consumption Through a Holistic Understanding of the Home System of Practice. In Decarbonising the Built Environment; Palgrave Macmillan: Singapore, 2019; pp. 431–447. [Google Scholar]
- Gram-Hanssen, K. Standby Consumption in Households Analyzed with a Practice Theory Approach. J. Ind. Ecol. 2010, 14, 150–165. [Google Scholar] [CrossRef]
- Røpke, I. Theories of practice—New inspiration for ecological economic studies on consumption. Ecol. Econ. 2009, 68, 2490–2497. [Google Scholar] [CrossRef]
- Watson, M. How theories of practice can inform transition to a decarbonised transport system. J. Transp. Geogr. 2012, 24, 488–496. [Google Scholar] [CrossRef] [Green Version]
- Fjellså, I.F.; Ryghaug, M.; Skjølsvold, T.M. Flexibility poverty: ‘Locked-in’ flexibility practices and electricity use among students. Energy Sources Part B Econ. Plan. Policy 2021, 16, 1076–1093. [Google Scholar] [CrossRef]
- Palm, J.; Eidenskog, M.; Luthander, R. Sufficiency, change, and flexibility: Critically examining the energy consumption profiles of solar PV prosumers in Sweden. Energy Res. Soc. Sci. 2018, 39, 12–18. [Google Scholar] [CrossRef]
- Afzalan, M.; Jazizadeh, F. Residential loads flexibility potential for demand response using energy consumption patterns and user segments. Appl. Energy 2019, 254, 113693. [Google Scholar] [CrossRef]
- Powells, G.; Bulkeley, H.; Bell, S.; Judson, E. Peak electricity demand and the flexibility of everyday life. Geoforum 2014, 55, 43–52. [Google Scholar] [CrossRef] [Green Version]
- Hahn, H.; Meyer-Nieberg, S.; Pickl, S. Electric load forecasting methods: Tools for decision making. Eur. J. Oper. Res. 2009, 199, 902–907. [Google Scholar] [CrossRef]
- Critz, D.K.; Busche, S.; Connors, S. Power systems balancing with high penetration renewables: The potential of demand response in Hawaii. Energy Convers. Manag. 2013, 76, 609–619. [Google Scholar] [CrossRef]
- Karki, R.; Billinton, R. Reliability/cost implications of PV and wind energy utilization in small isolated power systems. IEEE Trans. Energy Convers. 2001, 16, 368–373. [Google Scholar] [CrossRef]
- García, S.; Parejo, A.; Personal, E.; Guerrero, J.I.; Biscarri, F.; León, C. A retrospective analysis of the impact of the COVID-19 restrictions on energy consumption at a disaggregated level. Appl. Energy 2021, 287, 116547. [Google Scholar] [CrossRef]
- Papageorgiou, G.; Efstathiades, A.; Poullou, M.; Ness, A.N. Managing household electricity consumption: A correlational, regression analysis. Int. J. Sustain. Energy 2020, 39, 486–496. [Google Scholar] [CrossRef]
- Papageorgiou, G.; Efstathiades, A.; Nicolaou, N.; Maimaris, A. Energy management in the hotel industry of Cyprus. In Proceedings of the IEEE International Energy Conference 2018, Limassol, Cyprus, 3–7 June 2018. [Google Scholar]
- Alvarez, M.; Agbossou, K.; Cardenas, A.; Kelouwani, S.; Boulon, L. Demand response strategy applied to residential electric water heaters using dynamic programming and k-means clustering. IEEE Trans. Sustain. Energy 2020, 11, 524–533. [Google Scholar] [CrossRef]
- Singh, G.; Swarnkar, A.; Gupta, N.; Niazi, K. Outlier detection and clustering of household’s electrical load profiles. Intell. Comput. Tech. Smart Energy Syst. 2022, 609–620. [Google Scholar]
- Tureczek, A.; Nielsen, P.; Madsen, H. Electricity Consumption Clustering using smart meter data. Energies 2019, 11, 859. [Google Scholar] [CrossRef] [Green Version]
- Seunghui, L.; Sungwon, J.; Ki-Taek, L. An analysis of energy consumption types considering life patterns of single-person households. J. Archit. Inst. Korea Plan. Des. 2019, 35, 37–46. [Google Scholar]
- Conticelli, E.; Proli, S.; Tondelli, S. Integrating energy efficiency and urban densification policies: Two Italian case studies. Energy Build. 2017, 155, 308–323. [Google Scholar] [CrossRef]
- Papageorgiou, G.; Maimaris, A. Towards the development of Intelligent Pedestrian Mobility Systems (IPMS). In Proceedings of the 2017 International Conference on Electrical Engineering and Informatics (ICELTICs), Banda Aceh, Indonesia, 18–20 October 2017. [Google Scholar]
- Singh, J.; Mantha, S.S.; Phalle, V.M. Characterizing domestic electricity consumption in the Indian urban household sector. Energy Build. 2018, 170, 74–82. [Google Scholar] [CrossRef]
- Tang, W.; Wang, H.; Lee, X.; Yang, H. Machine learning approach to uncovering residential energy consumption patterns based on socioeconomic and smart meter data. Energy 2022, 240, 122500. [Google Scholar] [CrossRef]
- Czetany, L.; Vamos, V.; Horvath, M.; Szalay, Z.; Mota-Babiloni, A.; Deme-Belafi, Z.; Csoknyai, T. Development of electricity consumption profiles of residential buildings based on smart meter data clustering. Energy Build. 2021, 252, 111376. [Google Scholar] [CrossRef]
- Trotta, G. An empirical analysis of domestic electricity load profiles: Who consumes how much and when? Appl. Energy 2020, 275, 115399. [Google Scholar] [CrossRef]
- Miletic, B. Australia’s Largest Geothermal System Installed in Western Syndey. 2017. Available online: https://www.architectureanddesign.com.au/news/australia-s-first-geothermal-system-installed-in-w# (accessed on 24 February 2022).
- Wang, Y.; Yang, Z.; Wang, Y.; Gu, J. Research on customer’s electricity consumption behavior pattern. J. Phys. Conf. Ser. 2022, 2290, 012042. [Google Scholar] [CrossRef]
- Yuan, X.; Cai, Q.; Deng, S. Power consumption behavior analysis based on cluster analysis. In Proceedings of the SPIE 11884, International Symposium on Artificial Intelligence and Robotics 2021, 118841F, Shanghai, China, 28 October 2021. [Google Scholar]
- Liu, X.; Wang, Q.; Jian, I.; Chi, H.; Yang, D.; Chan, E. Are you an energy saver at home? The personality insights of household energy consevation behaviors based on theory of planned behavior. Resour. Conserv. Recycl. 2021, 174, 105823. [Google Scholar] [CrossRef]
- Li, H.; Hu, B.; Liu, Y.; Yang, B.; Liu, X.; Li, G.; Wang, Z.; Zhou, B. Classification of Electricity Consumption Behavior Based on Improved K-Means and LSTM. Appl. Sci. 2021, 11, 7625. [Google Scholar] [CrossRef]
- Gouveia, J.P.; Seixas, J.; Mestre, A. Daily electricity consumption profiles from smart meters-Proxies of behavior for space heating and cooling. Energy 2017, 141, 108–122. [Google Scholar] [CrossRef]
- Koivisto, M.; Heine, P.; Mellin, I.; Lehtonen, M. Clustering of connection points and load modeling in distribution systems. IEEE Trans. Power Syst. 2012, 28, 1255–1265. [Google Scholar] [CrossRef]
- McLoughlin, F.; Duffy, A.; Conlon, M. A clustering approach to domestic electricity load profile characterisation using smart metering data. Appl. Energy 2015, 141, 190–199. [Google Scholar] [CrossRef] [Green Version]
- Yildiz, B.; Bilbao, J.I.; Dore, J.; Sproul, A. Household electricity load forecasting using historical smart meter data with clustering and classification techniques. In Proceedings of the 2018 IEEE Innovative Smart Grid Technologies-Asia (ISGT Asia), Singapore, 22–25 May 2018. [Google Scholar]
- Bandyopadhyay, S.; Saha, S. Clustering algorithms. In Unsupervised Classification; Springer: Berlin/Heidelberg, Germany, 2013; pp. 75–92. [Google Scholar]
- Han, J.; Kamber, M.; Pei, J. Clustering analysis. In Data Mining: Concept and Technique; Morgan Kaufman: New York, NY, USA, 2012; pp. 478–490. [Google Scholar]
- Charrad, M.; Ghazzali, N.; Boiteau, V.; Niknafs, A. NbClust: An R Package for Determining the Relevant Number of Clusters in a Data Set. J. Stat. Softw. 2014, 61, 1–36. Available online: http://www.jstatsoft.org/v61/i06/ (accessed on 18 February 2022). [CrossRef] [Green Version]
- Abrahamse, W.; Steg, L. Factors Related to Household Energy Use and Intention to Reduce It: The Role of Psychological and Socio-Demographic Variables. Hum. Ecol. Rev. 2011, 18, 30–40. [Google Scholar]
- Anderson, B.; Torriti, J. Explaining shifts in UK electricity demand using time use data from 1974 to 2014. Energy Policy 2018, 123, 544–557. [Google Scholar] [CrossRef]
- Khalid, R.; Christensen, T.H.; Gram-Hanssen, K.; Friis, F. Time-shifting laundry practices in a smart grid perspective: A cross-cultural analysis of Pakistani and Danish middle-class households. Energy Effic. 2019, 12, 1691–1706. [Google Scholar] [CrossRef] [Green Version]
- Torriti, J. Understanding the timing of energy demand through time use data: Time of the day dependence of social practices. Energy Res. Soc. Sci. 2017, 25, 37–47. [Google Scholar] [CrossRef]
- Hampton, S. An ethnography of energy demand and working from home: Exploring the affective dimensions of social practice in the United Kingdom. Energy Res. Soc. Sci. 2017, 28, 1–10. [Google Scholar] [CrossRef]
- Yohanis, Y.G.; Mondol, J.D.; Wright, A.; Norton, B. Real-life energy use in the UK: How occupancy and dwelling characteristics affect domestic electricity use. Energy Build. 2008, 40, 1053–1059. [Google Scholar] [CrossRef]
- Verkade, N.; Höffken, J. Is the Resource Man coming home? Engaging with an energy monitoring platform to foster flexible energy consumption in the Netherlands. Energy Res. Soc. Sci. 2017, 27, 36–44. [Google Scholar] [CrossRef]
- Smale, R.; Van Vliet, B.; Spaargaren, G. When social practices meet smart grids: Flexibility, grid management, and domestic consumption in The Netherlands. Energy Res. Soc. Sci. 2017, 34, 132–140. [Google Scholar] [CrossRef]
- Chen, C.-F.; Xu, X.; Day, J.K. Thermal comfort or money saving? Exploring intentions to conserve energy among low-income households in the United States. Energy Res. Soc. Sci. 2017, 26, 61–71. [Google Scholar] [CrossRef]
- Eon, C.; Morrison, G.M.; Byrne, J. Unraveling everyday heating practices in residential homes. Energy Procedia 2017, 121, 198–205. [Google Scholar] [CrossRef]
- Ozawa, A.; Furusato, R.; Yoshida, Y. Determining the relationship between a household’s lifestyle and its electricity consumption in Japan by analyzing measured electric load profiles. Energy Build. 2016, 119, 200–210. [Google Scholar] [CrossRef]
- Abreu, J.M.; Câmara Pereira, F.; Ferrão, P. Using pattern recognition to identify habitual behavior in residential electricity consumption. Energy Build. 2012, 49, 479–487. [Google Scholar] [CrossRef]
- Breukers, S.; Mourik, R. The end-users as starting point for designing dynamic pricing approaches to change household energy consumption behaviours. In Report for Netbeheer Nederland, Project Group Smart Grids (Pg SG); Duneworks B.V: Eindhoven, The Netherlands, 2013. [Google Scholar]
- Zhao, D.; McCoy, A.; Du, J. An Empirical Study on the Energy Consumption in Residential Buildings after Adopting Green Building Standards. Procedia Eng. 2016, 145, 766–773. [Google Scholar] [CrossRef] [Green Version]
- Chen, S.; Yang, W.; Yoshino, H.; Levine, M.D.; Newhouse, K.; Hinge, A. Definition of occupant behavior in residential buildings and its application to behavior analysis in case studies. Energy Build. 2015, 104, 1–13. [Google Scholar] [CrossRef]
- Liu, H.; Sun, H.; Mo, H.; Liu, J. Analysis and modeling of air conditioner usage behavior in residential buildings using monitoring data during hot and humid season. Energy Build. 2021, 250, 111297. [Google Scholar] [CrossRef]


| Type of Home | Number of Homes | Number of Residents | Internal Area (m2) | NatHERS Star Rating | |||||||||
|---|---|---|---|---|---|---|---|---|---|---|---|---|---|
| Min | Max | Median | Std. Dev. | Min | Max | Median | Std. Dev. | Min | Max | Median | Std. Dev. | ||
| 2-Bedroom | 7 | 1 | 5 | 3 | 1.2 | 83 | 131 | 112 | 13.3 | 4.0 | 7.4 | 5.5 | 1.1 |
| 3-Bedroom | 12 | 1 | 3 | 3 | 0.7 | 126 | 191 | 156 | 11.7 | 4.5 | 6.0 | 5 | 0.6 |
| 4-Bedroom | 19 | 2 | 5 | 4 | 0.9 | 168 | 291 | 215 | 15.1 | 3.8 | 5.5 | 5 | 0.8 |
| 5-Bedroom | 2 | 3 | 7 | 5 | 2 | 270 | 285 | 277 | 7.5 | 4.0 | 4.5 | 4.3 | 0.25 |
| Clusters | Homes | Average Occupants | Average Occupants Who | |
|---|---|---|---|---|
| Work from Home | Students | |||
| 2 to 5 | 30 | 3.32 | 1.03 | 0.81 |
| 6 to 9 | 10 | 2.46 | 1.17 | 0.29 |
Publisher’s Note: MDPI stays neutral with regard to jurisdictional claims in published maps and institutional affiliations. |
© 2022 by the authors. Licensee MDPI, Basel, Switzerland. This article is an open access article distributed under the terms and conditions of the Creative Commons Attribution (CC BY) license (https://creativecommons.org/licenses/by/4.0/).
Share and Cite
Malatesta, T.; Breadsell, J.K. Identifying Home System of Practices for Energy Use with K-Means Clustering Techniques. Sustainability 2022, 14, 9017. https://doi.org/10.3390/su14159017
Malatesta T, Breadsell JK. Identifying Home System of Practices for Energy Use with K-Means Clustering Techniques. Sustainability. 2022; 14(15):9017. https://doi.org/10.3390/su14159017
Chicago/Turabian StyleMalatesta, Troy, and Jessica K. Breadsell. 2022. "Identifying Home System of Practices for Energy Use with K-Means Clustering Techniques" Sustainability 14, no. 15: 9017. https://doi.org/10.3390/su14159017
APA StyleMalatesta, T., & Breadsell, J. K. (2022). Identifying Home System of Practices for Energy Use with K-Means Clustering Techniques. Sustainability, 14(15), 9017. https://doi.org/10.3390/su14159017