Article

Urban-Rural Dichotomy of Quality of Life

by
František Petrovič
1,* and
Patrik Maturkanič
2
1
Department of Ecology and Environmental Sciences, Constantine the Philosopher University in Nitra, 949 01 Nitra, Slovakia
2
College of Appllied Psychology, 411 55 Terezín, Czech Republic
*
Author to whom correspondence should be addressed.
Sustainability 2022, 14(14), 8658; https://doi.org/10.3390/su14148658
Submission received: 29 May 2022 / Revised: 1 July 2022 / Accepted: 13 July 2022 / Published: 15 July 2022

Abstract

:
This paper is focused on the urban-rural dichotomy as one of the dichotomies of quality of life (QOL). The first objective is to find out whether the quality of urban life, or the quality of rural life, is higher in Czechia. The hypothesis assumes that the quality of urban life is higher. The second objective is to identify predictors of QOL and compare values for the residents of cities and villages. In the Theoretical Background section, we discuss cities and urban life, plus villages and rural life. In the QOL section, we explore the quality of urban and rural life in Czechia, and give examples of QOL measurements in Czech municipalities. In the Measurement and Findings section we measure QOL with a subjective indicator on the Cantril scale, and derive findings from these measurements. The correlations between QOL and other variables yield very strong predictors of both urban and rural quality of life. The measurements also yielded two “by products”: The first was the finding that women’s measured values are, except for women’s quality of city life, higher than the measured values of men. The second was the finding that the combination of quality of place and quality of the environment, which we named ‘geographical matter’, was rated higher by the respondents than the combination of QOL and happiness, which we named ‘psychological matter’.

1. Introduction

A distinctive feature of QOL is its dichotomous nature. QOL is the answer to a simple question—“How are you?”—and at the same time it is a complex multidisciplinary and multidimensional concept. It represents both the goal of human existence, and the path to the fulfilment of that goal. It concerns both the individual and society as a whole. It is made up of both a subjective dimension and an objective dimension. The fact that it is a concept implies that it cannot be measured, but at the same time its indicators can be measured. Several scientific questions related to it are also dichotomous: Is the quality of men or women higher? Is the QOL higher for college educated or high school educated people? Is the Easterlin paradox valid or not? Another question can be added, asking whether there is a higher QOL in cities, or villages. In the paper we look for an answer to this within Czechia.

1.1. Theoretical Background

There are many QOL measurements at the global level, as well as at the level of European countries, drawing data from Eurostat, European Social Survey, and the European Values Study [1,2,3]. Our own measurements are published by the OECD or The Economist Intelligence Unit. In the paper, we measure the QOL in the regions of Hradec Králové and Pardubice, i.e., in two of the 14 regions of Czechia.
We live in settlements that are either cities or villages. The ratio of urban to rural population which remained unchanged for centuries was shifted by the Industrial Revolution, with its need for large numbers of workers. The response to it was a massive migration of people from the countryside to the cities. One of the many demonstrations of this migration is the increase in the population of New York City from 60,000 in 1800 to 4.8 million in 1900 [4].

1.1.1. Literature Review

In the past, researchers investigating QOL in municipalities focused primarily on cities. Theoretical issues regarding cities and villages, defining cities, and the development and processes influencing contemporary post-industrial cities are explored by Petrovič, Murgaš (2021) [5]. Much attention has been paid to urbanization projections, not only by institutions such as the UN (2018) [6], or the World Bank (online), but also by scholars [7,8,9] who divided urban development into four stages: urbanization, suburbanization, deurbanization, and reurbanization.
The priority given to cities was related to the fact that rural development has lagged behind urban development, to which researchers and policymakers have responded [10,11,12,13].
The number of papers focused on the quality of rural life is growing, which also brings papers oriented to specific population groups, e.g., the elderly [11]. In 2018, an issue of The European Countryside magazine was published, which focused on the quality of urban life [12]. Sánchez-Sellero et al. [13] suggest replacing the one-value measurement of QOL with a two-value measurement, thus reflecting the QOL in a country’s urban and rural parts. In response to the necessity to address rural challenges, the OECD [14] came up with a new “Wellbeing Policy Framework,” in which the economic approach to countryside was extended to include the environmental and social dimensions of wellbeing within rural populations. Rural development is planned in its connection to cities.
Okulicz-Kozaryn [7], of the US, pointed out the higher QOL in villages, than in cities. Requena [15], based on data from the European Social Survey 2012, argues that in European countries there is a higher QOL in villages than in cities, but this only applies to richer countries. It is positive that, despite the above, QOL research is ongoing even in least developed countries [16,17,18], enriching the epistemology of QOL with a non-Western perspective. Bernard [19] observes the increased attention paid to the countryside after the divergent electoral outcomes in the USA, France, and the UK in urban and rural, often marginalized, parts of these countries became apparent. The impact of QOL on presidential outcomes in Czechia is explored by Murgaš [20,21]. Refs. [14,22,23,24] address the terminological issues of countryside and villages.
It can be concluded that rural development has lagged behind urban development, to which researchers and policymakers have responded. Sánchez-Sellero et al. [13] suggest replacing the one-value measurement of QOL with a two-value measurement, thus reflecting the QOL in a country’s urban and rural parts. In response to the necessity to address rural challenges, OECD [25] comes up with a new “Wellbeing Policy Framework,” in which the economic approach to countryside is extended to include the environmental and social dimensions of wellbeing of rural populations. Rural development is planned in its connection to cities.

1.1.2. Objectives and Hypothesis

The paper has two objectives. The first objective is to find out whether the quality of urban life, or the quality of rural life, is higher. We will reach our conclusion by measuring the QOL of the participants involved in our research, according to their place of residence. It is not just an academic question, finding that in the Czech Republic the quality of urban life is higher than the quality of rural life, or on the contrary, that it will contribute to providing valid insights for public policy.
The second objective is to identify the predictors of QOL from selected variables, and to find out their correlation or difference in the residents of cities and villages. The variables in our paper include happiness, quality of place, and quality of environment. The identification of QOL predictors is not only important for the development of its epistemology, but also as a basis for public policy. We consider a predictor to be a variable that correlates with QOL at a correlation coefficient level of 0.30 or more. Predictors of QOL are explored by Murgaš, Petrovič, and Tirpáková [26].

2. Materials and Methods

In the paper we have two objectives. The first is to find out whether the quality of urban life, or quality of rural life, is higher. We will do this in gradual steps—by analyzing the relevant literature related to cities and villages on the one hand, and the quality of urban and rural life, on the other hand. We will present selected measures of the quality of urban and rural life. In the paper we focus on Czechia, we measure the QOL within it on a 0–10 scale, using questionnaires on social networks. This constitutes the second step. The measurements (N = 250) were taken by university students at bachelor, masters, and doctoral level in the period from December 2021 to February 2022, i.e., during the wave of the COVID-19 pandemic, called Omicron (Appendix A).
The second objective is to identify the predictors of QOL and to find out their correlation, or difference, in the residents of cities and villages. We consider a predictor to be a variable that correlates with QOL at a correlation coefficient level of 0.30 or more. The variables in our paper include happiness, quality of place, and quality of environment. Predictors of QOL are not only important for the development of its epistemology but also as a basis for public policy. The third step consists of the analysis of the findings.
Based on data pointed out by Murgaš, Klobučník [27], and Bernard [19] we pronounce hypothesis H: in Czechia the QOL in rural settlements will be lower than the QOL in cities. The data in our paper take the form of numbers on a scale of 0–10 as reported by survey participants. They are a subjective indicator. Two sets of data are key for us. The first is data on the quality of urban and rural life. The second group is data on declared happiness, satisfaction with the quality of place, and satisfaction with the quality of environment, in the breakdown by residence in either the city or the countryside.

2.1. Cities and Urban Life

Czechia inhabitants live in 608 cities and 5651 villages; the official designation of both types of settlements is “municipality“, in Czech “obec”. According to the Czech Act on Municipalities No. 128/2000 “a municipality is a basic territorial self-governing community of citizens”. A municipality with a population of at least 3000 residents is a town if the President of the Chamber of Deputies of the Parliament of the Czech Republic so determines, after the Government has expressed its opinion [28]. In the paper, a municipality with a population of 5000 or more is considered a city.
Since the beginning of human history, cities have been the carriers of creativity, inventiveness, and human development in all its forms—from spiritual, social, economic, and technical to artistic. Unlike in the past, when their distinction from villages was clear, today it is not. One of the most commonly used criteria for determining whether a village is still a village, or already a city, is the number of residents. However, according to Dijkstra et al. [29], this criterion varies not only between continents (Argentina 2000, Japan 50,000 inhabitants) but also within continents (Denmark 200, Czechia 5000—India 5000, China 100,000 inhabitants). The European Social Survey does not solve the village-city problem by quantification but by self-definition—a village is a settlement that has been identified as a village or a city by a survey participant [30]. Theoretical issues regarding cities and villages, defining cities, development and processes influencing contemporary post-industrial cities, is explored by Petrovič, Murgaš [5].
In terms of development, cities are broadly divided into pre-industrial, industrial, and post-industrial. Today’s cities became post-industrial when industrial society changed to post-industrial society after World War II, first in the USA and then in other Western countries. The criterion for change was a change in employment—employment in services exceeded that in industry. From a process perspective, Van den Berg et al. [9] divided urban development into four stages: urbanization, suburbanization, deurbanization, and reurbanization.
According to the UN [6], 55% of the world’s population lives in cities, the least with 32% in “least developed countries”, the most with 79% in “more developed countries”. The only European country with a city population of less than 50% is Moldova, with 43%. Cities now play a key role in global development, accounting on the one hand for more than 80% of world GDP, but on the other hand for 70% of greenhouse gas emissions [18].
The urban population is growing globally, but urbanization is highly differentiated. In developed countries with complex processes of suburbanization, reurbanization, deurbanization, urban sprawl, and shrinking cities, the population is growing slowly and even declining in some size categories. The attention of researchers, urban planners and local politicians is focused on improving the QOL in them. It can be concluded that the growth in quantity, i.e., the number of city residents, has stopped and turned into quality improvement, i.e., the transformation of cities into pleasant places to live.
The rapid growth of urbanization in the world began in the second half of the 20th century. In 1960, a total of 1.019 billion people lived in cities, representing 33.6% of humanity. The number of people living in cities reached 2 billion in 1986, representing 41.5% of humanity. Three billion people lived in cities in 1993, and 4 billion in 2016. In 2020, 4.2 billion people lived in cities. The largest cities in developing countries accounted for a crucial share of urbanization growth [31]. Population growth in 2022, compared to 2021, was highest in Kinshasa (Democratic Republic of Congo), up 4.39%; Lagos (Nigeria), up 3.54%; and Dhaka (Bangladesh), up 3.39% [6]. Encouragingly, the number of people living in slums is declining. Of the world’s urban population, 39.6% lived in slums in 2000, 35.5% in 2005, 33.2% in 2010 and 29.2% in 2018 [31]. Despite these positive developments, it is true that the growth of urbanization in developing countries has not yet stopped; in other words, the increasing quantity does not allow to deal with the improvement of the QOL of all the inhabitants of these countries. It is positive that, despite the above, research on QOL is also ongoing in Least Developed Countries [16,17,18], enriching the epistemology of QOL with a non-Western perspective.
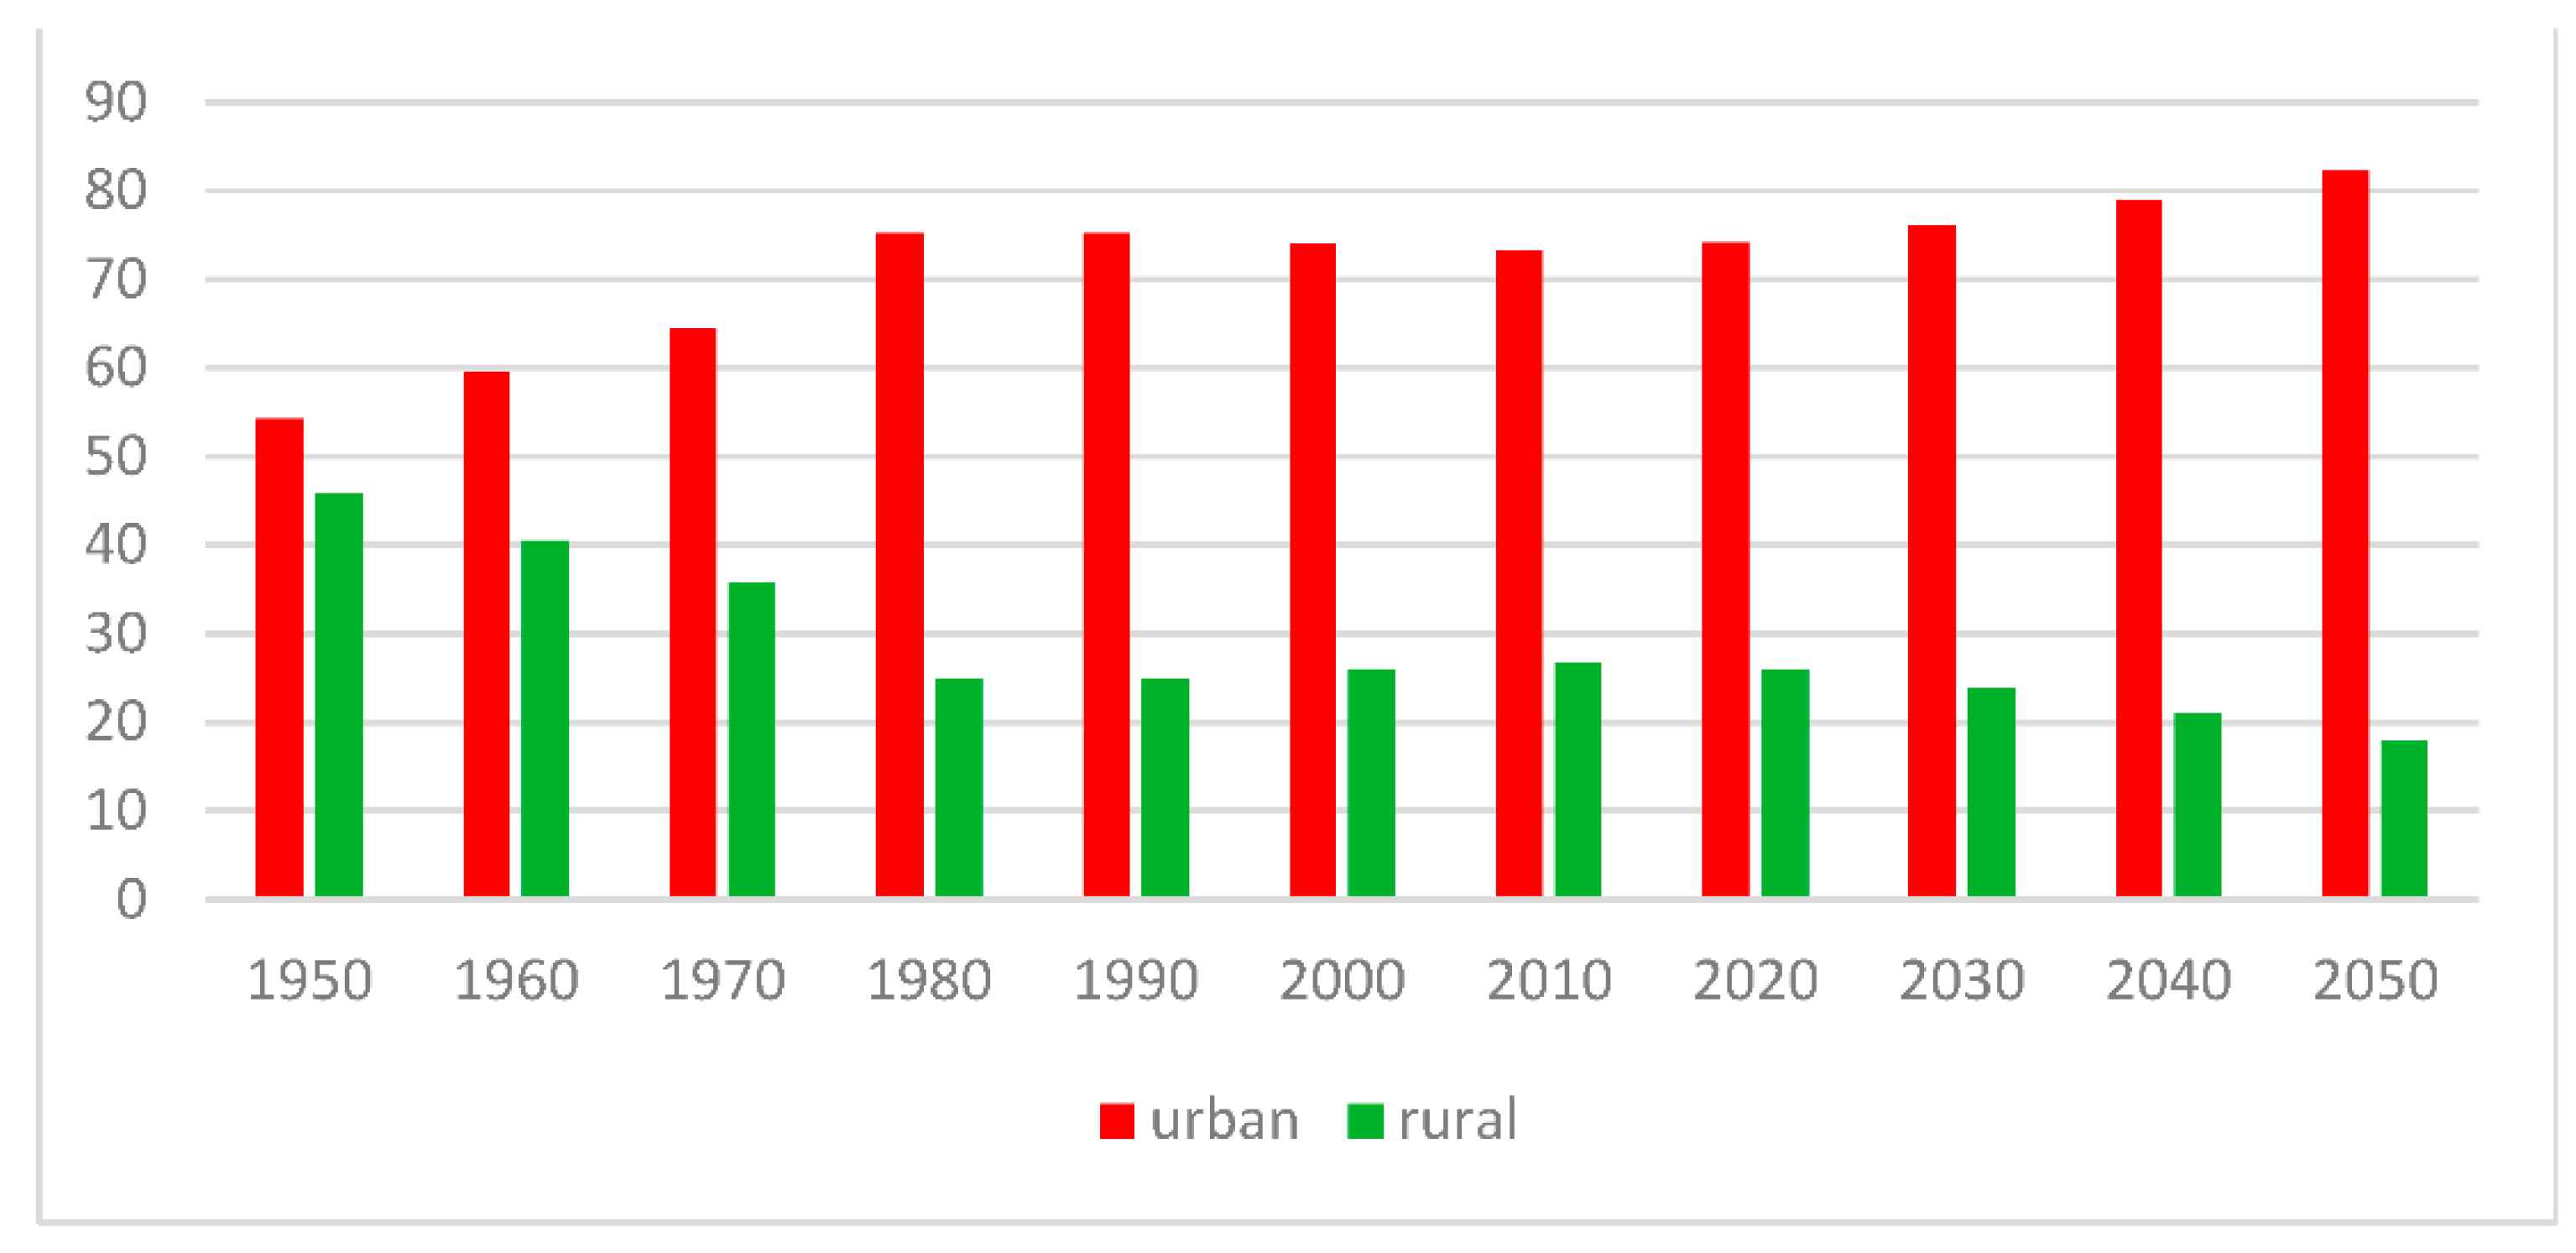
The number of people living in cities accounts for 75% in Europe and 69% in Czechia [32]. The expected future development of urbanization is highly differentiated; Okulicz-Kozaryn [7] projects an urbanization rate of more than 80% in Europe in 2050, while UN [6] projects an urbanization rate of 82% in Czechia for 2050 (Figure 1). Alderton et al. [8] project the fastest urbanization growth in low-to-middle-income countries.
In examining the quality of urban life, it is essential to start by defining the city, but this is not easy. In the past, cities were surrounded by walls and the position of “intra muros” and “extra muros” (Latin for “inside the walls” and “behind the walls”) clearly distinguished the city from the countryside. Contemporary cities are characterized by large numbers of people commuting daily to cities, or students commuting to schools for long periods of time. At the same time, the residents of villages in the territory of big cities live the same way of life as urban residents. The agricultural function of villages, which was dominant in the past, is now marginal.
Petrovič, Murgaš [5] define city as follows: “The present city is a complex system of social, economic, and environmental ties of people living usually in large numbers (The term “usually in large numbers” means that the criterion of 100,000 s of residents does not always apply, e.g. in the case of Denmark.) and permanently in one place”. The definition refers to “social” life in the city. Without the criterion of a large population, it would also be the definition of a village. In terms of the epistemology of quality of life, it expresses a measure of satisfaction with urban life. However, the complexity of urban life requires it to be complemented by the existing technical and environmental infrastructure that enables social life. Infrastructure, together with population, is what distinguishes a city from a village. In terms of the epistemology of quality of life, the infrastructure of the city constitutes the quality of place.
In Czechia in 1950 (Czechia was part of Czechoslovakia between 1918 and 1992.) the majority of the population already lived in cities, the figure of 54% was the highest among the countries of Central and Eastern Europe. Between 1950 and 2018, urbanization grew steadily, with significant growth until 1980, before slowing down. According to UN [17], 74% of the Czech population lived in urban areas in 2018, the same as the European average. The largest city is Prague, which in 2021 had 1.3 million residents, with the second most populous city being Brno, with 380,000 residents. Overall, there are six cities (including Prague and Brno) with more than 100,000 residents according to CZSOs [33].
Since 2010, the rate of urbanization in Czechia has been stagnating, as has the rate of urbanization in the six largest cities over 100,000 residents. The complexity of urbanization development in Czechia can be illustrated using the example of the city of Ostrava, the third most populous city in the country, with 285,000 residents. This important industrial center had 184,000 residents in 1950. By 1970, the population had grown by more than 50% to 278,000. Ostrava had the highest population in 1991 at 327,000. Economic reforms in the centers of mining and heavy industry brought mass unemployment, which caused the population to decline; between 1990 and 2005 there was a decline of 8% [34], the most of any regional city. Both major demographic components, natural and out-migration, contributed to the decline. In 2012, the population dropped below 300,000, and the decline continues to the present day [33].
In all regions, the urbanization rate is higher than 50%: the lowest is in the Central Bohemian Region in the territory of Prague, with 52%; the highest with 82% in the Karlovy Vary Region [32]. According to Kašparová, Půček [35], the size structure of Czech cities is similar to that of the surrounding countries of Central and Eastern Europe. It is characterized by a capital city with a population above 1 million and few cities above 100,000, referred to as “big cities”. The rate of “big city urbanization” is 21% in the Czech Republic: the lowest in Europe is Portugal (9%); the highest in Cyprus (52%).

2.2. Villages, Rural Life

Svobodová et al. [10] estimate the number of all rural settlements in Czechia, i.e., hamlets, remote villages, hill settlements and villages, to be 40,000. This means that a distinctive feature of the settlement structure in this country is its fragmentation.
The number of papers focused on the quality of rural life is increasing. This also brings papers oriented on specific groups of the population, e.g., the elderly [11]. In 2018, an issue of the journal European Countryside, focusing on the quality of urban life, was published [12]. Some papers are focused on comparing urban and rural QOL [19].
We believe that, despite the legitimate attention given to the issue of cities and the QOL in them, it makes sense to also focus on rural settlements and the QOL in them. Our belief is based on the following two facts:
(i)
A significant number of residents still live in the villages;
(ii)
Villages are closely linked to the countryside, which makes up a substantial part of the land area of each country.
For centuries, rural settlements have fulfilled their main function of providing enough food for their residents, and urban residents. The Industrial Revolution has also had an impact on agriculture, resulting in an increase in food production. The number of people employed in agriculture declined steadily after the World War II, and in recent decades the number of people in villages keeping animals, and growing agricultural products for their own consumption, has also fallen significantly. People living in rural settlements in Central and Eastern Europe commute to cities for work, as in the past, but the way of life in cities has changed considerably. Villagers live an urban lifestyle, a statement that is even more true the more equipped a village is, when it is located in a developed region, and when it is close to a regional center. The characteristics of the type of villages described also include a higher number of university-educated residents.
As with cities, rural settlements in least developed countries differ significantly from rural settlements in more developed countries. In Western countries, villages differ significantly even within a single country. There is a big difference between a village with a growing population near a regional city, to which city residents are moving, and a depopulating village on the periphery, with no employment opportunities, and where both shops and pubs have ceased to exist. If such a village is lucky enough to be in a tourist attraction area, the empty houses are bought by well-off city residents for recreational purposes. Countryside residents regard poor access to well-paid jobs and a rich social life as the main drawbacks of living in the countryside. Urban residents consider good access to nature as the main positive of living in the countryside [12].
The big issue of the urban-rural dichotomy is its typology. The OECD [14] has changed its approach in view of the large differences in the population criterion necessary for classifying a municipality as urban. It proposed a population density criterion of 150 inhabitants per km2. It divided the regions into three categories:
(i)
Predominantly Urban, if the share of population living in rural municipalities is below 15%;
(ii)
Intermediate, if the share of population living in municipalities is between 15% and 50%;
(iii)
Predominantly Rural, if the share of population living in municipalities is higher than 50%.
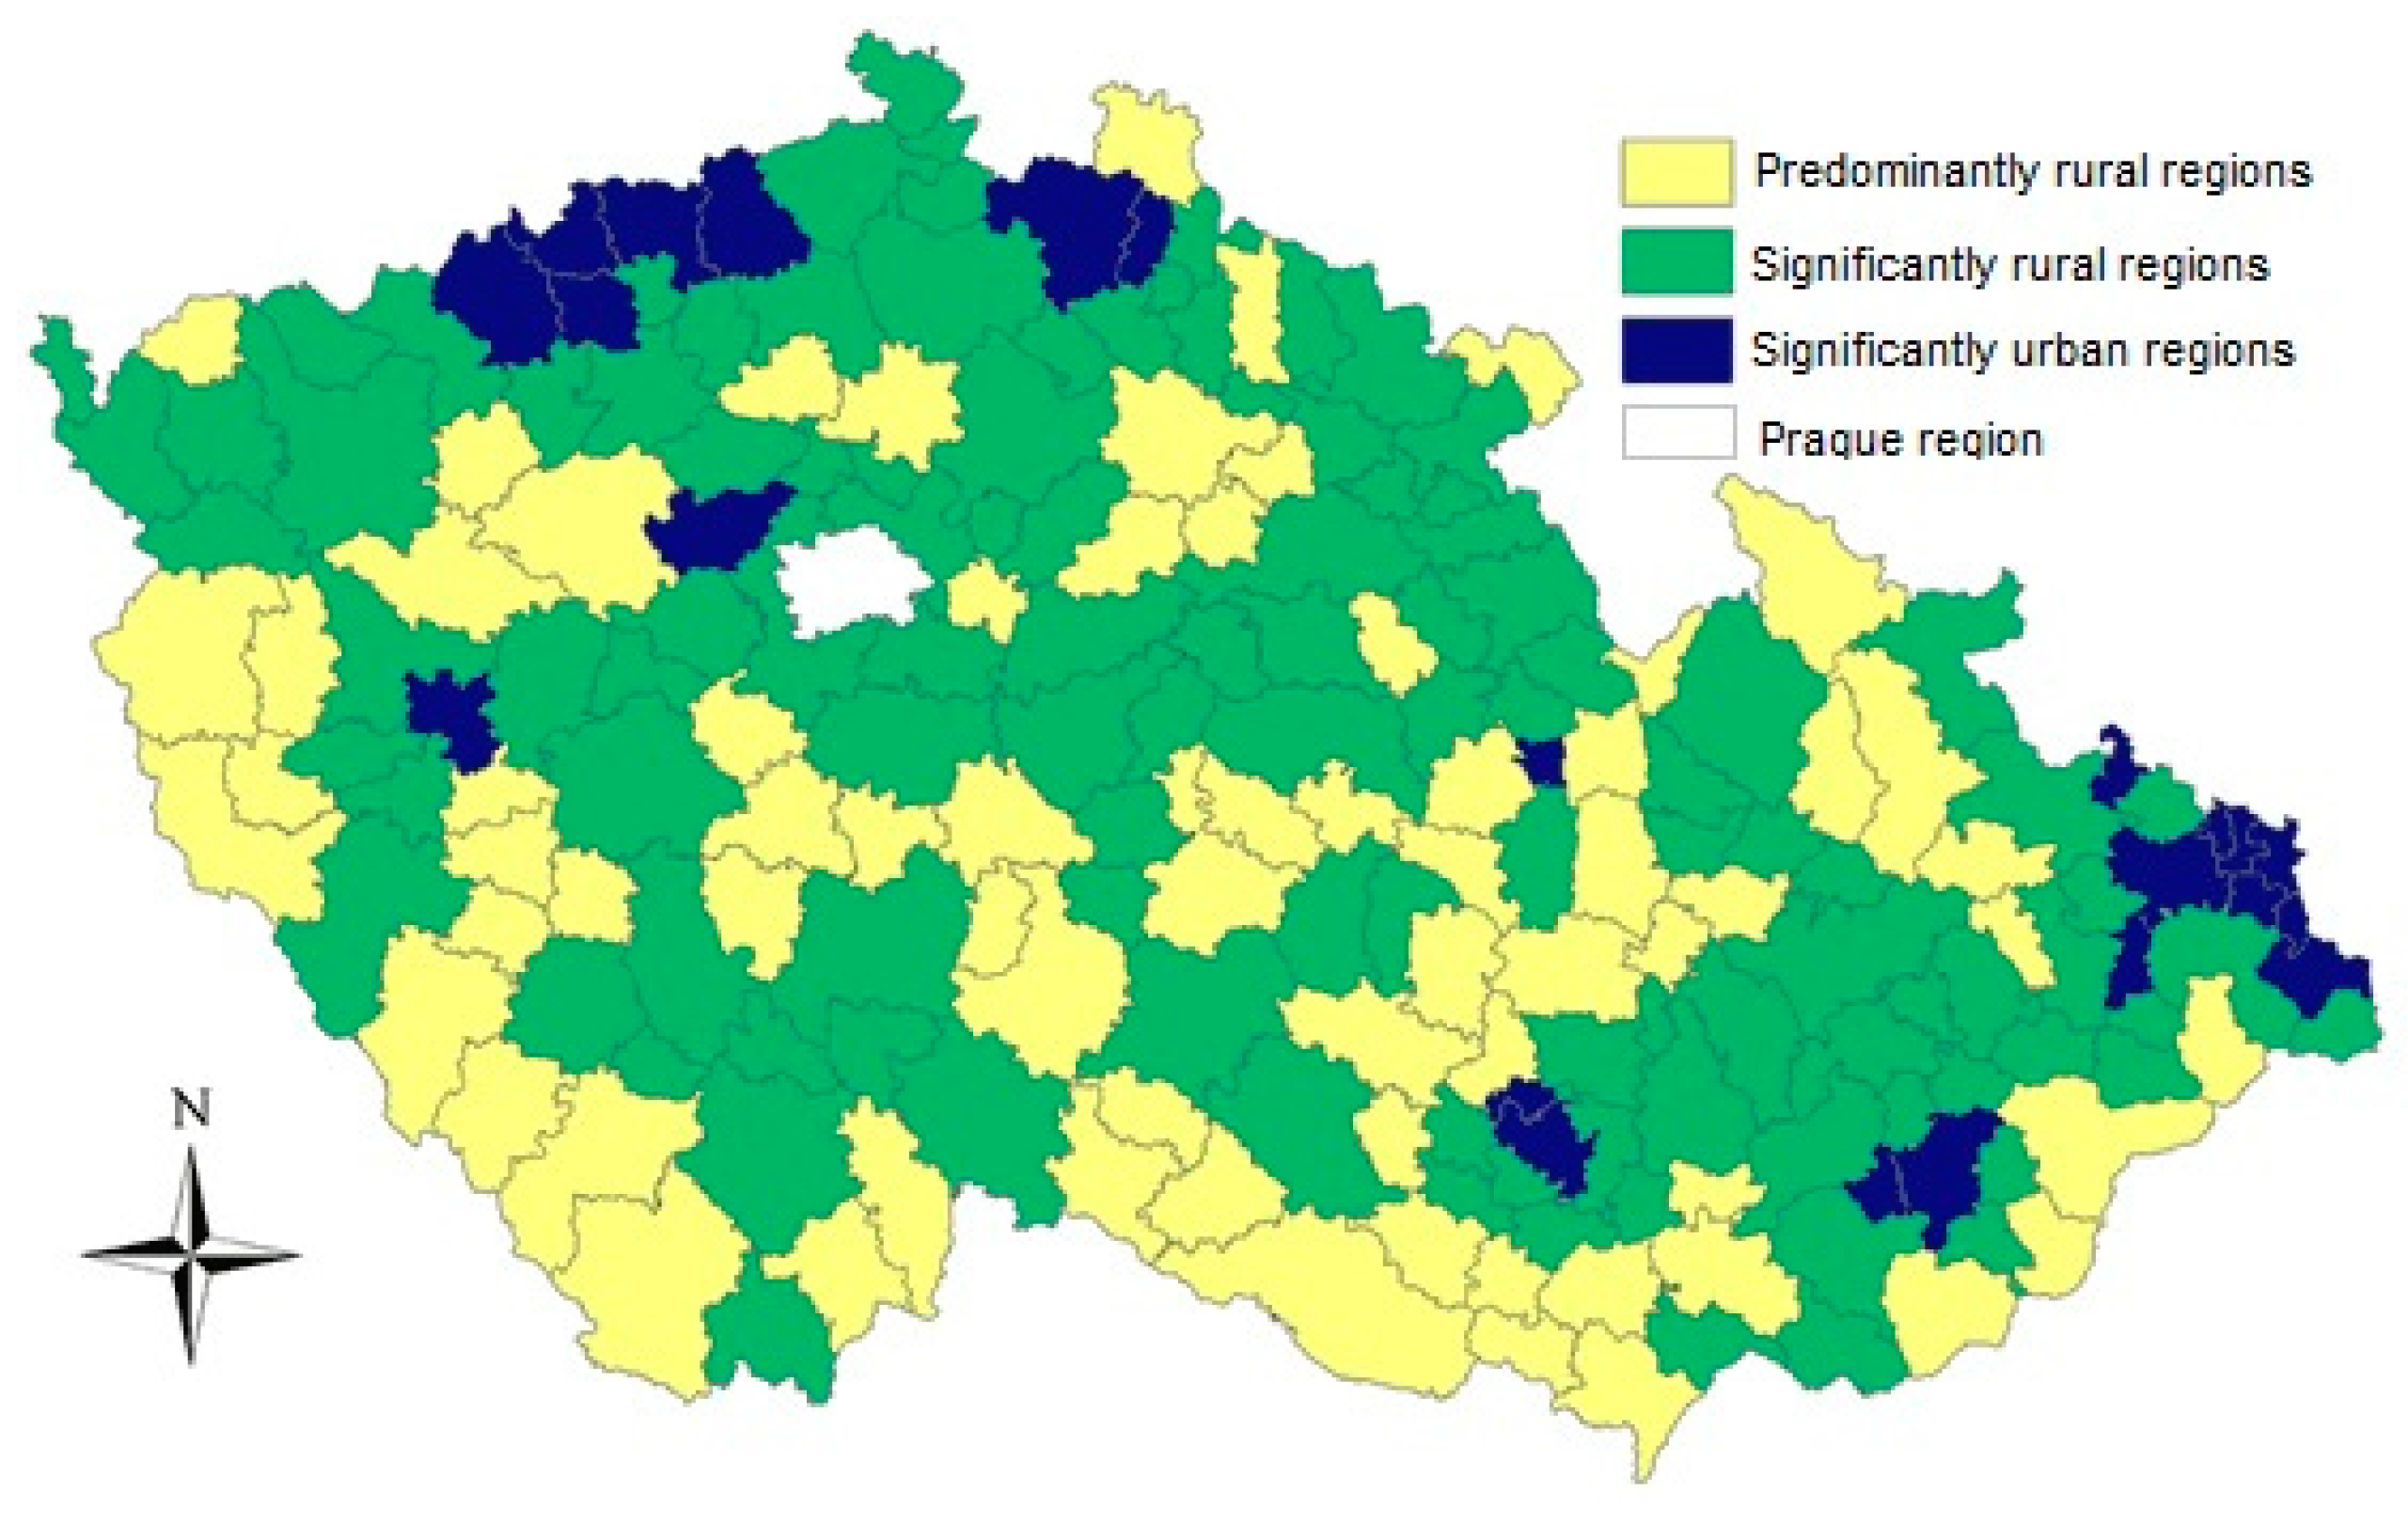
Perlin [36] applied the OECD [37] methodology and used a density criterion of 150 inhabitants per km2 and divided (Figure 2) Czechia into rural and urban regions. It is clear that the rural regions dominate in absolute numbers. Figure 2 highlights the need for increased attention to rural regions and the QOL in them. The OECD [14] categorization has been adopted by Eurostat [38].
The countryside has been undergoing serious structural problems in recent decades, requiring the attention of local residents, political authorities from local to national and European level, and last but not least, from researchers. In response to this observation, the Czech Minister of Agriculture has identified improving the quality of rural life as a key objective of agricultural reform [29]. Efforts are being made to link “bottom-up” activities in the form of support for the emergence of local initiatives and training of local leaders. In 1993, the non-profit Association for Rural Renewal was established, its mission being: to contribute to the renewal and deepening of social and spiritual life in the countryside; to strengthen rural prosperity; and to motivate citizens to volunteer for the benefit of the community. The most well-known activity of the Association is the competition “Village of the Year”. The “top-down” activity included the establishment of non-profit “Local Action Group” (in Czech—Místní akční skupina) as a community of both public and private sector. The aim of the Local Action Group is to “participate in rural renewal and development in order to improve the QOL in the countryside” [39].

2.3. Quality of Life

QOL is one of the concepts with which contemporary late modern society wants to grasp and express the socio-economic complexity of the period in which we live.

2.3.1. Quality of Urban and Rural Life in Czechia

As mentioned earlier, in the paper we ask the question which is higher in Czechia: the quality of urban life, or the quality of rural life? Both categories reflect the quality of place, i.e., the spatial, objective dimension of the quality of life. QOL can be examined on two levels. The first is the level of its epistemology, or conceptualization. The second is the level of application, primarily in the form of its measurement and the creation of knowledge applicable to public policy. In the paper, we are concerned with the application level; the QOL we measure. However, we believe that if we are to obtain valid results, it is necessary to define QOL and briefly outline its concept. This is examined by Parmenter [40], Phillips [41], and from a geographical perspective by Murgaš [25].
QOL is holistic [42,43], and such an understanding requires dealing with both its dimensions. However, this approach is unique; if it is used it is usually in the form of an analysis of objective domains and one subjective domain, which is wellbeing. The British humanitarian organization, Oxfam, used seven domains: (i) Food security, sustainable livelihoods; (ii) Empowerment; (iii) Social and political participation; (iv) Resilience; (v) Education; (vi) Health; (vii) Wellbeing [44].
The first of the two dimensions of QOL is the subjective dimension, usually identified with wellbeing. The second is the objective dimension, identified with quality of place. This implies an understanding of QOL as an assessment of satisfaction with life in a particular place. In other words, an expression of how good life is according to our idea of how good life should be, and at the same time, how good the place where we experience our everyday life is, according to our idea of what a good place should be. From this we derive a definition: QOL is the evaluation of a good life lived in a good place. There are many definitions of quality of life, as authors’ approaches to it vary across the sciences. Examples of definitions of QOL are given by Post [45] and Murgaš [25]. Some authors [46,47], identify QOL with wellbeing. Skevington, Boehnke [48] reject this with the following: “QOL and subjective wellbeing are not interchangeable terms”.
Given the focus of our paper, we are interested in defining quality of urban life and quality of rural life. Nuvolati [49] pointed out: “quality of urban life regards the living conditions in urban areas and mainly in the cities”. According to Petrovič, Murgaš [5] “quality of urban life is an expression of satisfaction with life lived in the city”. Quality of rural life can be analogically defined as “an expression of satisfaction with life lived in the village”.
The terminology in relation to countryside and villages is not settled; the terms “rural areas” [21,22], OECD [14], and “countryside” are used [12,23]. Given the established term “quality of urban life”, in the paper we use the term “quality of rural life”. We consider other terms—QOL in rural areas, QOL in countryside or QOL in villages—as synonyms. In the paper we use the term “countryside” to refer to rural landscapes, i.e., villages with territory within their limits and territory outside their limits; the term “municipality” to refer to both urban and rural settlements; the term “city” to refer to urban settlements; and the term “village” to refer to rural settlements. We consider the terminological issues to be important, as they are a precondition for the successful development of an epistemology of quality of life. Unless the current terminological chaos [27] is reduced, considering QOL as a science [50] will be more a wish, than a reality.

2.3.2. QOL in Czech Municipalities

The quality of urban and rural life in Czechia was examined by Pospěch et al. [30], using data from the European Social Survey 2004. The following were measured: relations with family and friends; emotional wellbeing; material wellbeing; health; work and productive activity; feeling part of one’s local community; and personal safety. As a result, lower values of objective indicators of rural life, such as income, employment, and educational structure in villages, compared to cities, were found. Nevertheless, the value of subjective indicators in the form of QOL and happiness is the same for both categories of settlements. The authors have looked for explanations of “the rural happiness factor” in factors of: social capital; relationships and community; personal security; health; and Castells “network society”. However, we have not found convincing evidence. The authors see a possible explanation for the equal values of QOL and happiness in villages and in cities in the lower values of objective indicators in axiology. This supports the following statement: “the issue of QOL is the issue of values” [27].
A basic picture of the QOL in 6259 Czech municipalities is provided by the study by Murgaš, Klobučník [27]. By measuring nine indicators, the authors constructed a QOL index, which they called gold standard quality of life. According to their measurement (Table 1, Table 2 and Table 3), the quality of urban life is higher than the quality of rural life, which is differentiated according to the size of the village. In larger villages above 2000 residents, the QOL is higher compared to smaller villages. In Czech cities the quality of urban life is the same, the differences are at the level of statistical error. The six largest cities, which are cities with more than 100,000 inhabitants, differ from the previous statement; the quality of urban life of their residents is noticeably higher. The average value of the quality of urban life in this size group of Czech cities is the result of high values in the two largest cities—Prague and Brno, and a very low value in Ostrava. The limited possibilities of our research do not allow us to examine the quality of urban life in individual city size types, so we examine it “as a whole”.
Measuring the QOL values in all Czech municipalities allowed Murgaš, Klobučník [27] to list the municipalities with the highest values of the index (Table 3) and the municipalities with the lowest values in Table 4.
The measurement of QOL in rural areas of Czechia has been addressed by Bernard [19], operationalizing QOL in the form of indices of poverty, satisfaction, and opportunity. He divided Czechia into urban regions and three types of rural regions: regions with low levels of rural peripherality; regions with average levels of rural peripherality; and regions with high levels of rural peripherality. The author pointed out the following findings: (i) QOL is not related to community size; (ii) Deprivation of opportunities in rural areas is not accompanied by a decrease in satisfaction with place; (iii) In most indicators, urban-rural differences are smaller than rural-rural differences.
In 2018, the Aspen Institute Central Europe in Prague organized a survey on QOL in Czech municipalities with more than 999 inhabitants, using a sample of 1000 respondents. It used 29 indicators, in addition to commonly used ones such as unemployment or emissions, and less frequently used indicators such as foreclosures, distance to a district town, lack of access to kindergartens, or lack of fast internet. The results are presented in Table 5 and Table 6. The values achieved range from 0 to 100. The two extreme values were assigned to the municipality in first and last place, respectively. There is no measurement of life satisfaction, so this is a measurement of quality of place.
In 2021, the company Municipalities in Data (Obce v datech) published the results of measurement of the QOL in 205 Czech municipalities with extended jurisdiction that are cities, and Prague, i.e., in 206 cities (Table 7 and Table 8). The QOL Index has three domains: (i) Health and Environment; (ii) Material Security and Education; (iii) Relationships and Services. Twenty-nine indicators were used, including health, access to health care, employment, life expectancy, housing, education, services, and number of local associations. There is no measurement of life satisfaction, so this is a measurement of quality of place.
The calculation of the index is based on the principle of distribution of index values on a scale of 0–10. The city in first place is arbitrarily assigned a value of 10, the city in last place is arbitrarily assigned a value of 0. The values of the other cities are relative values to the value of the city in first place [53].
Table 7 shows the cities with the highest QOL Index values in 2018–2021. The first nine of the 10 cities are small cities in the Prague agglomeration, the two largest cities in Czechia of Prague and Brno, and settlements in the territory of Brno. This means that the two largest cities form clusters of the quality of urban life in Czechia. Five of the 10 cities have less than 10,000 residents; Židlochovice even less than 4000 inhabitants. The first and second waves of the pandemic in 2020 and 2021 did not affect the ranking of cities with the highest quality of urban life. Table 8 shows the cities with the lowest values of the QOL Index in 2018–2021. It differs from Table 7 in structure—the cities are larger compared to the cities in Table 7, they do not include any regional cities, and therefore no clusters of low quality of urban life have emerged. The cities with the lowest QOL Index values did not experience the first and second waves of the pandemic either.
The aforementioned works of researchers [11,27,30,54,55,56,57,58,59], as well as other organizations—Aspen Institute [57], and Municipalities in the Data [50] cannot be easily compared because the urban-rural dichotomy of the QOL in Czechia was investigated by different methodologies, and different subjects formed the units of research. Nevertheless, we present them because the findings that link them are meaningful:
(i)
The QOL in a Czech municipality is not a function of the size of the municipality; the lowest and highest QOL values are achieved by small settlements;
(ii)
The QOL in a Czech municipality is related to its geographical location.

3. Results

There are two groups of QOL measurements, according to the subjectivity/objectivity of the indicators used. The groups have several alternatives. In the first group, QOL is measured by subjective indicator(s). It is understood “as a whole” and therefore measured by a single number, usually on a Cantril scale of 0–10. Examples include measurements in which data referred to as soft are collected by interview method, either face-to-face, using social networking or a combination of both. This QOL is referred to by some researchers as “wellbeing”. The second alternative is QOL understood as a set of independently measured domains, or indicators [60], reflecting the quality of health, sexual life, family life, community life, material security, work life, leisure life, spiritual life, and environmental life, etc. A third alternative is a subjective assessment of satisfaction with a QOL indicator. The difference between the second and third alternatives can be explained with the example of “environment” indicator. In the second alternative, the environment can be expressed in terms of CO2 emissions, amount of green space per capita or km2, and water pollution, etc. In the third alternative, the environment is measured as subjective satisfaction with it as a whole.
In the second group, QOL is measured by objective indicators from statistical data. The understanding of QOL and its measurement is at the discretion of the researcher who measures quality of life, and this decision is strongly determined by the availability of statistical data.
In the paper, we use the indicator of the first group in the combination of the first and third alternatives. In Table 9, we state descriptive statistics for the QOL indicator.
Quality of urban life as well as quality of rural life are measured by a subjective indicator on a scale of 0–10, the measured values are in Table 10.
Table 10 shows that the measured mean values of the QOL and other variables are higher in cities than in villages; therefore, our hypothesis is confirmed. We obtain more detailed data when we split the urban-rural dichotomy into males and females. The quality of urban life and other variables are always higher for men. For women, the situation is different: the QOL is the same in cities as in villages; the quality of place and the quality of environment is higher in villages. Only happiness is equally greater in cities than in villages for men.
QOL and happiness have a subjective dimension, they can be summed up into one value and labelled as “psychological matter”. On the other hand, quality of place and quality of environment have an objective dimension; we can sum them up into one value and denote them as “geographical matter”. The values of both, in villages and cities, are expressed in Table 11.
Table 11 shows that the psychological matter (subjective dimension) in cities reaches significantly higher values than in villages. Geographical matter (objective dimension) in cities is also higher than in villages, but the difference is not large. In absolute numbers, geographical matter is rated higher than psychological matter.

Correlations

The second objective of our paper is to identify predictors of QOL and to find out their correlation, or difference, in the residents of cities and villages. We draw on Vaus [61] for the verbal assessment of the correlations, and present the verbal assessment of the predictors in Table 12. A predictor is a variable, the correlation coefficient of which is at least 0.30, i.e., a “medium” correlation.
Table 13 shows the correlation coefficients of the average values of the QOL, and the other variables that we identified by measurement.
The correlations of the average values of QOL, and other variables, are in Table 13. The correlation between QOL and happiness is very large; happiness is a very strong predictor of quality of life. The correlation of QOL and quality of place is medium; quality of place is a predictor of quality of life.
Examining correlations separately in villages (Table 14), and cities (Table 15), is more informative than correlations of averages.
The correlations between QOL and other variables at the village and city level yield very similar findings to the correlations of averages; happiness is very strong and the only predictor of quality of life.
The most detailed insights into the urban-rural dichotomy are provided by the correlations on the one hand for men in villages (Table 16), and women in villages (Table 17), and on the other hand for men in cities (Table 18), and women in cities (Table 19).
Table 16, Table 17, Table 18 and Table 19 show that happiness is a predictor of QOL according to our measure, and a very strong predictor in all categories. In addition, environmental quality is a strong predictor of QOL for men living in cities, and quality of place for women living in cities
We derive the following findings from measurements:
-
On average, the quality of urban life is higher than the quality of rural life;
-
For men, the value of QOL and other variables is higher in cities than in villages;
-
The difference between them is significant, and in the case of QOL, unusually large. The value of rural life for males is the lowest among all measured values;
-
For women, the value of urban and rural QOL is the same; for the happiness variable, it is higher in cities than in villages. For the quality of place and quality of environment variables, the value is higher in villages than in cities;
-
The differences in the values of men and women call into question the indication of the QOL values by a single number, meaning the average of the values of men and women;
-
Our research on urban-rural dichotomy yielded two “by products”. The first is the finding that, with one exception, women’s measured values are higher than men’s measured values. That exception is the quality of city life, which women report lower than men. The second is the finding that the association of quality of place and quality of environment, forming the objective dimension of quality of life, which we named “geographical matter” was rated higher by respondents than the association of QOL and happiness, forming the subjective dimension of quality of life, which we named “psychological matter”.

4. Discussion

Our paper is focused on the question of whether the QOL is higher in cities or villages. We do not consider this question to be academic; the answer to it provides a valid basis for public policy decision making. Vaishar et al. [12], state: “The migration for jobs tends to be substituted with the migration for quality of life”.
After the publication of The Stiglitz Report [62], QOL has been brought to the attention of politicians and international institutions such as the EU, or the OECD, on the one hand. Many governments have adopted development documents in which QOL is represented. In 2022, the government of the Czech Republic adopted the document “Czech Republic 2030” as a document that sets the direction of our country’s development for the next decade. Its fulfilment will improve the QOL in all regions, and direct the Czech Republic towards development [62]. Quality of life, on the other hand, is part of the public debates and programmes by which politicians seek to win the favor of the electorate.
We had two objectives, the first was to find out whether the quality of urban life or the quality of rural life was higher. By measuring it, we found that the average quality of urban life is higher than the average quality of rural life. Thus, our hypothesis was confirmed. We will increase the predictive value of this claim when we examine it at a more detailed level. In the male-female breakdown, the quality of urban life is higher than the quality of rural life, but for women it is not distinct. The breakdown of QOL and other variables into psychological matter and geographical matter, implies that the values of urban life are higher than the values of rural life.
The second objective was to identify predictors of QOL and to find out their correspondence, or differences, in urban and rural residents. All measured correlations showed that happiness is a very strong predictor of quality of life; environment is a strong predictor for men living in cities, and quality of place is a strong predictor for women living in cities.
The purpose of investigating QOL is, on the one hand, to develop the epistemology of the concept and, on the other hand, to provide a valid basis for public policy. In terms of epistemology, our paper provides the insight that the quality of urban life is higher than that of rural life, which is valid when working with averages. A more detailed breakdown into men and women provides different data for each gender. As we have already mentioned, Sánchez-Sellero et al. [13] propose to replace the measurement of QOL by one value with a measurement of two values, reflecting the QOL in urban and rural parts of countries. Our findings support this proposal. Based on the findings of our paper, we propose that QOL and other variables should be measured not only by measures divided into urban and rural, but also separately for men and for women. We believe that these proposals will increase the validity of the evidence base for public policy decision making.

5. Conclusions

Our paper is focused on the urban-rural dichotomy of QOL in Czechia. It has two objectives, namely, to find out whether the quality of urban life or the quality of rural life is higher. We measure both of them on a 0–10 scale using questionnaires on social networks in the regions of north-eastern Czechia.
The measurements (N = 250) involved university students of bachelor, masters and doctoral degree in the months from December 2021 to February 2022, i.e., during the wave of the COVID-19 pandemic, called Omicron. Our second objective is to identify predictors of QOL from the variables of happiness, quality of place and quality of environment, and to find their differentiation among residents of cities and villages. We consider a predictor as a variable that correlates with QOL at a correlation coefficient level of 0.30 or more. We pronounce hypothesis H: the QOL in cities will be higher than the QOL in rural settlements.
We computed the average value of urban and rural life and divided it into men and women. As a result, we found that the average QOL is higher in cities than in villages, and the quality divided into men and women is more differentiated. We further computed the average correlation coefficients of QOL and variables: correlations in villages, men and women together; and in cities, men and women together; as well as men in villages; men in cities; women in villages; and women in cities. As a result, we find that happiness is a very strong predictor of quality of life.
The measurements yielded two “by products”, in addition to confirming the hypothesis of a higher quality of urban life compared to the quality of rural life. The first is the different values of women’s and men’s quality of life, except for women’s quality of city life, which is lower; in other cases, women’s quality of urban life is higher than men’s quality of urban life. The second “by product” is the finding that the objective dimension of quality of life, which we named “geographical matter”, was rated higher by both men and women than the subjective dimension of quality of life, which we named “psychological matter”.
Limitations have emerged in research of urban-rural dichotomy of quality of life. It is natural that the spatial focus only on two of the 14 regions and the age limit only on students, i.e., age group from 18 to 30 years, will bring only results that can be considered as an entry into the study of urban-rural dichotomy of quality of life. The research needs to be conducted repeatedly across the country, and at all ages. The authors are aware of this and, therefore, consider their findings only as an input to the study of the urban-rural dichotomy of QOL.
Future research of urban-rural dichotomy in the Czech Republic should be focused on the whole country and all age categories, and should be repeated. In 2017, the Czech government adopted the document “Strategic Framewoiderk Czech Republic 2030” with 27 strategic objectives. Objective No 17 is “Growth in the QOL in individual municipalities”, where QOL is an index with 11 indicators (Government of the Czech Republic [63]). For scholars, this means an opportunity to offer valid insights into the urban-rural dichotomy for public policy decision-making. In addition to the national level, QOL is becoming part of urban development strategies. The city of Jeseník, with its Strategic Development Plan of the city of Jeseník, can be an example. QOL is the first of the four parts of the strategy [64].

Author Contributions

Conceptualization, F.P. and P.M.; Formal analysis, F.P.; Investigation, F.P. and P.M.; Methodology, F.P. and P.M.; Project administration, F.P.; Supervision, F.P.; Validation, F.P.; Writing—original draft, F.P. and P.M.; Writing—review & editing, F.P. All authors have read and agreed to the published version of the manuscript.

Funding

This paper was prepared with support from the Ministry of Education of the Slovak Republic and the Slovak Academy of Science—grant number VEGA 1/0706/20.

Institutional Review Board Statement

Not applicable.

Informed Consent Statement

Not applicable.

Data Availability Statement

Not applicable.

Conflicts of Interest

The authors declare no conflict of interest.

Appendix A. Questionnaire

Gender: male, female.
Form of study: bachelor, masters, doctoral level.
Place of residence: city, village. A city is a municipality with a population of 5000 or more. A village is a municipality with a population up to 4999.
Quality of life: On a scale of 0–10, please indicate your quality of life. 0 means the lowest possible quality of life, 10 means the highest possible quality of life.
Happiness: On a scale of 0–10, please indicate how happy you are. 0 means you are extremely unhappy, 10 means you are extremely happy.
Quality of place: On a scale of 0–10, please indicate the quality of the city or village where you live permanently, in terms of external conditions for living a good life. 0 means the lowest possible quality of place, 10 means the highest possible quality of place.
Quality of environment: On a scale of 0–10, please indicate the quality of the environment in the city or village where you live permanently. 0 means the lowest possible quality of environment, 10 means the highest possible quality of environment.

References

  1. Rogge, N.; Nijverseel, I. Quality of Life in the European Union: A Multidimensional Analysis. Soc. Indic. Res. 2019, 141, 765–789. [Google Scholar] [CrossRef]
  2. Stefana, E.; Marciano, F.; Rossi, D. Composite Indicators to Measure Quality of Working Life in Europe: A Systematic Review. Soc. Indic. Res. 2021, 157, 1047–1078. [Google Scholar] [CrossRef]
  3. Ivanová, M.; Klamár, R.; Fecková Škrabuľáková, E. Identification of Factors Influencing the Quality of Life in European Union Countries Evaluated by Principal Component Analysis. Geogr. Pannonica 2022, 26, 13–29. [Google Scholar] [CrossRef]
  4. Giddens, A. Sociology, 3rd ed.; Polity Press: Cambridge, UK, 1997; pp. 1–625. [Google Scholar]
  5. Petrovič, F.; Murgaš, F. Description Relationship between Urban Space and Quality of Urban Life. A Geographical Approach. Land 2021, 10, 1337. [Google Scholar] [CrossRef]
  6. UN. Revision of World Urbanization Prospects. 2018. Available online: https://population.un.org/wup/ (accessed on 4 March 2022).
  7. Okulicz-Kozaryn, A. City Life: Rankings (Livability) Versus Perceptions (Satisfaction). Soc. Indic. Res. 2013, 110, 433–451. [Google Scholar] [CrossRef]
  8. Alderton, A.; Davern, M.; Nitvimol, K.; Butterworth, I.; Higgs, C.; Ryan, E.; Badland, H. What is the meaning of urban liveability for a city in a low-to-middle-income country? Contextualising liveability for Bangkok, Thailand. Glob. Health 2019, 15, 2–13. [Google Scholar] [CrossRef] [Green Version]
  9. Van den Berg, L.; Drewett, R.; Klaassen, L.H.; Rossi, A.; Vijverberg, C.H.T. A Study of Growth and Decline. Urban Europe, 1st ed.; Pergamon Press: Oxford, UK, 1982; pp. 1–184. [Google Scholar]
  10. Svobodová, H.; Hofmann, E.; Věžník, A. Vybrané Kapitoly ze Socioekonomické Geografie České Republiky, 1st ed.; Masarykova Univerzita: Brno, Czech Republic, 2013; pp. 1–162. [Google Scholar]
  11. Dos Santos Tavares, D.M.; Bolina, A.F.; Dias, F.A.; dos Santos Ferreira, P.C.; Haas, V.J. Quality of life QOL of elderly. Comparison between urban and rural areas. Investig. Y Educ. En Enfermería 2014, 32, 401–413. [Google Scholar] [CrossRef] [Green Version]
  12. Vaishar, A.; Vidovićová, L.; Figueiredo, E. Quality of Rural Life. Editorial 16 June 2018. Eur. Countrys. 2018, 10, 180–190. [Google Scholar] [CrossRef]
  13. Sánchez-Sellero, M.; García-Carro, B.; Sánchez-Sellero, P. Synthetic Indicators of Quality of Subjective Life in the EU: Rural and Urban Areas. Prague Econ. Pap. 2021, 30, 529–551. [Google Scholar] [CrossRef]
  14. OECD; European Commission. Cities in the World. A New Perspective on Urbanisation, 1st ed.; OECD: Paris, France, 2020; pp. 1–171. [Google Scholar] [CrossRef]
  15. Requena, F. Rural–Urban Living and Level of Economic Development as Factors in Subjective Well-Being. Soc. Indic. Res. 2016, 128, 693–708. [Google Scholar] [CrossRef]
  16. Møller, V. South African quality of life trends in the late 1990s: Major divides in perceptions. Soc. Transit. 1999, 30, 93–105. [Google Scholar] [CrossRef]
  17. Agbo, A.A.; Nzeadibe, T.C.; Ajaero, C.K. Happiness in Nigeria: A Socio-Cultural Analysis. In Happiness Across Cultures; Selin, H., Davey, G., Eds.; Springer: Berlin/Heidelberg, Germany, 2012; Volume 6, pp. 293–310. [Google Scholar] [CrossRef]
  18. Duboz, P.; Macia, E.; Diallo, A.H.; Cohen, E.; Bergouignan, A.; Seck, S.M. The good life in rural and urban Senegal: A qualitative and quantitative study. PLoS ONE 2021, 16, e0252134. [Google Scholar] [CrossRef] [PubMed]
  19. Bernard, J. Rural Quality of Life–Poverty, Satisfaction and Opportunity Deprivation in Different Types of Rural Territories. Eur. Countrys. 2018, 10, 191–209. [Google Scholar] [CrossRef] [Green Version]
  20. Murgaš, F. Quality of life as the predictor of the elections of the President of the Czechia in 2013 and 2018. In Proceedings of the 22nd International Colloquium on Regional Sciences, Velké Bílovice, Czech Republic, 12–16 June 2019; Klímová, V., Žítek, V., Eds.; Masaryk University Press: Brno, Czech Republic, 2019; pp. 772–780. (In Czech). [Google Scholar] [CrossRef]
  21. Murgaš, F. Geographical conceptualization of quality of life. Ekológia 2016, 35, 309–319. [Google Scholar] [CrossRef] [Green Version]
  22. Spellerberg, A.; Huschka, D.; Habich, R. Quality of Life in Rural Areas: Processes of Divergence and Convergence. Soc. Indic. Res. 2007, 83, 283–307. [Google Scholar] [CrossRef]
  23. Grabski-Kieron, U.; Mose, I.; Reichert-Schick, A.; Steinführer, A. European Rural Peripheries Revalued: Governance, Actors, Impacts, 1st ed.; LIT: Münster, Germany, 2016; pp. 1–401. [Google Scholar]
  24. Stonawská, K.; Vaishar, A. Differentiation and Typology of the Moravian Countryside. Eur. Countrys. 2018, 10, 127–140. [Google Scholar] [CrossRef] [Green Version]
  25. OECD i Library. Rural Well-being. Geography of Opportunities. 2022. Available online: https//www.oecd.org/cfe/rural-well-being-d25cef80-en.htm (accessed on 7 April 2022).
  26. Murgaš, F.; Petrovič, F.; Tirpáková, A. Social Capital as a Predictor of Quality of Life: The Czech Experience. Int. J. Environ. Res. Public Health 2022, 19, 6185. [Google Scholar] [CrossRef]
  27. Murgaš, F.; Klobučník, M. Municipalities and Regions as Good Places to Live: Index of Quality of Life in the Czech Republic. Appl. Res. Qual. Life 2016, 11, 553–570. [Google Scholar] [CrossRef]
  28. Zákonů, S. Zákon o Obcích č. 128/2000. 2020. Available online: https://www.zakonyprolidi.cz/cs/2000-128 (accessed on 18 March 2022). (In Czech).
  29. Dijkstra, L.; Hamilton, E.; Somik Lall, S.; Wahba, S. How Do We Define Cities, Towns, and Rural Areas? World Bank: Washington, DC, USA, 2020; Available online: https://blogs.worldbank.org/sustainablecities/how-do-we-define-cities-towns-and-rural-areas (accessed on 20 August 2021).
  30. Pospěch, P.; Delín, M.D.; Spěšná, D. Quality of life in Czech rural areas Kvalita života na českém venkově. Agric. Econ. Czech 2009, 55, 284–295. (In Czech) [Google Scholar] [CrossRef] [Green Version]
  31. World Bank. Urban Development. 2022. Available online: https://www.worldbank.org/en/topic/urbandevelopment/overview#1 (accessed on 4 March 2022).
  32. Czech Statistical Office. Small Lexicon of Municipalities of the Czech Republic. 2021. Available online: https://www.czso.cz/csu/czso/small-lexicon-of-municipalities-of-the-czech-republic-2021 (accessed on 6 April 2021).
  33. Czech Statistical Office. Historický Lexikon Obcí České Republiky 1869–2005 I. díl. Praha: Český Statistický Úřad. Available online: https://www.czso.cz/csu/czso/historicky-lexikon-obci-ceske-republiky-2001-877ljn6lu9 (accessed on 6 April 2022).
  34. Haase, A.; Wolff, M.; Špačková, P.; Radzimski, A. Reurbanisation in Postsocialist EuropeA Comparative View of Eastern Germany, Poland, and the Czech Republic. Comp. Popul. Stud. 2017, 42, 353–390. [Google Scholar] [CrossRef]
  35. Kašparová, L.; Půček, M. Cohesion Policy: Settlement in the Czech Republic Urban-Rural Partnership, 1st ed.; Ministry for Regional Development: Praha, Czech Republic, 2009; pp. 1–90. [Google Scholar]
  36. Perlín, R. Vymezení Venkovských Obcí v Česku 2009. Deník Veřejné Správy, 14 July 2009. Available online: http://denik.obce.cz/clanek.asp?id=6384068&ht=Perl%EDn (accessed on 23 April 2022).
  37. OECD. OECD Regional Typology. Available online: https://www.oecd.org/cfe/regionaldevelopment/OECD_regional_typology_Nov2012.pdf (accessed on 1 April 2022).
  38. Eurostat. Methodological Manual on Territorial Typologies, 2018 ed.; Publications Office of the European Union: Luxembourg, 2019; pp. 1–127. [Google Scholar] [CrossRef]
  39. Národní síť Místních Akčních Skupin České Republiky Místní Akční Skupiny. 2022. Available online: http://databaze.nsmascr.cz/ (accessed on 7 April 2022). (In Czech).
  40. Parmenter, T.R. Quality of life QOL as a concept and measurable entity. Soc. Indic. Res. 1994, 33, 9–46. [Google Scholar] [CrossRef]
  41. Phillips, D. Quality of Life QOL Concept, Policy and Practice; Routledge: London, UK; New York, NY, USA, 2006; pp. 1–288. [Google Scholar]
  42. Friedman, M. Improving the Quality of Life: A Holistic Scientific Strategy, 1st ed.; Praeger Publishers: Westport, CT, USA, 1997; pp. 1–191. [Google Scholar]
  43. Petrovič, F.; Murgaš, F. Holistic and Sustainable Quality of life. Conceptualisation and application. Folia Geogr. 2020, 62, 77–94. [Google Scholar]
  44. Guyer, P.; van Koot-Hodges, C.; Weijermars, B. Are Expanded Resilience Capacities Associated with Better Quality-of-Life Outcomes? Evidence from Poor Households Grappling with Climate Change in Bangladesh, Chad, India and Nepal. In Handbook of Quality of Life and Sustainability; Martinez, J., Mikkelsen, C.A., Phillips, R., Eds.; Springer: Dordrecht, The Netherlands, 2021; pp. 157–178. [Google Scholar]
  45. Post, M.W. Definitions of quality of life: What has happened and how to move on. Top. Spinal Cord Inj. Rehabil. 2014, 20, 167–180. [Google Scholar] [CrossRef]
  46. Diener, E. Assessing Subjective Well-Being: Progress and Opportunities. Soc. Indic. Res. 1994, 31, 103–157. [Google Scholar] [CrossRef]
  47. Chigbu, U.E. Tenure Responsive Land-Use Planning as a Tool for Improving Quality of Life: The Perspective of Sub-Saharan Africa. In Handbook of Quality of Life and Sustainability; Martinez, J., Mikkelsen, C.A., Phillips, R., Eds.; Springer: Dordrecht, The Netherlands, 2021; pp. 17–34. [Google Scholar]
  48. Skevington, S.M.; Boehnke, J. How is subjective well-being related to quality of life? Do we need two concepts and both measures? Soc. Sci. Med. 2018, 206, 22–30. [Google Scholar] [CrossRef] [Green Version]
  49. Nuvolati, G. The Flaneur: A Way of Walking, Exploring and Interpreting the City. In Walking in the European City; Shortell, T., Brown, E., Eds.; Ashgate: Burlington, NJ, USA, 2014; pp. 21–40. [Google Scholar]
  50. Katz, S. The science of quality of life. J. Chronic Dis. 1987, 40, 459–463. [Google Scholar] [CrossRef]
  51. Prokop, D.; Života, K. Praha: Aspen Institute Central Europe. 2018. Available online: https://s3.eu-central-1.amazonaws.com/uploads.mangoweb.org/shared-prod/aspeninstitutece.org/uploads/2018/12/05_Kvalita-%C5%BEivota-KKC_2018_Brochure_CZ_Final-5.pdf (accessed on 6 April 2022).
  52. Deloitte. Obce v Datech. Jak se Žije v Obcích v Česku? 2022. Available online: https://www.obcevdatech.cz/ (accessed on 27 January 2022).
  53. Deloitte. Index Kvality Života 2019: Říčany Opět v Čele, Největším Skokanem je Přelouč 2019. Press Release. 2019. Available online: https://www2.deloitte.com/cz/cs/pages/press/articles/index-kvality-zivota-2019.html (accessed on 27 January 2022).
  54. Tkacová, H.; Králik, R.; Tvrdoň, M.; Jenisová, Z.; Martin, J.G. Credibility and Involvement of Social Media in Education—Recommendations for Mitigating the Negative Effects of the Pandemic among High School Students. Int. J. Environ. Res. Public Health 2022, 19, 2767. [Google Scholar] [CrossRef]
  55. Kobylarek, A.; Błaszczyński, K.; Ślósarz, L.; Madej, M.; Carmo, A.; Hlad, Ľ.; Králik, R.; Akimjak, A.; Judák, V.; Maturkanič, P.; et al. The Quality of Life among University of the Third Age Students in Poland, Ukraine and Belarus. Sustainability 2022, 14, 2049. [Google Scholar] [CrossRef]
  56. Pavlíková, M.; Sirotkin, A.; Králik, R.; Petrikovičová, L.; Martin, J.G. How to Keep University Active during COVID-19 Pandemic: Experience from Slovakia. Sustainability 2021, 13, 10350. [Google Scholar] [CrossRef]
  57. Tkáčová, H.; Pavlíková, M.; Jenisová, Z.; Maturkanič, P.; Králik, R. Social Media and Students’ Wellbeing: An Empirical Analysis during the COVID-19 Pandemic. Sustainability 2021, 13, 10442. [Google Scholar] [CrossRef]
  58. Petrovič, F.; Murgaš, F.; Králik, R. Happiness in Czechia during the COVID-19 Pandemic. Sustainability 2021, 13, 10826. [Google Scholar] [CrossRef]
  59. Murgaš, F.; Petrovič, F. Quality of life and quality of environment in Czechia in the period of the COVID-19 pandemic. Geograf. Čas. 2020, 72, 261–274. [Google Scholar] [CrossRef]
  60. Alvarez, A.L.; Müller-Eie, D. Quality of Urban Life and its Relationship to Spatial Conditions. WIT Trans. Ecol. Environ. 2017, 223, 285–296. [Google Scholar] [CrossRef] [Green Version]
  61. De Vaus, D. Surveys in Social Research, 5th ed.; Routledge: London, UK, 2002; pp. 1–422. [Google Scholar]
  62. Stiglitz, J.E.; Sen, A.; Fitoussi, J.-P. Report by the Commission on the Measurement of Economic Performance and Social Progress. 2022. Available online: https://ec.europa.eu/eurostat/documents/8131721/8131772/Stiglitz-Sen-Fitoussi-Commission-report.pdf (accessed on 27 January 2022).
  63. Ministry of the Environment of the Czech Republic. Strategic Framework Czech Republic 2030. Available online: https://www.vlada.cz/assets/ppov/udrzitelny-rozvoj/projekt-OPZ/Strategic_Framework_CZ2030.pdf (accessed on 7 April 2022).
  64. City of Jeseník (Online). Strategic Plan for the Development of the City of Jeseník. Available online: https://nasjesenik.cz/strategie (accessed on 17 June 2022). (In Czech).
Figure 1. Urban and rural population in Czechia from 1950 to 2050 in % [32].
Sustainability 14 08658 g001
Figure 2. Czech regions by population density 150 inhabitants/km2 [35].
Sustainability 14 08658 g002
Table 1. QOL in the size types of Czech cities.
Size of MunicipalityQuality of Life
−20004.1
2001–50005.1
5001–10,0005.4
10,001–20,0005.2
20,001–50,0005.3
50,001–100,0005.2
100,001+6.4
Source: [27].
Table 2. QOL in the largest cities of Czechia.
CityPopulation (2021)Quality of Life
Praha1,335,0007.3
Brno382,0007.7
Ostrava285,0004.2
Plzeň175,0006.4
Liberec104,0006.4
Olomouc101,0006.5
Source: [27,32].
Table 3. Municipalities with the highest value of the index of quality of life.
MunicipalityPopulation (2020)RegionIndex Quality of Life
Hvozdnice202Hradec Králové8.90
Zadní Vydří57Vysočina8.20
Libníkovice149Hradec Králové8.64
Dubovice74Vysočina8.80
Všestary1642Hradec Králové7.36
Libčany872Hradec Králové7.13
Bílý Kámen231Vysočina7.14
Předměřice nad L.1874Hradec Králové7.51
Vysoká nad L.1255Hradec Králové7.09
Brno379,871South Moravia7.00
Source: Adjusted according to [27].
Table 4. Municipalities with the lowest value of the index of quality of life.
MunicipalityPopulation (2020)RegionIndex Quality of Life
Černiv157Ústí nad Labem2.07
Vrskmaň242Ústí nad Labem2.06
Podbořanský Roh.129Ústí nad Labem2.02
Žiželice440Ústí nad Labem2.00
Bystřany1880Ústí nad Labem1.77
Vranov156Plzeňský1.44
Přebuz74Karlovarský1.77
Meziboří4824Ústí nad Labem1.67
Libořice336Ústí nad Labem1.36
Vrbno nad Lesy167Ústí nad Labem1.00
Source: Adjusted according to [27].
Table 5. Municipalities with the population of over 999 inhabitants with highest quality of life.
MunicipalityPopulation (2020)RegionIndex Quality of Life
Nupaky1871Central Bohemia100
Nové Veselí1333Vysočina94.7
Hamry nad Sázavou1616Vysočina93.0
Nová Ves1179Central Bohemia91.3
Lukavice1002Pardubický91.2
Velké Losenice1227Vysočina90.2
Dolní Újezd1967Pardubický90.2
Bystřec1165Pardubický90.2
Bohdalov1150Vysočina90.0
Sloupnice1710Pardubický88.1
Source: Adjusted according to [51].
Table 6. Municipalities with the population of over 999 inhabitants with lowest quality of life.
MunicipalityPopulation (2020)RegionIndex Quality of Life
Jiříkov3638Ústecký25.7
Vintířov1196Karlovarský25.5
Litvínov23,908Ústecký24.6
Rotava3005Karlovarský23.1
Bílina17,217Ústecký22.9
Trmice3364Ústecký21.7
Bečov1407Ústecký21.2
Hostomice1254Ústecký19.3
Staré Město1721Olomoucký0.7
Obrnice2179Ústecký0
Source: Adjusted according to [51].
Table 7. QOL in 10 cities with the highest values of the Index of quality of life.
CityPopulation (2021)RegionRankValueRankValue
20182021
Říčany16,167Central Bohemia110110
Praha1,325,280Praha29.829.4
Brandýs—St.Bol.19,420Central Bohemia77.537.8
Černošice7382Central Bohemia38.347.8
Brno382,405South Moravian166.857.6
Slavkov u Brna7045South Moravian× 67.6
Beroun19,988Central Bohemia67.577.4
Židlochovice3823South Moravian146.987.3
Hustopeče5974South Moravian97.397.3
Třeboň8150South Bohemian× 107.2
Source: Adjusted according to [52,53].
Table 8. QOL in 10 cities with the lowest values of the Index of quality of life.
CityPopulation (2021)RegionRankValueRankValue
20182021
Krnov23,257Moravian-Silesian1922.61972.0
Kraslice6705Karlovy Vary 1981.9
Podbořany6386Ústí nad Labem1992.11991.8
Kadaň18,133Ústí nad Labem 2001.8
Vítkov5670Moravian-Silesian2041.32011.8
Žatec18,823Ústí nad Labem 2021.6
Litvínov23,489Ústí nad Labem2021.52031.6
Most65,341Ústí nad Labem2031.32041.5
Karviná50,900Moravian-Silesian2050.22050.5
Orlová28,735Moravian-Silesian20602060
Source: Adjusted according to [52,53].
Table 9. Descriptive statistics for the QOL indicator.
QOLNMeanStd De
Whole sample2506.651.2
Females1567.601.15
Males946.250.95
Village1196.230.89
City1317.91.20
Age 18–252176.301.19
Age 26–33337.10.98
Source: Our research.
Table 10. Values of QOL and other variables for men and women in cities and villages.
Urban/Rural ValuesQuality of LifeHappinessQuality of PlaceQuality of Environ
Menrural5.395.697.087.04
urban7.126.827.737.57
average6.256.257.407.30
Womenrural7.066.858.117.91
urban7.067.117.977.36
average7.066.988.047.63
averagerural6.236.407.527.20
urban7.096.907.887.60
Source: Our research.
Table 11. Values of psychological matter and geographical matter of men and women, in villages and cities.
Psychological Matter (Subjective Dimension)Geographical Matter (Objective Dimension)
Rural24.9930.14
Urban28.1130.63
Source: Our research.
Table 12. Verbal assessment of correlations and predictors—authors according to Vaus [61].
Correlation ValueVerbal Indication of CorrelationVerbal Indication of the Predictor
−0.30No correlation, very small or small correlationNone
0.30–0.49MediumPredictor
0.50–0.69LargeStrong predictor
0.70–0.89Very largeVery strong predictor
0.90+Near perfectNear perfect predictor
Source: Adjusted according to [60].
Table 13. Correlations—average values.
VariablesQuality of LifeHappinessQuality of PlaceQuality of Environment
Quality of life×
Happiness0.746×
Quality of place0.3630.286×
Quality of environ0.2650.2510.364×
Source: Our research.
Table 14. Correlations—Villages, men and women combined.
VariablesQuality of LifeHappinessQuality of PlaceQuality of Environment
Quality of life×
Happiness0.77×
Quality of place0.290.28×
Quality of environ.0.240.270.27×
Source: Our research.
Table 15. Correlations—Cities, men and women combined.
VariablesQuality of LifeHappinessQuality of PlaceQuality of Environment
Quality of life×
Happiness0.71×
Quality of place0.260.30×
Quality of environ0.250.260.39×
Source: Our research.
Table 16. Correlations—Men—villages.
VariablesQuality of LifeHappinessQuality of PlaceQuality of Environment
Quality of life×
Happiness0.827×
Quality of place0.1380.256×
Quality of environ0.2310.2030.314×
Source: Our research.
Table 17. Correlations—Women—villages.
VariablesQuality of LifeHappinessQuality of PlaceQuality of Environment
Quality of life×
Happiness0.726×
Quality of place0.2990.227×
Quality of environ0.1840.5280.271×
Source: Our research.
Table 18. Correlations—Men—cities.
VariablesQuality of LifeHappinessQuality of PlaceQuality of Environment
Quality of life×
Happiness0.709×
Quality of place0.0920.190×
Quality of environ0.5450.3940.478×
Source: Our research.
Table 19. Correlations—Women—cities.
VariablesQuality of LifeHappinessQuality of PlaceQuality of Environment
Quality of life×
Happiness0.706×
Quality of place0.3580.400×
Quality of environ0.2340.2940.294×
Source: Our research.
Publisher’s Note: MDPI stays neutral with regard to jurisdictional claims in published maps and institutional affiliations.

