Article

A Yearly Based Multiobjective Park-and-Ride Control Approach Simulation Using Photovoltaic and Battery Energy Storage Systems: Fuxin, China Case Study

Department of Electrical and Electronics Engineering, University of the Ryukyus, Okinawa 903-0213, Japan
*
Author to whom correspondence should be addressed.
Sustainability 2022, 14(14), 8655; https://doi.org/10.3390/su14148655
Submission received: 25 May 2022 / Revised: 12 July 2022 / Accepted: 13 July 2022 / Published: 15 July 2022
(This article belongs to the Special Issue Advanced Renewable Energy for Sustainability)

Abstract

:
This paper presents a modern yearly based park-and-ride management scheme. The electric vehicles’ owners are encouraged to keep their cars away from the crowded areas in cities and use the public facilities such as bus, train, and metro. This action will help the owners to reach their work on time inside these crowded cities. Electric vehicle charging stations are designed to charge 1000 electric vehicles using the proposed park-and-ride control approach. A case study of Fuxin, China is considered. The electric vehicle charging stations demand is met using renewable energy sources, namely photovoltaic and battery energy storage systems. Meeting the load demand and minimizing the total life cycle cost are considered two objective functions to formulate a multiobjective approach. The optimal sizes of the photovoltaic and battery energy storage systems are obtained using a multiobjective genetic algorithm and ε -MOGA. The robustness and effectiveness of the proposed control methodology are verified by detailed analysis and comparison using MATLAB®.

1. Introduction

Nowadays, the rapid increase in automobile ownership results in traffic congestion, especially in large cities all over the world. Industrialization has triggered the rapid development of China’s car division; moreover, there were 31.72 million newly recorded motor vehicles in China, with an upsurge of 240 million in vehicle ownership [1]. According to [2,3], From 2009 to 2018, automobile sales in China were placed first in the world for ten consecutive years. Park-and-ride mode could ease traffic congestion in urban areas without abandoning traffic demands. This research proposes a holistic approach to evaluate the potential of the park-and-ride charging facility, which provides an option to car drivers to park their cars and charge using sustainable energy technologies.
The authors in [4] highlight a pilot commuting program for more than 4500 employees of ORNL, which incorporates the use of park-and-ride facilities. In [5], the authors highlight park-and-ride facilities within train station perimeters as key differentiation using discrete choice models. The authors found that paid parking bays and bike lockers among others were the most influential in determining the choice of the train station. Moreover, travelers seek stations with excellent facilities such as charging bays. In [6], a survey of 122 park-and-ride users in 1996 found that expense savings were a major incentive for partaking in the park and ride. Furthermore, in order to attract more users, the authors recommends tighter fiscal controls such as more high-priced charges for entering and parking in the CBD should be employed. The authors of [7] analyzed the effect of periodical congestion toll rate adjustment on the change in commuters’ transport modal choice in Singapore’s context. In [8], LBS application to help park-and-ride users choose the best train station to use to reach their destination is presented using a multicriteria decision-making model. According to [9], congestion has remained persistent in cities, and there is concern that total travel may have been increased rather than reduced. The authors detailed the long-term effects of park and ride and concluded that, for park and ride to be successful, rules will need to be strengthened to favor conventional public transport.
Moreover, in [10], facilities were proposed as an element of urban sustainability strategies in many cities in Europe. In 2008, a European Commission directive aimed at improving local air quality was introduced. According to the authors in [11], several local authorities have promoted the park-and-ride concept in Scotland since 1990. Ref. [12] discusses the overall impact of park and ride on total car traffic and social welfare using a discrete modal choice model.
The study in [13] investigates the emission impacts of the park-and-ride strategy through the case study of Song-Hong Road park-and-ride Lot, the first park-and-ride facility with rail transit connection in mainland China. The authors in [14] present the findings from interviews with eight critical stakeholders involved in UK park and ride: UK bus-based park and ride, which has increased significantly in popularity over the years. The authors in [15] proposed a park-and-cycle ride system in order to analyze it. The possibility of diffusion and the essential conditions when introducing this kind of system is presented. The article in [16] proposes a generic planning process that integrates EV infrastructure development with transit systems, develops a systematic assessment approach to fostering the PCR adoption, and illustrates a case implementation in Chicago. In [17], a novel SWEC model was utilized for the estimation of models of transit station choice for park and ride as well as kiss-and-ride (dropped off at transit station) transit commuters in GTHA. A multiobjective spatial optimization model for park-and-ride application-specific objectives is presented in [18]. This model is utilized for siting park and ride in Columbus, Ohio. The effectiveness of the proposed scheme in supporting transit planning in urban regions is confirmed by simulation results. The study in [19] conducts a multimodal analysis in a competitive railway/highway system along a linear traffic corridor. A price-based tradable credit scheme is introduced into the park-and-ride design in which the government determines the credit price.
The study in [20] seeks the possibilities of using the park-and-ride scheme to facilitate air travelers of Surabaya, Indonesia. The location of the park and ride is distributed in some subdistricts of the city. The authors in [21] propose an algorithm for traffic allocation for park-and-ride facilities for users that are coming from extraurban areas. Ref. [22] investigates optimal parking pricing in a many-to-one park and ride’s network. In each network, the origin is connected to the destination by an autopath, a parallel rail transit path, and a park-and-ride path. The study in [23] examines the effect of various factors on the utilization rate of park-and-ride lots with the panel. The data is drawn from park-and-ride lots in King County, Washington. The paper in [24] offers a modern approach for obtaining optimal pricing schemes for a parking facility, concerning its financial viability. The model is utilized for a shared-use, park-and-ride facility of the Athens metro network in Greece.
The authors in [25] study the problem of charging electric vehicles at stations with limited charging machines and power resources under certain customer satisfaction constraints. In [26], an MILP model for a single end-user that considers green energy generation, energy storage, and electric vehicles, and an Internet of Energy based energy trading platform to reduce energy waste is proposed. In the proposed approach, the power company sets the energy prices of the electrical grid, the Internet-of-Energy platform, and the energy market, respectively. The authors in [27] give a comprehensive review of the current situation of EV technology, mainly emphasizing V2G, V2H, and V2B, respectively. Moreover, ref. [28] focused on a current and incoming EV drawback, namely the variety of EV charging methods that are currently available in the market. Ref. [29] investigates the benefits of demand resources in buildings for optimal energy trading in day-ahead and real-time energy markets. The paper examines the combined optimization of EVs and batteries in the day ahead and the regulation of electricity markets to maximize the total profit of building a microgrid and considers EVs’ driving pattern. In [30], comparative measurements of the eco-driving effect between internal combustion electric vehicles and EVs were conducted using normal driving (C/D) with an eco-driving test mode. Eco-driving effects and energy-conversion efficiencies were examined. Results indicate that eco-driving with low kinetic running energy is efficient not only for ICEVs (including HEVs) but also for EVs. An economic evaluation for four EV-DRE coordination strategies is conducted in [31].
Ref. [32] considers delay-optimal charging scheduling of EVs at a charging station with multiple charge points. Moreover, in [33], the authors assessed multiple locations to determine the installation feasibility of parking canopies and PV system EV charging stations and to show these two systems’ effectiveness if they are implemented together. Ref. [34] assessed the problem of allocating energy from renewable sources to EVs in a cost-efficient manner. The study in [35] proposes a formulation for designing and managing electric vehicle charging stations using renewable sources, considering both long-term planning decisions and short-term operational decisions over a prespecified planning horizon and under stochastic power demand. In [36], an EV charging station utilizing renewable energy is proposed as a business model. The proposed EV charging station purchases power from photovoltaic systems at a low price and uses that power to charge a fixed battery. Then, the power is sold, being used to charge electric vehicles during the daytime. Moreover, the station can provide power to smart houses at an economical price when load demand is high.
Prioritization and execution of the park-and-ride programs and incorporating RE technologies at a low cost is becoming an increasingly widespread methodology, as reported in the literature. This paper proposes a multiobjective park-and-ride control scheme. The park-and-ride methodology helps users to circumvent stressful drives through congested roads in search of expensive city-center parking. The proposed control scheme is utilized to implement the EVCS to charge 1000 EVs while the owners are at work. A 100% RE scheme is used to match the required demand through PV and BESS. Fuxin, China is selected as a case study with a whole one-year real data of solar radiation. Matching the load demand and minimizing the total life cycle cost are considered the two objectives functions. MOGA and ε -MOGA are utilized to obtain the optimal values of the PV area and BESS number units. The effectiveness and robustness of the proposed methodology are investigated using MATLAB®.
This paper presents a novel park-and-ride control scheme via EVCS implementation to charge 1000 EVs using renewable energy sources. This action will decrease the dependency on the conventional power system grid, and as a result, mitigate CO 2 emissions significantly, which is missed in the previous literature results.The main aim of the proposed control approach is to facilitate EV users’ life and at the same time decrease CO 2 emissions and their harmful environmental impact by using renewable energy sources.
The main contributions of this research are as follows:
  • A novel multiobjective park-and-ride control scheme is presented.
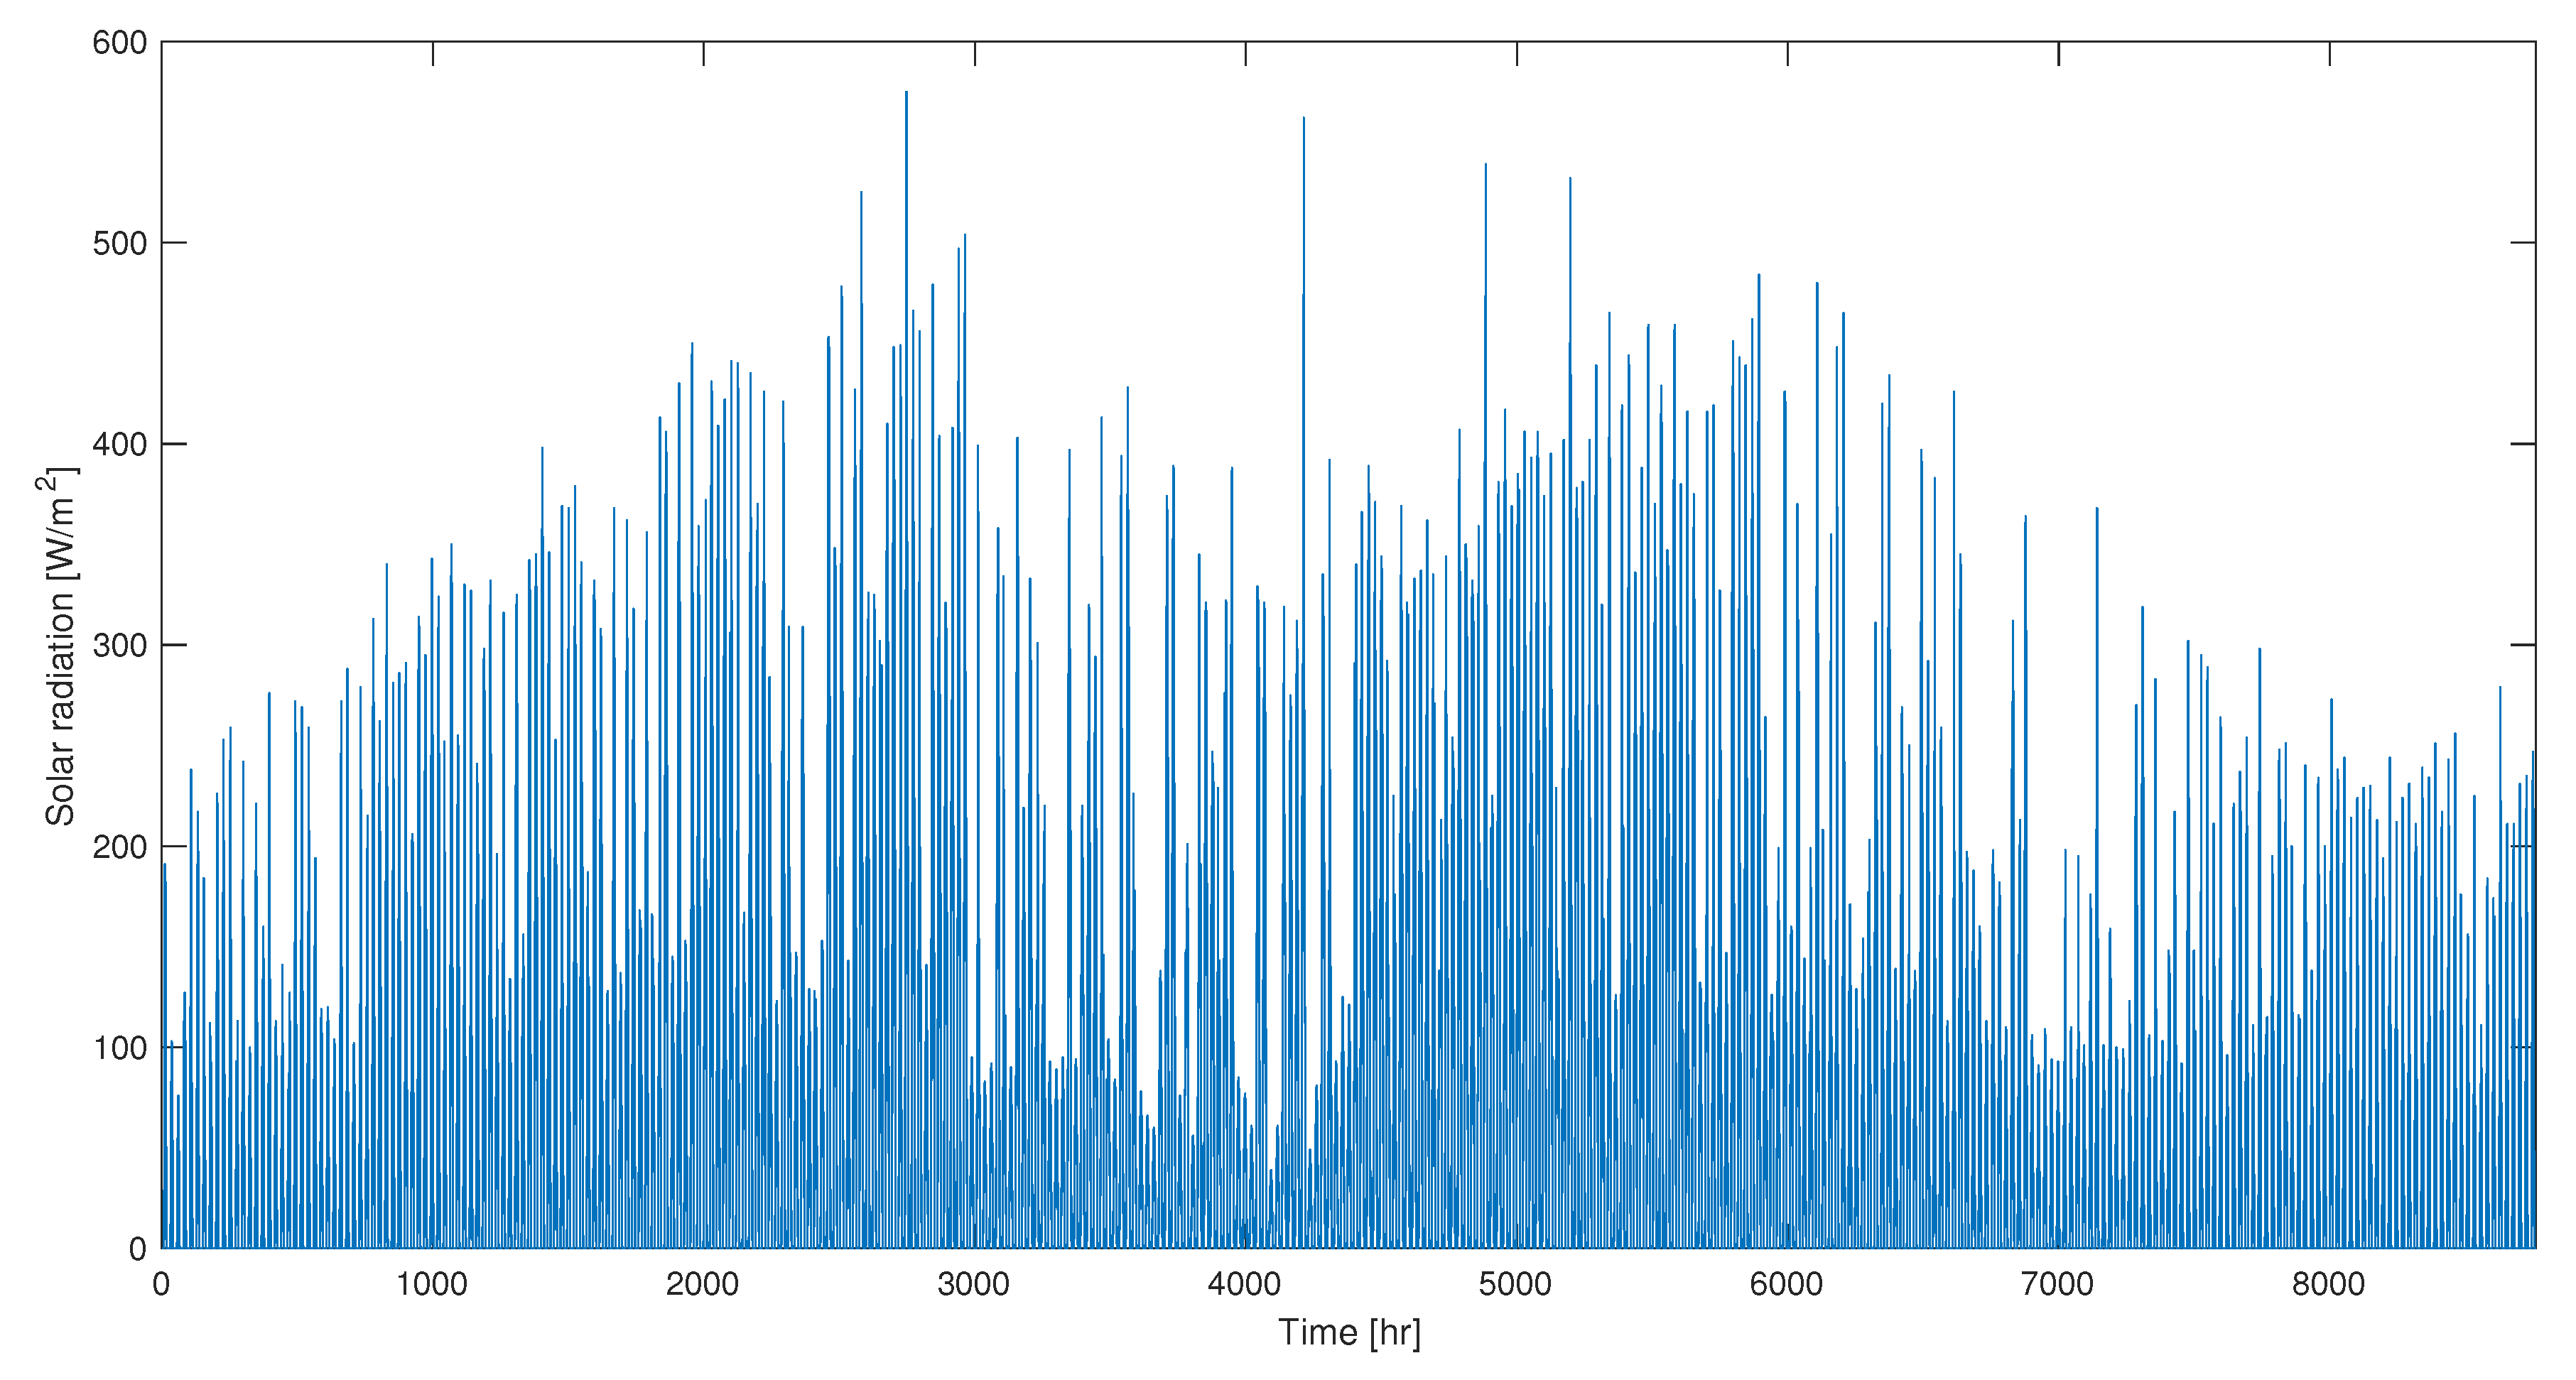
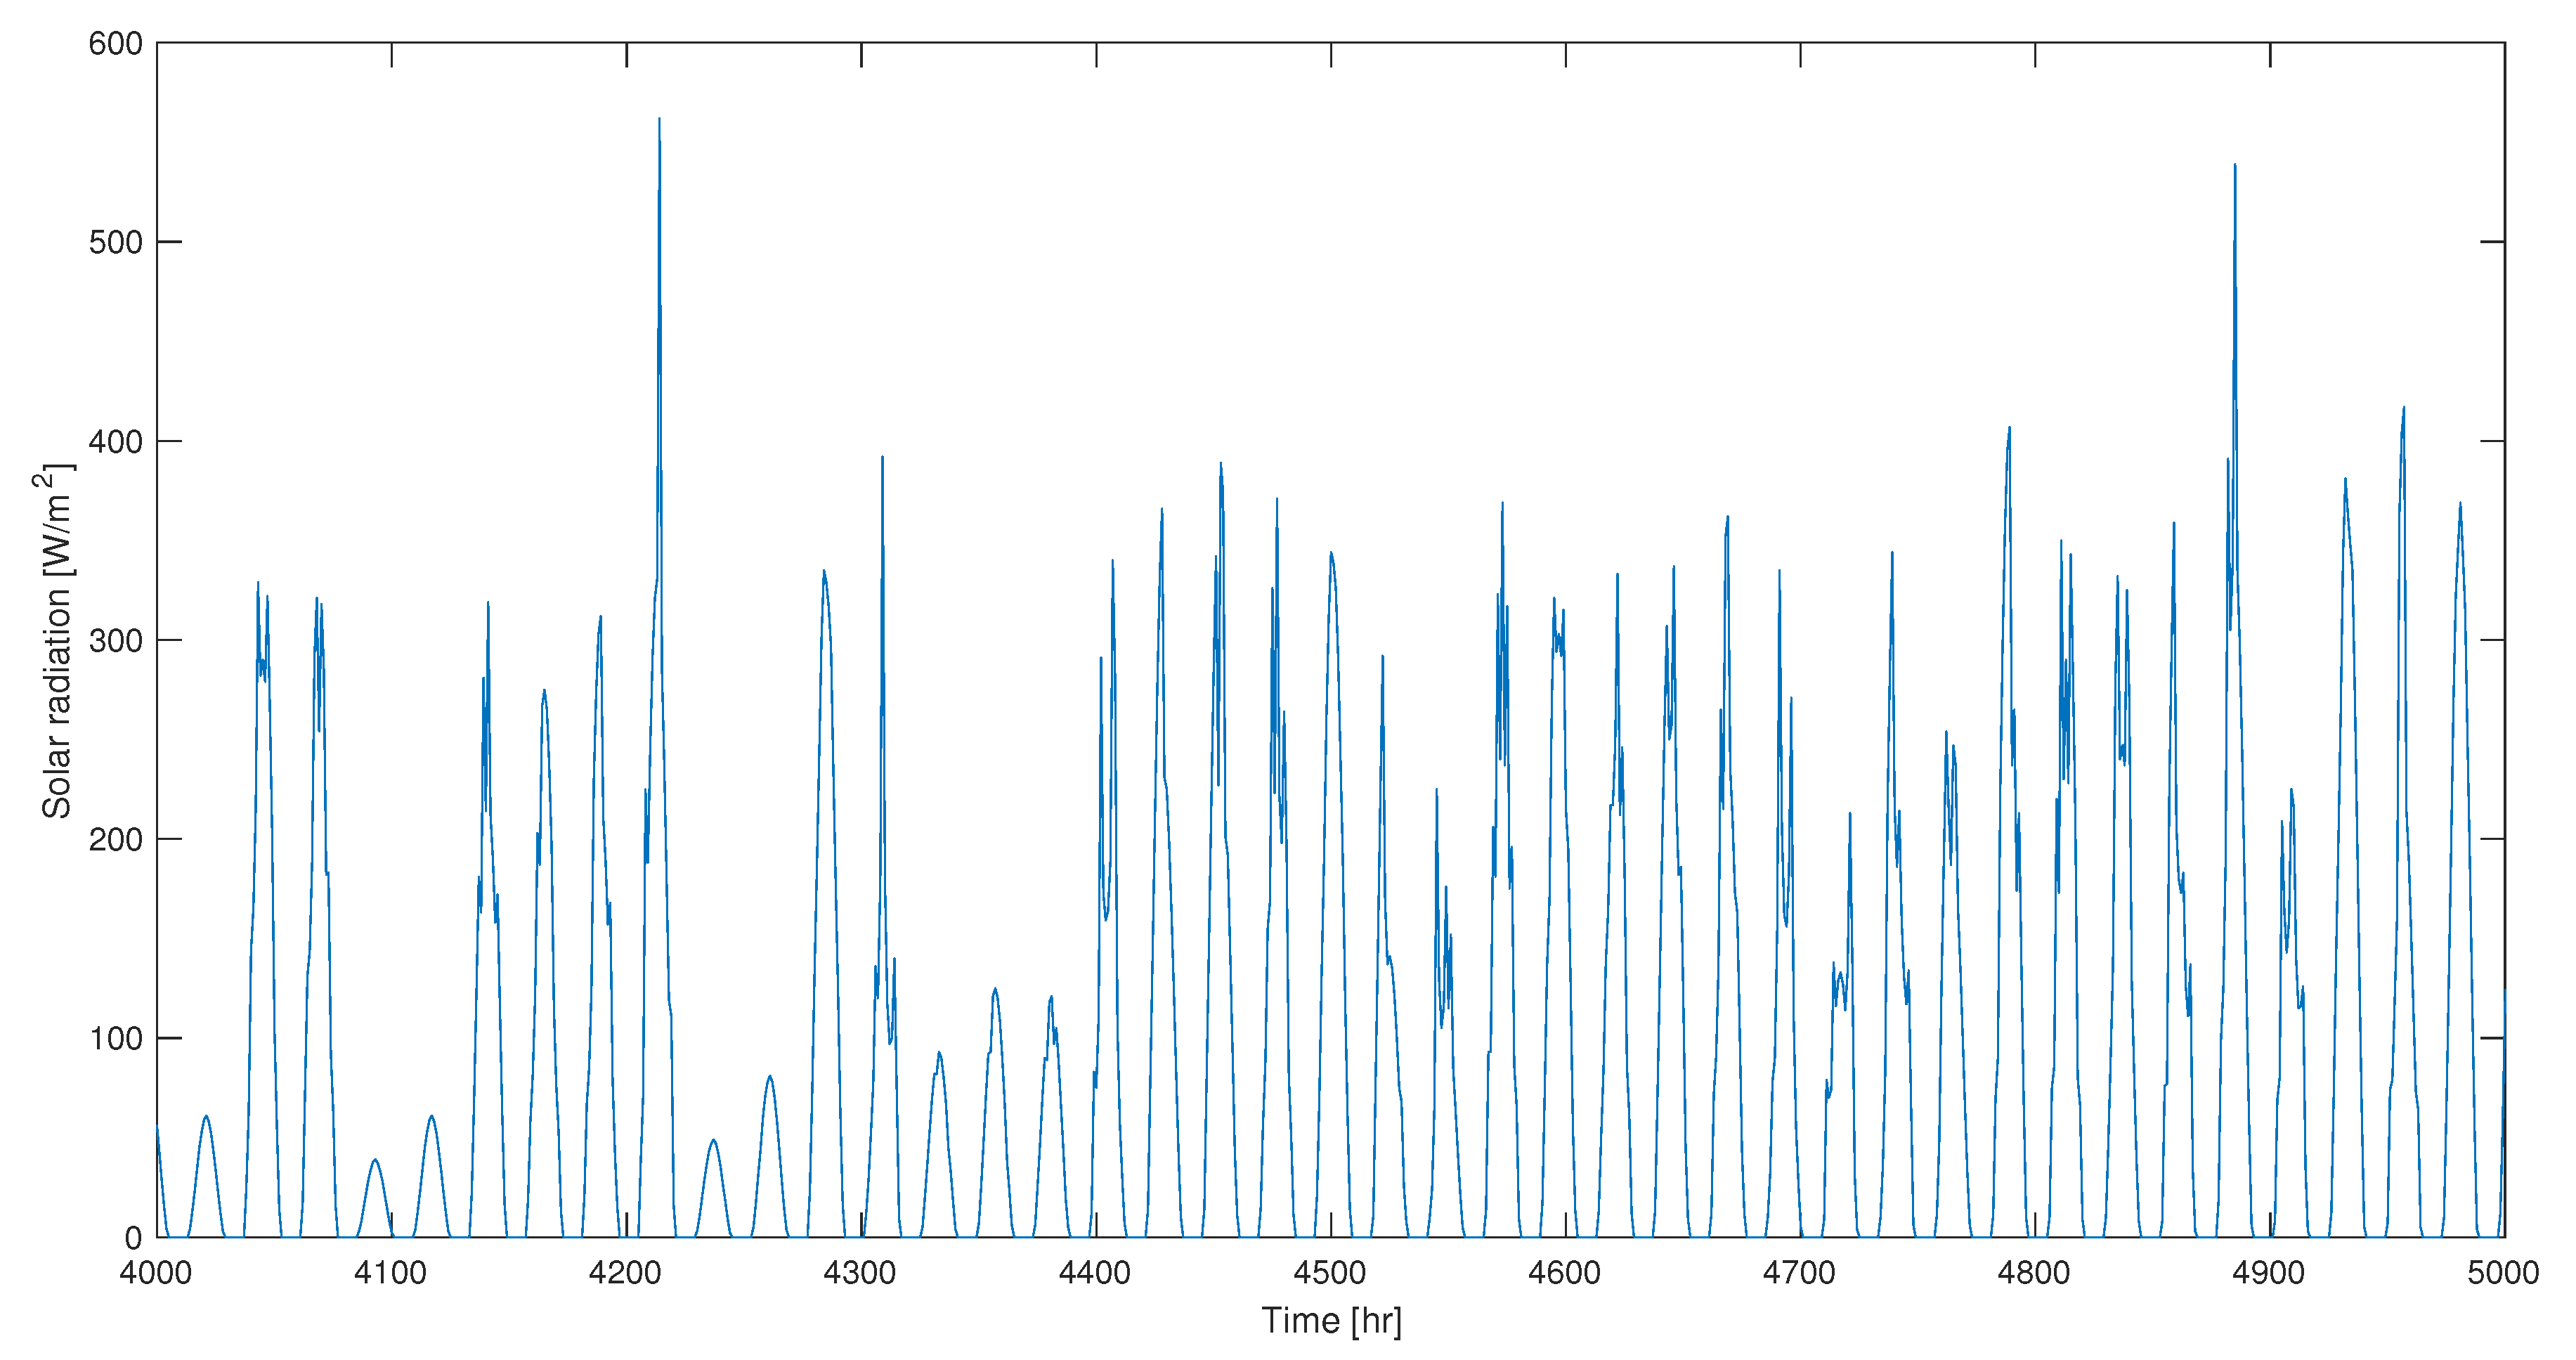
  • A real case study of Fuxin (China) with real data of a whole one-year solar radiation is utilized.
  • One hundred percent RE schemes are implemented to meet the load demand of the EVCS of 1000 EVs using PV and BESS.
  • MOGA and ε -MOGA are used and compared with detailed analysis to investigate the performance of the proposed control methodology.
The remaining part of this paper is organized as follows; Section 2 details the proposed model scheme. Section 3 discusses the main principles of MOGA and ε -MOGA. Section 4 presents the simulation results of the proposed control scheme. A detailed analysis of the simulation results is discussed in Section 5. Furthermore, the conclusion is then drawn in Section 6.

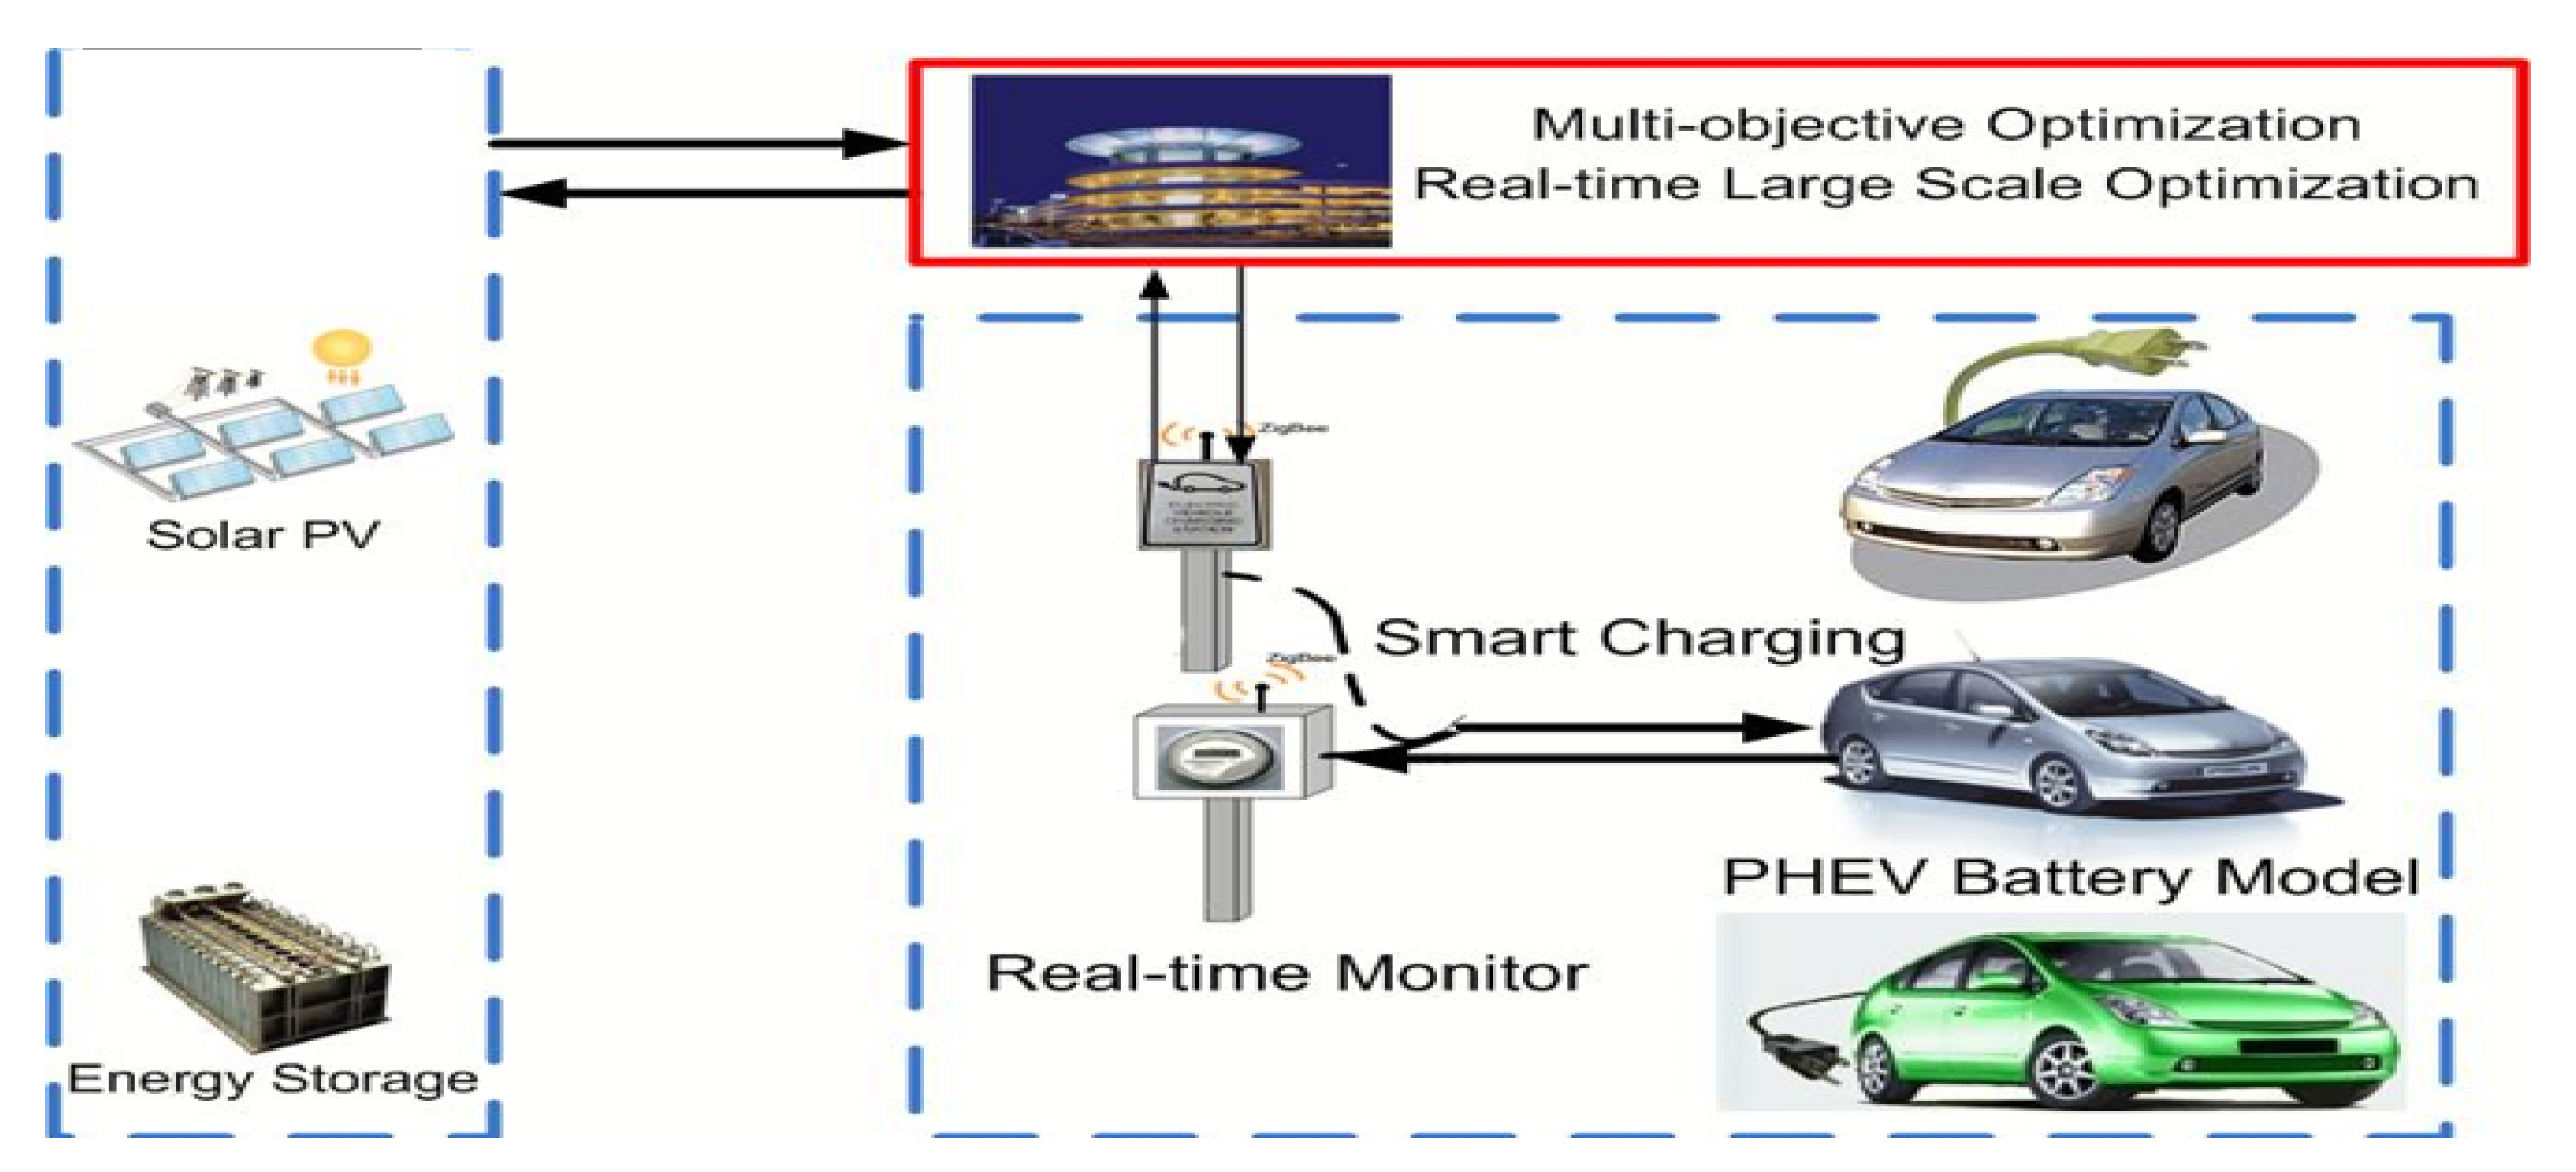
2. Proposed Park-and-Ride Control Scheme Power System Formulation

In this research, hybrid renewable technologies such as Solar PV and BESS are introduced, as shown in Figure 1. The stored energy can be controlled for economical usage in the future when the electricity demand is high during load peak times or when there is unavailable PV power. Minimizing the total daily operating cost and meeting the load demand are the two objective functions considered. Technoeconomic modeling of each component of the system is required to achieve the mentioned objectives.
P T = P V + B E S S

2.1. Photovoltaic Array System Output Power

The power supplied by a set of PV panels at hour t is as follows
P P V t = η P V · A P V · S t
Depending on P L , the amount of P T at a specific hour can be enough or not meet the load. As a result, the SOC of the battery is at any time t.
  • If P T ( t ) P L ( t ) η i n v , then there exists surplus power through which the battery can be charged. During charging, the SOC is calculated as follows:
S O C ( t ) = S O C ( t 1 ) · ( 1 σ ) + P T ( t ) P L ( t ) η i n v · η b c
Battery state of charge must not exceed the maximum SOC, so during optimization the following constraint should be considered:
S O C S O C m a x
  • If P T ( t ) P L ( t ) η i n v , then there exists power deficit from P T , and this deficit is rectified by the battery systems. During discharging, the SOC is calculated as follows:
S O C ( t ) = S O C ( t 1 ) · ( 1 σ ) P L t η i n v P T t η b d
In order to prolong the battery’s lifespan, the SOC should not be less than the minimum state of charge.
S O C t S O C m i n
The minimum state of charge can be obtained as follows:
S O C m i n = 1 D O D · C b

2.2. Economic Analysis

The system total cost is given by the costs of each equipment to be installed, including the operation and maintenance costs.
PV array life cost: The capital cost for PV array is directly proportional to the initial cost and area occupied by the solar panels and is given by:
C p v = C i A p v
The total operation and maintenance cost for PV array is:
O M p v = β p v A p v j = 1 N 1 + σ p v ( 1 + i ) j
Assuming the life time for solar panels, the replacement price is equal to zero. On the other hand the resale price (in $) is given by following equation:
S p v = μ p v A p v 1 + δ 1 + i N
Battery energy storage life cost: The capital cost for the battery is given by the equation below:
C b a t = N b λ b C b
The battery life time is considered to be five years, and that means for the lifetime of the system, every five years the battery should be replaced. The battery replacement cost is given by the equation below:
R b a t = N b λ b C b 1 + σ p v ( 1 + i ) j
Considering no resale and maintenance cost for the battery during its lifetime, the values of j should be j 1 = 5 , j 2 = 10 , and j 3 = 15 . In this case, the total replacement cost for the battery should be the summation the values for j 1 , j 2 , and j 3 , applied in Equation (11).
The total life cycle cost for the system is given by the following equation:
L C C = C p v + O M p v + R p v S p v + C b a t + O M b a t + R b a t S b a t

2.3. Objective Function

The two objective functions that are considered for the system design are given below. The first is to minimize the mismatch between load and generation and the second is to minimize the investment cost of the proposed system. Equations (14) and (15) show the two objective functions, respectively:
f 1 = P g P l
f ( 2 ) = C p v + O M p v + R p v S p v + C b a t + O M b a t + R b a t S b a t

3. Optimization Technique

For this research, a comparison of optimal solutions is applied using a multiobjective genetic algorithm (MOGA) and an epsilon multiobjective genetic algorithm ( ε -MOGA).

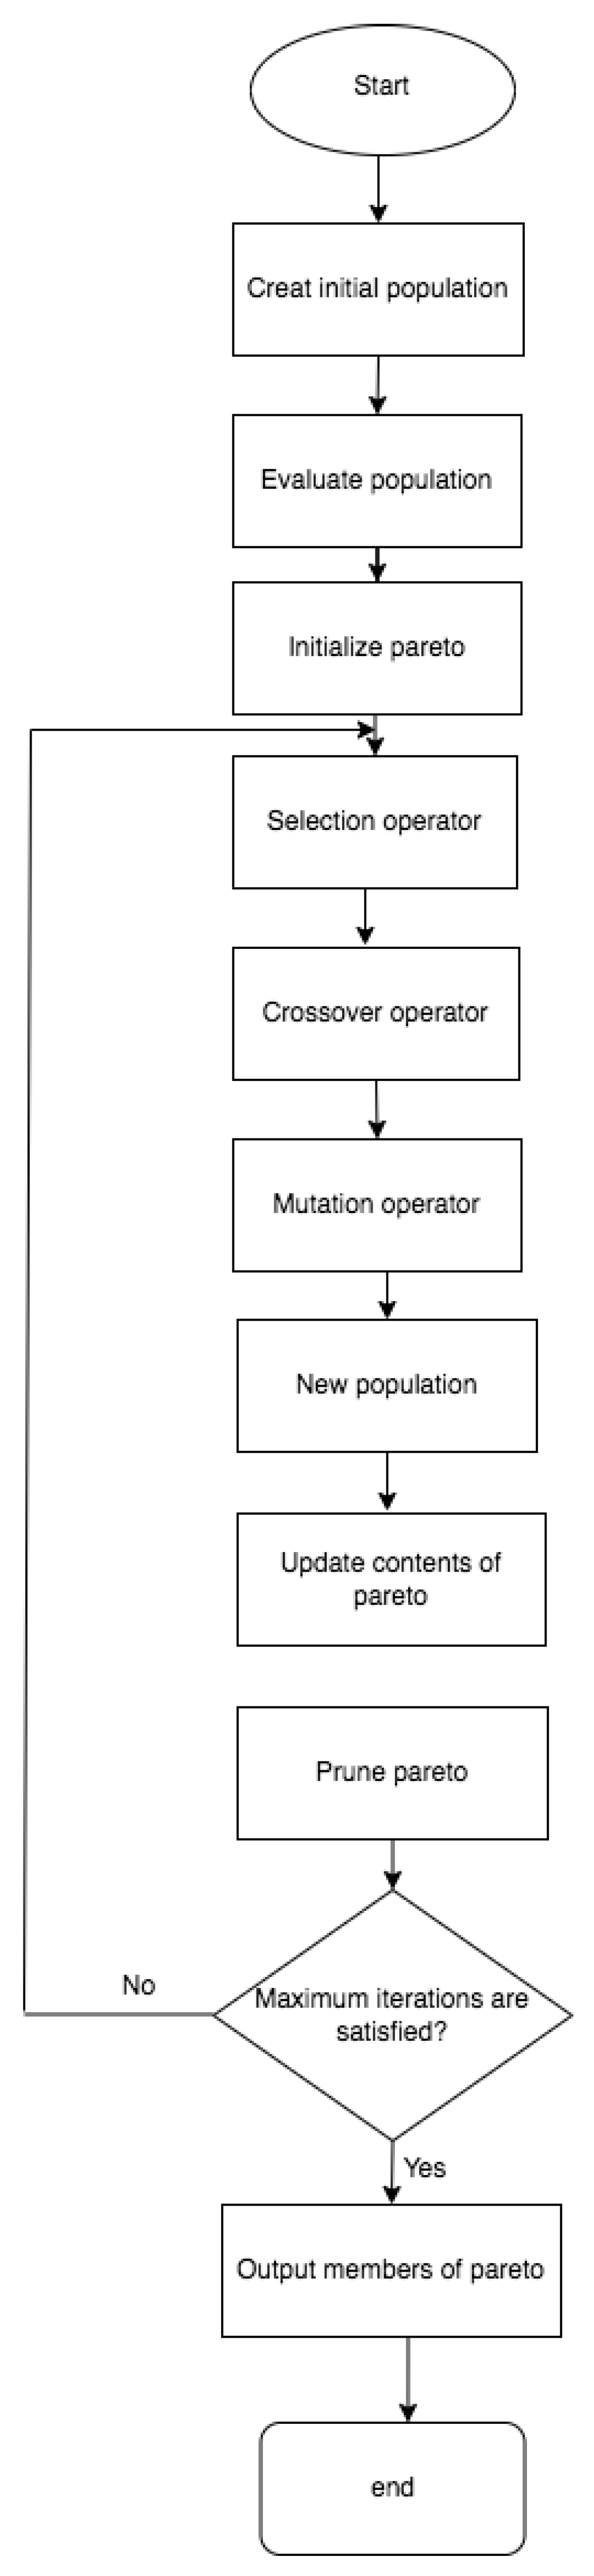
3.1. Multiobjective Genetic Algorithm

M O G A is a general purpose search technique based on principles inspired from genetic and evolution mechanisms. Generally, GA is divided in three different phases of search for the best solution: phase 1: An initial population is created; phase 2: The fitness function is evaluated, and phase 3: A new population is produced [37,38]. Bellow, the main steps of the working process of GA are in Figure 2.

3.2. ε -MOGA Theory

ε -MOGA is an elitist multiobjective evolutionary algorithm based on the concept of epsilon dominance, which is used to control the content of the archive A(t), where the result of the optimization problem is stored [39,40,41,42,43]. The flowchart of the complete design process for the proposed ε -MOGA-based control scheme is presented in Figure 3.

4. Simulation Results

In order to confirm the effectiveness and the robustness of the proposed control scheme, a yearly based simulation is performed using MATLAB® software. The main composition is built as follows: The EV’s owner reaches the EVCS at 8 AM daily, plugs in the EV, and uses public transportation facilities to commute to work. After 6 PM, the owner of the EV returns from work to the EVCS location and unplugs the EV to ride home. The average capacity of 50 kW is considered for the EV battery. PV and BESS are used to supply the charging station from 8 a.m. to 6 p.m. Depending on the aforementioned charging scheduled, the load demand for the whole year is formulated as shown in Figure 4, while the zoomed load demand is presented in Figure 5.
A multiobjective problem is formulated considering the minimization of the mismatch between generation and load demand and mitigating the total life cycle cost as the two objective functions. ε -MOGA and MOGA are used to obtain the optimal PV area and the optimal number of BESS to meet the objective functions. The associated parameters of ε -MOGA and MOGA are set as follows:
1.
MOGA.
  • Number of population = 20,000.
  • Number of generation = 1700.
  • Crossover ratio = 0.8.
2.
ε -MOGA
  • N i n d G = 8, N i n d p = 20,000, and P c / m = 0.2.
  • Number of generation = 1700.
  • n b o x 1 = n b o x 2 = 500.
The system parameters utilized in the simulations are shown in Table 1, with a whole year of solar radiation data of Fuxin, China used in the simulation analysis, as shown in Figure 6. In this study, one station providing sunshine duration and solar radiation data from the China Meteorological Administration (http://data.cma.cn, accessed on 18 September 2021) were used. Moreover, a zoomed version of the solar radiation is obtained in Figure 7. Moreover, the obtained Pareto fronts of both ε -MOGA and MOGA control schemes are shown in Figure 8.
The minimization of mismatch between load and generation is established as a priority. The point of least generation/load mismatch of each Pareto front is considered as an operating point. In this regard, the PV output power of MOGA and ε -MOGA control methodologies are shown in Figure 9 and Figure 10, respectively, while the zoomed PV output powers of both schemes are presented in Figure 11. Furthermore, battery SOC is shown in Figure 12 for both control scheme approaches. Moreover, Figure 13 and Figure 14 show the load/generation balance and zoomed load/generation balance for the whole year for the MOGA control approach. Moreover, load/generation balance and its zoomed version for ε -MOGA control methodology are presented in Figure 15 and Figure 16, respectively, using 100% renewable energy sources.

5. Analysis

  • A yearly based simulation is implemented to make the proposed control scheme more real, rigid, and practical.
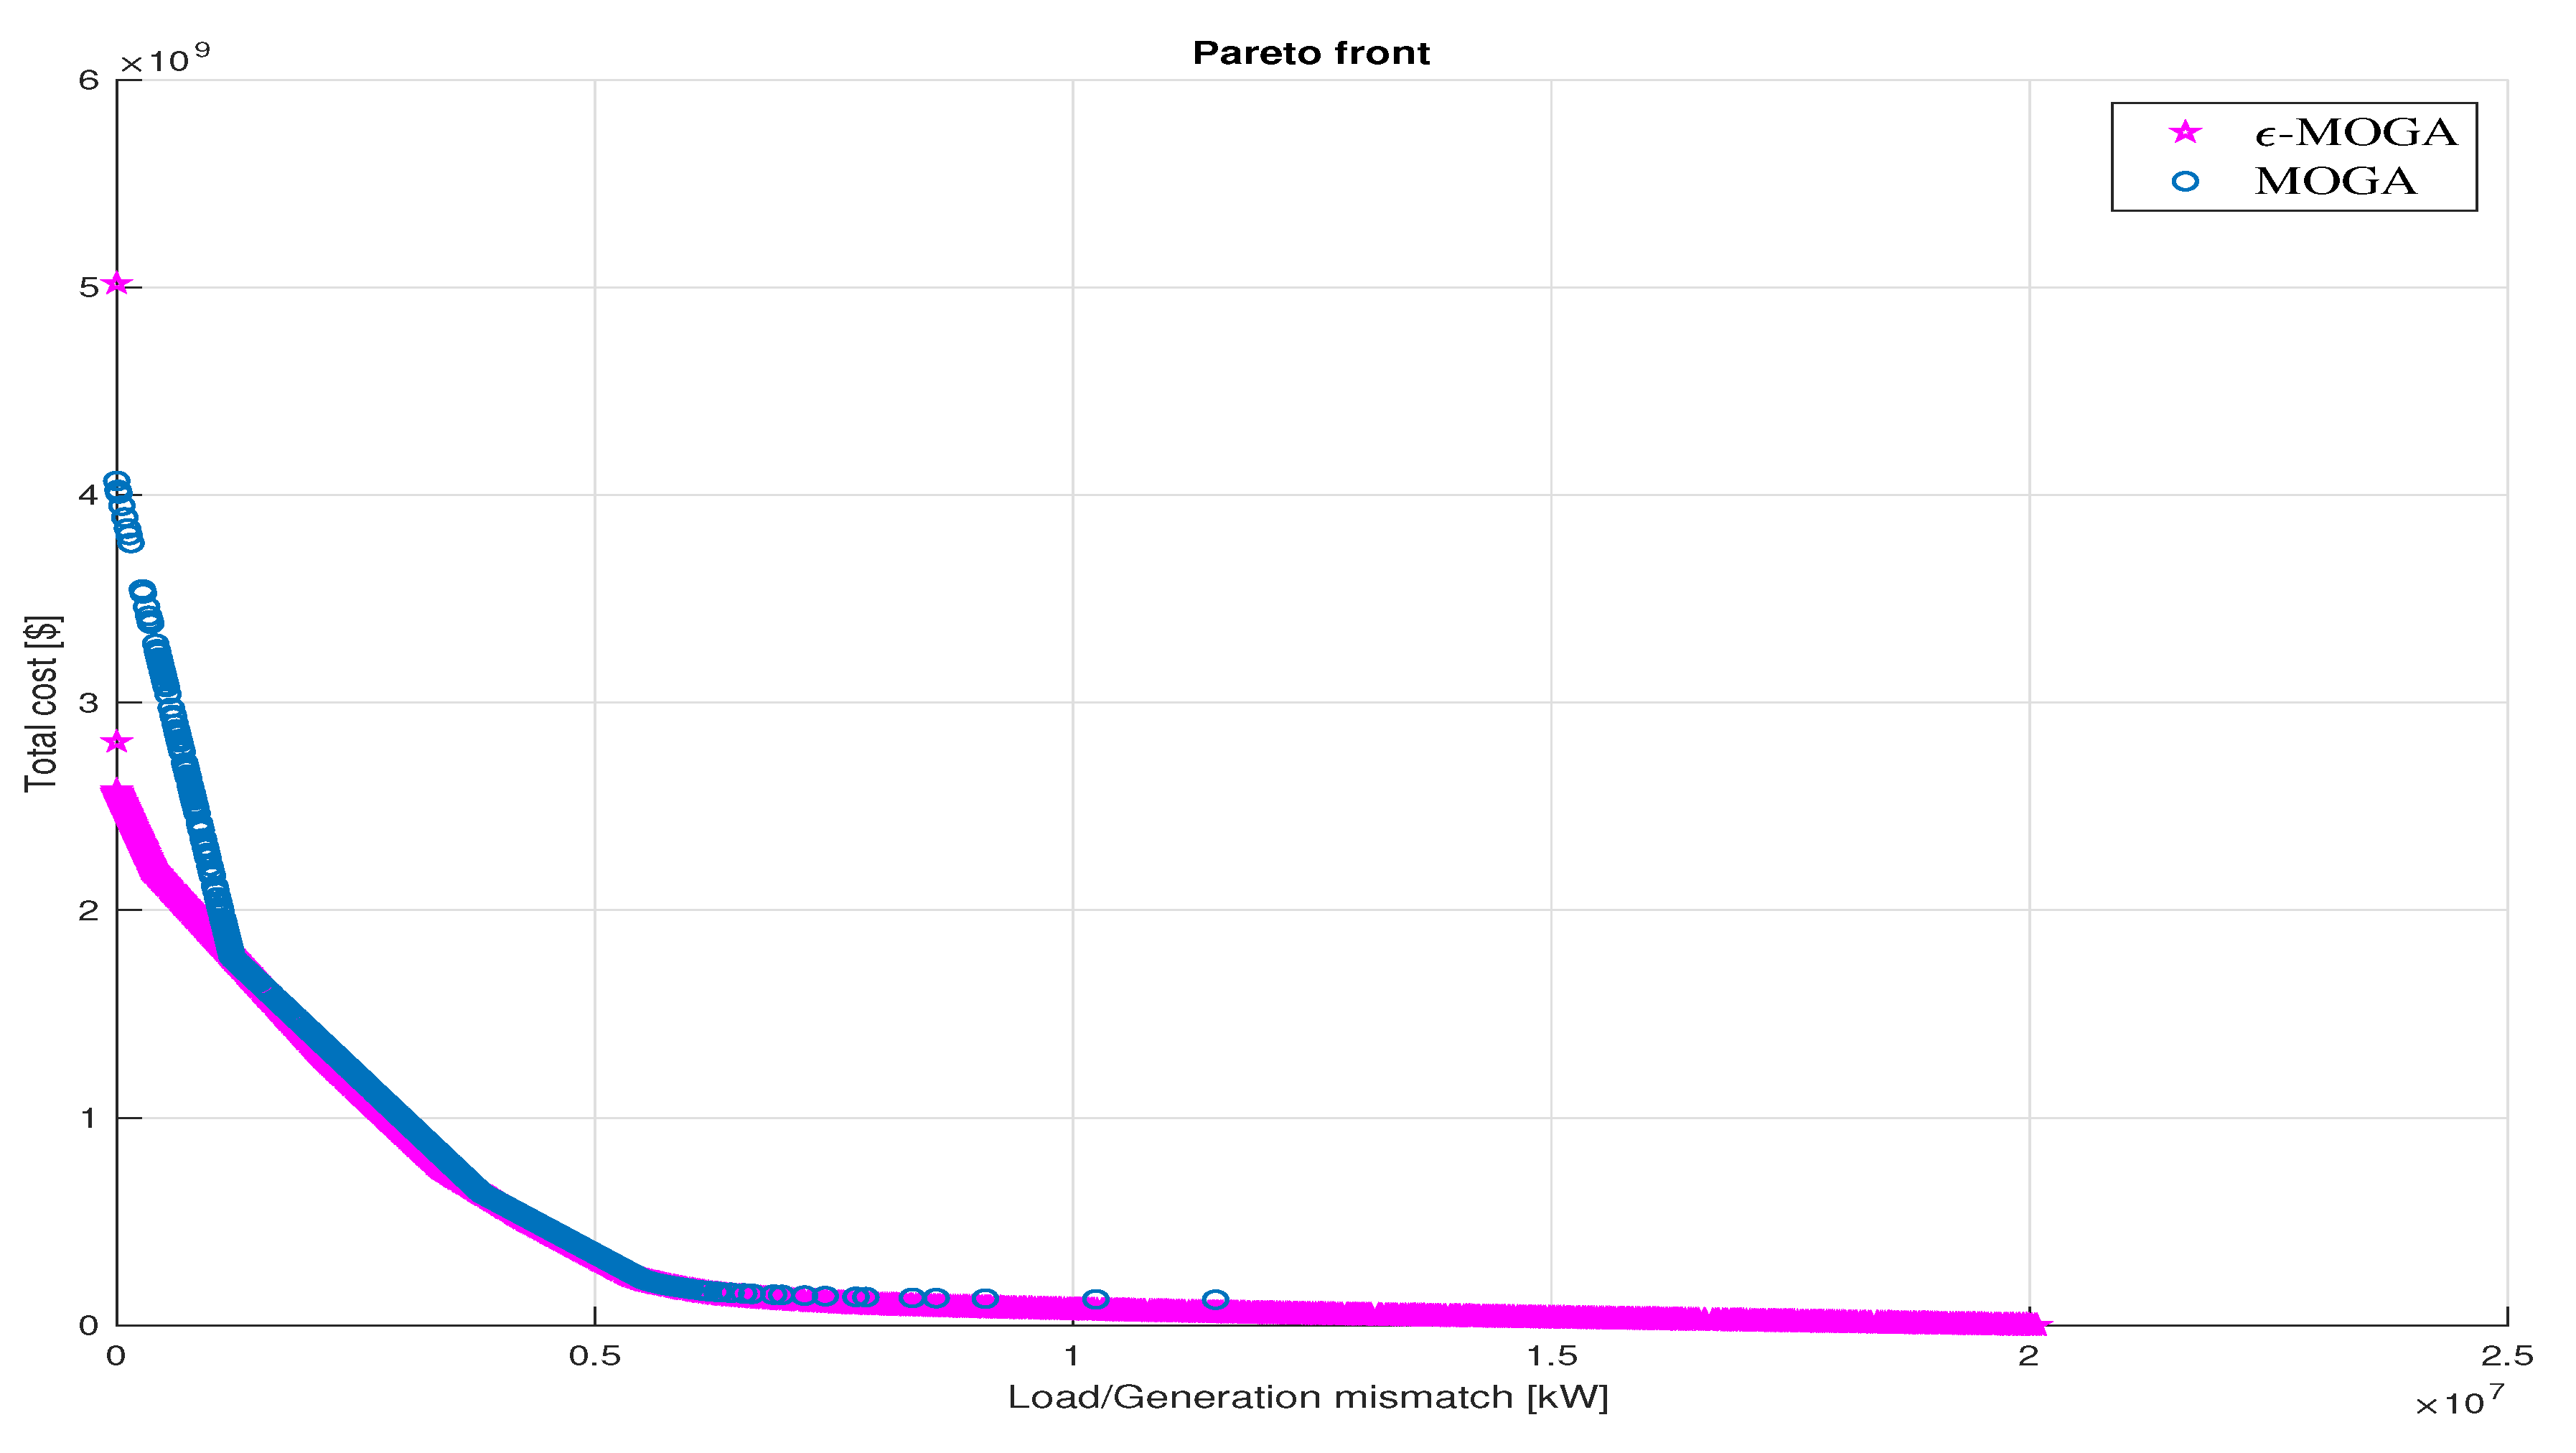
  • In total, 463 and 1750 points formulate the Pareto fronts of MOGA and ε -MOGA control schemes, respectively, as shown in Figure 8.
  • The proposed control system prioritizes meeting EVSC load demand. Given this, the point with least load/generation mismatch value is chosen from every Pareto front and considered as an operating point in the research. Based on this, the optimized values for decision variables and their associated objective function values related to both MOGA and ε -MOGA control approaches for the chosen operating points are shown in Table 2.
  • From Table 2, ε -MOGA control methodology achieved less total life cycle cost and load /generation mismatch at the same time by utilizing a smaller number of BESS and more PV area than the MOGA control scheme, as shown in Figure 7.
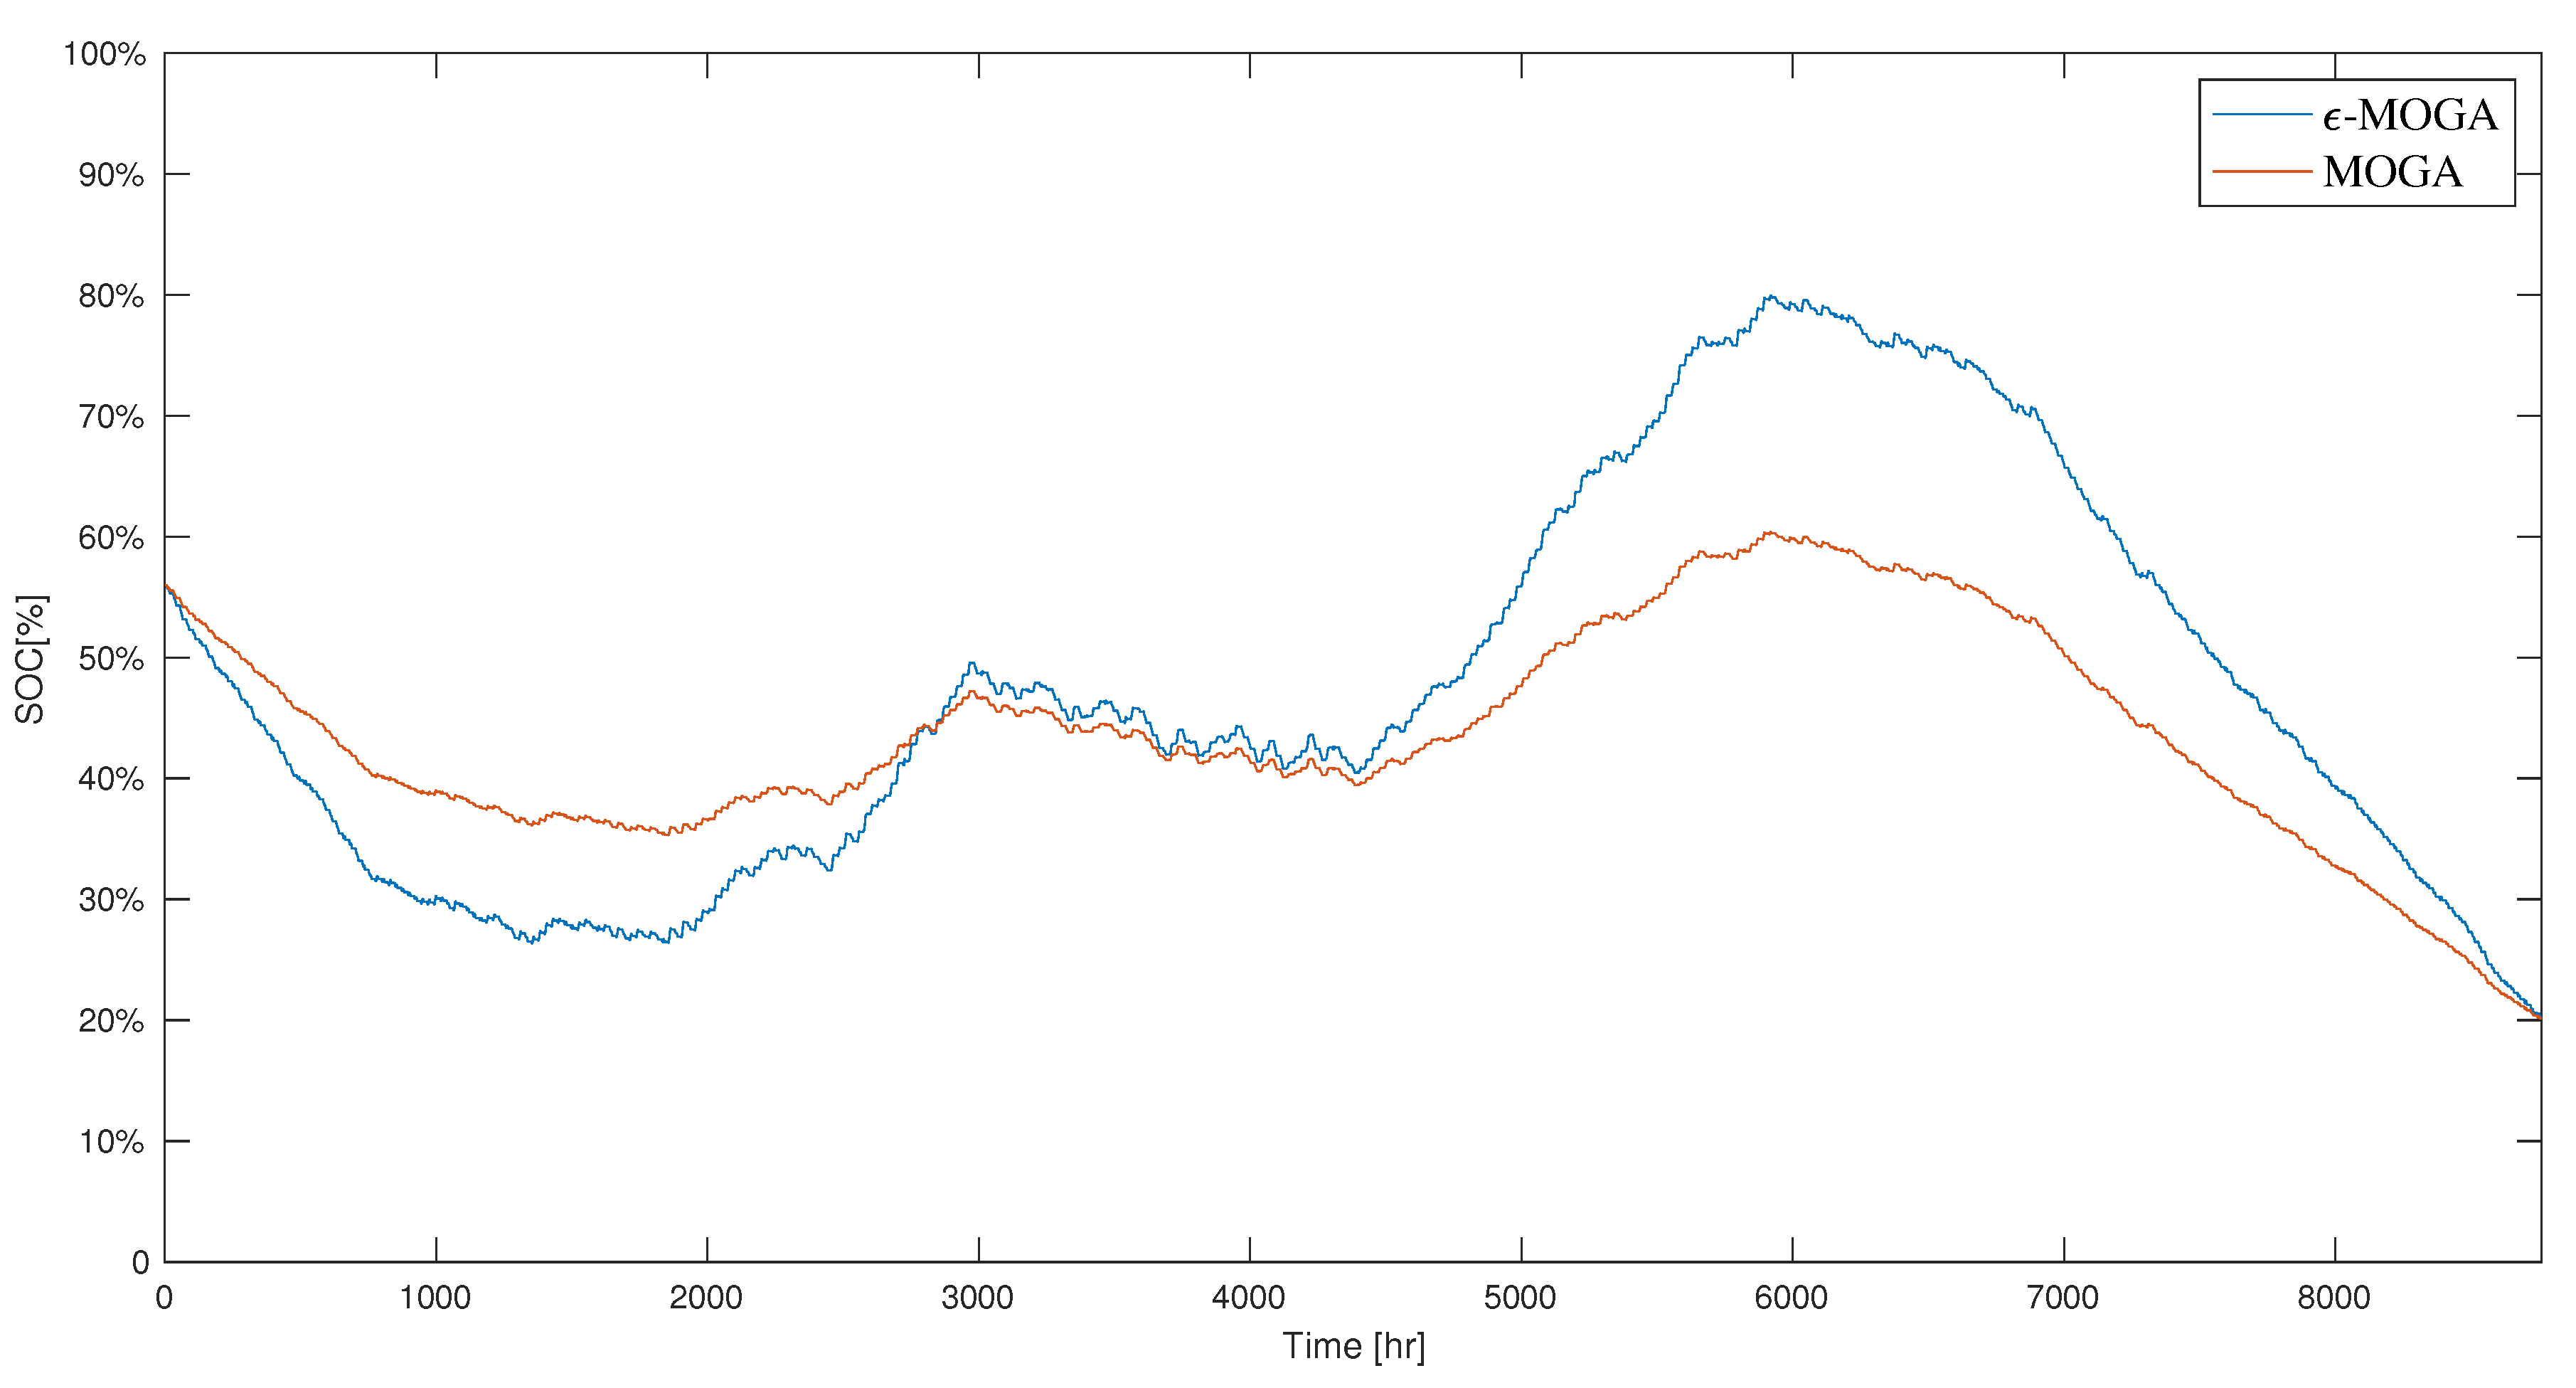
  • The two control strategies retain the SOC of the battery within the prespecified limits (20% < SOC < 80%), as shown in Figure 12, which has significant effects in increasing the lifetime of BESS and ensures its reliable performance.
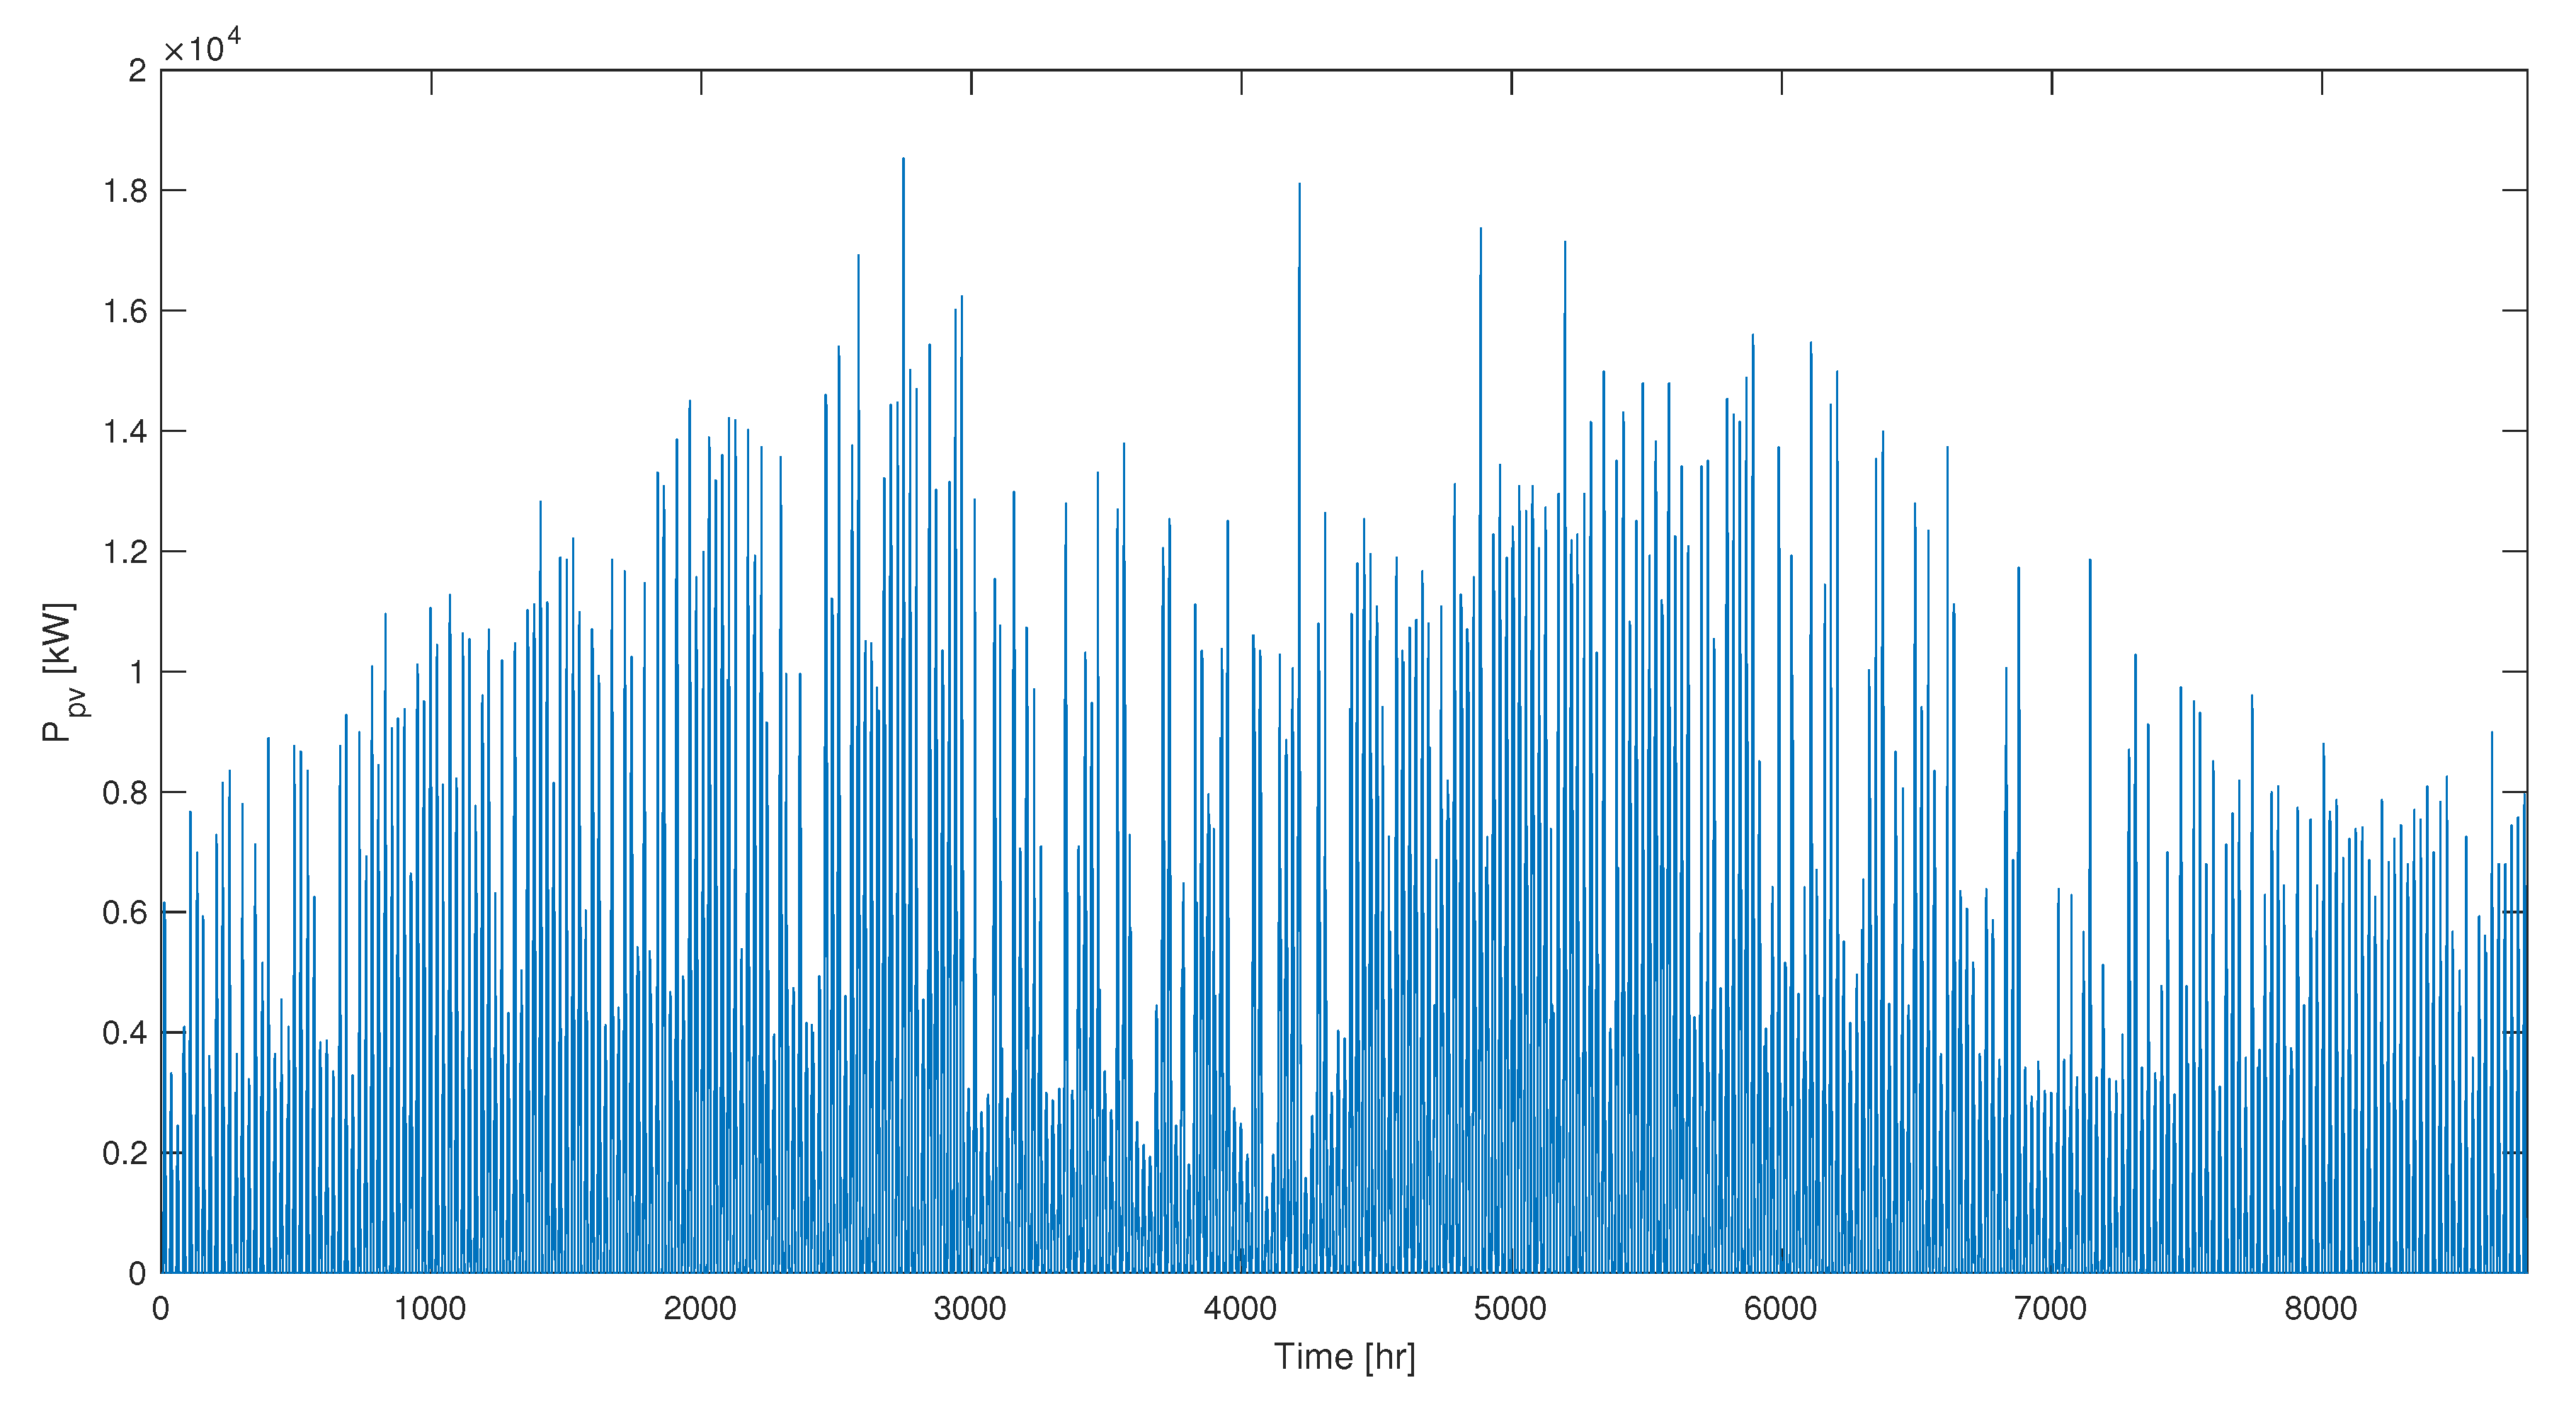
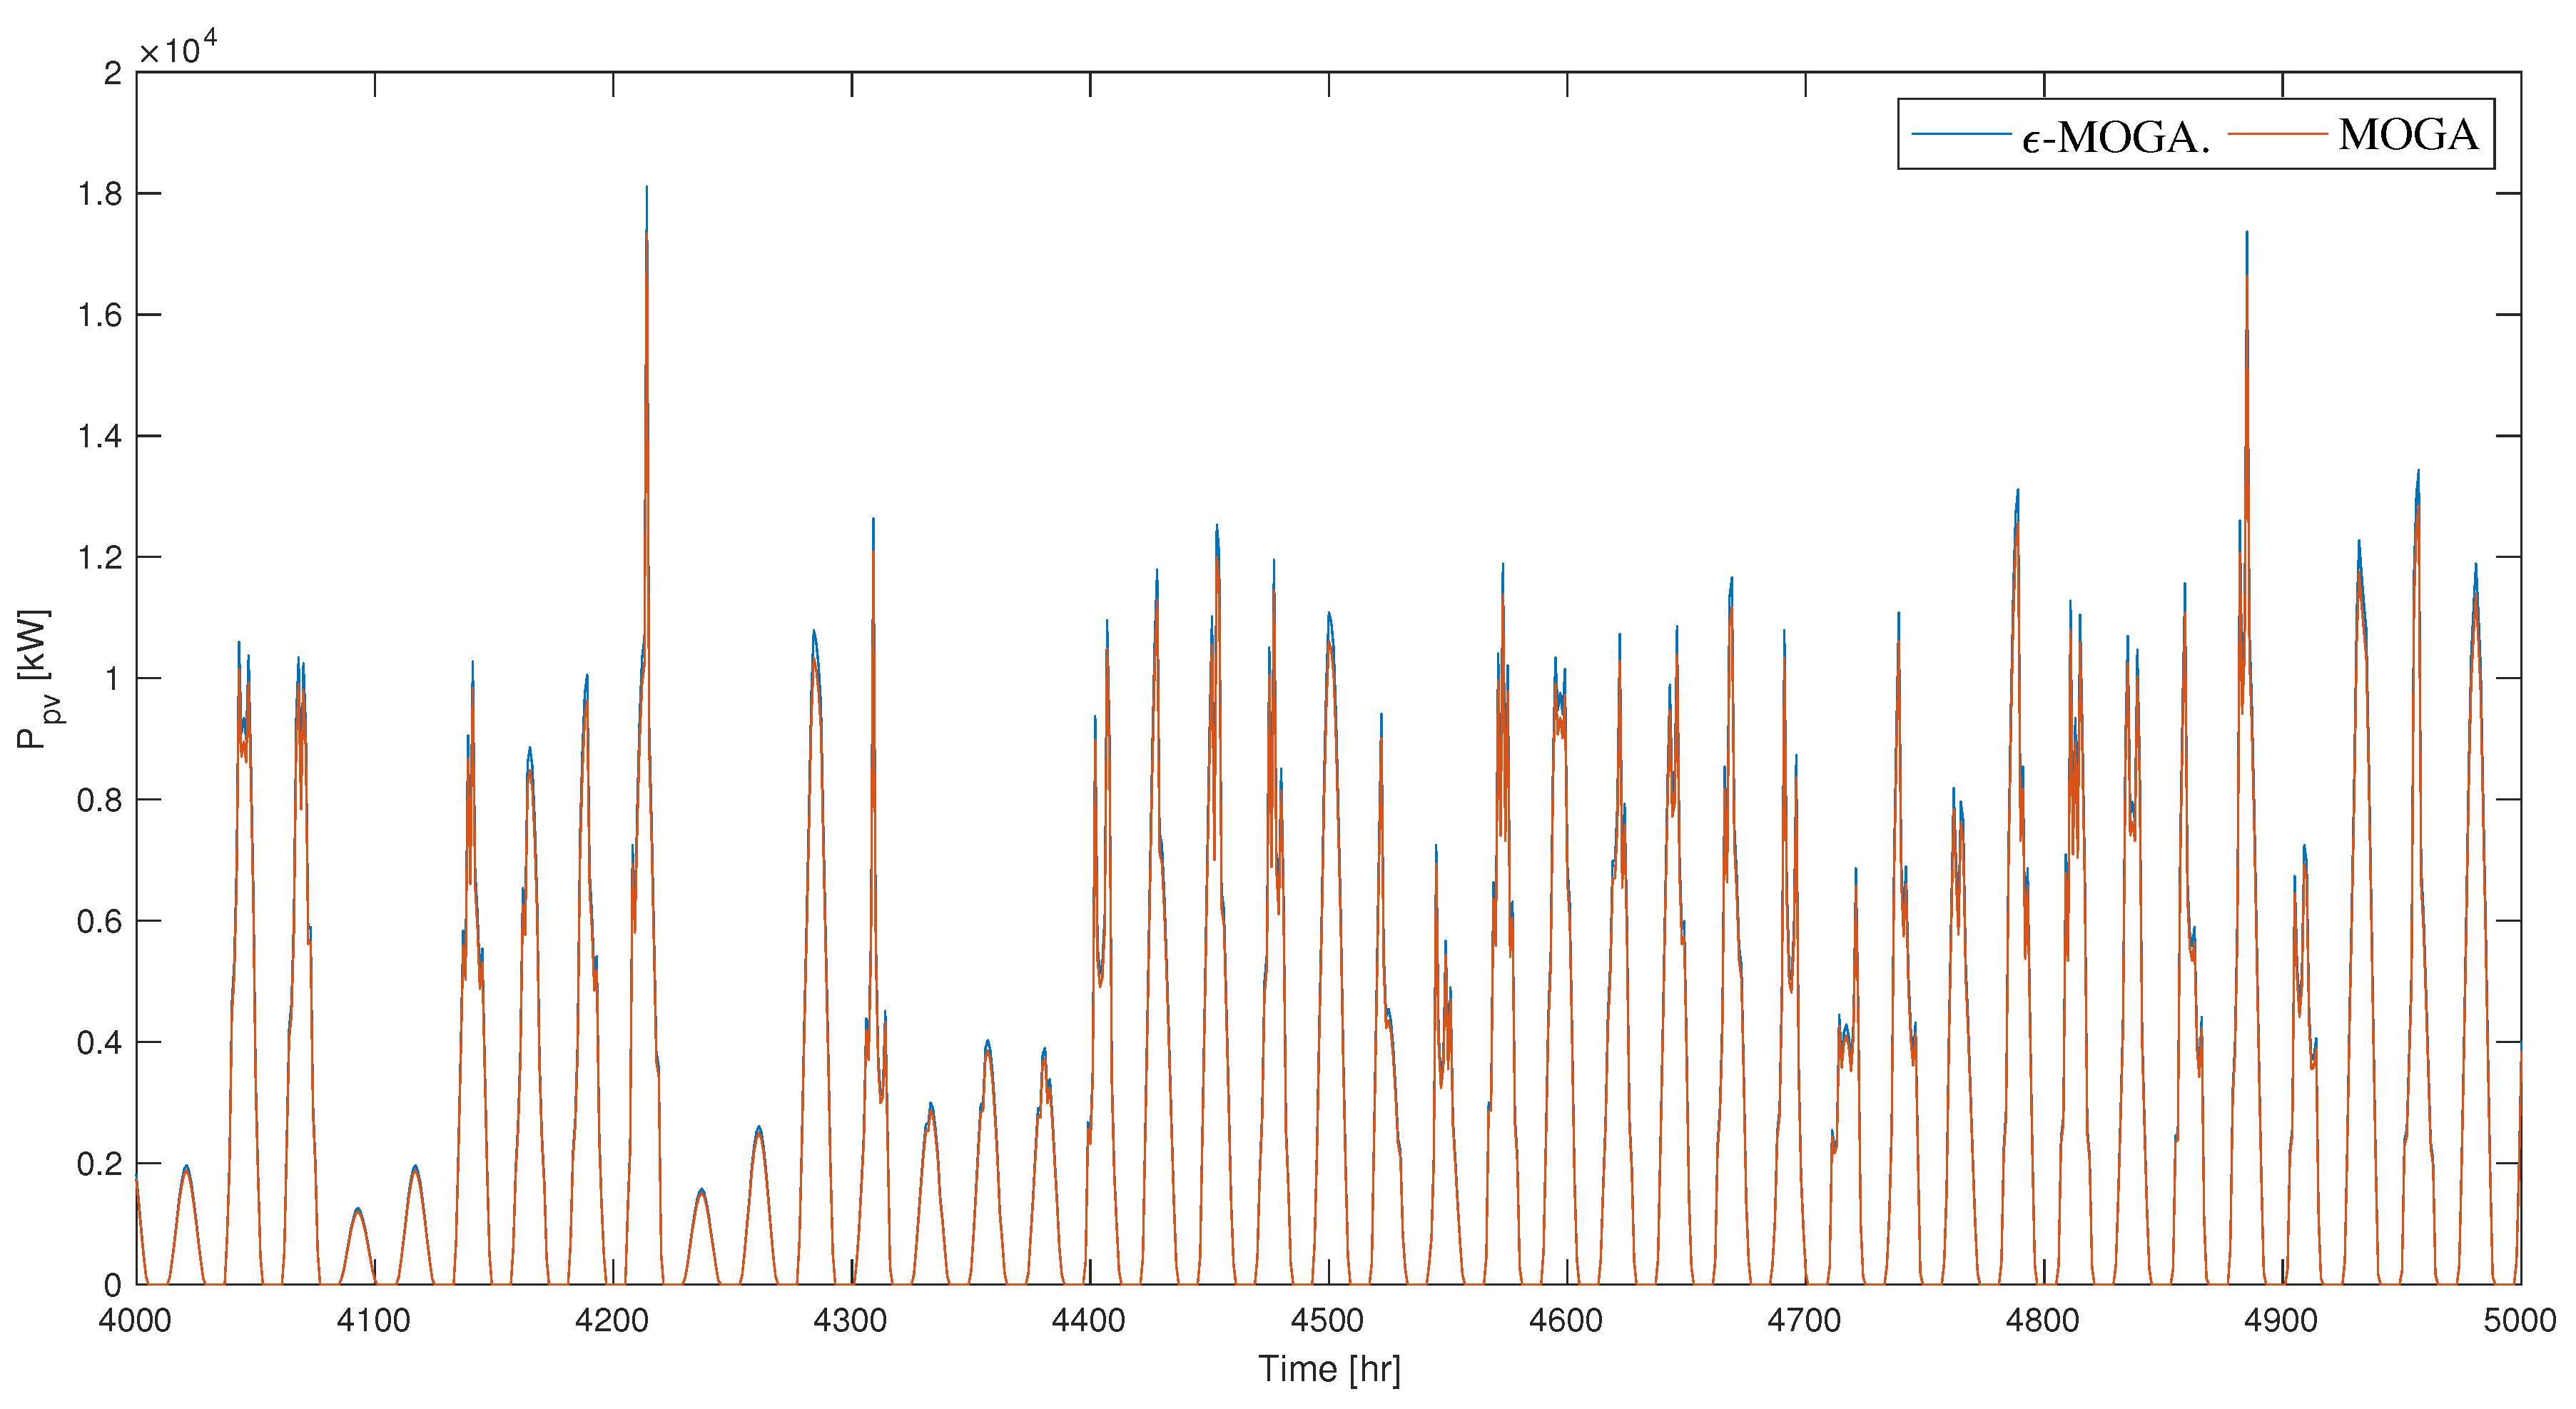
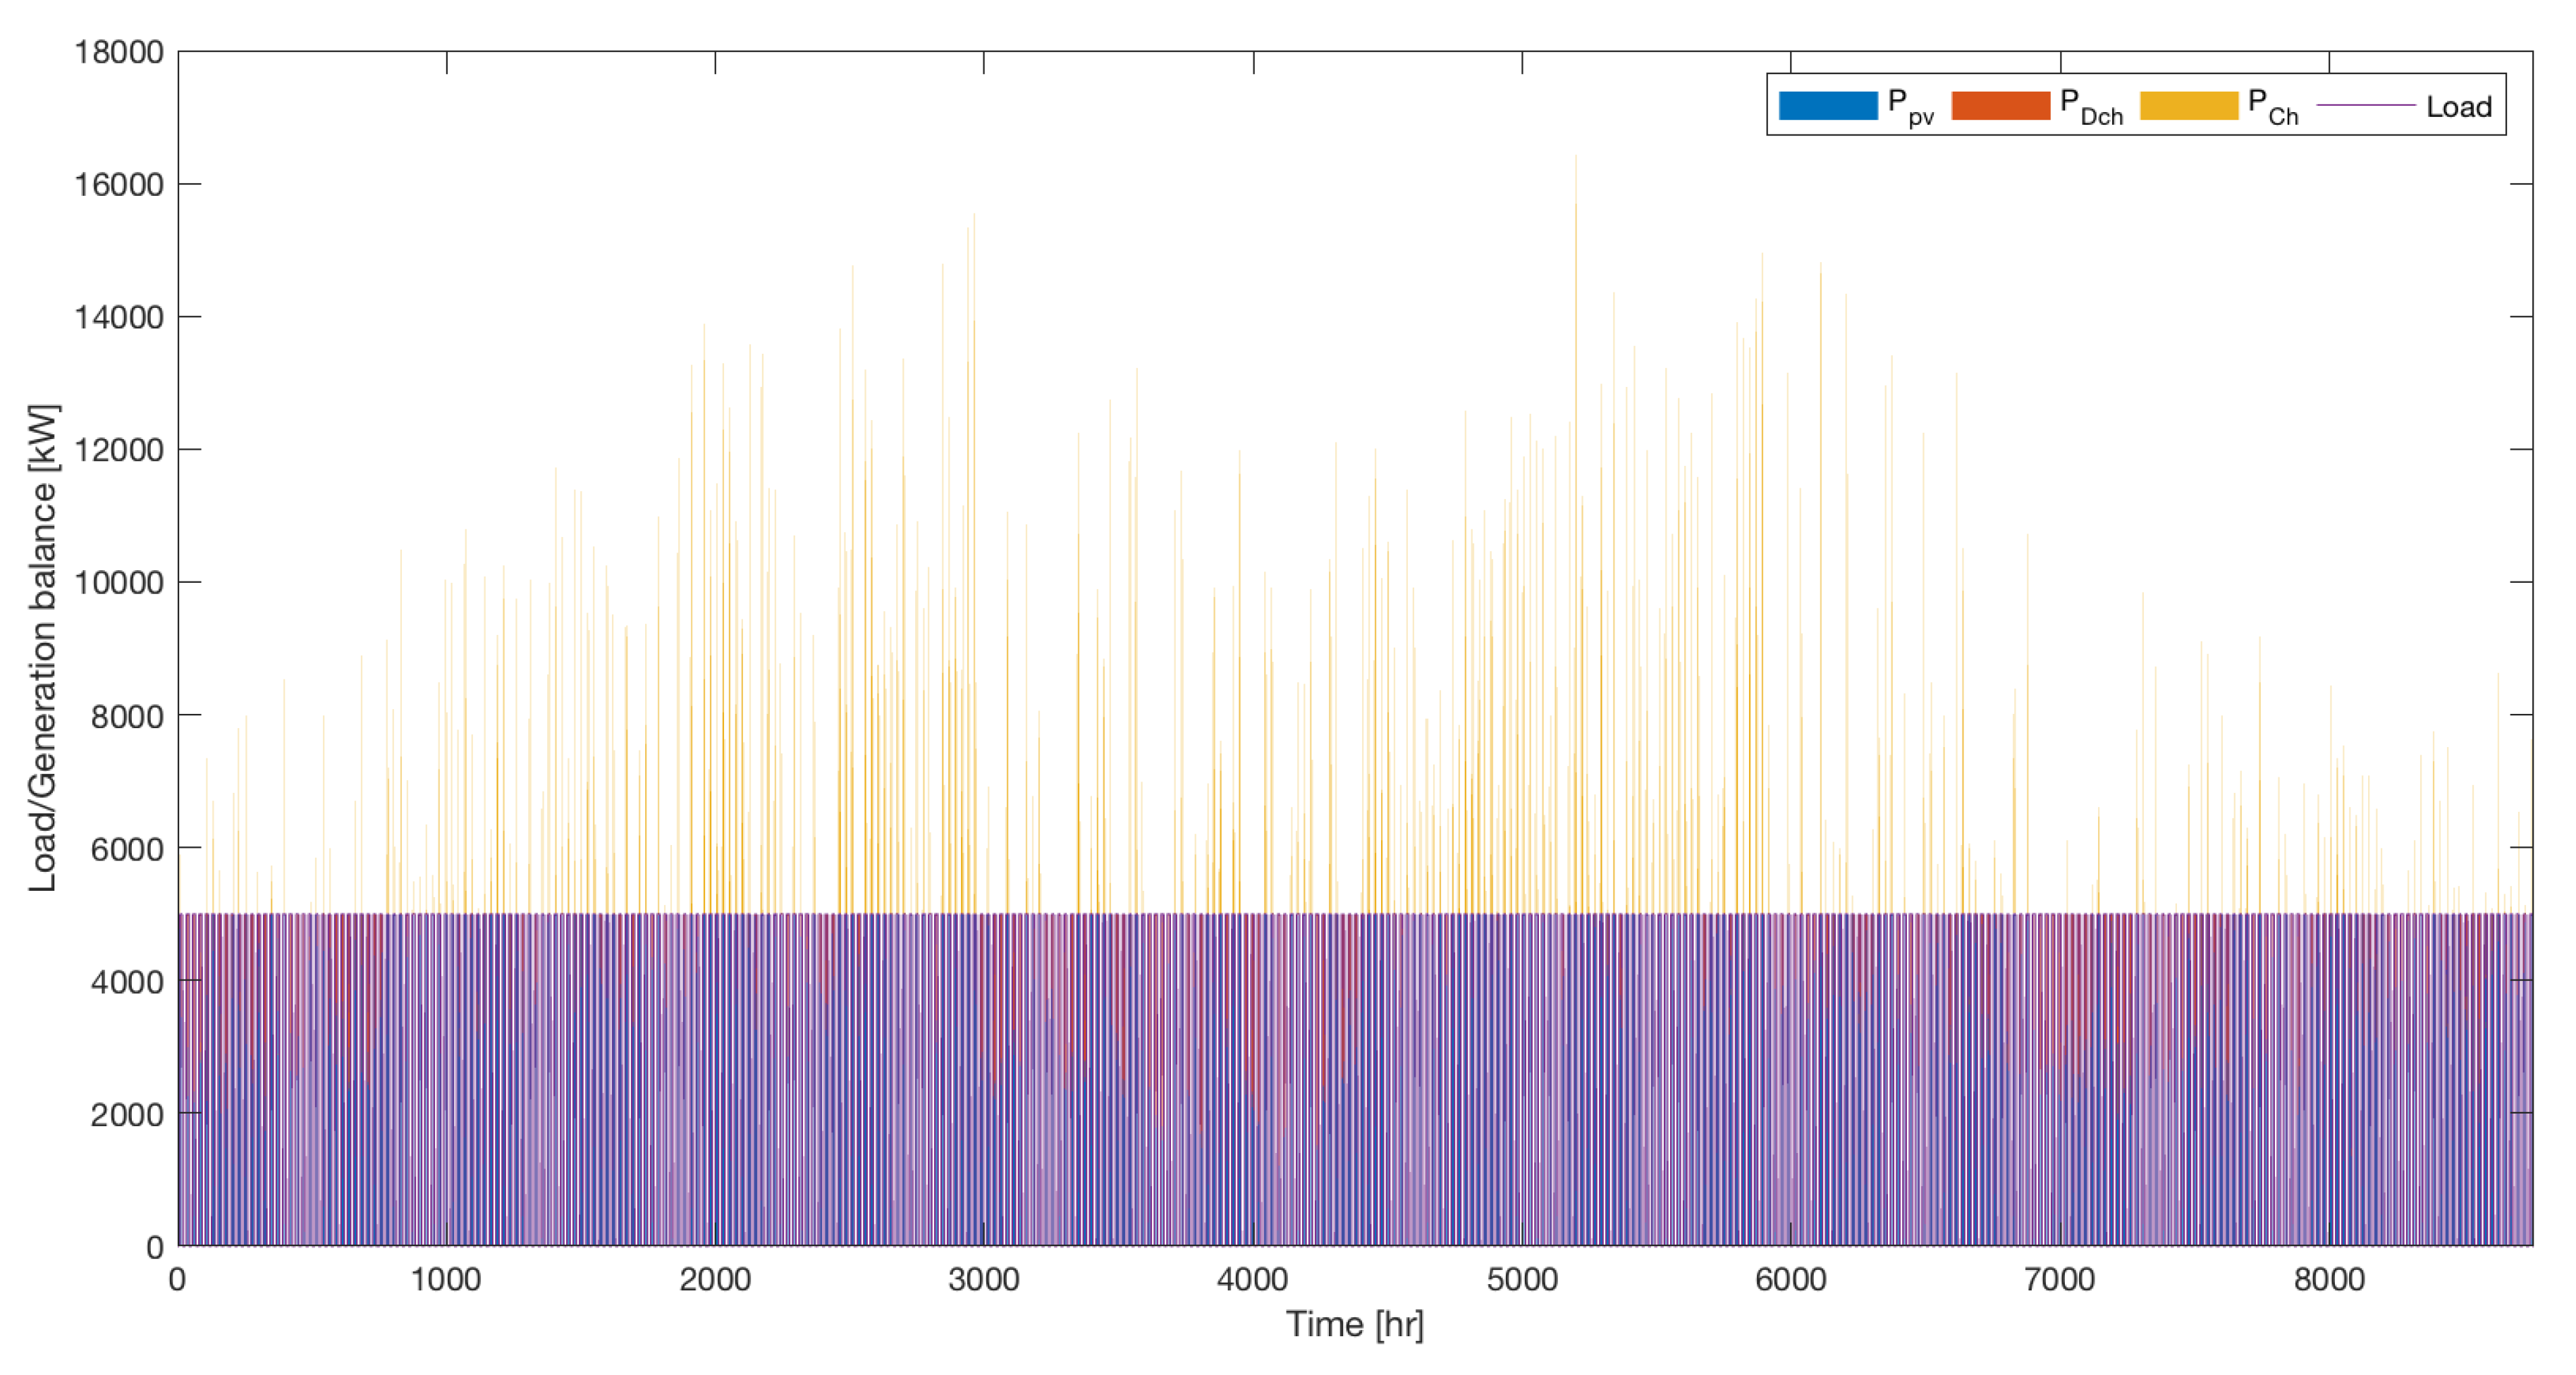
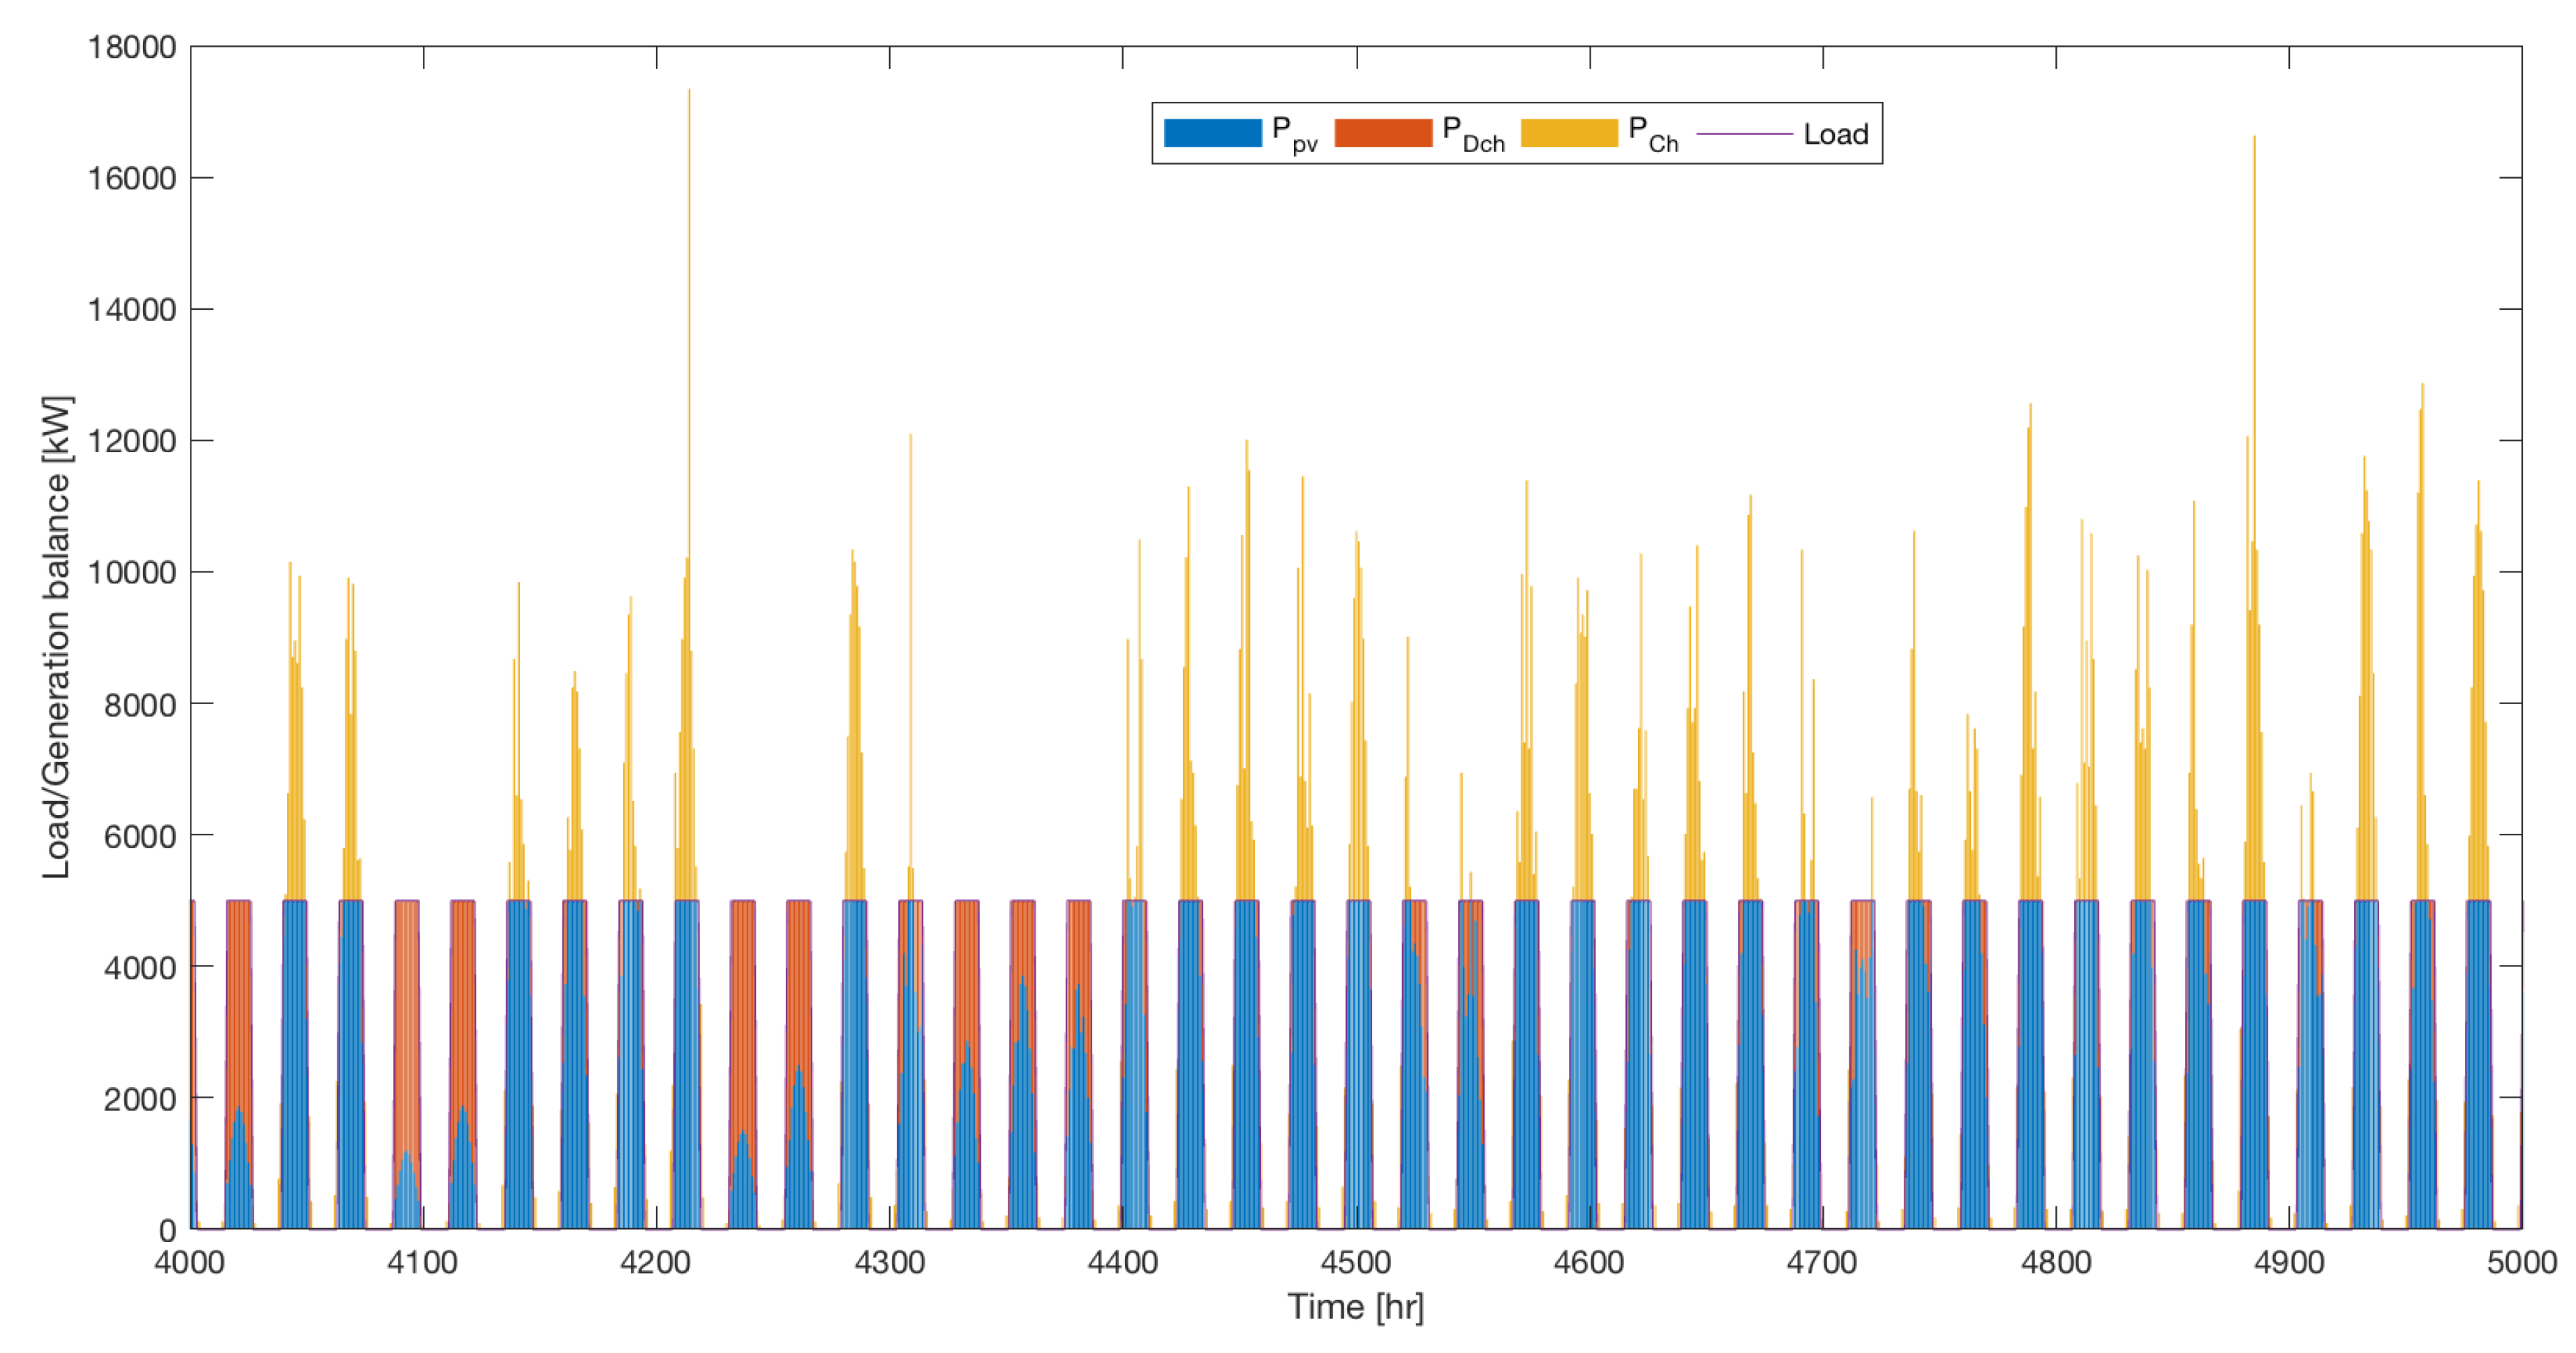
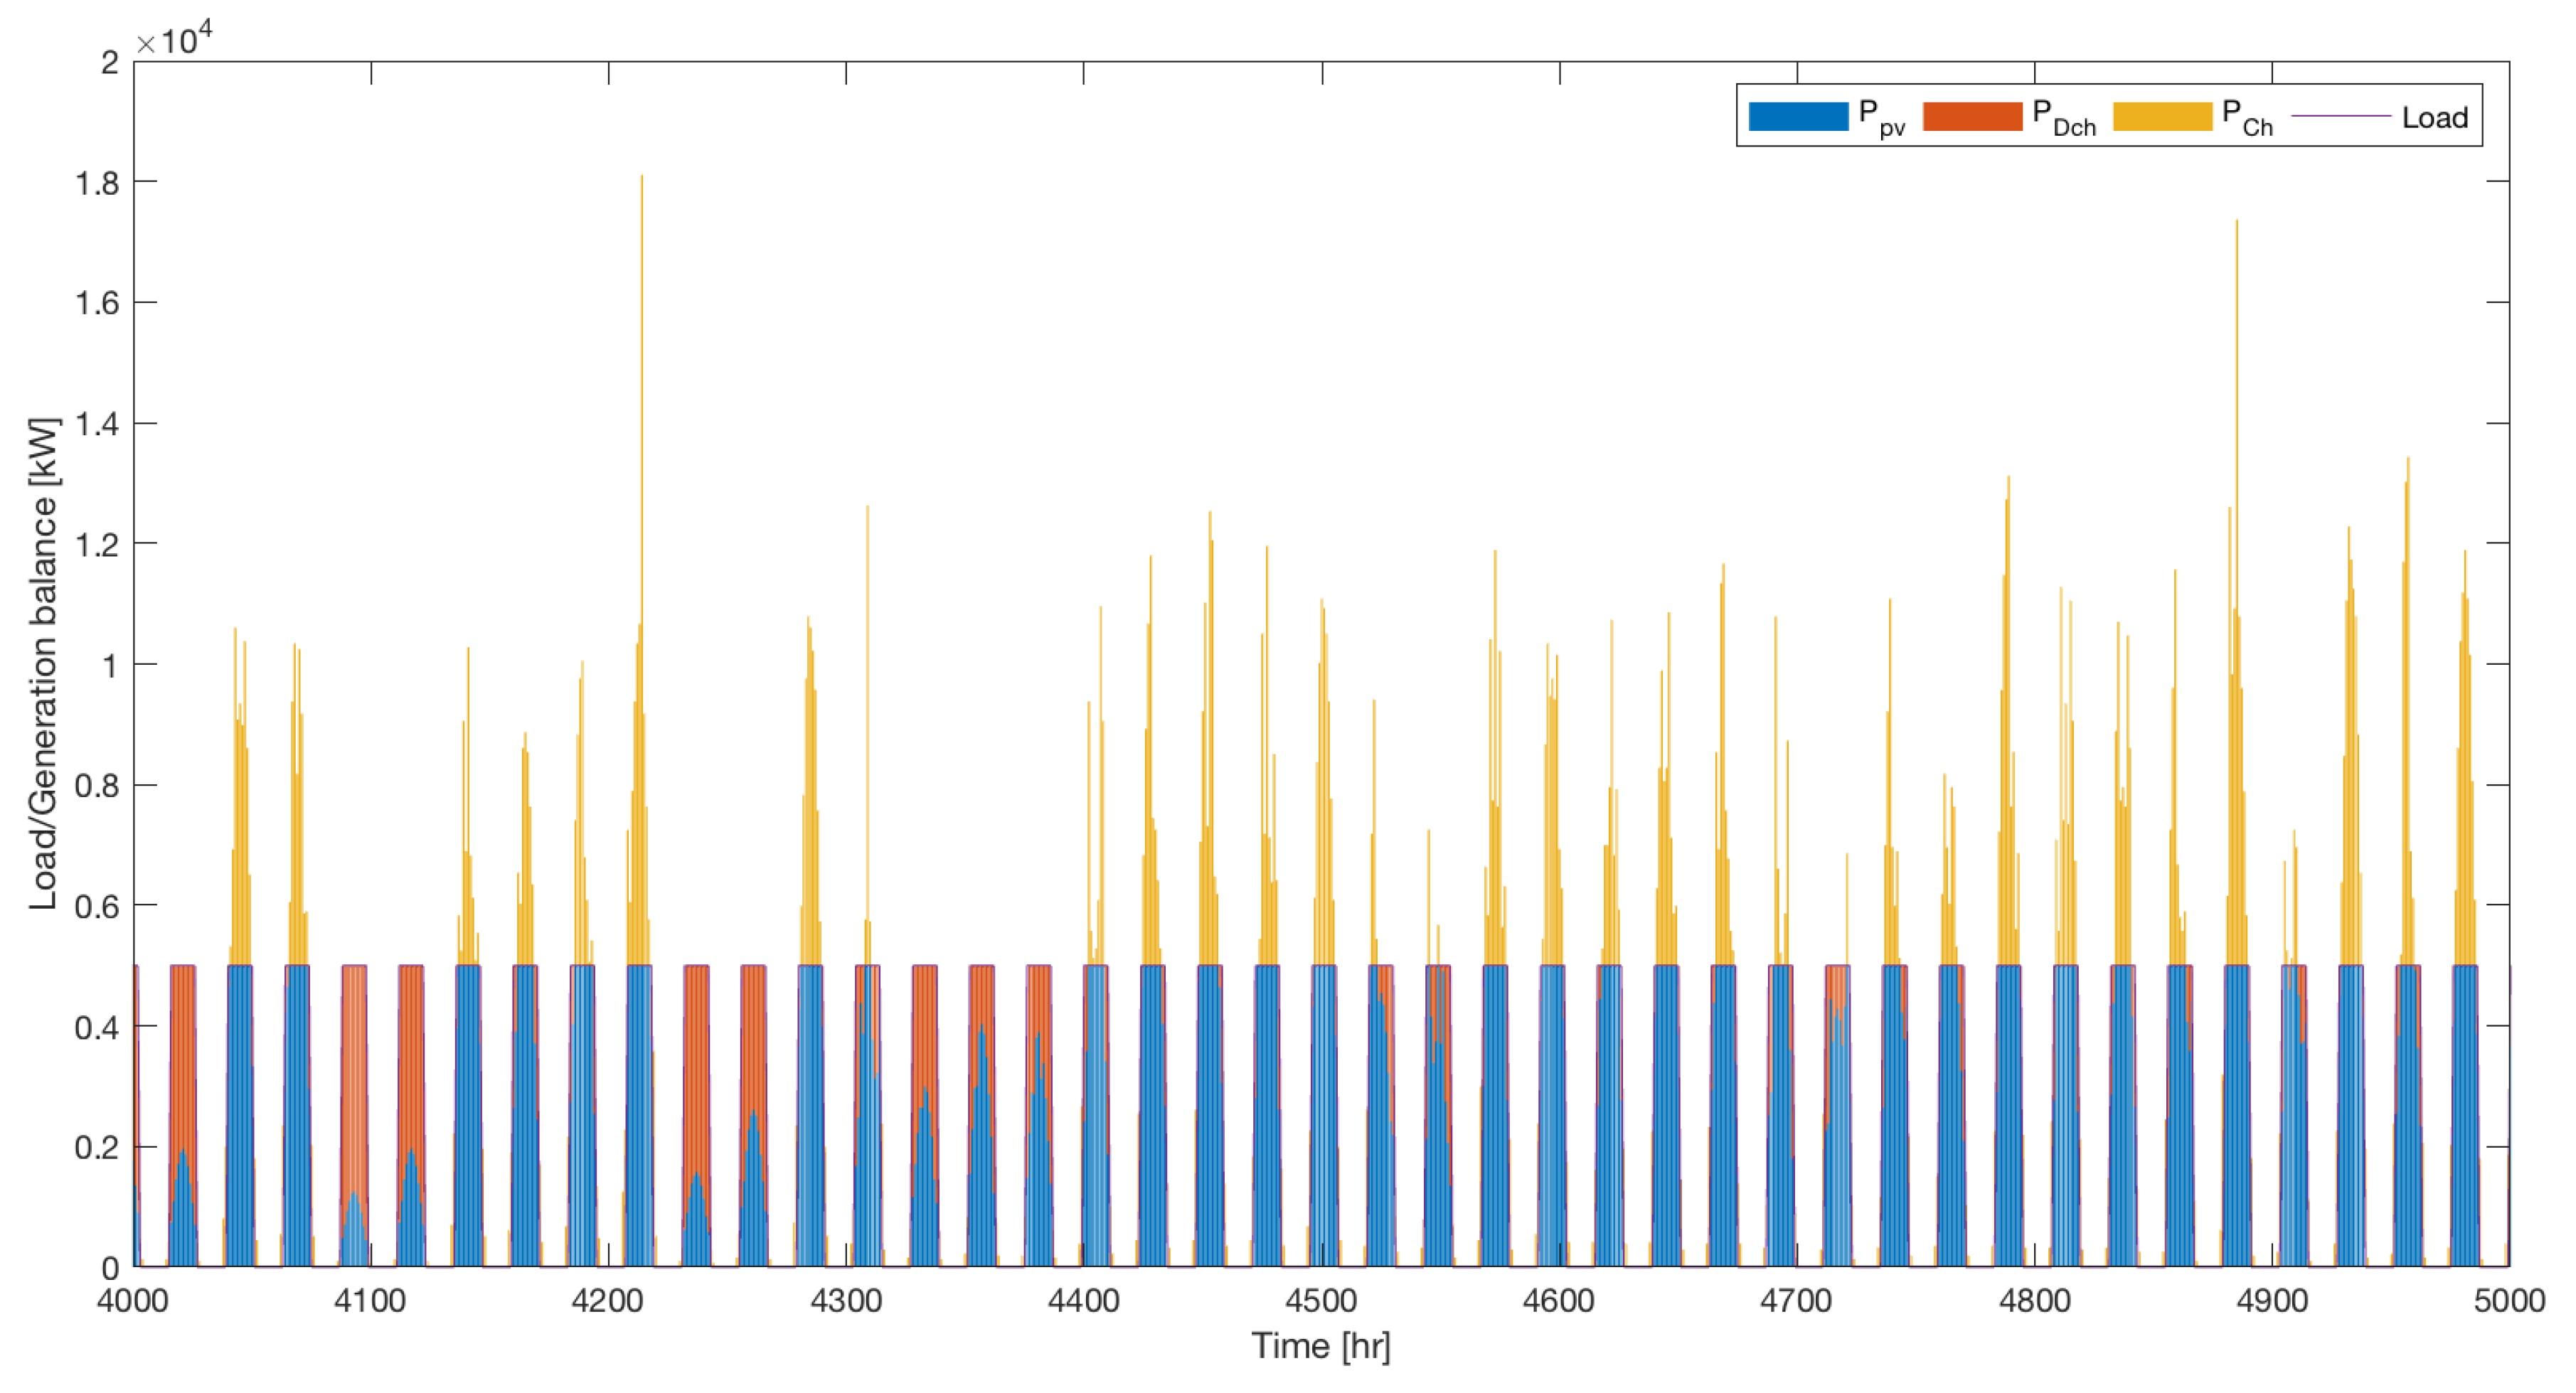
  • As shown in Figure 13, Figure 14, Figure 15 and Figure 16, ε -MOGA and MOGA control techniques can meet the whole year net load demand, considered in this research using 100% RE sources (PV and BESS). The proposed scheme decreases the dependency on conventional diesel generators, thereby minimizing their economic and environmental side effects. Moreover, the proposed park-and-ride strategy saves time and money for EV vehicle owners, thereby avoiding congestion in the crowded city centers.

6. Discussion

  • The simulation results confirm the capability of the proposed control scheme to feed the required number of EVCSs for 1000 EVs’ charging processes using %100 renewable energy sources. This action decreases the stress on the main power system grid, facilitates the EV users’ life, and at the same time decreases CO 2 emissions and their harmful environmental impact via using renewable energy sources.
  • The optimistic obtained results open the door for the proposed control approach to be applied all over China to mitigate dependency on conventional power plants.
  • The main obstacle that the proposed control scheme plan for using renewable energy sources to meet the EVCS demand faces is the availability of suitable areas in China to implement PV panels with proper solar radiation.
  • Depending on the achievement of the proposed methodology, the next points can be applied in future work:
    (a)
    Studying the effect of V2H, V2B, and V2G schemes on the proposed control approach.
    (b)
    Investigating the impact of other renewable energy sources’ implementation, such as wind turbine and fuel cell, on the performance of the proposed control scheme.
    (c)
    Studying the effect of applying various demand response programs such as real-time price, time of use, and critical peak power on the intended methodology performance from the economic and environmental point of view clarifying the gains of utility and customer.

7. Conclusions

This paper presents a modern multiobjective park-and-ride control scheme. The intended control approach’s aim to formulate and design EVCSs to charge 1000 EV’s using 100% renewable energy sources in presented by PV and BESS. By applying this methodology, EVs owners will drive their car from home to the EVCS during morning hours and then plug in the EV at 8 AM, then use public transportation facilities to reach their final destination. Then, at 6 PM, the EV’s owner will return to the EVCS and unplug the EV and drive home. The approach allows the EV owners to avoid a stressful drive along congested roads in search of costly parking centers. Moreover, congestion is reduced while utilizing public transportation facilities in urban cities. Fuxin, China is considered as a case study using a whole year’s data of solar radiation and load demand. Minimizing the load/generation mismatch and reducing the total life cycle cost are considered as the two objective functions. MOGA and ε -MOGA are used to obtain the optimal values of the PV area and number of BESS.
By investigating the simulation results, the ε -MOGA control scheme succeeds in having less load/generation mismatch and total life cycle cost by 44.8801% and 36.5741%, respectively, compared with the MOGA approach. The ε -MOGA methodology used more PV area and a smaller number of BESS compared with the MOGA scheme by 4.4034% and 37.85575%, respectively. The proposed park-and-ride approach will help the owners of EVs save time and money. Furthermore, it will contribute to decreasing traffic congestion by encouraging car owners to use public transportation in a crowded area. This will lead to a reduction in the number of cars used in city areas and thereby reduce greenhouse gas emission and lead to improved air quality by implementing the proposed scheme using 100% RE sources to avoid the economic and environmental effects of conventional diesel generators. This main point will also help to decrease CO 2 and its harmful environmental effect dramatically, especially in crowded industrial areas.

Author Contributions

Methodology, L.P. and T.S.; Resources, L.P.; Software, L.P.; Supervision, T.S.; Validation, T.S.; Writing—original draft, L.P.; Writing—review & editing, T.S. All authors have read and agreed to the published version of the manuscript.

Funding

This research received no external funding.

Conflicts of Interest

The authors declare no conflict of interest.

Nomenclature

P&RPark and Ride
ORNLOak Ridge National Laboratory
CBDCentral Business District
LBSLocation-Based Service
SWECSpatially Weighted Error Correlation
GTHAGreater Toronto and Hamilton Area
MILPMixed-Integer Linear Programming
V2GVehicle to Grid
V2HVehicle to Home
V2BVehicle to Building
EVElectric Vehicle
ICEVInternal Combustion Engine Vehicle
HEVHybrid Electric Vehicle
EV-DREElectric Vehicle-Distributed Renewable Energy
PVPhotovoltaic
RERenewable Energy
EVCSElectric Vehicle Charge Station
BESSBattery Energy Storage System
MOGAMultiobjective Genetic Algorithm
ε -MOGAEpsilon Multiobjective Genetic Algorithm
η P V PV panels efficiency
A P V Total area occupied by PV panels (m 2 )
S ( t ) Hourly solar radiation (kW/m 2 )
P L Power demand
P T Amount of total power
SOCState of charge
S O C ( t ) States of charge of the battery in time t
S O C ( t 1 ) States of charge of the battery in time t 1
σ Hourly self-discharge rate
η i n v Inverter efficiency
η b c Battery charging efficiency
η b d Battery discharging efficiency
S O C m a x Battery’s maximum state of charge
D O D Maximum depth of discharge
C b Battery bank’s nominal capacity
C i Initial cost ($/m 2 )
A p v Total area occupied by solar panels
β p v Yearly operating and maintenance cost ($/m 2 /year)
σ p v Interest rate
NLifetime of the system
μ p v PV reselling price ($/m 2 )
δ Inflation rate
N b Number of batteries
λ b Cost of kWh battery
C b Battery capacity
P g Power generation
P c / m Probability of crossing/mutation

References

  1. Shen, L.; Du, L.; Yang, X.; Du, X.; Wang, J.; Hao, J. Sustainable Strategies for Transportation Development in Emerging Cities in China: A Simulation Approach. Sustainability 2018, 10, 844. [Google Scholar] [CrossRef] [Green Version]
  2. China Association of Automobile Manufactures. China Automotive Industry Yearbook 2018; China Automotive Industry Yearbook House(CAIY): Tianjin, China, 2018. [Google Scholar]
  3. China Association of Automobile Manufactures. Bulletins of the Production and Sales of Automobiles in China. Available online: http://en.caam.org.cn/ (accessed on 15 September 2021).
  4. Moore, A.M.; Curran, S.J.; Lapsa, M.V.; Bittler, A.D. Geoanalysis of park-and-ride facilities for future laboratory-wide commuting program. Transp. Res. Interdiscip. Perspect. 2019, 3, 100025. [Google Scholar]
  5. Olaru, D.; Smith, B.; Xia, J.C.; Lin, T.G. Travellers’ Attitudes Towards Park-and-Ride (PnR) and Choice of PnR Station: Evidence from Perth, Western Australia. Procedia-Soc. Behav. Sci. 2014, 162, 101–110. [Google Scholar] [CrossRef] [Green Version]
  6. Seik, F.T. Experiences from Singapore’s park-and-ride scheme (1975–1996). Habitat Int. 1997, 21, 427–443. [Google Scholar] [CrossRef]
  7. Agarwal, S.; Koo, K.M. Impact of electronic road pricing (ERP) changes on transport modal choice. Reg. Sci. Urban Econ. 2016, 60, 1–11. [Google Scholar] [CrossRef]
  8. Chen, Z.; Xia, J.C.; Irawan, B.; Caulfied, C. Development of location-based services for recommending departure stations to park and ride users. Transp. Res. Part C Emerg. Technol. 2014, 48, 256–268. [Google Scholar] [CrossRef]
  9. Parkhurst, G. Park and ride: Could it lead to an increase in car traffic? Transp. Policy 1995, 2, 15–23. [Google Scholar] [CrossRef]
  10. Dijk, M.; de Haes, J.; Montalvo, C. Park-and-Ride motivations and air quality norms in Europe. J. Transp. Geogr. 2013, 30, 149–160. [Google Scholar] [CrossRef]
  11. Cairns, M.R. The development of Park and Ride in Scotland. J. Transp. Geogr. 1998, 6, 295–307. [Google Scholar] [CrossRef]
  12. Karamychev, V.; van Reeven, P. Park-and-ride: Good for the city, good for the region? Regional Sci. Urban Econ. 2011, 41, 455–464. [Google Scholar] [CrossRef]
  13. Gan, H.; Wang, Q. Emissions Impacts of the Park-and-Ride Strategy: A Case Study in Shanghai, China. Procedia-Soc. Behav. Sci. 2013, 96, 1119–1126. [Google Scholar] [CrossRef] [Green Version]
  14. Meek, S.; Ison, S.; Enoch, M. Stakeholder perspectives on the current and future roles of UK bus-based Park and Ride. J. Transp. Geogr. 2009, 17, 468–475. [Google Scholar] [CrossRef] [Green Version]
  15. Ando, R.; Yamazaki, M.; Haraand, M.; Izuhara, K. An Analysis on Feasibility of Park & Cycle Ride System in a Japanese Local City. Procedia-Soc. Behav. Sci. 2012, 54, 37–46. [Google Scholar]
  16. Ai, N.; Zheng, J.; Chen, X. Electric vehicle park-charge-ride programs: A planning framework and case study in Chicago. Transp. Res. Part D Transp. Environ. 2018, 59, 433–450. [Google Scholar] [CrossRef]
  17. Weiss, A.; Habib, K.N. Examining the difference between park and ride and kiss and ride station choices using a spatially weighted error correlation (SWEC) discrete choice model. J. Transp. Geogr. 2017, 59, 111–119. [Google Scholar] [CrossRef]
  18. Farhan, B.; Murray, A.T. Siting park-and-ride facilities using a multiobjective spatial optimization model. Comput. Oper. Res. 2008, 35, 445–456. [Google Scholar] [CrossRef]
  19. Gao, G.; Sun, H.; Wu, J.; Liu, X.; Chen, W. Park-and-ride service design under a price-based tradable credits scheme in a linear monocentric city. Transp. Policy 2018, 68, 1–12. [Google Scholar] [CrossRef]
  20. Kartika, R.U.S.; Ahyudanari, E. Analysis of the Possible Use of Park and Ride for Tram and Monorail to Facilitate The Air Travelers Based on Sub-District Area. Procedia-Soc. Behav. Sci. 2016, 227, 38–44. [Google Scholar] [CrossRef] [Green Version]
  21. Rusca, F.; Rusca, A.; Rosca, E.; Rosca, M.; Dinu, O.; Ghionea, F. Algorithm for traffic allocation when are developed park and ride facilities. Procedia Manuf. 2019, 32, 936–943. [Google Scholar] [CrossRef]
  22. Wang, J.; Wang, H.; Zhang, X. A hybrid management scheme with parking pricing and parking permit for a many-to-one park and ride network. Transp. Res. Part C Emerg. Technol. 2020, 112, 153–179. [Google Scholar] [CrossRef]
  23. Zhao, X.; Chen, P.; Jiao, J.; Chen, X.; Bischak, C. How does ‘park and ride’ perform? An evaluation using longitudinal data. Transp. Policy 2019, 74, 15–23. [Google Scholar] [CrossRef]
  24. Kepaptsoglou, K.; Karlaftis, M.G.; Zongzhi, L.I. Optimizing Pricing Policies in Park-and-Ride Facilities: A Model and Decision Support System with Application. J. Transp. Syst. Eng. Inf. Technol. 2010, 10, 53–65. [Google Scholar] [CrossRef]
  25. Collado, E.; Xu, E.L.; Li, H.; Cui, S. Profit maximization with customer satisfaction control for electric vehicle charging in smart grids. AIMS Energy 2017, 5, 529–556. [Google Scholar] [CrossRef]
  26. Lin, C.C.; Deng, D.J.; Kuo, C.C.; Liang, Y.L. Optimal Charging Control of Energy Storage and Electric Vehicle of an Individual in the Internet of Energy With Energy Trading. IEEE Trans. Ind. Inform. 2018, 14, 2570–2578. [Google Scholar] [CrossRef]
  27. Guo, D.; Zhou, C. Potential performance analysis and future trend prediction of electric vehicle with V2G/V2H/V2B capability. AIMS Energy 2016, 4, 331–346. [Google Scholar] [CrossRef]
  28. Corzato, G.; Secco, L.; Vitella, A.; Nagar, A.K.; Secco, E.L. E-Mobility: Dynamic mono-phase loads control during charging session of electric vehicles. AIMS Electron. Electr. Eng. 2018, 2, 37–47. [Google Scholar] [CrossRef]
  29. Eseye, A.T.; Lehtonen, M.; Tukia, T.; Uimonen, S.; Millar, R.J. Optimal Energy Trading for Renewable Energy Integrated Building Microgrids Containing Electric Vehicles and Energy Storage Batteries. IEEE Access 2019, 7, 106092–106101. [Google Scholar] [CrossRef]
  30. Keisuke, M.; Ryosuke, A.; Shinji, K.; Tsutomu, S.; Yoshinori, K.; Hideki, K. The eco-driving effect of electric vehicles compared to conventional gasoline vehicles. AIMS Energy 2016, 4, 804–816. [Google Scholar]
  31. Liu, J.; Zhong, C. An economic evaluation of the coordination between electric vehicle storage and distributed renewable energy. Energy 2019, 186, 115821. [Google Scholar] [CrossRef]
  32. Zhang, T.; Chen, W.; Han, Z.; Cao, Z. Charging Scheduling of Electric Vehicles With Local Renewable Energy Under Uncertain Electric Vehicle Arrival and Grid Power Price. IEEE Trans. Veh. Technol. 2013, 63, 2600–2612. [Google Scholar] [CrossRef] [Green Version]
  33. Bushur, A.; Ward, K.; Flahaven, T.; Kelly, T.; Jo, J.H.; Aldeman, M. Techno-economic evaluation of installing EV and PV combined infrastructure on Academic Institution’s Parking Garages in Illinois, USA. AIMS Energy 2019, 7, 31–45. [Google Scholar] [CrossRef]
  34. Jin, C.; Sheng, X.; Ghosh, P. Optimized Electric Vehicle Charging With Intermittent Renewable Energy Source. IEEE J. Sel. Top. Signal Process. 2014, 8, 1063–1072. [Google Scholar] [CrossRef]
  35. Quddus, M.A.; Kabli, M.; Marufuzzaman, M. Modeling electric vehicle charging station expansion with an integration of renewable energy and Vehicle-to-Grid sources. Transp. Res. Part E Logist. Transp. Rev. 2019, 128, 251–279. [Google Scholar] [CrossRef]
  36. Tahara, H.; Urasaki, N.; Senjyu, T.; Funabashi, T. EV charging station using renewable energy. In Proceedings of the 2016 IEEE First International Conference on Control, Measurement and Instrumentation (CMI), Kolkata, India, 8–10 January 2016. [Google Scholar]
  37. Konak, A.; Coit, D.W.; Smith, A.E. multiobjective optimization using genetic algorithms: A tutorial. Reliab. Eng. Syst. Saf. 2006, 91, 992–1007. [Google Scholar] [CrossRef]
  38. Jones, K.O. Comparison of genetic algorithm and particle swarm optimization. In Proceedings of the International Conference on Computer Systems and Technologies-CompSysTech’2005, Varna, Bulgaria, 16–17 June 2005. [Google Scholar]
  39. Herrero, J.M. Non-Linear Robust Identification Using Evolutionary Algorithms. Ph.D. Thesis, Polytechnic University of Valencia, Valencia, Spain, 2006. [Google Scholar]
  40. Laumanns, M.; Thiele, L.; Deb, K.; Zitzler, E. Combining convergence and diversity in evolutionary multiobjective optimization. Evol. Comput. 2002, 10, 263–282. [Google Scholar] [CrossRef]
  41. Herrero, J.M.; Reynoso-Meza, G.; Martínez, M.; Blasco, X.; Sanchis, J. A smart-distributed pareto front using the ev-MOGA evolutionary algorithm. Int. J. Artif. Intell. Tools 2014, 23, 1450002. [Google Scholar] [CrossRef]
  42. Herrero, J.M.; Blasco, X.; Martínez, M.; Sanchis, J. Multiobjective tuning of robust PID controllers using evolutionary algorithms. In Workshops on Applications of Evolutionary Computation; EvoWorkshops 2008; Lecture Notes in Computer Science; Springer: Berlin/Heidelberg, Germany, 2008; Volume 4974, pp. 515–524. [Google Scholar]
  43. Herrero, J.M.; Blasco, X.; Sánchez-Pérez, J.V.; Redondo, J. Design of sound phase diffusers by means of multiobjective optimization approach using ev-MOGA evolutionary algorithm. Struct. Multidiscip. Optim. 2016, 53, 861–879. [Google Scholar] [CrossRef] [Green Version]
Figure 1. Power system formulation.
Sustainability 14 08655 g001
Figure 2. MOGA flowchart.
Sustainability 14 08655 g002
Figure 3. Flowchart of ε -MOGA-based control scheme design process.
Sustainability 14 08655 g003
Figure 4. EVCS load demand.
Sustainability 14 08655 g004
Figure 5. EVCS zoomed load demand.
Sustainability 14 08655 g005
Figure 6. Solar radiation.
Sustainability 14 08655 g006
Figure 7. Zoomed solar radiation.
Sustainability 14 08655 g007
Figure 8. Pareto front.
Sustainability 14 08655 g008
Figure 9. MOGA PV output power.
Sustainability 14 08655 g009
Figure 10. ε -MOGA PV output power.
Sustainability 14 08655 g010
Figure 11. Zoomed PV output power.
Sustainability 14 08655 g011
Figure 12. Battery SoC.
Sustainability 14 08655 g012
Figure 13. MOGA load/generation balance.
Sustainability 14 08655 g013
Figure 14. Zoomed MOGA load/generation balance.
Sustainability 14 08655 g014
Figure 15. ε -MOGA load/generation balance.
Sustainability 14 08655 g015
Figure 16. Zoomed ε -MOGA load/generation balance.
Sustainability 14 08655 g016
Table 1. System input parameters.
System Parameters
Economical data
Interest rate ( σ p v )0.1
Inflation rate ( δ )0.04
Escalation rate0.075
Project lifetime20 years
Battery Energy Storage System
Hourly self discharge rate ( d h )0
Battery charging efficiency ( η b )90%
Battery discharging efficiency ( η d )90%
Nominal battery capacity200 kWh
Battery depth of discharge (DoD)0.5
Cost of kWh battery ( λ b )$200
Battery lifetime5 years
Photovoltaic Array
PV initial cost in $/m 2 (C i )519.7
PV yearly operation and maintenance cost ($/m 2 )0.01C i
PV reselling price ( μ p v )0.25/C i
PV efficiency ( η P V )14%
Inverter efficiency ( η i )1
PV lifetime25 years
Table 2. Optimized decision variables and objective functions.
ParametersMOGA ε -MOGA
PV Area (m 2 )220,456.5426230,164.2475
No. of BESS29,052.946818,054.7355
Load/Generation Mismatch (kWh)4.8576 × 10 7 2.6775 × 10 7
Total Life Cycle Cost ($)4.0679 × 10 9 2.5801 × 10 9
Publisher’s Note: MDPI stays neutral with regard to jurisdictional claims in published maps and institutional affiliations.

