Abstract
Understanding the hierarchy for consumers between different labels signaling various characteristics defining food sustainability is still an open question. A web survey was conducted in France to examine how providing different scores about the environment and/or nutrition could influence purchase intents for one pizza. 1200 participants were recruited in France in April 2021. They were asked about their purchase intents for one pizza, before and after seeing nutritional and/or ecological scores associated with colors going from green to red. A Global-Score synthetizing both nutritional and ecological dimensions was also tested. The results show that the appearance of scores and colors significantly affect the purchase intents for this pizza. Indeed, for each type of score (namely nutritional, ecological or global), the dominant effect comes from the reduction in purchase intents related to the red color, although green or yellow colors also change purchase intents but to a lesser extent. With the red color, the nutritional score leads to more significant decreases in purchasing intents than the ones related to the ecological score or the Global-Score. With an additional round, the appearance of another score complementing the alternative one underlines that the negative impact of the red color for one score on purchase intents is not outweighed by the positive impact of the green color for the other score.
1. Introduction
The sustainability of food systems appears as being a very acute question with many nutritional and environmental challenges for consumers, producers and regulators [1,2,3]. The thorny task consisting in promoting and reaching this sustainability is characterized by many hesitations regarding the choices of regulatory options, such as the numerous labels, the taxation of poor-quality food, the various subsidies for promoting quality, and/or the imposition of norms and minimum-quality standards [4]. Regarding food nutrition, the labeling solution based on the consumers’ freedom of choices often consists in promoting front-of-pack food labels, such as health star rating, warning label, or traffic light (TL) labeling [5]. Despite many studies, there is still a lot of uncertainty about the most efficient type of labels able to effectively influence consumers’ behavior [6,7,8,9]. A recent review found that TLs were effective for helping participants choose healthy food in only 5 of 12 studies [10]. Indeed, the effectiveness of nutrition labels in influencing consumers’ choices remains fragile, since it particularly depends on consumers’ awareness, media coverage and shopping environment.
Another important issue linked to TLs is the number of characteristics that should be signaled for foods, leading to two possible options between the multiple TLs providing specific rankings and related colors for the sugar content, the salt content and the fat content (…) on the one side, and the holistic TLs giving an overall color linked to an overall rating aggregating several components on the other side [11,12]. There is no panacea regarding the optimal option to select, and the ultimate choice depends on trade-offs between the possible information overload for consumers when characteristics are numerous under the multiples TLs, and the risk of oversimplification with an aggregation of characteristics under the holistic TLs [13]. This question of the type of TLs is particularly sensitive for the topic of sustainability encompassing many criteria related to nutrition, agronomy, environment, working conditions of farmers, animal welfare and/or social development [3].
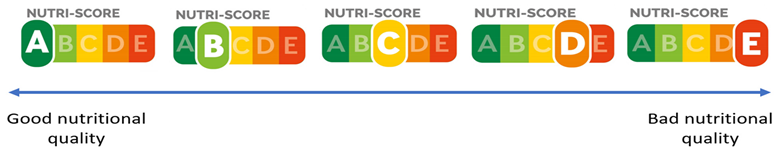
The recent French example particularly illustrates this debate of complex trade-offs between the different options for signaling both nutritional and environmental characteristics. In 2017, the Ministry of Health selected the Nutri-Score system as a reference for voluntary indicating nutritional quality for food companies. Based on an average of different nutritional criteria, this prescriptive system is a voluntary 5-color scheme allowing for the classification of foods into five categories with an overall score, based on five letters, namely A for the best nutrient profile to E for the poorest one, associated to colors going from green to red [14]. The five colors appear on the packaging, with a magnifying glass identifying the color and the letter assigned to the product.
Regarding the consumers’ choices, several studies with various experimental methodologies underlined some significant changes towards healthier foods coming from the Nutri-Score appearance in France, before the regulatory decision in 2017 [15,16], or after this decision [17,18]. Even if this Nutri-Score system was not mandatory for food companies, it was adopted by many French supermarkets and brands between 2017 and 2021, including the multinational Nestlé [19]. Along with this adoption of the Nutri-Score posted on packages, some producers reformulated the composition of their products for improving both nutritional quality and Nutri-score ranking [20]. This relative success of the Nutri-Score was also explained by the popularity of the Yuka App for smartphones, developing its own rating based on the Nutri-Score along with additional considerations about additives and organic labels [21]. However, some other French major food producers strongly contested the relevance of this Nutri-Score and refused to use it [22], which also limited a widespread adoption of the Nutri-Score by all producers and all retailers.
In this context of public debates about the Nutri-Score, a new project of regulation was examined by the French Parliament in 2021, in order to possibly impose a mandatory labeling system about the impact of food on the environment by 2023, even if there are many uncertainties about its future implementation [23]. At the time of the writing of this article, namely 2021, the form of this environmental labeling was not yet determined. A decision about the best framework would be taken in a near future by the Ministry of Environment (namely, the Ministère de la Transition Ecologique), based on a public study conducted by the French Agency for the Environment, called Ademe [24]. Under this scrutiny, 20 projects of labeling schemes were submitted by various associations to Ademe for determining which one would appear as the best system for guiding consumers [24].
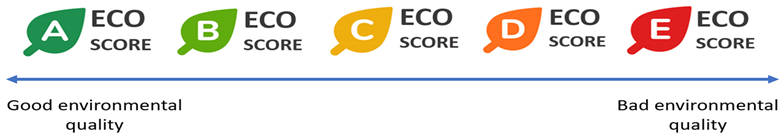
Among these 20 projects, the Eco-Score mechanism was submitted by Yuka and Open Food Facts, two popular websites, for being examined by Ademe [21,25]. This new system follows the Nutri-Score scheme with the five letters associated with colors depending on an average of various criteria [25]. This Eco-Score for each food was computed with a life cycle analysis (LCA) accounting for the CO2 emissions, along with bonuses and penalties including the modes of productions, the origins of ingredients, some threatened species, and the type of packaging. At the time of the experiment, April 2021, and before any official decision, the Eco-Score system was already available on the Yuka and Open Food Facts websites and some supermarkets planned to adopt it [21,25]. The framework of this prescriptive Eco-Score with five letters and five associated colors looks like the well-known Nutri-Score, which is an advantage in terms of basic knowledge of the system by consumers. In other words, the advantage of the Eco-Score comes from the similarity with the Nutri-Score benefiting from an established reputation, as shown in this paper, with 87% of participants who had already seen the Nutri-Score before replying to this Web-Survey (see the end of this draft).
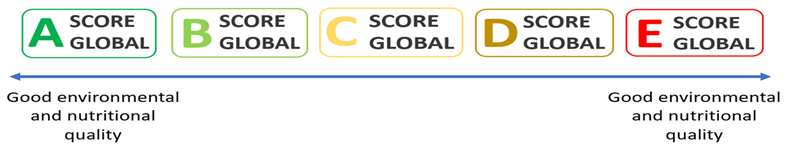
Alternatively, other mechanisms were submitted to Ademe, including the Note Globale based on one synthetic rating mixing up nutritional and environmental criteria, close to the Global-Score tested in the present paper [26]. At the time of the experiment, namely April 2021, many debates gained momentum about the relevance of such a new holistic TL focusing on the environment, with many open questions about the number of criteria to consider, such as the carbon footprint, the water footprint, the impact on biodiversity and the packaging (…), entering the overall rating aggregating these components. In this context, a study found that consumers seemed more sensitive to an environmental score classifying a basket of several foods than a classification for each product depending on a food-by-food basis [27]. Another study suggested that consumers seemed more sensitive to a colorful, prescriptive display with letters, close to the Eco-Score system [28].
At the time this paper was written, namely October 2021, and based on the scrutiny of these 20 submitted projects, a first report released by Ademe recommended the selection of a colorful and prescriptive system with five letters, very close to the Eco-Score framework, but based on an inter-category food ranking (namely, a ranking between different types of foods within diets, such as fruits, meat, …, pizzas) [29]. The five-letters scale could/should be complemented with a numerical value, which would express an aggregate-environmental score based on the intra-category food ranking (namely, a classification within a specific category of food, like the pizzas). A shortcoming of this double system combining the five letters and the numerical value for indicating the environmental impact is the risk of proliferation of TLs, with (1) the Nutri-Score, (2) this prescriptive system with five letters for the inter-category ranking, and (3) this aggregate-environmental value within a specific category of food (…). This proliferation of TLs can make inoperative science-based classifications of foods for many consumers. Beyond this Ademe report, the final decision about the framework should be taken by the French government in the next months. Whatever the final decision taken by the French government, this public choice regarding the environmental framework should try to thwart the endemic risk of eco-labels/TLs proliferation leading to consumer confusion about the environmental qualities of foods [30,31].
This paper aims to evaluate the role of both Eco-Score and Nutri-Score on participants’ purchasing intents for one hypothetical pizza that could take different scores, going from green to red. The objective of this study consists in understanding the hierarchy given by consumers between different scores signaling nutritional and environmental characteristics defining sustainability.
The web survey was conducted in France in April 2021 with 1200 participants, split under different treatments for understanding how different scores could influence consumer purchase intents. The framework (i.e., the form of the logo) was similar for both Nutri- & Eco-Score, allowing for the classification of food products into five classes with an overall score, based on 5 letters A, B, C, D, E, with related colors, going from green for the best quality to red for the poorest quality. A Global-Score with also 5 letters/colors and synthesizing both nutritional and ecological dimensions was also tested for a subgroup of consumers. These different scores with a similar framework were introduced as indicators of various possible qualities of the pizza, without precisely detailing all the criteria taken into account for defining these qualities. We did not refer to any real products for being flexible regarding the colors’ distribution and their relative impacts. The revelation of different scores was the only variation between the different rounds. A within-subjects split study design was used: purchase intent was evaluated before and after each participant successively received Nutri-Score and Eco-Score under different orders.
This study focused on a pizza, a product characterized by significant variations in intra-category rankings for both scores, as observed with sales in France. We chose to employ a web survey in this study, because it allowed a strict control regarding the appearance order of various TLs, with a balanced repartition of possible colors, including the red color, a condition harder to satisfy in real-life conditions, such as in a supermarket.
Previous studies focusing on TLs have often addressed the question of the best type of front-of-pack nutritional labeling, including health star ratings, warning labels, or TLs [10,12,32,33]. In this web survey, we chose instead to look at a single type of framework, namely a prescriptive and holistic score with five letters and five associated colors, in an attempt to understand the consumers’ priorities between different criteria related to sustainability. This study provides new insights into how consumers/everyday citizens view the ranking between nutritional and ecological dimensions appearing with a similar framework. We use a similar hypothetical pizza with different scores/colors for different characteristics allowing a rigorous comparison of various effects coming from TLs.
Moreover, this present study provides insights into how consumers/everyday citizens value the environmental impact of the label related to food, as it was previously studied by various contributions [28,34,35,36]. However, our work differs from these previous studies because it focused on choices related to the Eco-Score, but in a context in which the Nutri-Score highly matters. We characterize the valuations of environmental characteristics relative to the valuations of nutritional characteristics. Moreover, we are able to characterize situations with conflicting information for the same product, namely a positive score with a green color associated with an alternative negative score with a red color.
2. Material and Method
This section successively details the sample selection, the product, the mechanism for determining purchase intents, the revealed information and the methodology for analyzing data. An overview of questions asked in the web-survey is presented in Appendix A. The web-survey was calibrated for lasting 12 min, on average, and for limiting the attention declines by participants.
2.1. The Sample Recruitment
The web-survey was conducted by a private company, Ifop, in France, in April 2021. The sample consisted of 1200 consumers aged between 18 and 70 years for being representative of the France population based on quotas for sex, age and income. For quotas by income, the distribution was divided into three categories respectively covering the lower four deciles, the central two deciles and the upper four deciles of the income distribution in France.
2.2. The Product
After 10 initials questions without any reference to pizzas or scores (see Appendix A), purchase intents for one pizza without and with scores were elicited using a single bound dichotomous choice question. Regarding the real variability of ratings/colors linked to Nutri-Score and Eco-Score, the pizzas sold in France exhibited a lot of variability in the ratings as shown in Table 1. Indeed, pizzas sold at the time of the experiment were mainly divided across three categories related to the following ratings, namely B/Green, C/Yellow and D/Red. We decided to keep these three “realistic” ratings for the revelations to participants, rather than considering the extreme A/green and E/red that only concerned a minority of pizzas sold at the time of the experiment.

Table 1.
Share of ratings with the Nutri-Score and the Eco-Score for sold pizzas in France at the time of the experiment, April 2021.
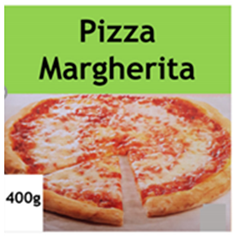
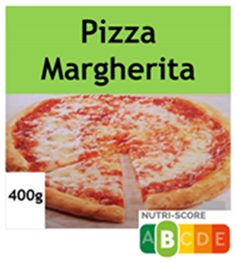
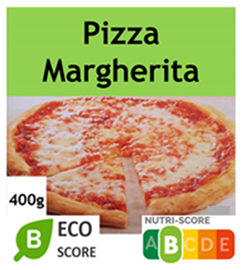
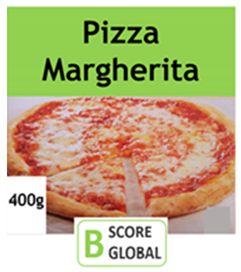
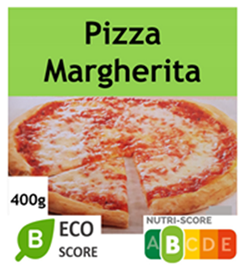
The main objective of this study was to measure the purchase intents for pizzas and how these choices were swayed by environmental and nutritional scores varying across participants (as explained below). A picture of the same pizza was shown at rounds #1, #2 and #3 focusing on these purchase intents (see Appendix B). At each round, we presented the same simplified packets of the most consumed pizza, namely the Margherita pizza (see Figure 1). We did not mention any brand or specific label, for keeping a common and generic aspect of the product.
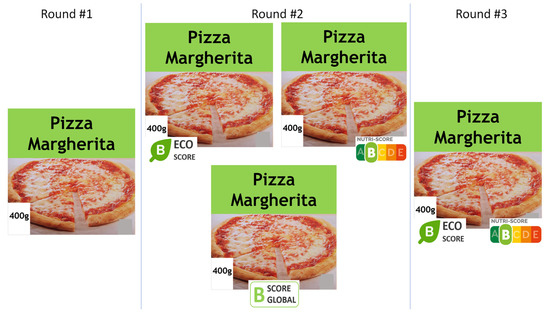
Figure 1.
Picture presented at each round. Note: Different possibilities of score presented at round #2. Whatever the color, a given type of score was still located at the same location on the package.
2.3. Purchase Intents for One Pizza
The initial explanations at round #1 (as shown in Appendix B) introduce the product and the mechanism for determining the purchase intents.
During the successive rounds #1, #2 and #3, participants had to answer if, at a given price P, they would purchase the product. They had to reply either “Yes”, “No”, or “Maybe” (see Appendix B). For each participant, the randomly assigned price P was the same for rounds #1, #2 and #3, but this price varied among participants divided into two subgroups of equal size. In order to account for price diversity, the values of the possible prices P = {€2,€3} were close to values observed in supermarkets at the time of the online survey. We elicited hypothetical choices and no real product was given or sold at the end of the web-survey. Despite the risk of hypothetical and upward biases of choices, the web-survey is a tool for studying consumers’ intentions with a satisfying control of the revealed information. The within subject-design of the online experiments allows us to assess the impact of the new score(s).
With a choice between the options “Yes”, “No”, or “Maybe” (see Appendix B), this mechanism is particularly appropriate for measuring the impact of revealed information with heterogeneous consumers. Such a simple question allows getting purchase intents for a generic product at realistic and credible market prices. This mechanism differs from a mechanism with differentiated products (and various characteristics) as estimated with a discrete choice experiment [36], and from a mechanism without any reference to market prices as a 7-point Likert like scale with 1 meaning “I do not intend to purchase” to 7 meaning “I strongly intend to purchase” [9]. Compared to these alternative mechanisms, the impact of the appearance of a new score is clearly evaluated with our simple mechanism focusing on one generic pizza. The option “maybe” in the list underlines some improvements coming from a possible uncertainty related to the “Yes” answering option into estimation of the logit model [37,38].
2.4. Nutri-Score, Eco-Score or Global-Score at Rounds #2 and #3
To measure the effect of information, a within-subject design was used. Round #1 was organized without any TLs as shown on the left of Figure 1. At the beginning of rounds #2 and #3 and depending on the subgroup with a specific score and a specific color, each score was introduced with two successive screens (see Appendix B). More precisely, at each of these rounds, a first screen was explaining the specific score and how it was designed with a short message. This screen was blocked for 10 s before it was possible to go to the next page for indicating purchase intents. On this second page focusing on the purchasing intent, this score with a specific color was appearing at the bottom of the pizza picture as shown in the middle of Figure 1 for round #2, and at the bottom of the pizza picture with the two scores as shown on the right of Figure 1 for round #3.
Regarding the possible scores, the design tried to reflect the diversity of scores shown in Table 1 by selecting various combinations of B/Green, C/Yellow and D/Red for the Nutri-Score, the Eco-Score and/or the Global-Score. Table 2 shows that the different letters and colors (B/Green, C/Yellow and D/Red) and the different types of scores (Nutri-Score, Eco-Score and Global-Score) were controlled by equally varying these parameters across 15 randomly selected subgroups of participants, creating all possible combinations of scores and colors.
Table 2.
15 subgroups receiving different scores with different colors.
Table 2 exhibits the 15 subgroups with different combinations of scores and colors. In round #2, the first appearance concerned the Nutri-Score for one third of participants, the Eco-Score for one third of participants and the Global-Score (namely “Score Global” in French) for one third of participants. At the bottom of Table 2, the Yellow Global-Score was presented in three subgroups at round #2, since this Yellow color averages both other scores corresponding to three subsequent combinations shown in round #3, namely (1) one Green Nutri-Score and one Red Eco-Score, (2) one Yellow Nutri-Score and one Yellow Eco-Score and (3) one Red Nutri-Score and one Green Eco-Score.
Round #3 considered the appearance of the new score compared to round #2, allowing us to appreciate how the combination of different scores influences purchase intents. For the third of participants with the Global-Score at round #2, round #3 revealed the colors of corresponding Nutri-Score and the Eco-Score at the origin of the average leading to this Global-Score.
The design of Table 2 allows testing parameters impacting the purchase intents, namely the different types of scores, the different colors, the appearance of several scores in round #3, and the price with two different values of price P = {€2, €3} equally divided inside each subgroup of 80 participants.
2.5. Data Analysis
Data analyses were performed using R software. We looked at some descriptive statistics of purchasing intents and perceptions regarding labels.
We also used econometric estimators to analyze purchase intents. We examined the impact of scores by pooling the participants’ choices for the pizza with sometimes two specific stages of choices, or with the complete three stages of choices, depending on the specific question we want to study. The econometric work focuses on the choices “Yes” or alternatively “No” and “Maybe” gathered together as a single possibility. They correspond to qualitative variables and are estimated with a logit model. In other words, the logit model explains the choice “Yes” expressing a clear choice. We, therefore, considered the logit estimator with random effects, which describes the relationship between the dependent variable y i {\displaystyle y_{i}} and the independent variables. Given that each participant indicated purchasing intent twice (or three times) when choices were pooled, errors related to these variables were potentially correlated for each participant, explaining the random effect imposing constraints on the structure of the variance-covariance matrix. We used the R package pglm that approximates the likelihood function via a Gauss–Hermite quadrature [39].
Two types of models were considered regarding the explanatory variables. Model 1 only retained variables strictly linked to the indications of purchase intents, namely the price, whether purchase intent was measured before or after the revelation of information and the type of scores. In model 1, we took into account the price P, and the dummy variables (DV) equal to 1 for the round of information, the type of score and the color shown to participants (and 0 otherwise). These DV equal to 1 or 0 are described for each table. Model 2 sometimes considers the previous variables and explores the possible sway of participants’ perceptions and socioeconomic characteristics. We tested the impact of these variables, and we only report regressions with the perception and socio-demographic variables having a significant impact on avoiding cluttering. When these variables do not significantly impact the choice, we re-run final regressions without these variables. We now turn to the results.
3. The Results
We start by presenting the purchase intents for pizzas, which was a central part of our questionnaire. Table 3 presents the percentages of purchase intents for the pizza before (round #1) and after the first appearance of one score (round #2) with a specific color. Some colors were not reported for saving space, because they simply confirmed the initial intent chosen at round #1, as the green color that did not change the previous choice “Yes” at round #2, or the red color that did not change the previous choice “No” at round #2.
Table 3.
Purchasing intents at round #1 and impacts of the first appearance of scores on purchasing intent at round #2.
The top of Table 3 underlines that one third of participants were ready to purchase this specific pizza at the initial round without any score. This result suggests that the hypothetical bias related to a non-consequential questionnaire seems limited, with “realistic” percentages of “Yes”, “No” or “Maybe”.
The rest of Table 3 focuses on reactions to the scores with different colors, by distinguishing among the different replies at round #1 presented in the first column. For the Nutri-Score, the Eco-Score, or the Global-Score, the dominant effect comes from the reduction of purchase intents for pizza related to the Red color. For the participants who initially replied “Yes” at round #1, the appearance of the Red color leads to an important share of participants turning to the “No”, with a stronger effect for the Nutri-Score (49%) compared to the Eco-Score (35%) and the Global-Score (40%). Still, for these participants replying “Yes” to round #1, the Yellow color appearing at round #2 also leads to changes towards the “No” or the “Maybe”, but with a smaller impact compared to the ones related to the Red color.
For the participants who initially replied “Maybe” at the first round (middle of Table 3) and for each type of score, the impact of the Red colors on the number of participants switching to the “No” is higher than the impact of the Green color on the number participants switching to the “Yes”, whatever the type of scores. However, the Green color has an impact equal to 21%, 24%, or 29% for the respective scores on the number of participants turning to “Yes”. The Yellow color leads to a shift towards “No”, but again with a smaller impact compared to the one of the Red color.
Eventually, for the participants who initially replied “No” to the first purchase intent (bottom of Table 3), the appearance of the green color only leads to a relatively small share of participants turning to the Yes, respectively 7% for the Nutri-Score, 3% for the Eco-Score and 14% for the Global-Score. Eventually, it is possible to note that, for both initial replies Maybe or “No” at the first round, the Green Global-Score seems to lead to a higher percentage of shifts towards the “Yes” than the green Nutri-Score and green Eco-Score.
For studying the statistical significance of these various impacts coming from the different scores initially appearing at round #2, the econometric estimations of purchase intents are presented in Table 4. We first examined the impact of the price and scores appearing at round #2, by pooling the participants’ choices at rounds #1 and #2 (see explanations in Section 2.5). The model estimates the probability of saying “Yes” versus the two other alternatives, namely “No” and “Maybe” gathered together. For the independent variables, dummy variables (DVs) are indicated by the following notation (1/0), meaning that the variable is equal to 1 for the corresponding characteristic at round #2 and 0 otherwise. For instance, the DV “Green Nutri-Score” in Table 4 is equal to 1 for the subgroups seeing this score at round #2 and 0 otherwise. Each DV equal to 1 measures the impact of one score and one color at round #2, versus a case with no score at round #1.
Table 4.
Estimations of purchase intents at rounds #1 and #2 with random effects logit estimator.
Table 4 confirms the results of Table 3 with many significant impacts of scores indicated by *, ** and ***. Prices negatively influence the purchase intents of products, with a negative coefficient for models 1 and 2. For each type of score (namely nutritional, ecological, or global), the dominant effect comes from the reduction in purchase intents for pizza related to the red color, although green or yellow colors also change purchase intents, but to a lesser extent. For the same score, coefficients in absolute value are higher with the Red score compared to the other colors. For instance, if we restrict our attention to the Eco-Score with model 1, the absolute value of the negative coefficient for the Red color, −2.99, is higher than the absolute value of the negative coefficient for the Yellow color, −1.35, and higher than the positive coefficient for the Green color, 0.72. Moreover, with the Red color, the Nutri-Score leads to a more significant decrease in purchasing intents than the ones related to the Red Eco-score or the Red Global-Score. With the Green color, the highest increase in purchasing intents comes from the Global-Score synthetizing nutritional and ecological dimensions.
We also ran other robustness checks. First, we estimated the model with many different socio-demographic variables leading to model 2 of Table 4. The signs and the coefficients of variables also present in model 1 were not modified with these models conferring robustness to the estimations of model 1. Purchase intents are influenced by a few socio-demographic variables: positively, by the high consumption of pizzas and the age, and negatively if the person is in charge of purchases and by the level of studies.
We now turn to the impact of the appearance of the second score at round #3. Recall from Section 2.4, that the Global-Score presented at round #2 is replaced by the two corresponding Eco-sore and Nutri-Score at round #3. Table 5 presents the percentages of replies at round #3.
Table 5.
Impact of the second appearance of the alternative score.
Table 5 shows that the Red color has a dominant influence. Indeed, 2 Red colors lead to 53% of participants switching from “Yes” at round #1 to “No” at round #3 (top of Table 5), while 2 Green colors lead to 14% of participants switching from “No” at round #1 to “Yes” at round #3 (bottom of Table 5). Second, a Red color associated with a Green color leads to higher percentages of participants switching from “Yes” to “No” (16% and 30% in the fourth column at the top of Table 5) than the percentages of participants switching from “No” to a “Yes” (5% and 3% in the third column at the bottom of Table 5). Indeed, the conflicting information between the Green and the Red colors is turning to the advantage of the Red color.
For studying the statistical significance of impacts coming from both scores appearing together at round #3, the econometric estimations of the purchase intents are presented in Table 6. We examined the impact of both scores posted at round #3, by pooling the participants’ choices at rounds #1 and #3 (and by skipping choices at round #2 that will be considered in the next Table 6).
Table 6.
Estimations of purchase intents at rounds #1 and #3 with random effects logit estimator.
The important result from Table 6 comes from the positive impact on purchase intent only related to the appearance of both Green Nutri-Scores and Eco-Scores, namely with the DV, Green Eco-Score (1/0) × Green Nutri-Score (1/0) and a coefficient equal to +1.04. As soon as a Red score appears associated with a Green color, the negative impact of the Red color dominates the positive impact linked to the Green color. It means that the negative impact of the Red color of one score is not outweighed by the possible positive impact of the green color of the other score. When associated with a Green color for the other score, the Red Nutri-Score has a stronger effect in absolute value than the Red Eco-Score in absolute value, with coefficients −0.99 versus −1.77. The Yellow or Red colors for both scores have respectively negative effects on purchase intents.
Eventually, we complement the previous econometric analyses by a final estimation accounting for the three rounds. We examined the impact of scores by pooling the participants’ intents at rounds #1, #2 and #3. For each color of a score appearing at round #2, the corresponding DV at round #2 is equal to 1 for rounds #2 and #3, since this score is still visible and known at round #3, and 0 for round #1 or other colors/scores. For each color of a score appearing at round #3, the DV at round #3 is equal to 1 for round #3 only, and 0 for rounds #1 and #2 or others colors/scores. Recall that the Global-score was replaced by corresponding Nutri-&Eco-scores at round #3. Table 7 present the results.
Table 7.
Estimations of purchase intents at rounds #1, #2 and #3 with random effects logit estimator.
Table 7 confirms the results of previous Table 4 and Table 6. At round #2, the Green color for each score has no significant impact. Even if it significantly impacts some purchases with Yellow and Red colors, the Global-Score at round #2 has less impact than the Nutri-Score or the Eco-Score. Interestingly, some additional scores at round #3 have statistically significant effects: one with the Green Nutri-Score and two with the Red Nutri-Score and the Red Eco-Score. In round #3, the Red Nutri-Score has a higher impact in absolute value than the Green Nutri-Score and the Red Eco-score. However, the effects coming from the Red colors linked to Nutri-score and Eco-score in absolute value at round #3 are lower than the corresponding ones in absolute value at round #2. In other words, the effects are less salient at round #3 with 2 scores posted on the pizza compared to the effects at round #2 with 1 score initially posted on the pizza, which suggests a decreasing-marginal return of additional scores revealed to participants at round #3.
Table 8 now focuses on the replies to some additional questions following the purchase intents and focusing on both opinions and perceptions. The top of Table 8 underlines that information provided by both Nutri-Score and Eco-Score mattered for consumers, which can explain the significant impacts of scores on purchase intents shown in previous Tables. Table 8 also shows that information on nutrition is the most important characteristic for many consumers (49%), even if the information on the environment matters, in particular when equally associated with nutrition (38%). The Nutri-Score is relatively entrenched in real-life purchasing habits, with 87% of participants who have already seen the Nutri-Score in stores, and 85% of participants who declared that they have already been influenced by the Nutri-Score in their food purchases.
Table 8.
Perceptions and Reactions about the Nutri-Score and the Eco-Score a.
Many participants endorse the idea of a mandatory Nutri-Score (75%) and a mandatory Eco-Score (59%) for all foods, which differs from the opinions of some food companies as expressed in newspapers [40]. Many consumers (65%) support public authorities for being officially involved in the definition of scores. Eventually, the use of an App with phones for checking food quality still concerns a minority of consumers (43%). For summarizing Table 8, we can say that many French consumers endorse the TLs system, epitomized by the existing Nutri-Score and the “nascent” Eco-Score.
4. Discussion
The results of this paper show that the appearances of scores and colors significantly affect the purchase intents. The Eco-Score and the Global-Score seem useful for some consumers who change their behaviors with several significant impacts on purchase intents. These TLs were presented by following the Nutri-Score framework that is a prescriptive system with a 5-colors scheme allowing for the classification of food products into five classes with an overall score (based on 5 letters A, B, C, D, E) and a related color (from green to red). The usefulness of the Eco-Score is a precious indication for helping the public debate, in a context of a looming decision that should be taken by the French government about the best labeling framework for signaling the environmental impact of food, as explained in the introduction [24,25].
With the Green color, the highest increase in purchasing intents in Table 4 comes from the Global-Score synthetizing nutritional and ecological dimensions. However, from Table 7, both Nutri- & Eco-scores with the Yellow or Red color lead to more important changes in absolute value than the Global-Score, suggesting a limited impact of this aggregate score. Table 8 underlines that 53% of participants would agree to a Global-Score, a possible option that could be reached with an App synthetizing both Nutri- & Eco-Score on smartphones.
Beyond this question, our paper also brings interesting findings. Indeed, for each type of score (namely nutritional, ecological or global), the dominant effect comes from the reduction in purchase intents for pizza related to the Red color, although Green or Yellow colors also change purchase intents but to a lesser extent. With the Red color, the Nutri-Score leads to more significant decreases in purchasing intents than the ones related to the Eco-score or the Global-Score.
This result of a greater effect in absolute value with the Red color than with the Green color is consistent with the prospect theory underscoring that losses and gains yield different valuations since utility variations are convex for losses and concave for gains [41]. According to the prospect theory, the impact from messages implying losses should be higher than the impact of messages implying benefits, which is the case with purchasing intents following the green or red colors with the different scores. For instance, in Table 3, percentages of participants switching from the “No” to the “Yes” with the green colors, namely 7% for the Nutri-Score, 3% for the Eco-Score and 14% for the Global-Score, are much lower than previous figures of participants switching from the “Yes” to the “No” when the red color is shown, namely 49% for Nutri-Score, 35% for the Eco-Score and 40% for the Global-Score.
Allowing the appearance of another score at round #3 underlines that the negative impact of the Red color for one score is not outweighed by the possible positive impact of the Green color for the other score. The conflicting information for the same product, namely a positive score with a Green color associated with a negative alternative score with a Red color leads to a higher weight for the Red score compared to the Green score (as seen in Table 6 and Table 7). It means that a quality effort on one dimension leading to a green color is likely to be “damaged” by the possible low quality related to another dimension. Compared to the Green color, one Red color is sufficiently efficient for changing purchasing intents.
This efficiency of Red colors on purchase intents inevitably raises the question of the mandatory label, since producers will never accept to voluntarily show a Red score leading to a reduction of their demand [32]. This phenomenon reinforces the emergence of lobbying pressures by some processors “threatened” by one or two red colors with the Nutri-Score and the Eco-Score [32,40]. Even if the project of the future French regulation stipulated a mandatory labeling system, the promotion of a voluntary system will characterize intense-ongoing debates about the final regulation. Regarding this question of private incentives, food companies with Yellow or Red colors are likely to differ from consumers who seem to particularly favor the red color for shunning a bad-quality product. More particularly, from Table 8, many participants strongly support a mandatory Nutri-Score (75%) and a mandatory Eco-Score (59%) for all foods sold in supermarkets, which can reinforce the pressure on the decision maker.
As the Nutri-Score is already known by many consumers in France (with 87% of participants who have already seen the Nutri-Score in stores as shown by Table 8), the introduction of an Eco-Score with a similar framework appears as a credible solution, since our study reveals its usefulness for consumers. However, adding a new Eco-score to the group of already existing quality labels including the Nutri-Score reinforces the risk of labels proliferation, a problem that is pervasive for the topic of sustainability [30,31].
Eventually, the major limitation of this online survey comes from the focalization on a single product, namely a pizza, with hypothetical choices indicated via an online survey. Our web-survey provides precise indications about the impacts of different TLs for a “uniform” product, even if this work deserves additional confirmations by new studies. Even if some consumers react to the Eco-Score in our survey, this attitude will not necessarily translate into the systematic influence of Eco-Scores on food purchases in stores. The durability of revealed information via TLs is complex and likely to quickly fade after an initial time following the novelty of the introduction of the Eco-Score, since consumers are constantly exposed to new information and/or are characterized by an imperfect recall. The proliferation of messages and labels drastically reduces the efficiency of any additional TL. The long-term effects coming from the development of Eco-Scores should be studied by observing real behaviors in supermarkets, for instance with scanned data based on real purchases in supermarkets.
5. Conclusions
Despite limitations underlined in the previous section, this web-survey helps us answer some important research questions related to the TLs for signaling the sustainability of foods, including nutritional and environmental dimensions.
First, the results showed that the appearance of different scores and colors significantly affect the purchase intents for the pizza. Particularly, it means that there is a significant interest for the Eco-Score or the Global-Score by some French consumers. This is an important result in the French context since a new regulation regarding a labeling system about the impact of food on the environment should be implemented in the near future (as explained in the introduction). Even if our study is not a complete cost-benefit analysis, it suggests that various scores signaling nutritional and environmental dimensions have a social value justifying a regulatory effort for imposing these scores.
Second, for each type of score (namely nutritional, ecological or global), the dominant effect comes from the reduction in purchase intents related to the red color, although green or yellow colors also change purchase intents but to a lesser extent. The strongest effect linked to the red color was already underlined by previous contributions [16,17,34]. This predominance of the red color with negative impacts on purchases leads to the necessity to enforce a mandatory labeling system since no producer would voluntarily post a red color on the packages of its foods, implying a decrease in sales and profits. Even if the new French regulation seems to plan a mandatory system for the ecological label, lobbying pressures by processors “threatened” by the red or yellow colors will intensify for avoiding the stringency of a compulsory eco-label [32,40].
Third, there is a significant interest for the Eco-Score shown by some French consumers, even if its impact is likely to be lower than the one coming from the Nutri-Score. This declining influence means that consumers give more value to nutrition compared to the environment. The impacts of the Global-Score appear to be between the ones of the Nutri-Score and the ones of the Eco-Score. The declining influence of additional scores also means that the marginal effect of any additional TL declines (see Table 4, Table 6 and Table 7), and could even tend towards zero when other labels/messages appear on the packaging. This raises the question of the optimal regulatory tools for guaranteeing the sustainability of foods and diets. An alternative policy could consist in taxing foods with red (and yellow) colors while also subsidizing purchases of foods with green colors, which could help move dietary habits in the direction of sustainable practices and foods [17]. However, taxing “unsustainable” foods sold in supermarkets could not be a credible option for consumers or decisions makers, with considerations related to political economy.
Despite limitations, our methodology can be replicated for other foods and/or in other countries interested in TLs. This methodology can be seen as the first step before new studies, like the choice experiments between different pizzas or the field experiments characterizing consumers’ behaviors in stores, where other factors are at play, including the abundance of foods, consumer (in-)capacity for recall of messages, time limitations on purchasing decisions, and/or the confusion induced by complex information. In other words, some extensions should be considered, with real choices that may be evaluated with other methodologies, including field experiments in supermarkets, when many products are effectively sold with different types of labels and/or TLs. Moreover, studying a basket with many various purchased foods with (or without) an Eco-score would allow going beyond a single food, like the pizza considered in this paper.
Whatever the new studies about the best way to signal the sustainability of food systems, debates and controversies about this best way to signal sustainability will continue for a long time.
Funding
This research has received funding from the French Agence Nationale de la Recherche (ANR) under the grant agreement DIETPLUS ANR-17-CE21-0003. The funders had no role in study design, data collection and analysis, decision to publish, or preparation of the manuscript. The author only is responsible for any omissions or deficiencies.
Institutional Review Board Statement
The study was conducted according to the guidelines of the Declaration of Helsinki. Ifop, the private company in charge of the survey, strictly complies with both EU and French regulation regarding the data protection.
Informed Consent Statement
Informed consent was obtained from all subjects involved in the study conducted by the private company Ifop.
Data Availability Statement
The datasets used and/or analyzed during the current study are available from the corresponding author.
Acknowledgments
Without implicating them, I thank Johan Le Douce and Sovanndany Nov (from Ifop) for their help. I also thank Daniel Gallardo Albarran, Justus Wesseler and all the participants to the Economic Seminar Presentation at Wageningen University, 2 November 2021.
Conflicts of Interest
The author declares that they have no known competing financial interests or personal relationships that could have appeared to influence the work reported in this paper.
Appendix A
- A brief description of questions asked in the web-survey:
7 questions about the socio-demographic
3 questions about general food habits (1 on diet and 2 on the person in charge of purchasing)
- Messages on scores and purchase intents:
Round #1: A few explanations and purchase intent #1
Round #2: One message about one score and purchase intent #2 with this score
Round #3: A new message about the new score was appearing and purchase intent #3 with two scores posted on the pictures (see Figure 1)
23 questions about habits regarding consumption of pizzas, food quality perceptions and labels
Appendix B
- Messages about purchase intents and scores
- Round #1 without any score:
(Explanations)
“We are now focusing on one specific product, a pizza. On the next page, we will ask you to indicate your purchase intention for a pizza sold in stores in the fresh section (4 °C) or in the frozen section.
You will be asked to indicate your purchase intention for this pizza sold at a given price. It will be an intention to buy, not an actual act of purchase. This means that you will not have to pay any money after you have indicated your intention. Please indicate your intention to purchase as if you were in a supermarket.
It is important that you state each of your buying intentions, just as you would when faced with real choices in a store. Buying a product would mean you would have less money available for other purchases.
Go to the next page.”
(New screen)
- Purchase intent #1:
The pizza is presented on the picture. The weight of this packet is 400 g.
Would you purchase this packet if it was sold at the price P? Please check only one reply.
☐ Yes
☐ No
☐ Maybe
[The price was P = €2 for half of participants and P = €3 for half of participants. For each group, the price was constant for the 3 rounds]
Go to the next page.
(New screen)
- Rounds #2 and #3 with different scores are described for 3 types of subgroups of Table 2.
- (1)
- For the 5 subgroups at the top of Table 2 (400 participants), the Nutri-Score was revealed at round #2 and the Eco-Score was revealed at round #3.
- Round #2:
(Explanations)
“The Nutri-Score of the pizza in question will appear on the next page.
In France, the Nutri-Score system was promulgated by the public authorities in 2017, and it is currently used by a significant number of producers and distributors. The Nutri-Score is a labeling system at five levels, with a score ranging from A to E and from green to red, synthesizing different nutritional indicators of the food (salt, fat, sugar, etc.) having an impact on the health.
The Nutri-Score score is materialized by a colored logo with a letter that can range from A (very good nutritional quality) to E (very poor nutritional quality).
One of these ratings was given to pizza based on its characteristics.
Now we will ask you again for your purchase intention for the pizza presented. Do not hesitate to change or keep your choice compared to what you have indicated previously.
Go to the next page.”
(New screen)
- Purchase intent #2:
The pizza is presented on the picture. The weight of this packet is 400 g.
(other colors for this score were presented to other subgroups as indicated in Table 2).
Would you purchase this packet if it was sold at the price P? Please check only one reply.
☐ Yes
☐ No
☐ Maybe
Go to the next page.
(New screen)
- Round #3:
(Explanations)
“The Eco-Score of the pizza in question will appear on the next page.
In France, the new Eco-Score system is currently being evaluated by consumer associations and public authorities. The Eco-Score is a five-level labeling system, with a score ranging from A to E and from green to red, synthesizing different indicators linked to the impact of food production on the environment (greenhouse gas emissions, water pollution, loss of biodiversity, etc.).
The Eco-Score score is materialized by a colored logo with a letter that can range from A (very good environmental quality) to E (very poor environmental quality).
One of these ratings was given to pizza based on its characteristics.
Now we are going to ask you again for your purchase intention for the pizza. Do not hesitate to change or keep your choice compared to what you have indicated previously.
Go to the next page.”
(New screen)
- Purchase intent #3:
The pizza is presented on the picture. The weight of this packet is 400 g.
(other colors for these scores were presented to other subgroups as indicated in Table 2).
Would you purchase this packet if it was sold at the price P? Please check only one reply.
☐ Yes
☐ No
☐ Maybe
Go to the next page.
(New screens with the questions about consumptions habits)
- (2)
- For the 5 subgroups at the middle of Table 2 (400 participants), the Eco-Score was revealed at round #2 and the Eco-Score was revealed at round #3.
The messages are similar to previous messages with groups (1) except for the order of messages that was switched.
- (3)
- For the 5 subgroups at the bottom of Table 2 (400 participants), the Global-Score was revealed at round #2 and the corresponding Eco-Score and Nutri-Score were revealed at round #3.
- Round #2:
(Explanations)
“The Global-Score of the pizza considered will appear on the next page.
In France, the new Score Global system is currently being evaluated by consumer associations and public authorities. The Global-Score is similar to the Nutri-Score, but it also incorporates environmental indicators. The Global-Score is a five-level labeling system, with a score ranging from A to E and green to red, synthesizing
- different nutritional indicators of the food (salt, fat, sugar, etc.) having an impact on health, and
- various indicators linked to the impact of food production on the environment (greenhouse gas emissions, water pollution, loss of biodiversity, etc.).
The Global-Score is materialized by a colored logo with a letter that can range from A (very good environmental and nutritional quality) to E (very poor environmental and nutritional quality).
One of these ratings was given to pizza based on its characteristics.
Now we will ask you again for your purchase intention for the pizza presented. Do not hesitate to change or keep your choice compared to what you have indicated previously.
Go to the next page.”
(New screen)
- Purchase intent #2:
The pizza is presented on the picture. The weight of this packet is 400 g.
(other colors for this score were presented to other subgroups as indicated in Table 2).
Would you purchase this packet if it was sold at the price P? Please check only one reply.
☐ Yes
☐ No
☐ Maybe
Go to the next page.
(New screen)
- Round #3:
(Explanations)
“The Global-Score which has just been presented is a system combining
- the Nutri-Score summarizing various nutritional indicators of the food (salt, fat, sugar, etc.) having an impact on health, and
- the Eco-Score summarizing various indicators linked to the impact of food production on the environment (greenhouse gas emissions, water pollution, loss of biodiversity, etc.).
The Nutri-Score score is materialized by a colored logo with a letter that can range from A to E.

The Eco-Score score is materialized by a colored logo with a letter that can range from A to E.

For each score, one of these scores was given to the pizza based on its characteristics.
Now we are going to ask you again for your purchase intention for the pizza. Do not hesitate to change or keep your choice compared to what you have indicated previously.
Go to the next page.”
(New screen)
- Purchase intent #3:
The pizza is presented on the picture. The weight of this packet is 400 g.
(other colors for these scores were presented to other subgroups as indicated in Table 2).
Would you purchase this packet if it was sold at the price P? Please check only one reply.
☐ Yes
☐ No
☐ Maybe
Go to the next page.
(New screens with the questions about consumptions habits)
References
- Lock, K.; Smith, R.D.; Dangour, A.D.; Keogh-Brown, M.; Pigatto, G.; Hawkes, C.; Fisberg, R.M.; Chalabi, Z. Health, agricultural, and economic effects of adoption of healthy diet recommendations. Lancet 2010, 376, 1699–1709. [Google Scholar] [CrossRef]
- Auestad, N.; Fulgoni, V.L. What Current Literature tells us about Sustainable Diets: Emerging Research Linking Dietary Patterns, Environmental Sustainability, and Economics. Adv. Nutr. 2015, 6, 19–36. [Google Scholar] [CrossRef]
- Marette, S.; Requillart, V. Dietary Models and Challenges for Economics. Rev. Agric. Food Environ. Stud. 2020, 101, 5–22. [Google Scholar] [CrossRef]
- Disdier, A.C.; Marette, S. Taxes, minimum-quality standards and/or product labeling to improve environmental quality and welfare: Experiments can provide answers. J. Regul. Econ. 2012, 41, 337–357. [Google Scholar] [CrossRef]
- Cowburn, G.; Stockley, L. Consumer understanding and use of nutrition labelling: A systematic review. Public Health Nutr. 2005, 8, 21–28. [Google Scholar] [CrossRef] [Green Version]
- Neal, B.; Crino, M.; Dunford, E.; Gao, A.; Greenland, R.; Li, N.; Ngai, J.; Ni Mhurchu, C.; Pettigrew, S.; Sacks, G.; et al. Effects of Different Types of Front-of-Pack Labelling Information on the Healthiness of Food Purchases—A Randomised Controlled Trial. Nutrients 2017, 9, 1284. [Google Scholar] [CrossRef] [Green Version]
- Egnell, M.; Talati, Z.; Hercberg, S.; Pettigrew, S.; Julia, C. Objective Understanding of Front-of-Package Nutrition Labels: An International Comparative Experimental Study across 12 Countries. Nutrients 2018, 10, 1542. [Google Scholar] [CrossRef] [Green Version]
- Goiana-Da-Silva, F.; Goiana-Da-Silva, F.; Miraldo, M.; Calhau, C.; Bento, A.; Cruz, D.; Almeida, F.; Darzi, A.; Araújo, F. Front-of-pack labelling policies and the need for guidance. Lancet Public Health 2019, 4, e15. [Google Scholar] [CrossRef] [Green Version]
- Franco-Arellano, B.; Vanderlee, L.; Ahmed, M.; Oh, A.; L’Abbé, M. Influence of front-of-pack labelling and regulated nutrition claims on consumers’ perceptions of product healthfulness and purchase intentions: A randomized controlled trial. Appetite 2020, 149, 104629. [Google Scholar] [CrossRef] [PubMed]
- An, R.; Shi, Y.; Shen, J.; Bullard, T.; Liu, G.; Yang, Q.; Chen, N.; Cao, L. Effect of front-of-package nutrition labeling on food purchases: A systematic review. Public Health 2021, 91, 59–66. [Google Scholar] [CrossRef]
- Draper, A.K.; Adamson, A.J.; Clegg, S.; Malam, S.; Rigg, M.; Duncan, S. Front-of-pack nutrition labelling: Are multiple formats a problem for consumers? Eur. J. Public Health 2013, 23, 517–521. [Google Scholar] [CrossRef]
- Muller, L.; Ruffieux, B. What Makes a Front-of-Pack Nutritional Labelling System Effective: The Impact of Key Design Components on Food Purchases. Nutrients 2020, 12, 2870. [Google Scholar] [CrossRef]
- Keller, K.L.; Staelin, R. Assessing biases in measuring decision effectiveness and information overload. J. Consum. Res. 1989, 15, 504–508. [Google Scholar] [CrossRef]
- Santé Publique France. Nutri-Score. 2021. Available online: https://www.santepubliquefrance.fr/determinants-de-sante/nutrition-et-activite-physique/articles/Nutri-Score (accessed on 2 October 2021).
- Crosetto, P.; Muller, L.; Ruffieux, B. Helping consumers with a front-of-pack label: Numbers or colors? Experimental comparison between Guideline Daily Amount and Traffic Light in a diet-building exercise. J. Econ. Psychol. 2015, 55, 30–50. [Google Scholar] [CrossRef]
- Dubois, P.; Albuquerque, P.; Allais, O.; Bonnet, C.; Bertail, P.; Combris, P.; Lahlou, S.; Rigal, N.; Ruffieux, B.; Chandon, P. Effects of front-of-pack labels on the nutritional quality of supermarket food purchases: Evidence from a large-scale randomized controlled trial. J. Acad. Mark. Sci. 2021, 49, 119–138. [Google Scholar] [CrossRef] [Green Version]
- Marette, S.; Nabec, L.; Durieux, F. Improving Nutritional Quality of Consumers’ Food Purchases with Traffic-Lights Labels: An Experimental Analysis. J. Consum. Policy 2019, 42, 377–395. [Google Scholar] [CrossRef]
- Poquet, D.; Ginon, E.; Goubel, B.; Chabanet, C.; Marette, S.; Issanchou, S.; Monnery Patris, S. Impact of a front-of-pack nutritional traffic-light label on the nutritional quality and the hedonic value of mid-afternoon snacks chosen by mother-child dyads. Appetite 2019, 143, 104425. [Google Scholar] [CrossRef]
- Girard, L. Le Nutri-Score et Yuka Bousculent L’agroalimentaire. Le Monde, 14 October 2019. Available online: https://www.lemonde.fr/economie/article/2019/10/14/le-Nutri-Score-et-yuka-bousculent-l-agroalimentaire_6015367_3234.html(accessed on 2 October 2021).
- Intermarché. Chantier de «Reformulation des Recettes» Chez Intermarché: 900 Produits à Marque Distributeur déjà Optimisés. 2021. Available online: https://www.mousquetaires.com/communique/chantier-de-reformulation-des-recettes-chez-intermarche-900-produits-a-marque-distributeur-deja-optimises/ (accessed on 2 October 2021).
- Yuca. 2021. Available online: https://yuka.io/ (accessed on 2 October 2021).
- Girard, L. Avec le Roquefort, Lactalis Veut Contrer le Nutri-Score. Le Monde, 11 October 2021. Available online: https://www.lemonde.fr/economie/article/2021/10/11/avec-le-roquefort-lactalis-veut-contrer-le-Nutri-Score_6097947_3234.html(accessed on 2 October 2021).
- Ministère de la Transition Ecologique. Projet de loi Climat et Résilience: Les Députés ont Voté le Titre 1er “Consommer”. Paris, France. Available online: https://www.ecologie.gouv.fr/projet-loi-climat-et-resilience-deputes-ont-vote-titre-1er-consommer (accessed on 2 October 2021).
- Ademe. Affichage Environnemental dans le Secteur Alimentaire: Expérimentation 2020/2021. 27 August 2021. Available online: https://www.ademe.fr/expertises/consommer-autrement/passer-a-laction/reconnaitre-produit-plus-respectueux-lenvironnement/dossier/laffichage-environnemental/affichage-environnemental-secteur-alimentaire-experimentation-20202021 (accessed on 2 October 2021).
- Open Food Facts. Eco-Score: L’impact Environnemental des Produits Alimentaires. 2021. Available online: https://fr.openfoodfacts.org/Eco-Score-l-impact-environnemental-des-produits-alimentaires (accessed on 2 October 2021).
- La Note Globale. 2021. Available online: https://lanoteglobale.org/la-note-globale/ (accessed on 2 October 2021).
- Peyroche, M.; Symoneaux, R. Perception des Consommateurs Français Face aux Affichages Environnementaux des Produits Alimentaires Ecole Supérieure d’Agricultures. 2021. Available online: https://www.ademe.fr/sites/default/files/assets/documents/etude-esa-perception-consommateurs-synthese.pdf (accessed on 2 October 2021).
- Arrazat, L.; Chambaro, S.; Marty, L.; Arvisenet, G.; Nicklaus, S. Impact of Environmental Labelling on Food Choices: A Randomized Controlled Trial in a Virtual Reality Supermarket; Working Paper; INRAE: Dijon, France, 2021. [Google Scholar]
- Soler, L.G.; Aggeri, F.; Dourmad, J.Y.; Hélias, A.; Julia, C.; Nabec, L.; Pellerin, S.; Ruffieux, B.; Trystram, G.; van der Werf, H. L’Affichage Environnemental des Produits Alimentaires Rapport du Conseil Scientifique; Institut du Développement Durable et des Relations Internationales: Paris, France, 2021; Available online: https://www.ademe.fr/sites/default/files/assets/documents/affichage-environnemental-produits-alimentairs-synthese-conseil-scientifique.pdf (accessed on 2 October 2021).
- Marette, S. Consumer Confusion and Multiple Equilibria. Econ. Bull. 2010, 30, 1120–1128. [Google Scholar]
- Yokessa, M.; Marette, S. A Review of Eco-labels and their Economic Impact. Int. Rev. Environ. Resour. Econ. 2019, 13, 1–45. [Google Scholar] [CrossRef]
- Drichoutis, A.; Lazaridis, P.; Nayga, R. Consumers’ use of nutritional labels: A review of research studies and issues. Acad. Mark. Sci. Rev. 2006, 10, 1–22. [Google Scholar]
- Ares, G.; Varela, F.; Machin, L.; Antúnez, L.; Giménez, A.; Curutchet, M.R.; Aschemann-Witzel, J. Comparative performance of three interpretative front-of-pack nutrition labelling schemes: Insights for policy making. Food Qual. Prefer. 2018, 68, 215–225. [Google Scholar] [CrossRef]
- Hallstein, E.; Villas-Boas, S.B. Can Household Consumers Save the Wild Fish? Lessons from A Sustainable Seafood Advisory. J. Environ. Econ. Manag. 2013, 66, 52–71. [Google Scholar] [CrossRef] [Green Version]
- Kortelainen, M.; Raychaudhuri, J.; Roussillon, B. Effects of Carbon Reduction Labels: Evidence from Scanner Data. Econ. Inq. 2016, 54, 1167–1187. [Google Scholar] [CrossRef] [Green Version]
- Drescher, L.; Roosen, J.; Marette, S. The effects of traffic light labels and involvement on consumer choices for food and financial products. Int. J. Consum. Stud. 2014, 38, 217–227. [Google Scholar] [CrossRef]
- Loomis, J.; Ekstrand, E. Alternative approaches for incorporating respondent uncertainty when estimating willingness to pay: The case of the Mexican spotted owl. Ecol. Econ. 1998, 27, 29–41. [Google Scholar] [CrossRef]
- Marette, S.; Rosen, J. Just a little bit more legumes! Results of an online survey in Europe. Int. Food Agribus. Manag. Rev. 2021, 1–18. [Google Scholar] [CrossRef]
- Croissant, Y. Package Pglm: Panel Generalized Linear Models, R Package Version 0.2-1. 2017. Available online: https://cran.r-project.org/web/packages/pglm/pglm.pdf (accessed on 2 October 2021).
- Kahneman, D.; Tversky, A. Prospect theory: An analysis of decision under risk. Econometrica 1979, 47, 263–292. [Google Scholar]
- Girard, L. La Bataille Pour L’étiquetage Continue dans L’agroalimentaire. Le Monde, 10 July 2021. Available online: https://www.lemonde.fr/economie/article/2021/07/09/dans-l-agroalimentaire-la-bataille-pour-l-etiquetage-fait-toujours-rage_6087664_3234.html(accessed on 2 October 2021).


Publisher’s Note: MDPI stays neutral with regard to jurisdictional claims in published maps and institutional affiliations. |
© 2021 by the author. Licensee MDPI, Basel, Switzerland. This article is an open access article distributed under the terms and conditions of the Creative Commons Attribution (CC BY) license (https://creativecommons.org/licenses/by/4.0/).