Abstract
The Huolin River is an important water supply source for the wetland located in western Jilin province, especially the river flooding in the lower reaches of the basin. In recent years, the degree of aridity and salinization of the wetlands has increased. To prevent the further deterioration of the ecological system, water conservancy projects and irrigation systems were constructed to ensure water safety. What effects on the ecological system and biological diversity were induced by all the measures and constructions is not clear. The “emergency project” of the water recession of the Huolin River is taken as example. In the analysis, the project is divided into two stages, five indicators for criteria tier were selected, and for index tier, 21 indicators during the implementation stage and 15 indicators during the operation stage were selected for constructing the analytic hierarchy process (AHP) model. By using expert scoring to determine the weight of each indicator, the impact index and degree of water conservancy of projects on biodiversity are calculated. The results show that at the level of the impact categories, ecological landscape is identified as a key influence factor. At the index level, the occupied area of the landscape type, the changes in patch number, the water conservation function, and the water purification quality are identified as corresponding key impact indicators. The biodiversity overall impact index is −23.45, which means the negative impact and the degree is medium to low. Meanwhile, for the implementation stage, the index is −51.58, which indicates a medium to low negative impact, while for the operation stage, the index is 33.66, which indicates a medium to low positive impact. These results are analyzed and scientifically evaluated and corresponding protection suggestions for the local area are proposed.
1. Introduction
River flooded wetland is a type of wetland landscape that is distributed along a river and nurtured by seasonal flooding. This wetland contains an abundant amount of natural resources and plays an important role in flood storage, drought prevention, climate regulation, soil erosion control, and environmental pollution degradation [1,2,3]. This type of wetland is the most important living environment for biodiversity and humans in the region, and plays an important role in maintaining and improving the ecological environment [4,5,6]. Flooding is a natural characteristic of rivers, and floodplains are generally located in the middle and lower reaches of a river basin. The downstream of the Huolin River basin is located in an agro-pastoral ecotone area of the southwest of the Songnen Plain, which is a typical ecological fragile region; Xianghai wetland, Chagan Lake wetland, and Longzhao wetland are widely distributed in this area. The Huolin River is an important source of water for these wetlands, whose flooding promotes wetland formation and evolution [7].
However, due to climate fluctuations and human activities in recent decades, the degree of aridification in the basin has increased. The reduced water supply downstream of the flood wetland revealed a large area affected by wetland shrinkage and degradation and prominent wetland salinization [8,9,10]. According to the “General Plan of Jilin Province to Increase the Production Capacity of 10 Billion Catties of Commercial Grain”, to protect the wetland ecological environment and transform the saline–alkali wasteland, Jilin province is planning to conduct water conservancy projects during the planning stage. The most representative of these projects include those of “Divert the Nenjiang River to Baicheng region”, “the Songyuan Irrigation system” and “the Da’an Irrigation system” [11,12,13], all of which can provide agricultural irrigation and ecological water supply. It is generally taken for granted that these water conservancy projects will benefit wetlands systems. However, it is not clear how the project will affect the wetland biodiversity before and after projects, and whether the benefits outweigh the harms or vice versa, and what the degree of the impact is [14,15].
Biodiversity is an ecological complex formed by organisms and their environments. Through the integration of various ecological processes, biodiversity can be classified into genetic diversity, population/species diversity, ecosystem diversity, and landscape diversity [16,17,18]. This complex plays an important role in conserving energy, regulating climate, protecting soil, and maintaining ecological balance; at the same time, biodiversity ensures a stable supply of food, drugs, industry raw materials, and species genes [19]. The impacts of water conservancy projects on biodiversity need to be analyzed and quantitatively evaluated in many aspects.
The impacts of construction projects on the biodiversity of important ecological areas, especially natural reserves, are required to be evaluated in the form of legislation. However, vast and important ecologically sensitive areas outside the protected area lack relevant documents and requirements, thereby introducing great uncertainty to these areas [20]. Therefore, in this article, qualitative and quantitative methods are applied to evaluate the structure of important ecological regions [21,22,23], as well as the function and protection of objects of the ecosystem; this is of great significance to the protection of wetlands in the lower Huolin River.
2. Materials and Methods
2.1. Study Area
The study area is located in the floodplain and wetland area of the lower Huolin River (latitude 45°00′N-45°28′N, longitude 123°15′E-124°13′E) as shown in Figure 1. This area is surrounded by the Xianghai Nature Reserve in the west, Momoge Nature Reserve in the north, and Chagan Lake Nature Reserve in the east. This ecologically sensitive area is located outside the nature reserve. According to the second national wetland survey, the wetland in this area is classified as a general wetland type, and its main vegetation types include swamp grasslands and meadows. Given the hydrological pattern of the Huolin River and the abundant amount of floodwater resources, a series of small saltwater lakes and brackish water and saltwater marshes in the area are distributed in a beaded and star-shaped manner. River, lake, swamp and swamp meadow ecosystems are also found in the area, all of which have formed biodiversity. Survey and statistical data show that this area is home to 239 species of wetland plants, belonging to 39 families and 132 genera, mainly angiosperms, including Cyperaceae, Sparganiaceae, Gramineae, Typhae, and Junceae. Meanwhile, the plant communities in this area mainly include Suaeda salsa, Artemisia sphaerocephala, Phragmites australis, and Cyperus, whereas the 164 animal species in this area mainly include birds, mammals, amphibians, reptiles, and fish [24,25].
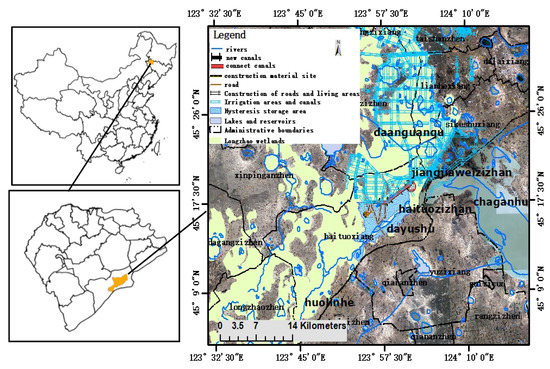
Figure 1.
Geographical location of the study area.
2.2. Data Processing
2.2.1. Remote Sensing Image and Regional Ecological Landscape Map
Spatial resolution serves as an important basis for selecting remote sensing images that can meet the needs of feature recognition. Many commercial satellites can provide high-resolution images, including the domestic high score series, Jilin no. 1 series, and the foreign World View series and Quick bird, etc. This article uses high-resolution Gaofen-2 image data with a spatial resolution of 0.8 m panchromatic, 3.2 m multispectral data, 45 km width, and 5 day revisit time, which was obtained from the High Resolution of The Earth Observation System Jilin Data and Application Center (http://gaofen.jlu.edu.cn/, accessed on 28 September 2019). Radiation correction, image fusion, image registration, and enhancement were performed to generate multispectral images with a spatial resolution of 1 m [26,27]. By taking the processed images as the base map and referring to the land classification system used in “the third national land survey and investigation”, the landscape classification and interpretation marks were established to extract the landscape type information and to generate the landscape type map, the landscape types were divided into twelve categories, as shown in Figure 2.
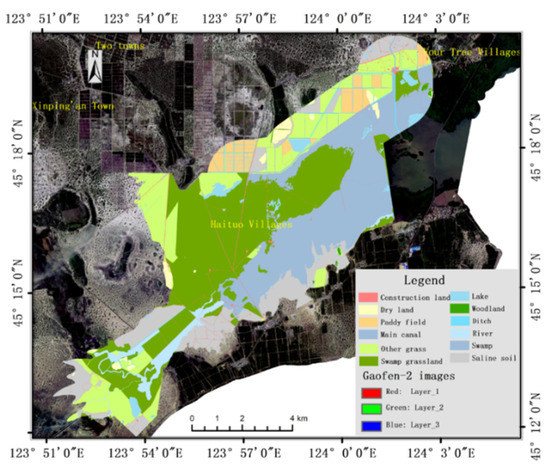
Figure 2.
Landscape types of the study area.
2.2.2. Field Validation for Ecological Landscape
In order to improve the accuracy of the ecological landscape classification and the types of plant species contained in the landscape patches, a field survey was carried out in March 2020. The investigator set a quadrat with size of 1 m 1 m along the main ecological landscape zone, and for each quadrat, the latitude and longitude coordinates, the landscape type, and the plant species were recorded; photos were also taken. In the research area, a total of 50 observation quadrats were set, and the observation route was 173 km long, as shown in Figure 3.
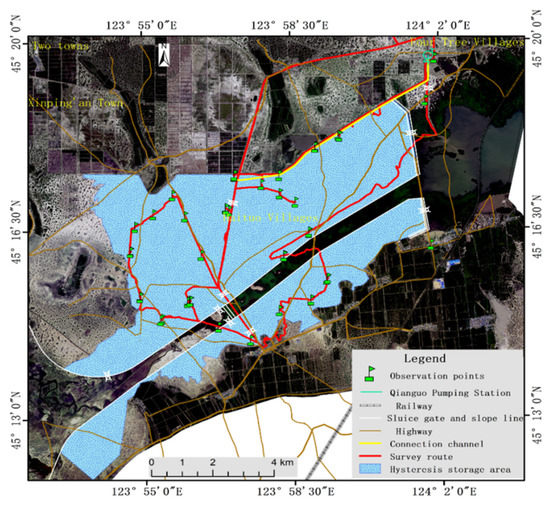
Figure 3.
Field survey route and observation points.
2.3. Division of Evaluation Area
According to the construction site of the “emergency project” and the scope of the post-implementation water storage area, the evaluation area includes the implementation area and its extension. Referring to the “technical regulation for biodiversity impact assessment of construction project in nature reserve” based on the distance from the construction land, the assessment area was divided into the serious impact areas, the medium to high impact areas, and the medium to low impact areas [28]. The serious impact areas can be subdivided into the connection canal evaluation area and the material yard evaluation area. The connection canal evaluation area was based on the area of the connection canal and its surrounding 1000 m as a buffer zone, with a total area of 1869.25 hm2. Meanwhile, the material yard evaluation area was based on the area of the engineering designed material yard and a transportation road and the 500 m buffer area around them, with a total area of 434.84 hm2. The medium to high impact area was the connecting canal evaluation area and the 500 m buffer area around it, with a total area of 1166.11 hm2. The remaining areas were medium to low impact areas, as shown in Table 1 and Figure 4.

Table 1.
Impact Evaluation Area during the Implementation.
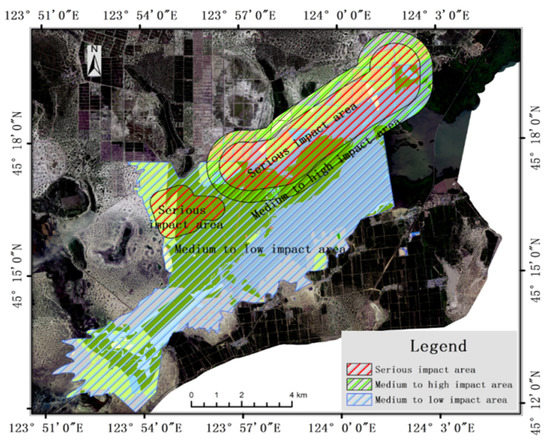
Figure 4.
Evaluation map during the implementation.
During the operation stage of the project, the backwater of the Da’an irrigation system was diverted to the Huolin River. Therefore, the whole wetland with a total area of 6614.27 hm2 was evaluated.
2.4. Evaluation Method
Analytic hierarchy process (AHP) was used to evaluate the impact of the project on biodiversity. The method was proposed by Saaty (1980) and has been used in previous studies in prioritizing biodiversity conservation criteria [29]. The merit of this method is that it can help to check and decrease the inconsistency of experts’ judgment and provide an algorithm for integrating individual decision-making results into group decision making. It is both a qualitative and quantitative analysis method [30,31,32,33,34,35], whose basic principle is to divide various factors in a complex system into a hierarchical structure based on their interrelationship and affiliation. As shown in Figure 5, level A was the target tier, level B was the criteria tier, and level C was the index tier, The relative importance of factors on the same level was evaluated based on experts experience and intuition, and the consistency criterion was used to test the accuracy of the judgment. Afterwards, the judgment was synthesized into the hierarchical structure to obtain the overall ranking of the importance of decision factors relative to the target [36]. AHP is relatively simple, easy to operate, and can intuitively reflect the importance of risks at the same level. However, it is also highly subjective, and the correctness of its analysis depends on the knowledge reserve and professionalism of experts.
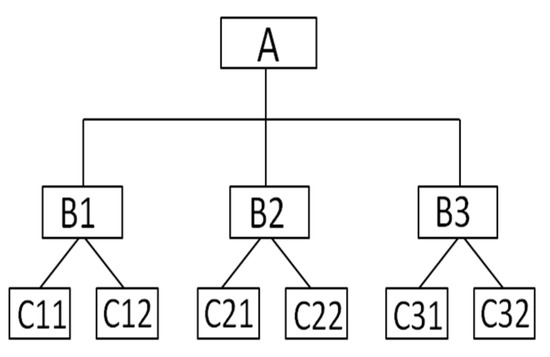
Figure 5.
Structural model of analytical hierarchy process.
2.4.1. Building an Index System
According to the AHP principle, the aforementioned specifications, and certain conditions of the project construction stage, the evaluation system was divided into level A, which contained one indicator, which was biodiversity assessment; criteria tier B, which contained five indicators; and index tier C, which contained 36 indicators, which included 21 indicators during the implementation stage and 15 indicators during the operation stage, as shown in Figure 6 and Figure 7.
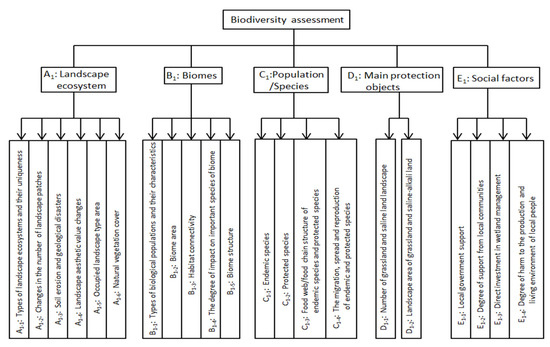
Figure 6.
Evaluation indicators during the implementation.
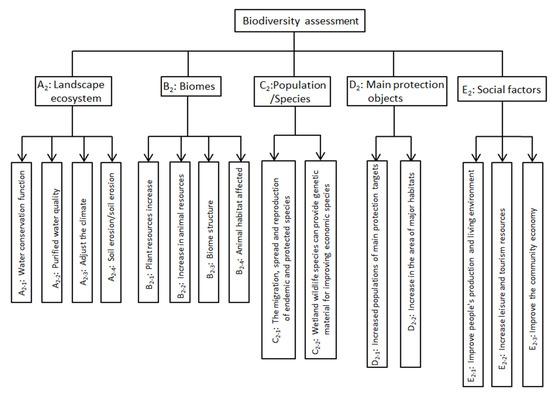
Figure 7.
Evaluation indicators during the operation.
2.4.2. Scoring and Determining the Index Weight
Some experts from ecology, water conservancy, remote sensing, and surveying were selected to score various indicators according to the characteristics of the project. A total of 13 scoring tables were handed out to these experts, of which 10 were handed back and 9 were effective. Based on the tables given by 9 experts, the highest frequency method was used to determine the final score of each index. During the implementation stage, the occupation of wetlands, the damage to the wetland landscape connectivity, and the noise and lights generated by transportation vehicles may have negative impacts on the habitat and activities of animals. During the operation stage, the backwater from the Da’an irrigation system was diverted to the Huolin River irrigation system through the “emergency project”, and was subsequently discharged into Chagan Lake after wetland purification and filtration in the retention area. By effectively supplementing the water source of the Chagan Lake, this backwater plays an important role in maintaining and protecting the biodiversity of the Chagan Lake wetland ecosystem in this semi-arid region. During the project operation stage, the power transmission process of the canal, the pumping station operations, and facility maintenance activities will affect the animal habitat and negatively affect wetland biodiversity. Therefore, in the scoring process, the score standard was set between −100 and 100, with −100–0 indicating negative impact and 0–100 indicating positive impact. The magnitude of the absolute value represented the degree of impact on biodiversity. According to the characteristics of indicators, the magnitude of change after the impact, and the potential adverse effects, the degree of impact was divided into three levels: medium to low impact, medium to high impact, and severe impact, and the corresponding absolute value of the score was less than 60, between 60 and 80, and then greater than 80, respectively. The scoring value and criteria basis are shown in Table 2.
Table 2.
Indicator Assessment and its Justification in the Indicator Level.
After applying AHP, these experts were invited to randomly respond to questionnaires “face to face” to determine the level of importance. The index weight was determined and a consistency check was performed based on the results of the survey and the actual situation of the project [37,38]. Following the scaling method used, the relative importance of the factors in each index tier was compared and the judgment matrix of each index was obtained. The eigenvector was obtained by computing for the eigenvalues of the judgment matrix. After normalization, the ranking weight of each factor was obtained. However, the exact eigenvalue and eigenvector of the judgment matrix cannot be easily obtained. To address this problem, approximate values were generally used. The process of AHP is presented in the follow up steps.
- -
- Step 1. Establish the judgment matrices
The judgment matrix of a set of indicators is constituted by the average comparative importance of each two indicators to the upper tier (see Equation (1)). denotes the average importance of the i-th indicator to the upper tier when compared to the j-th indicator, and it is the mean of (see Equation (2)), which was evaluated by the experts based on a 1–9 scale (see Table 3).
where denotes the number of the indicators and refers to the number of experts.
Table 3.
Definitions of the Scale.
- -
- Step 2. Calculate the eigenvectors and eigenvalue of the judgment matrix
The eigenvectors and eigenvalue can be calculated based on Equations (3) and (4), respectively.
where i and j mean the number of rank and column of respectively.
- -
- Step 3. Consistency test
Two consistency indicators (I and ) were used to test the consistency of the judgment matrix (see Equations (5) and (6)). If the number of the evaluation category is <3, we accepted the when CI < 0.1, and if the number of the lower indexes was ≥3, both and should pass the test.
where the value of can be referred to in Table 4, which was adapted from the study conducted by Wang, Yang, and Lu [39]. If the random consistency ratio < 0.1, then the consistency of the judgment matrix meets the requirements; otherwise, the elements in the judgment matrix should be readjusted until the requirements are met [40]. The weight vector of the index was calculated from Equations (3), and Equations (4)–(6) were used to check the consistency of the judgment matrix and the weight and consistency of each level. The corresponding index weight of each dimension was eventually obtained.
Table 4.
Consistency Indicator (RI) Value.
2.4.3. Biodiversity Impact Index
The biodiversity impact index (BI) was used to evaluate the impact of the “emergency project” construction in the Da’an irrigation system on wetland biodiversity. This index was calculated as
where was the score of the criteria tier, was the weight of the criteria tier, was the score of the index tier, was the weight of the index tier, and was the biodiversity impact index.
2.4.4. Overall Evaluation
The implementation and operation stages of the project were separately evaluated. In order to analyze the impact of the whole stage on biodiversity, the overall impact index was calculated the same way as the biodiversity impact index as follows:
3. Results
3.1. Calculate the Weight of Each Tier Index
In this step, experts were invited to evaluate the comparative importance of each two indicators, and the judgment matrices were established based on the evaluation results. Then, according to Equation (3), the weights of each indicator can be calculated. We constructed the judgment matrices of the indicators at the criteria tier and index tier and then calculated their weights. The results were presented in Table 5, Table 6, Table 7 and Table 8. Among them, Table 5 and Table 6 represented the implementation stage, and Table 7 and Table 8 represented the operation stage.
Table 5.
Determining Matrix and Weight of Indicators in Standard Layer during the Implementation.
Table 6.
Determining Matrix and Weight of Indicators in Indicator Layer during the Implementation.
Table 7.
Determining Matrix and Weight of Indicator in Standard Layer during the Operation.
Table 8.
Determining Matrix and Weight of Indicators in Indicator Layer during the Operation.
It can be seen from the calculation results in Table 5 and Table 6 that in the implementation phase, the weights of influencing factors A1, B1, C1, D1, and E1 were 0.3728, 0.2437, 0.1012, 0.2003, and 0.0767, respectively; its importance was ranked as A1, B1, D1, C1, and finally E1; its consistency ratio of the judgment matrix was 0.0638 less than 1, correspondingly; the consistency ratio of the judgment matrix of the indicators in the index tier were 0.0610, 0.0353, 0.00, 0.00 and 0.0886, which were all less than 1; and all satisfy the consistency test.
It can be seen from the calculation results in Table 7 and Table 8 that in the operation phase, the weights of influencing factors A2, B2, C2, D2, and E2 were 0.3934, 0.2035, 0.1078, 0.1078, and 0.1876, respectively; its importance was ranked as A2, B2, E2, and finally C2 (E2); its consistency ratio of the judgment matrix was 0.0116 less than 1, correspondingly; the consistency ratio of the judgment matrix of the indicators in the index tier were 0.0574, 0.0226, 0.00, 0.00 and 0.0516, respectively, which were all less than 1; and all satisfy the consistency test.
3.2. Impact during Implementation Stage
The score of each indicator was calculated as shown in Table 9 based on the statistical scores and weights. During the implementation stage, the impact scores on landscape ecosystem, biomes, population/species, main protection objects, and social factors were −51.4, −54, −53.4, −50, and −50, respectively. The degree of impact was medium to low, indicating a negative influence. These results indicated that during the implementation stage, the main protection objects and social factors had the same degree of influence, which was lower than that of landscape ecosystems, biomes, and populations/species. Biomes and populations/species produced the greatest impact, thereby suggesting that during the implementation stage, the operation noise and light from transportation vehicles may affect animal habitat. Meanwhile, landscape ecosystem produced the second greatest impact, thereby indicating that the permanent land occupation of the project may destroy the landscape ecological pattern.
Table 9.
BI Value during the Project Implementation.
After the calculation, the BI was −51.58. Based on these results and the standard of impact degree, the project generated a medium to low impact on wetland biodiversity in the implementation stage. These results can be ascribed to three reasons. Firstly, the implementation stage was short, the engineering volume was low, and the study area was 81.8 hm2, which only accounted for 0.9% of the evaluation area. Secondly, the construction generally took place during the day when migratory birds had not yet arrived on the scene. Thirdly, the construction scope was small and the damage to the wetland could be recovered in time. Although the degree of impact during the implementation stage was medium to low, the impact was negative. Therefore, biodiversity should be protected during the implementation process.
3.3. Impact during Operation Stage
The impact of the project on biodiversity during the operation stage was concluded as shown in Table 10. During this stage, the impact scores on the landscape ecosystem, biomes, population/species, main protection objects, and social factors were 42.6, 19.2, 30, 30, and 34.8, respectively. The degree of impact was medium to low, indicating a positive influence. Calculation results show that the impact on the population/species and main protection objects during the operation stage was 30, indicating that the project had a positive effect on the population and protection objects after the operation. The greatest impact on the landscape ecosystem was 42.6, indicating that in the operation stage, the “emergency project” was used to divert water to the Huolin River irrigation system, thereby providing water sources and purifying water quality. Social factors were also present, thereby indicating that the project’s operation can improve the local living environment and increase the amount of leisure and tourism resources. The impact on the biomes increases the amount of animal and plant resources after the project. However, the pumping station operation connected to the canal power transmission process will also affect animal habitat, but the overall impact was positive.
Table 10.
BI Value during the Project Operation.
After the calculation, the BI was 33.66. According to the results and the standard of impact degree, in the operation stage, the project generated a medium to low impact. This finding can be ascribed to three reasons. Firstly, the retreat of farmland replenishes the wetland water source and maintains the biodiversity of the wetland ecosystem. Secondly, the water supply transformed some saline–alkali land into wetlands, thereby increasing the area of wetlands, vegetation types, and ecosystem producers. Thirdly, the retreat of farmland demonstrates eutrophication, which accelerates the succession of some wetland communities from a low to a high level and produces some negative effects. Excessive water can also trigger soil erosion and related hazards. The operation of the pumping station connected to the canal power transmission process also negatively affects animal habitat. However, the degree of impact of the project during the operation stage was only medium to low, which is beneficial for biodiversity.
3.4. Overall Impact on Biodiversity
When calculating the overall evaluation index for the whole stage, the weights of the implementation stage and the operation stage were calculated, respectively, according to the actual situation of the project and the AHP principle. The weight of the implementation stage was 0.67, whereas that of the operation stage was 0.33, as shown in Table 11.
Table 11.
BI Value of the Overall Engineering.
After the calculation, the overall impact index value (BI) was −23.45, which indicated that there was a negative impact on the wetland for the whole stage of the project. The absolute value was less than 60 and the impact degree was medium to low. Therefore, the degree of biodiversity protection in the wetland evaluation area should be increased. Table 11 showed that due to the short implementation stage and high impact intensity, the project demonstrated a certain negative impact on biodiversity protection. However, in the long-term process, after the wetland was damaged and repaired during the implementation stage, the overall process produced a positive impact. In other words, from the perspective of long term development, the project implementation contributes to biodiversity conservation in the region.
4. Discussion
4.1. The Necessary Evaluation Response to Different Project Stage
The biodiversity impact evaluation is very important for conservation and the sustainability of the wetland ecosystem. There is a growing interest in promoting biodiversity consideration in impact evaluation [41]. Considering the uncertainty, the important factors for biodiversity impact evaluation were data, methodologies, and judgments provided by the experts [42]. The pre-project environmental impact assessment system for major construction projects has been in place for more than 20 years [43], but the post-project environmental impact analysis for construction projects has not yet been carried out, especially in water conservancy projects of flooded wetlands in ecologically fragile areas [14,44,45]. From the assessment results regarding the biodiversity impact of engineering construction across nature reserves, such as the impact of the connecting project between Bajiao lake and Nanhu lake on the biodiversity of East Dongting Lake National Nature Reserve was medium to low, the BI was 51.6 [46], the impact of flood storage and retention area construction on the biodiversity of ecological sensitive areas was medium to low, the BI was 54.6 [47], etc. A guess may be inferred that all the pre-project evaluation values are close to 60, which is the lowest limit allowed for project construction in a national natural reserve. It was obviously unknown what feedback would be brought after the project, and whether or not it had a positive impact or a negative impact. In this article, the question about the impact of a water conservancy project’s construction on a wetland ecosystem is answered in consideration of several different influencing factors. The study results show that different effects will be induced on the wetland ecosystem during the different stages of the water conservancy project’s construction. During the implementation stage, the negative effects are greater than the positive effects, the BI is −51.58, while during the operational stage, the positive effects are greater than the negative effects, the BI is 33.66, the overall impact index value (BI) is −23.45, the degree of impact is medium to low. Therefore, it is necessary to carry out a biodiversity impact assessment responding to the different stages of engineering construction, which is an accurate and scientific evaluation.
4.2. The Importance of Evaluation Indexes and Scoring Experts
As the “emergency project” in this article is based on the saline and alkaline floodplain wetland, after the completion of the project, it is bound to provide positive feedback to the organisms in this area. Therefore, in the evaluation of the operation stage, the selection of the index of the standard layer is the same as that of the implementation stage. In the selection process of the index layer, according to the characteristics of the region, due to the supply of water, the water conservation capacity can be improved, the resources of animals and plants can be increased, and the water quality can be purified. However, at the same time, too much water will cause soil erosion, and the habitat of animals and plants will be affected [48]. A total of 15 indicators were selected. According to the BI value, the top three indicators were the increase of water conservation function, the purification of water quality, and the increase of wetland habitat area. If the number of indicators increases, the result will be changed. Therefore, the content and quantity of the indicators are important for the results.
AHP was used to assess the impact of the project on biodiversity. Although some quantitative measures were adopted, its qualitative nature still cannot be changed, the method is greatly affected by subjective judgment, and some external factors can easily affect the final evaluation results. In addition, the level of questionnaire scoring value and the number of experts will affect the evaluation results; theoretically, the more design samples, the smaller the impact of individual samples, but due to time, funding, and other reasons, the number of scoring tables is limited. Meanwhile, the knowledge and experience of experts are different, thereby leading to differences in evaluation results for the same problem. Therefore, eliminating the influence of these factors to obtain objective and reliable evaluation results is difficult. With the development of theories and technologies from related disciplines, quantitative techniques and methods should be gradually adopted to improve the accuracy and reliability of the evaluation results.
4.3. The Prospects for Future Research
In the overall evaluation process, the BI value is −23.45, which is a negative impact, this is only to analyze the impact of the project in the short term. In the long run, we need to do further research. Though the “emergency project” will bring sufficient water once it is established, which will enrich local species diversity, whether or not more water is better for specific biological species is an investigation not conducted in this article. Actually, different species are habituated to different water depth [49,50]. After the completion of the water conservation facilities, it will be conducive to the growth and species of phytoplankton such as algae. However, with the increase of the water level, most of the spawning grounds will be inundated, and the hydrological and growth conditions necessary for the growth, spawning, and reproduction of aquatic organisms will be destroyed, so the unique breeding habitat of some fish will disappear [51,52]. Therefore, specific investigations and research should to be performed to further carry out the corresponding survey research and evaluation.
5. Conclusions
The typical ecologically fragile area of the flooded wetland in the lower reaches of the Huolin River was selected to evaluate the impact of an “emergency project” on biodiversity in this paper. The analytic hierarchy process (AHP) method was used to conduct an evaluation from five categories, namely, ecological landscape, biomes, species/population, main protection objects, and social factors. At the level of impact categories, ecological landscape was identified as a key influencing factor. At the index level, the occupied area of landscape types, the changes in patch number, the water conservation function, and the water purification quality were identified as corresponding key impact indicators.
Through the calculated biodiversity impact index, the is −51.58, the is 33.66, and the is −23.45; it can be seen that, whether in the implementation stage, operation stage, or for the whole stage, the absolute value of BI is less than 60, and the degree of influence is medium to low. Therefore, during the implementation stage, the damage to wetland landscapes and plants should be reduced and wildlife and surface water environments should be protected. In the operation stage, the available wetland management and protection measures should be strengthened and the quality of backwater from paddy fields should be improved through scientific farming. For the whole stage, although the impact is negative, the absolute value of BI is small, indicating that the project implementation is considered feasible after the protection measures are taken.
Author Contributions
Y.Z. (Yujuan Zhai) and Y.Z. (Yanhong Zhang) designed the paper and completed the manuscript. L.H., Y.Z. (Yanhong Zhang), and Z.L. revised the paper. Y.Z. (Yujuan Zhai) and Y.L. contributed to data collection and processing. All authors have read and agreed to the published version of the manuscript.
Funding
This research was funded by National Key Research and Development Program, No.2016YFC0500204.
Institutional Review Board Statement
Not application.
Informed Consent Statement
Not application.
Data Availability Statement
Not application.
Acknowledgments
Firstly, thanks are given to the Wetland Center, Northeast Institute of Geography and Agroecology, Chinese Academy of Sciences, who provided the identification of wetland plants/communities, then we would like to thank the editor and the reviewers for their careful work and thoughtful suggestions that have improved this paper substantially.
Conflicts of Interest
The authors declare no conflict of interest.
References
- Erwin, K.L. Wetlands and global climate change: The role of wetland restoration in a changing world. Wetl. Ecol. Manag. 2009, 17, 71–84. [Google Scholar] [CrossRef]
- Mitsch, W.J.; Bernal, B.; Nahlik, A.M.; Mander, U.; Zhang, L. Wetlands, carbon, and climate change. Landsc. Ecol. 2013, 28, 583–597. [Google Scholar] [CrossRef]
- Moomaw, W.R.; Chmura, G.L.; Davies, G.T.; Finlayson, C.M.; Sutton-Grier, A.E. Wetlands in a changing climate: Science, policy and management. Wetlands 2018, 38, 183–205. [Google Scholar] [CrossRef]
- Baron, J.S.; Poff, N.L.; Angermeier, P.L.; Steinman, A.D. Meeting ecological and societal needs for freshwater. Ecol. Appl. 2002, 12, 1247–1260. [Google Scholar] [CrossRef]
- Dai, X.; Yin, H.; Bai, Y. Spatial and temporal variation characteristics of marine wetland ecological environment based on GIS. CCAMLR Sci. 2018, 25, 143–151. [Google Scholar]
- Sutton-Grier, A.E.; Sandifer, P.A. Conservation of Wetlands and Other Coastal Ecosystems: A Commentary on their Value to Protect Biodiversity, Reduce Disaster Impacts, and Promote Human Health and Well-Being. Wetlands 2019, 39, 1295–1302. [Google Scholar] [CrossRef]
- Xiangliang, P.; Wei, D.; Daoyong, Z.; Fei, L.; Yongjie, W. Sustainable agriculture in the semi-arid agro-pastoral interweaving belt of northern China: A case study of west Jilin Province. Outlook Agric. 2003, 32, 165–172. [Google Scholar] [CrossRef]
- Green, A.J.; Alcorlo, P.; Peeters, E.T.; Morris, E.P.; Mateo, R. Creating a safe operating space for wetlands in a changing climate. Front. Ecol. Environ. 2017, 15, 99–107. [Google Scholar] [CrossRef]
- An, Y.; Gao, Y.; Zhang, Y.; Tong, S.; Liu, X. Early establishment of Suaeda salsa population as affected by soil moisture and salinity: Implications for pioneer species introduction in saline-sodic wetlands in Songnen Plain, China. Ecol. Indic. 2019, 107, 105654. [Google Scholar] [CrossRef]
- Berninger, K.; Koskiaho, J.; Tattari, S. Constructed wetlands in Finnish agricultural environments: Balancing between effective water protection, multi-functionality and socio-economy. J. Water Land Dev. 2012, 17, 19–29. [Google Scholar] [CrossRef]
- Du, L.; Xu, L.; Li, Y.; Liu, C.; Li, Z.; Wong, J.S.; Lei, B. China’s agricultural irrigation and water conservancy projects: A policy synthesis and discussion of emerging issues. Sustainability 2019, 11, 7027. [Google Scholar] [CrossRef]
- Wang, T.; Li, Y. The technology of the land management information system in Jilin Daan irrigation district. Jilin Water Resour. 2011, 2, 31–34. [Google Scholar]
- Huang, X.; Yu, Y.; Sun, Y. Construction of ecological environment of oasis in Qingtongxia Irrigation District. J. Groundw. Sci. Eng. 2014, 2, 78–84. [Google Scholar]
- Zhu, Z.; Zhao, K.; Lin, Q.; Qureshi, S.; Ross Friedman, C.; Cai, G.; Wang, H. Systematic Environmental Impact Assessment for Non-natural Reserve Areas: A Case Study of the Chaishitan Water Conservancy Project on Land Use and Plant Diversity in Yunnan, China. Front. Ecol. Evol. 2017, 5, 1–14. [Google Scholar] [CrossRef]
- Wu, Y.; Guo, L.; Xia, Z.; Jing, P.; Chunyu, X. Reviewing the Poyang lake hydraulic project based on humans’ changing cognition of water conservancy projects. Sustainability 2019, 11, 2605. [Google Scholar] [CrossRef]
- Folke, C.; Holling, C.S.; Perrings, C. Biological diversity, ecosystems, and the human scale. Ecol. Appl. 1996, 6, 1018–1024. [Google Scholar] [CrossRef]
- Harrington, R.; Anton, C.; Dawson, T.P.; de Bello, F.; Feld, C.K.; Luck, G.W. Ecosystem services and biodiversity conservation: Concepts and a glossary. Biodivers. Conserv. 2010, 19, 2773–2790. [Google Scholar] [CrossRef]
- Denny, P. Biodiversity and wetlands. Wetl. Ecol. Manag. 1994, 3, 55–611. [Google Scholar] [CrossRef]
- Thrupp, L.A. Linking agricultural biodiversity and food security: The valuable role of agrobiodiversity for sustainable agriculture. Int. Aff. 2000, 76, 265–281. [Google Scholar] [CrossRef]
- Xu, H.; Wang, S.; Xue, D. Biodiversity conservation in China: Legislation, plans and measures. Biodivers. Conserv. 1999, 8, 819–837. [Google Scholar] [CrossRef]
- Gontier, M.; Balfors, B.; Mörtberg, U. Biodiversity in environmental assessment—Current practice and tools for prediction. Environ. Impact. Asses. 2006, 26, 268–286. [Google Scholar] [CrossRef]
- Findlay, C.S.; Bourdages, J. Response time of wetland biodiversity to road construction on adjacent lands. Conserv. Biol. 2000, 14, 86–94. [Google Scholar] [CrossRef]
- Lee, M. Information security risk analysis methods and research rends: AHP and fuzzy comprehensive method. Int. J. Comput. Sci. Inform. Technol. 2014, 6, 29–45. [Google Scholar]
- Liu, Y.; Wu, D.; Wang, Z. Research Review on Ecological Security Assessment of Wetland. Geogr. Geo-Inf. Sci. 2011, 27, 69–75. [Google Scholar]
- Yu, S. Wetlands in China. Land Resour. 2002, 2, 12–15. [Google Scholar]
- Tian, B.; Li, Z.; Zhang, M.; Huang, L.; Qiu, Y.; Li, Z.; Tang, P. Mapping Thermokarst lakes on the Qinghai–Tibet plateau using nonlocal active contours in Chinese gaofen-2 multispectral imagery. IEEE J. Stars 2017, 10, 1687–1700. [Google Scholar] [CrossRef]
- Tong, X.; Lu, Q.; Xia, G.; Zhang, L. In Large-scale land cover classification in Gaofen-2 satellite imagery. IEEE 2018, 7, 3599–3602. [Google Scholar] [CrossRef]
- The State Forestry Administration of the People’s Republic of China. Technical Regulation for Biodiversity Impact Assessment of Construction Project in Nature Reserve: LY/T 2242-2014; Standards Press of China: Beijing, China, 2014.
- Mustafa, M.A.; Al-Bahar, J.F. Project risk assessment using the analytic hierarchy process. IEEE Trans. Eng. Manag. 1991, 38, 46–52. [Google Scholar] [CrossRef]
- Banerjee, P.; Ghose, M.K.; Pradhan, R. Analytic hierarchy process based spatial biodiversity impact assessment model of highway broadening in Sikkim Himalaya. Geocarto Int. 2020, 35, 470–493. [Google Scholar] [CrossRef]
- Bottero, M.; Comino, E.; Duriavig, M.; Ferretti, V.; Pomarico, S. The application of a Multicriteria Spatial Decision Support System (MCSDSS) for the assessment of biodiversity conservation in the Province of Varese (Italy). Land Use Policy 2013, 30, 730–738. [Google Scholar] [CrossRef]
- Dong, Z.; Wang, Z.; Liu, D.; Li, L.; Ren, C.; Tang, X.; Jia, M.; Liu, C. Assessment of habitat suitability for waterbirds in the West Songnen Plain, China, using remote sensing and GIS. Ecol. Eng. 2013, 55, 94–100. [Google Scholar] [CrossRef]
- Singh, H.; Karnatak, H.C.; Garg, R.D. An automated and optimized approach for online spatial biodiversity model: A case study of OGC web processing service. Geocarto Int. 2019, 34, 194–214. [Google Scholar] [CrossRef]
- Aminbakhsh, S.; Gunduz, M.; Sonmez, R. Safety risk assessment using analytic hierarchy process (AHP) during planning and budgeting of construction projects. J. Safety Res. 2013, 46, 99–105. [Google Scholar] [CrossRef] [PubMed]
- Marhavilas, P.K.; Tegas, M.G.; Koulinas, G.K.; Koulouriotis, D.E. A Joint Stochastic/Deterministic Process with Multi-Objective Decision Making Risk-Assessment Framework for Sustainable Constructions Engineering Projects—A Case Study. Sustainability 2020, 12, 4280. [Google Scholar] [CrossRef]
- Chen, H.; Li, H.; Wang, Y.; Cheng, B. A comprehensive assessment approach for water-soil environmental risk during railway construction in ecological fragile region based on AHP and MEA. Sustainability 2020, 12, 7910. [Google Scholar] [CrossRef]
- Ma, F.; He, J.; Ma, J.; Xia, S. Evaluation of urban green transportation planning based on central point triangle whiten weight function and entropy-AHP. Transp. Res. Procedia 2017, 25, 3634–3644. [Google Scholar] [CrossRef]
- Wang, Q.; Yang, C.; Lu, J.; Wu, F.; Xu, R. Analysis of preservation priority of historic buildings along the subway based on matter-element model. J. Cult. Herit. 2020, 45, 291–302. [Google Scholar] [CrossRef]
- Zhang, K.; Zheng, W.; Xu, C.; Chen, S. An improved extension system for assessing risk of water inrush in tunnels in carbonate karst terrain. KSCE J. Civ. Eng. 2019, 23, 2049–2064. [Google Scholar] [CrossRef]
- Vargas, L.G. An overview of the analytic hierarchy process and its applications. Eur. J. Oper. Res. 1990, 48, 2–8. [Google Scholar] [CrossRef]
- Swanepoel, F.; Retief, F.; Bond, A.; Pope, J.; Morrison-Saunders, A.; Houptfleisch, M.; Fundingsland, M. Explanations for the Quality of Biodiversity Inputs to Environmental Impact Assessment (EIA) in Areas with High Biodiversity Value. J. Env. Assmt. Pol. Manag. 2019, 21, 1950009. [Google Scholar] [CrossRef]
- Geneletti, D.; Beinat, E.; Chung, C.F.; Fabbri, A.G.; Scholten, H.J. Accounting for uncertainty factors in biodiversity impact assessment: Lessons from a case study. Environ. Impact Asses. 2003, 23, 471–487. [Google Scholar] [CrossRef]
- Chen, K.Q.; Ge, H.F.; Yan, X. Biodiversity conservation in hydropower projects: Introducing biodiversity impact assessment into environmental impact assessment of hydropower projects. J. Water Conserv. 2013, 44, 608–614. [Google Scholar]
- Chen, A.; Wu, M.; Chen, K.; Sun, Z.; Shen, C.; Wang, P. Main issues in research and practice of environmental protection for water conservancy and hydropower projects in China. Water Sci. Eng. 2016, 9, 312–323. [Google Scholar] [CrossRef]
- Cai, W.X.; Zhu, J.Q.; Zhou, S.X. Advances in environmental impact post-project-assessment. Environ. Pollut. Control. 2007, 29, 548–551. [Google Scholar]
- Shu, Y.; Wu, N.; Zhang, P.; Huang, C.; Tang, X. Impact Assessment of the Connecting Project Between Bajiao Lake and Nanhu Lake on Biodiversity of East Dongting Lake National Nature Reserve in Yueyang City, Hunan Province. Cent. South For. Inventory Plan. 2020, 39, 53–57. [Google Scholar]
- Ba, Y. Impact assessment of flood storage and detention area construction on biodiversity of ecological sensitive area: Case of flood storage and detention area construction project of Huayang River. Yangtze River 2019, 50, 42–45. [Google Scholar]
- Guardia-Puebla, Y.; Pérez-Quintero, F.; Rodríguez-Pérez, S.; Sánchez-Girón, V.; Llanes-Cedeño, E.; Rocha-Hoyos, J.; Peralta-Zurita, D. Effect of hydraulic loading rate and vegetation on phytoremediation with artificial wetlands associated to natural swimming pools. J. Water Land Dev. 2019, 40, 39–51. [Google Scholar] [CrossRef]
- Diniz, W.J.D.S.; Silva, T.G.F.D.; Ferreira, J.M.D.S.; Santos, D.C.D.; Moura, M.S.B.D.; Araújo, G.G.L.D.; Zolnier, S. Forage cactus-sorghum intercropping at different irrigation water depths in the Brazilian Semiarid Region. Pesqui. Agropecuária Bras. 2017, 52, 724–733. [Google Scholar] [CrossRef]
- Deegan, B.M.; White, S.D.; Ganf, G.G. The influence of water level fluctuations on the growth of four emergent macrophyte species. Aquat. Bot. 2007, 86, 309–315. [Google Scholar] [CrossRef]
- Semenchenko, N.N. In Hydrological regime of the Amur River and the number of commercial freshwater fish. In The Current State of Aquatic Bioresources: Materials of Scientific. Conference Dedicated to the 70th Anniversary of SM Konovalov; TINRO-Center: Vladivostok, Russia, 2008; pp. 246–250. [Google Scholar]
- Nikitina, O.I.; Dubinina, V.G.; Bolgov, M.V.; Parilov, M.P.; Parilova, T.A. Environmental Flow Releases for Wetland Biodiversity Conservation in the Amur River Basin. Water 2020, 12, 2812. [Google Scholar] [CrossRef]


Publisher’s Note: MDPI stays neutral with regard to jurisdictional claims in published maps and institutional affiliations. |
© 2021 by the authors. Licensee MDPI, Basel, Switzerland. This article is an open access article distributed under the terms and conditions of the Creative Commons Attribution (CC BY) license (https://creativecommons.org/licenses/by/4.0/).