Abstract
The cement industry is highly energy-intensive, consuming approximately 7% of global industrial energy consumption each year. Improving production technology is a good strategy to reduce the energy needs of a cement plant. The market offers a wide variety of alternative solutions; besides, the literature already provides reviews of opportunities to improve energy efficiency in a cement plant. However, the technology is constantly developing, so the available alternatives may change within a few years. To keep the knowledge updated, investigating the current attractiveness of each solution is pivotal to analyze real companies. This article aims at describing the recent application in the Italian cement industry and the future perspectives of technologies. A sample of plant was investigated through the analysis of mandatory energy audit considering the type of interventions they have recently implemented, or they intend to implement. The outcome is a descriptive analysis, useful for companies willing to improve their sustainability. Results prove that solutions to reduce the energy consumption of auxiliary systems such as compressors, engines, and pumps are currently the most attractive opportunities. Moreover, the results prove that consulting sector experts enables the collection of updated ideas for improving technologies, thus giving valuable inputs to the scientific research.
1. Introduction
The production process in cement manufacturing plants is typically energy-intensive and requires large amounts of resources [1]. A typical well-equipped plant consumes about 4 GJ of energy to produce one ton of cement, while the cement production in the world is about 3.6 billion tons per year [2]. It was estimated that the cement manufacturing process consumes around 7% of industrial energy consumption, which, in turn, accounts for 30–40% of the global energy consumption [3].
Given the significant impact that the manufacturing industry has on global sustainability and considering the increasing economic pressure introduced by a competitive market and the reduction of available energy resources, optimizing the energy efficiency of production systems has become a primary concern [1]. For this purpose, to reduce energy consumption in the cement sector, it is possible to act both on a technological and a managerial level [4]. Focusing on the technological aspects, one of the strategies to be embraced is to improve production plants by modifying or replacing inefficient equipment with better-performing and less energy-intensive ones [5,6].
As stated by Su et al. [7], the cement manufacturing process can be divided into three major stages: raw material processing, clinker production, and finish grinding processing (finished cement production). A schematic representation of the cement production process is illustrated in Figure 1. The raw material processing reduces the size of limestone and clay extracted from the quarries, thus obtaining a homogeneous mixture with an appropriate chemical composition. At first, one or more subsequent crushers break down the raw material, reducing the rocks’ size from 120 cm to 1.2–8 cm [8]. The crushed rocks are then pre-blended through dedicated apparatuses called stackers and reclaimers. Next, the ingredients are dosed and fed to the mills, which perform the grinding process. During this phase, rocks are ground to fine particles, moved through mechanical conveyors, or fluidized channels fed by blowers, and transported to the homogenizing silos, where the blending process takes place. As the last step of raw material processing, the blending process allows obtaining a uniform chemical composition. Before entry into the kiln, the homogenized ingredients are sent to the preheater tower, where they flow through a series of cyclones. Here, fine particles are preheated exploiting the kiln’s exhaust gases, reducing the energy required to carry out the subsequent heating process. The heating process is performed by the kiln, which could be arranged vertically or horizontally. In the kiln, the material temperature is increased over 1000 °C (sometimes up to 1400 °C), resulting in the formation of calcium silicate crystals-cement clinker [8]. At the kiln exit, the clinker is directed to a cooler and lowered in temperature. The cooling process is required to stop the chemical reactions at the right moment, allowing to obtain a proper quality of the products. Moreover, the cooling process allows to recover some heat from the hot clinker. Finally, the cooled clinker is stored inside silos and then fed to specific mills for the finish grinding process. During the final milling phase, some substances such as fly ash, limestone, slag, gypsum, and pozzolana are added to the clinker, depending on the requirements of the final product. In addition to the aforementioned processes, during the clinker production stage, two other complementary processes are performed: fuel preparation and exhaust gas treatment. Indeed, the fuel (i.e., pet-coke, carbon coke, Refuse-Derived Fuel—RDF, or others) must be milled before entering the kiln, while exhaust gases must be treated to remove dust and reduce emissions.
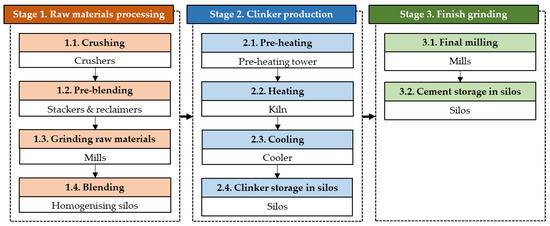
Figure 1.
Cement production process. The colored boxes show the sequential operations, while the white boxes summarize the process machinery.
Based on the water content of the raw materials, the cement manufacturing process can be divided into four categories: dry, semi-dry, semi-wet, and wet [9]. Since cement production requires the complete evaporation of the water in raw ingredients, the higher the percentage of water, the more energy-intensive the process will be. On the other side, a higher water content facilitates the processes of homogenizing and blending. It is worth mentioning that several cement plants only deal with the final milling phase. In these plants, the starting material is the clinker, which has already undergone the heating process. Therefore, for such manufacturing sites, the above classification is not valid.
Generally, energy consumption in the cement industry is provided by electricity and fuels. Over 90% of fuels used are consumed in the production of clinker. Electric energy, on the other hand, is used for about 39% for the finishing process, for around 28% for both processing the raw materials and burning the clinker, and for less than 5% for other operations [7].
To pursue greater energy efficiency in the cement manufacturing plants, for each operation forming the production process, a wide variety of technological solutions has been developed. For instance, solutions to reduce energy problems during raw material crushing are described in [4,10]. Ref. [9] shows solutions for the slurry production process, Ref. [11] for pre-homogenization, and Ref. [12] for drying. Technological opportunities are also shown for grinding [13], homogenization [14], granulation [9], preheating [15], heating [16], cooling [17], and final grinding [18]. Other measures were outlined to improve the efficiency of dedusting [9], exhaust gas treatment, and heat recovery [4,19]. Finally, multiple solutions were developed for material transport systems [20] and auxiliary services [21].
Nevertheless, the multitude of more or less efficient technological alternatives simultaneously offered on the market hamper the choice of which improvement intervention is better to adopt. Therefore, in the scientific literature, several efforts have already been made to develop a review of the main technologies for overcoming energy problems and minimizing energy consumption [9,17,22,23]. Decision support tools have also been developed to help companies in selecting optimal energy efficiency measures [24]. In this context, a crucial role is played by the Best Available Techniques Reference Documents (BREFs), a series of documents developed by the European Union to review and describe industrial processes, their respective operating conditions, pollution factors, and strategies for improving industrial sustainability. In the case of the cement sector, the latest BREFs were published in 2013, in which, in addition to paying particular attention to pollution issues, the main strategies to reduce plant energy consumption were also detailed, considering both technological and technical (management and process control) solutions [4].
A synthetic classification that summarizes the main technological energy-saving alternatives, also dividing them according to the specific phase and asset on which they act, is provided in Appendix A (Table A1, Table A2, Table A3, Table A4, Table A5, Table A6, Table A7, Table A8, Table A9, Table A10, Table A11, Table A12, Table A13, Table A14, Table A15, Table A16 and Table A17, black writings). It is worth mentioning that solutions related to auxiliary and heat recovery systems, being used in multiple process stages, were not associated with a specific manufacturing operation, but were considered as a separate category.
As technology is constantly developing [23], the available alternatives may change within a few years. Some new solutions may emerge, and others may fall into disuse due to their inferior performance. To this end, in addition to consulting the literature, a good way to update the state of the art of energy-saving technological opportunities and to check their degree of application is to consult a sample of companies working in the cement industry [19,25]. Due to the increasing competitiveness in the global industrial sector [26], companies are constantly looking for better technological solutions. Consequently, their consultation could be useful to keep up to date with energy efficiency measures currently attractive in real-life contexts. In this perspective, many studies were carried out on Chinese industries. For instance, the spread of technologies in Taiwanese plants is described by Huang et al. [25], while the current status of energy-efficiency opportunities in Shandong industries is shown by Hasanbeigi et al. [27]. On the contrary, to the best of the authors’ knowledge, a similar study on Italian industries is missing.
As stated by Supino et al. [28], Italy and Germany are the most important cement manufacturers in Europe. In 2019, cement production in Italy was 19,240.645 tons [29]. The Italian cement sector is characterized by non-uniform operators, including multinational groups and other smaller and medium enterprises that operate both at national and local levels. In response to a period of crisis, the Italian cement industry radically changed its energy mix over the last two decades. The contribution of natural gas (−69%) and heavy fuel oil (−60%) was reduced, while the proportion of alternative fuels (such as RDF) was increased. Given the central role of the Italian cement industry in Europe, the diversification of its companies, and the energy progress occurring in such country [30], the results of the Italian analysis could also give important information on the European scenario.
To fill the gap caused by the absence of an Italian study, the contribution of the present paper is to show the Italian current situation and future perspectives of energy-saving technologies for cement plants, thus expanding the knowledge on energy efficiency measures. In this paper, a sample of Italian companies was analyzed consulting the results of mandatory energy audit and collecting information on which of the energy efficiency measures were recently implemented in each company and which will be applied in the next few years. Thus, in the present work, we aim to answer three research questions.
RQ1:
What technological energy-saving interventions were applied by Italian cement companies in the last four years?
RQ2:
What measures are suggested by the same sample of companies to be applied in the next four years?
RQ3:
What are the reasons why some solutions are preferred to others? What conclusions about the future development of Italian companies can be drawn by analyzing a sample of companies?
The importance of the present study is to provide a realistic representation of the current Italian scenario. The results of the analysis are used both to extend Table A1, Table A2, Table A3, Table A4, Table A5, Table A6, Table A7, Table A8, Table A9, Table A10, Table A11, Table A12, Table A13, Table A14, Table A15, Table A16 and Table A17 (Appendix A), indicating other possible measures in addition to those found in the literature, and, above all, to identify through statistical analysis the current degree of implementation of technological interventions. A coherent and systematic reflection on the diffusion of technologies in recent years provides a significant insight into their level of maturity and attractiveness for companies [25].
The methodology proposed in this paper is of significant importance because, by investigating a sample of real companies, the spread level and current situation of technologies in one of the most important cement manufacturers in Europe (Italy) is shown. The outcome of this document could be useful for companies willing to improve their sustainability by implementing new technological opportunities. Moreover, it could be useful to gain a better understanding of the Italian industry context. Finally, the consultation of sector experts is important because it allows collecting updated ideas for improving technologies, thus giving valuable inputs to the scientific research.
Focusing on technological opportunities, this article refers only to solutions concerning cement production equipment, excluding managerial energy-saving measures and measures related, for example, to the use of waste fuels. Moreover, the discussion excludes solutions concerning the lighting or heating of the industrial shed where the plant is located [31], solutions concerning quality control of finished products and packaging activities (which are downstream of the production process) [17], and solutions concerning the installation of sensors which, despite being technologies, are typically used together with software and computer systems to implement management solutions [6].
The remainder of the present paper is organized as follows: Section 2 outlines the approach followed to reach the goals; Section 3 offers the application of the proposed methodology and the description of the Italian scenario; and finally, Section 4 and Section 5 provide a discussion on the results and some conclusions.
2. Materials and Methods
To investigate the actual state of cement production in Italy, an approach similar to the one presented by Hasanbeigi et al. [27] for analyzing Chinese provinces was adopted. The approach was focused on data collection to characterize the cement sector at a national level, thus obtaining an overview of the Italian scenario. This work was carried out in collaboration with the Italian cement trade association (Federbeton) and with the national agency for new technologies, energy, and sustainable economic development (ENEA). The aim of this approach was to analyze a sample of Italian companies, providing an insight into their current interest in energy-saving technologies and their future development directions.
The Energy Efficiency Directive 2012/27/EU (EED) is a solid cornerstone of Europe’s energy legislation. It includes a balanced set of binding measures planned to help the EU reach its 20% energy efficiency target by 2020. The EED establishes a common framework of measures for the promotion of energy efficiency (EE) to ensure the achievement of the European targets and to pave the way for further EE improvements beyond 2020. The Italian Government transposed the EED in 2014 (by issuing the Legislative Decree n. 102/2014, recently updated by Legislative Decree n. 73/2020), extending the obligation also to a specific group of energy-intensive enterprises (mostly SMEs) and assigning ENEA (Italian National Agency for New Technologies, Energy, and the Sustainable Economic Development) the management of EED Article 8 obligation [32], where Article 8 is dedicated to Energy Audits, a necessary tool to assess the existing energy consumption and identify the whole range of opportunities to save energy.
In the EED, Energy Audit is defined as a systematic procedure aimed at obtaining adequate knowledge on the existing energy consumption profile of a building or group of buildings, an industrial or commercial operation or installation or private or public service, identifying, and quantifying cost-effective energy savings opportunities, and reporting the findings.
According to Art. 8 of Lgs. D. 102/14, two categories of companies have been targeted as obliged to carry out energy audits on their production sites, firstly by the 5th of December 2015, and then at least every four years: large enterprises and energy-intensive enterprises. In Italy, an organization qualifies as a large enterprise if it shows one of the following characteristics:
- Number of employees ≥250 and annual turnover >€ 50 million and annual budget >€ 43 million;
- Number of employees ≥250 and annual turnover >€ 50 million;
- Number of employees ≥250 and annual budget >€ 43 million.
Under the implementation of Article 8 in Italy, the size of the company must be calculated only on Italian sites both of the company itself and of its associated/related companies. Energy Intensive Enterprises are the ones with large energy consumptions applying for tax relief on part of the purchased energy. All the energy-intensive enterprises are registered on the list of «Cassa per i servizi energetici ed ambientali» (Governamental Agency related to electricity). Obliged Enterprises that will not carry out an energy audit observing Annex II of the EED within the above deadlines will be subject to administrative monetary penalties. The penalty does not exempt obliged enterprises from carrying out the audit, with its submission to ENEA within six months from the sanction imposition by the Ministry of Economic Development. According to Article 8 of Italian Legislative Decree 102/2014 implementing the Energy Efficiency Directive, as of 31 December 2019, ENEA received 11,172 energy audits of production sites relating to 6434 companies.
Over 53% of the audits were carried out on sites related to the manufacturing sector (8% Plastic, 9% Iron and Steel, 2% Paper, 3% Textile, 6% Food Industry) and over 14% in trade. Seventy percent of the audits collected by ENEA are equipped with specific monitoring of energy consumption.
In the cement sector, 65 Energy Audits carried out from 27 companies were collected by ENEA in December 2019 [33] and 61 energy Audits were characterized by the presence of a monitoring plan for energy consumption (11 companies are equipped with the ISO 50001 energy management system).
Each Energy Audit contains specific information on the geographical location of the plant, some general characteristics of the company, the type of production process, and the type of finished products. In addition, the energy audit is useful to collect additional information on:
- Which energy efficiency measures were implemented by the company in the last four years;
- Which were planned to be implemented in the next four years;
- Why they applied or they are suggesting such solutions.
These additional information (not referring to Table A1, Table A2, Table A3, Table A4, Table A5, Table A6, Table A7, Table A8, Table A9, Table A10, Table A11, Table A12, Table A13, Table A14, Table A15, Table A16 and Table A17, Appendix A) were deliberately analyzed for two reasons. On the one hand, to confirm the validity and the attractiveness of the solutions already found in the literature, in the case they were proposed by companies. On the other hand, to extend and update the list of solutions if sector experts proposed alternative technologies to those already identified.
From 65 energy audits, a sample of 48 Italian cement plants was selected. The gathered information was registered in a database (Excel spreadsheet) and used to expand the list of technological solutions (see Table A1, Table A2, Table A3, Table A4, Table A5, Table A6, Table A7, Table A8, Table A9, Table A10, Table A11, Table A12, Table A13, Table A14, Table A15, Table A16 and Table A17 in Appendix A, red writings). Then, the generated list was shared with the cement trade association (Federbeton) to obtain observations from industry experts and validate the output. Appendix A provides companies with a synthetic tool to improve their sustainability in each specific process phase or cement production machine.
Moreover, the collected data was analyzed, checking which interventions from the list were proposed and by how many companies. The following statistical parameters were computed for each alternative on the list:
- Number of companies that applied the i-th intervention in the last four years ();
- Number of companies that suggested i as a future action ();
- Frequency of application of i in the last four years (;
- Frequency of suggestion of i for the next four years ().
where the relative frequency distribution of the i-th intervention is given by the ratio between the number of observations of this event and the number of total observations, that is the number of energy audits examined, coinciding with the number of companies constituting the sample (sample dimension—SD), see Equations (1) and (2):
The considered sample is only partially represented by Equations (1) and (2). Indeed, the studied cement plants can be classified into two separate categories: (i) half-cycle plant (i.e., grinding center) where only the finish grinding is performed and (ii) full-cycle plant where the entire manufacturing process is carried out. As a result, some interventions can be implemented for just a portion of the original sample. For instance, the interventions related to the kiln are applicable only to the full-cycle plants.
To produce a more realistic representation of the trends related to the adopted technologies in cement plant, Equations (3) and (4) are calculated for each intervention:
where and denote the number of applications and suggestions of a given intervention, respectively, while reference_SD represents the effective number of manufacturing sites that could implement the considered intervention. The application frequency of each solution is useful to assess its degree of diffusion in recent years. High values of indicate that intervention was often applied in the last four years. On the other side, the frequency of suggestion represents the technology’s degree of attractiveness for Italian companies in the current scenario [25]. High values of indicate that the i-th solution is probable to be applied in the next four years. In other words, keeps up to date with the actual level of application of energy efficiency measures in the Italian country, while gives an idea of the future development perspectives of technologies in Italy.
After analyzing the data, by identifying the highest and the lowest and , the most recently applied solutions and the most proposed ones were determined. In Section 3, the results obtained by applying this methodology are illustrated.
3. Results
From 65 energy audits, a sample of 48 Italian cement plants was selected. They are located in Italy, as shown in Figure 2. To obtain an adequate representation of the national scenario, companies were selected to represent both the regions in the north, the center, and the south of Italy. In a sample of 48 sites, 20 companies were in the norther regions of Italy (Emilia Romagna, Friuli Venezia Giulia, Lombardy, Piedmont, and Veneto), 8 in the center (Tuscany, Latium, and Umbria), and 20 in the south (Abruzzo, Basilicata, Calabria, Campania, Molise, Apulia, Sardinia, and Sicily).
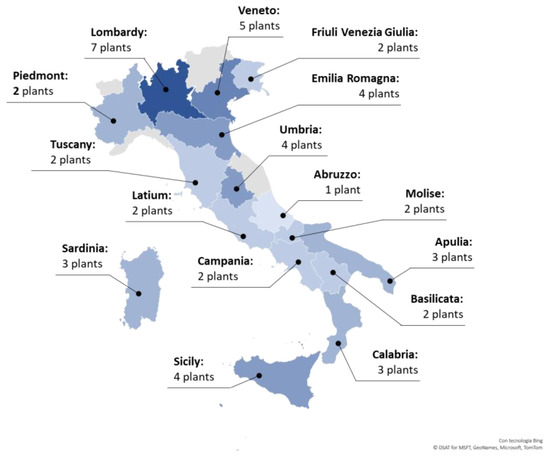
Figure 2.
Geographical distribution of the 48 Italian companies constituting the sample.
In terms of manufacturing processes, 34 out of 48 sites carried out the complete cement production cycle, while 14 plants performed only the third stage of the manufacturing process (Figure 1, finish grinding process). Moreover, the finished products manufactured by the production sites were those shown in Table 1. The variety of production processes and finished products further confirms that this sample represents the national scenario well. In fact, plants producing cement and clinker (33.3% of the sample), plants producing only cement (33.3%), plants producing cement and other elements such as bituminous asphalt or other hydraulic binders (29.2%), and plants producing white cement (4.2%) were all taken into consideration.

Table 1.
Types of finished products manufactured by the 48 production sites.
The technological energy-saving solutions extrapolated from the energy audit and the results of the analysis are shown in Table 2. In Table 2, suggested and applied interventions are ordered according to process stages, putting all auxiliary and heat recovery solutions upstream because, as already explained, they are considered separately.
Table 2.
Results of the analysis of Italian energy audits.
Table 2 was created after analyzing energy audits and also after screening the scientific literature on technological solutions to reduce energy consumption in the cement industry. The content of Table 2 is characterized by two colors. In black are outlined the solutions suggested or applied by the sample of companies and previously mentioned by other scientific authors (bibliographic references and detailed explanations are given in Appendix A). In red, instead, are represented the solutions identified in the energy audits, but not found in the scientific literature.
Figure 3 shows the applied and suggested interventions by considering the process stage on which they acted to reduce energy consumption, whereas Figure 4 summarizes the same measures according to the process machinery (see Figure 1).
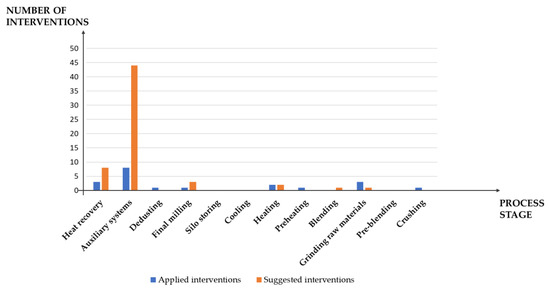
Figure 3.
Suggested and applied interventions divided according to the process stage on which they act.
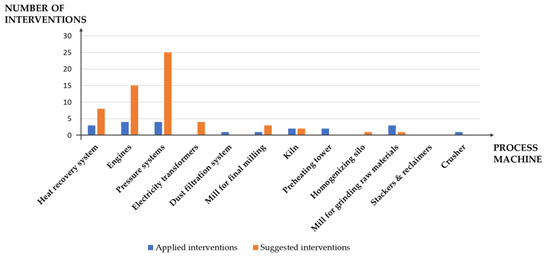
Figure 4.
Suggested and applied interventions divided according to the process machine on which they act.
Results in Table 2 show a strong tendency of analyzed companies to prefer improvements in auxiliary processes, working on engines, compressors, fans, pumps, or on heat recovery systems over all the other interventions reported in Table A1, Table A2, Table A3, Table A4, Table A5, Table A6, Table A7, Table A8, Table A9, Table A10, Table A11, Table A12, Table A13, Table A14, Table A15, Table A16 and Table A17 (Appendix A). The aforementioned improvements are preferred to other interventions, due to the ease of implementation and the low operative costs required. In contrast, no solution is adopted or suggested for the pre-blending and silo storing phases. Neither are considered solutions to improve the sustainability of equipment such as stackers and reclaimers.
3.1. Analysis of the Applied Interventions
The sum of column (4th column of Table 2) is not 48 (sample dimension) but assumes a value of 20. This is because some companies carried out more than one intervention, while others did not apply any improvements in the last four years.
In the case of recently applied interventions, most of the sample companies acted on the auxiliary systems, for instance installing variable speed motors, pumps, or compressors, or replacing boilers and motors with more efficient ones.
Another solution implemented by 2 out of 34 production sites was to replace the classic steam cycle with the Organic Rankine Cycle (ORC) to recover heat from hot gases and produce electricity. Today, however, this solution does not represent the market standard in Italy, especially due to the high investment costs involved in its implementation (as confirmed by the analyses shown below and summarized in Table 3, Table 4 and Table 5).
Table 3.
Energy savings produced by the applied technological measures in the various areas of intervention. The total annual savings are calculated as the sum of thermal energy, electricity, and fuel savings.
Table 4.
Investments required to apply technological measures in the various areas of intervention.
Table 5.
Cost-effectiveness indicator for each area of intervention.
Overall, the most implemented technological solution over the last four years was the installation of inverters on compressors, pumps, or fans. Such a solution showed a relative frequency distribution ( of 0.08.
Some companies also reported quantitative data on the savings achieved by implementing technological measures. These results are divided by area of intervention and summarized in Table 3 and Table 4. In the tables, toe stands for ton of oil equivalent. Areas related to thermal recovery and production lines determine large energy savings, and the largest economic investments (both total and average). The average quantitative data shown in Table 3 and Table 4 is computed as the average of the number of production sites that reported quantitative information.
A cost-effectiveness indicator was calculated for each intervention, measured as Euros invested per Ton of Oil Equivalent (toe) of energy saved (Table 5). The available information allowed to calculate it only on nine interventions, reporting both information on energy saved and costs. The area of pressure system interventions shows a particularly advantageous indicator, thus explaining the current tendency of Italian companies to invest in auxiliary systems.
3.2. Analysis of the Suggested Interventions
On the contrary, the sum of column (5th column of Table 2) is greater than 48 (sample size), assuming a value of 59. The significant difference between the total of (59) and the total of (20) may suggest an interest of Italian companies to improve their sustainability in the next four years.
Even in the case of the proposed interventions, most of the companies showed interest in technological solutions related to auxiliary systems, proposing to exploit variable speed machines, to improve the energy class of engines, or to improve the electricity transformers. Another suggested solution was to use the ORC cycle to produce electricity (4 out of 34 companies).
Once again, the most attractive and most proposed technological solution for the next four years was the installation of inverters on compressors, pumps, or fans. Such a solution showed a relative frequency distribution ( of 0.40.
Table 6 and Table 7 summarize the energy savings and investment cost indicated by those companies that proposed a feasibility study. Table 8 reports the cost-effectiveness indicators calculated for the suggested interventions. Feasibility studies estimated electrical savings to be far greater than thermal savings in all areas, except the production lines and machines one. This result was strongly influenced by the technological measures in heat recovery systems. As in the applied interventions, also in the suggested measures, the highest energy saving was associated to the heat recovery area, accompanied however by a significant investment cost (Table 7). This area shows a relatively good cost-effectiveness indicator; indeed, only production lines and machines area has a better value of cost-effectiveness than thermal power plant and heat recovery systems (Table 8).
Table 6.
Energy savings assessed for the suggested technological measures in the various areas of intervention. The total annual savings are calculated as the sum of thermal energy, electricity, and fuel savings.
Table 7.
Investments assessed for the suggested measures in the areas of intervention.
Table 8.
Cost-effectiveness indicator for each area of intervention.
Suggested technological measures can also be analyzed distinguishing for their payback time class (PBT, Figure 5). In this case, 55 measures report quantitative information: measures with PBT between one and two years represent 40% (5.3 ktoe/year) of total annual potential saving. Further 20% of potential saving is associated with measures having a PBT between 3 and 5 years (3.2 ktoe/year).
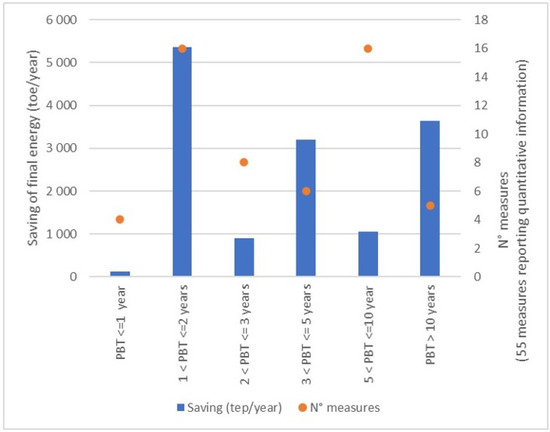
Figure 5.
Annual saving and suggested measures according to PBT classes.
Finally, Figure 6 shows that 75% of potential saving (10.6 ktoe/year) can be achieved by mobilizing 40% of total investment associated with suggested measures (around 19 million Euro), highlighting that relatively less expensive measures are associated with a high saving potential.
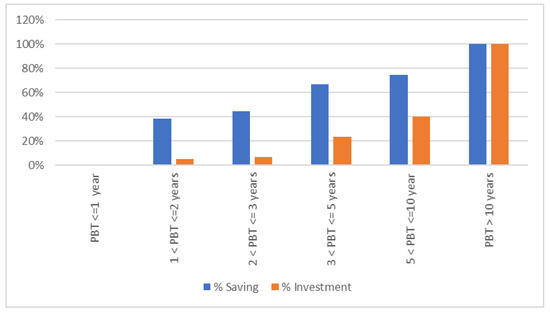
Figure 6.
Cumulative saving and investment according to PBT classes.
3.3. Other Results
In the energy audits, the sampled companies mentioned some technological interventions not found in the literature (red writings, Table 2). Among them, there are improvements in the electricity transformers, several interventions to make the kiln more efficient, some solutions to increase the sustainability of final milling, and so on. The other solutions listed in Table 2 were already suggested by scientific authors [4,15,16,17,34,35]. In this case, by mentioning them, expert industrialists confirmed their current goodness as sustainable technologies. As anticipated in Section 2, the results of the analyses were shared with expert industrialists to validate the generated output. Overall, consulting energy audits and sector experts allowed validating 10 solutions from the literature, while expanding Table A1, Table A2, Table A3, Table A4, Table A5, Table A6, Table A7, Table A8, Table A9, Table A10, Table A11, Table A12, Table A13, Table A14, Table A15, Table A16 and Table A17 (Appendix A) by adding 17 solutions. More information on the latter can be found in Appendix A.
4. Discussion
Today, sustainability is an aspect that is becoming increasingly important in industrial plants. It has many facets and covers aspects ranging from the location of production facilities [36], to the optimization of logistics in industrial plants [37], to the efficient energy consumption in production systems [1]. In terms of energy consumption, one of the most energy-intensive processes is cement production. Indeed, the cement industry is highly energy-intensive, determining around 7% of global industrial energy consumption each year.
Improving production technologies, by replacing inefficient equipment with better-performing ones, is a good strategy to reduce the energy consumption of a cement plant. In this sense, the market offers a wide range of solutions, and the scientific literature already provides several reviews of available energy-saving technologies [38].
However, technology is constantly developing, so the alternatives may change within a few years. Some solutions may become obsolete and fall into disuse while others may gain interest due to technological progress. For this reason, as shown by [19,25], besides consulting the literature, a viable way to keep the knowledge updated and also investigate the current attractiveness of each solution is to analyze a sample of real companies. To the best of the authors’ knowledge, similar work is missing for Italian companies, although Italian cement plants are among the most significant in Europe.
After a preliminary consultation of the existing literature to identify the available technological energy-saving solutions, based on the approach by Hasanbeigi et al. [27], in this paper, this gap is filled by investigating a sample of 48 production sites, analyzing production and energy consumption data (in a normalized and anonymous way) from energy audits collected by ENEA, pursuant to Art. 8 of the EED Directive.
In this paper, by applying the approach described in Section 2, the following information is investigated in energy audits: technological energy efficiency measures implemented by the companies in the last four years, sustainable energy efficiency measures proposed to be implemented in the next four years, the relative frequency distribution of application and the relative frequency distribution of suggestion of each technology, and, finally, the motivations that led each company to be interested in the respective proposed solutions. The degree of application and future perspectives of available technologies to reduce energy consumption are studied considering as a reference sample size the number of plants where a given intervention can be implemented. This information answers the research questions RQ1 and RQ2.
The main reasons for the choices and trends in technologies were also researched, analyzing the costs of the solutions, the energy benefits they bring, and, above all, the cost-effectiveness factor, given by the ratio between the cost of solutions and their impact on consumptions. This last aspect answers research question RQ3.
Results prove that in Italy, companies have focused their attention mainly on solutions to reduce the consumption of auxiliary systems such as compressors, engines, pumps, and fans. This is because of their easiness of implementation and the low operative costs required. This claim is validated by the historical data and feasibility studies reported by some of the surveyed companies.
In particular, the most attractive (most applied and most suggested) solution was the installation of inverters on compressors, pumps, or fans. Such a solution showed the following relative frequency distributions: 0.08 and 0.40.
Therefore, based on the results, it is possible to say that Italian companies will likely invest in technologies with a high relative frequency distribution value. Inefficient, non-variable speed engines and turbomachines will probably become obsolete, and a spread of ORC cycle systems for heat recovery is expected to occur (compatibly with budget availability and the eventual possibility of exploiting the opportunities of outsourcing the energy service).
Overall, the results of the analysis do not allow for the calculation of the payback period (PBP) of each technological intervention. However, by consulting the cost-effectiveness indicators and the applied and suggested solutions, we can infer that PBP drives the choice of companies. PBP is likely a parameter proportional to frequency, and low PBP values make technological solutions preferable.
It is worth mentioning the relevance of the effective sample size to estimate the frequencies of application and suggestion, indeed considering all the manufacturing plants for the interventions that can be implemented only for the full-cycle sites, would underestimate the frequencies. On the contrary, less appreciation will have to improve the pre-blending and silo storing processes or make stackers and reclaimers efficient.
Besides forecasting the development of technologies in Italy, the consultation of expert industrialists allowed collecting updated ideas for improving technologies, thus giving valuable inputs to scientific research. To the 198 solutions previously described by other scientific authors (Table A1, Table A2, Table A3, Table A4, Table A5, Table A6, Table A7, Table A8, Table A9, Table A10, Table A11, Table A12, Table A13, Table A14, Table A15, Table A16 and Table A17, Appendix A, black writings), 17 solutions were added (Table A1, Table A2, Table A3, Table A4, Table A5, Table A6, Table A7, Table A8, Table A9, Table A10, Table A11, Table A12, Table A13, Table A14, Table A15, Table A16 and Table A17, Appendix A, red writings). With regards to the final milling phase, it emerged that companies prefer making the upstream feeding more efficient by acting on feeders and dispensers, while literature insists on modifying the mill. Moreover, companies proposed solutions on transformers or auxiliary systems, whose opportunities are not emphasized in the cement sector literature. Furthermore, both literature and companies have shown interest in upgrading kilns. Indeed, in addition to the 18 solutions already expressed by scientific authors, 3 others were added by consulting energy audits, mainly concerning the improvement of burners. Finally, consulting audits allowed us to identify further solutions to the ones already found in the literature to make the preheating cyclones and blending silo more sustainable (see Appendix A).
5. Conclusions
The presented analysis of energy audits was useful to identify the degree of application and the future perspectives of the available technologies in the Italian industry, also allowing to identify the main reasons for these choices and trends. The outcome of the analysis is a realistic representation of the current Italian scenario, which clearly suggests that the choices of Italian companies are driven by considerations concerning the Pay Back Period of technological solutions. Indeed, companies currently prefer to act on auxiliary systems, improving the efficiency of engines and pressure systems and, especially, adopting variable speed drives. The low value of the cost-effectiveness indicator explains why companies have invested in such technological solutions in the last four years and why they will presumably continue doing so in the near future. Another noteworthy result of this study can be summarized as follows. Despite a high investment cost, companies are showing increasing interest in ORC cycle systems for heat recovery, and a spread of these solutions is expected to occur soon.
In addition to the description of the Italian scenario, a collateral outcome of this paper is an updated list of energy-saving technologies (which are divided by process stage and machine type). This work was entirely developed in cooperation with Federbeton. In particular, the analysis of the audits and the creation of the list of technologies (Appendix A) was carried out by the University of Florence and ENEA. Subsequently, this list was shared with Federbeton and the observations of plant managers and other sector experts were collected. Consequently, the generated list of technologies was validated by both the main Italian entities in the field of cement (Federbeton) and energy (ENEA) efficiency. The provided list of technologies could be useful for companies willing to improve their sustainability by implementing new technological opportunities. In fact, a concise and up-to-date representation of possible strategies to reduce the consumption of technologies can help industrialists to clarify what maneuvers can be implemented in the various plant areas, both suggested by literature studies and sector experts. In this sense, the tables provided in Appendix A can represent a decision support tool.
There are two limitations in this research: First, to keep the list of technological measures (Appendix A) updated, the analysis here proposed should be regularly repeated in the future. Second, the present study is mainly based on the consultation of energy audits carried out by obliged companies, which are only a part of all Italian companies in the cement sector.
However, the results emerging from the analysis could be interesting both at the academic and industrial levels. In fact, consulting real companies allows obtaining a precise view of the currently interesting technologies in the specific production sector considered, thus updating the state of the art of literature. Moreover, a generic company willing to improve its sustainability in a specific plant area/machine (for instance the one affected by higher energy consumption) can consult the present paper to quickly identify the available alternatives. In this perspective, this article not only gives a clear picture of the Italian situation but could also be useful for companies in the cement sector working outside the Italian nation.
Future developments of this work could be as follows. First of all, it would be interesting to develop a multi-criteria ranking of the available technological solutions, evaluating aspects such as installation cost, operational and maintenance costs, payback period, energy-saving achieved, and so on. The obtained ranking could help companies in choosing the most suitable solution based on their requirements and needs. Secondly, it would be worthwhile studying other countries, to verify whether the Italian situation is in line with the international trend. Thirdly, the proposed study could be repeated in manufacturing sectors other than cement. Finally, the proposed study could be repeated in the future (say in the next ten years) to determine if radical changes have happened or not.
Author Contributions
Conceptualization, A.C., L.L., and F.D.C.; methodology, A.C., L.L., and F.D.C.; software, C.M., M.S., F.M., A.C., and L.L.; validation, A.C., L.L., F.D.C., F.M., M.S., and C.M.; formal analysis, A.C., L.L., and C.M.; investigation, A.C., L.L., and C.M.; resources, C.M., M.S.; data curation, A.C., L.L., and C.M.; writing—original draft preparation, A.C.; writing—review and editing L.L., F.D.C., C.M., F.M., and M.S.; visualization, A.C.; supervision, F.D.C.; project administration, F.D.C., F.M., and M.S.; funding acquisition, M.S. and F.M. All authors have read and agreed to the published version of the manuscript.
Funding
This work is part of the Electrical System Research (PTR 2019-2021), implemented under Programme Agreements between the Italian Ministry for Economic Development and ENEA, CNR, and RSE S.p.A.
Institutional Review Board Statement
Not applicable.
Informed Consent Statement
Not applicable.
Data Availability Statement
Not applicable.
Acknowledgments
The authors gratefully acknowledge the technical support provided by the Italian Association Federbeton Confindustria.
Conflicts of Interest
The authors declare no conflict of interest.
Appendix A
The principal technological solutions described in the literature for reducing the energy consumption of a cement production plant can be summarized as shown in Table A1, Table A2, Table A3, Table A4, Table A5, Table A6, Table A7, Table A8, Table A9, Table A10, Table A11, Table A12, Table A13, Table A14, Table A15, Table A16 and Table A17. Each table refers to the strategies (3rd column) that can be implemented to improve a specific process operation (table header), dividing the available alternatives according to the machinery (1st column) and the object of the machinery involved (2nd column).
Each technological alternative is associated with the bibliographic reference consulted to identify it (4th column). In light of this, readers interested in finding out more about individual solutions can consult the 4th column of each Table.
To create Table A1, Table A2, Table A3, Table A4, Table A5, Table A6, Table A7, Table A8, Table A9, Table A10, Table A11, Table A12, Table A13, Table A14, Table A15, Table A16 and Table A17, we initially followed the approach proposed by [24], identifying the major production processes and corresponding energy efficient technologies by screening the previous literature studies. The solutions identified during this stage were written in black in the tables.
Subsequently, as already described in Section 2, other solutions detected through the energy audits were added to the alternatives found in the literature. The solutions identified in this phase were written in red in the tables. The list of technology solutions was shared with Federbeton and its content was reviewed and validated by sector experts. Only for the solutions indicated by the experts as currently obsolete, appropriate comments were inserted in a 5th column.
Table A1.
Technological energy-saving solutions for crushing.
Table A1.
Technological energy-saving solutions for crushing.
| Process Machinery | Solution Object | Energy-Saving Technological Solution | Reference |
|---|---|---|---|
| Crusher | Feeder | Installing modern gravimetric feeders and scales for efficient raw material feeding into the crusher | [4] |
| Crusher | Screening | Installing machines for preliminary screening | [4] |
| Crusher | Screening | Improving screening efficiency through efficient designs | [10] |
| Crusher | Crusher | Installing a hammer crusher (preferable if the moisture content is less than 10%) with or without a screen | [4] |
| Crusher | Crusher | Installing a twin-rotor hammer crusher (preferable if the moisture content less than 10%) with or without a screen | [39] |
| Crusher | Crusher | Installing a compact impact crusher (also known as a monorail impact crusher) | [39,40] |
| Crusher | Crusher | Installing an impact crusher (also known as a twin-rotor impact crusher) | [4] |
| Crusher | Crusher | Installing a jaw crusher (also known as a toggle crusher) | [4] |
| Crusher | Crusher | Installing a double toggle crusher | [39] |
| Crusher | Crusher | Installing a rotary crusher | [4] |
| Crusher | Crusher | Installing a roller crusher (cylinders) | [4] |
| Crusher | Crusher | Installing a toothed roller crusher (teeth ensure better distribution of the forces involved) | [39] |
| Crusher | Crusher | Installing a single toothed roller crusher | [39] |
| Crusher | Crusher | Installing a semi-mobile or mobile crusher | [4] |
Table A2.
Technological energy-saving solutions for quality control.
Table A2.
Technological energy-saving solutions for quality control.
| Quality Control | |||
|---|---|---|---|
| Process Machinery | Solution Object | Energy-Saving Technological Solution | Reference |
| X-ray laboratory | X-ray laboratory | Installing an XRF laboratory (X-ray fluorescence) | [20] |
| X-ray laboratory | X-ray laboratory | Installing an automated XRF laboratory (X-ray fluorescence) | [20] |
| X-ray laboratory | X-ray laboratory | Installing a laboratory with a robotic and automated EDXRF spectrometer to sample the material mixture entering the mill | [20] |
| X-ray laboratory | X-ray spectrometer | Installing a cross-belt XRF EDXRF spectrometer on the conveyor belt from the pre-homogenization site to the mill | [20] |
| γ-ray laboratory | γ-ray laboratory | Installing a laboratory with a gamma-ray spectrometer (batch γ-ray) | [20] |
| γ-ray laboratory | γ-ray spectrometer | Installing a gamma-ray spectrometer at the crusher outlet (chute γ-ray) | [20] |
| γ-ray laboratory | γ-ray spectrometer | Installing a cross-belt γ-ray spectrometer on the conveyor belt from the pre-homogenization site to the mill | [20] |
| γ-ray laboratory | γ-ray spectrometer | Installing a gamma-ray spectrometer at the crusher outlet (slurry γ-ray) | [20] |
Table A3.
Technological energy-saving solutions for pre-blending.
Table A3.
Technological energy-saving solutions for pre-blending.
| Pre-Blending | |||
|---|---|---|---|
| Process Machinery | Solution Object | Energy-Saving Technological Solution | Reference |
| Stacker | Stacker | Installing a circular stacker | [40] |
| Stacker | Stacker | Installing a longitudinal stacker | [40] |
| Reclaimer | Reclaimer | Installing a circular reclaimer | [40] |
| Reclaimer | Reclaimer | Installing a longitudinal reclaimer | [11,40] |
Table A4.
Technological energy-saving solutions for slurry production.
Table A4.
Technological energy-saving solutions for slurry production.
| Slurry Production | ||||
|---|---|---|---|---|
| Process Machinery | Solution Object | Energy-Saving Technological Solution | Reference | Comments from Sector Experts |
| Wash-mill | Wash-mill | Installing a closed-circuit washer | [4,27] | |
| Mill | Mill | Installing a tubular mill for wet and semi-wet processes | [4] | Solution reported in literature, but currently obsolete |
| Mill | Mill | Installing a ball mill for wet and semi-wet processes | [4] | Solution reported in literature, but currently obsolete |
Table A5.
Technological energy-saving solutions for drying.
Table A5.
Technological energy-saving solutions for drying.
| Drying | |||
|---|---|---|---|
| Process Machinery | Solution Object | Energy-Saving Technological Solution | Reference |
| Dryer | Dryer | Installing a rotary drum dryer with parallel flow | [41] |
| Dryer | Dryer | Installing a rotary drum dryer with opposing flows | [41] |
| Dryer | Dryer | Installing a solar dryer | [12] |
| Dryer | Dryer | Installing a rapid dryer | [40] |
| Dryer | Dryer | Installing a pre-dryer before a ball mill or tube mill | [40] |
| Dryer | Dryer | Installing a filter press (for the semi-wet process) | [9] |
| Dryer | Dryer | Installing a dryer-pulverizer (dedicated machine for simultaneous crushing and drying) | [40] |
| Dryer | Dryer | Installing an impact dryer | [40] |
| Dryer | Dryer | Installing a tandem drying grinding (a combination of hammer mill and ventilated ball mill) | [40] |
| Dryer | Dryer | Install mechanical air separators | [40] |
Table A6.
Technological energy-saving solutions for grinding raw materials.
Table A6.
Technological energy-saving solutions for grinding raw materials.
| Grinding Raw Materials | |||
|---|---|---|---|
| Process Machinery | Solution Object | Energy-Saving Technological Solution | Reference |
| Mill | Transport systems | Installing a weighing belt for raw materials entering the mill | [4] |
| Mill | Mill | Installing a tube mill with central discharge | [4] |
| Mill | Mill | Installing a tube mill with a closed-circuit final discharge | [4] |
| Mill | Mill | Installing a ball mill | [4] |
| Mill | Mill | Installing a ventilated ball mill | [4] |
| Mill | Mill | Installing a central discharge ball mill | [4] |
| Mill | Mill | Installing a ball mill with a closed-circuit final discharge | [4] |
| Mill | Mill | Installing a horizontal roller mill | [4,15,27] |
| Mill | Mill | Installing an autogenous mill | [4] |
| Mill | Mill | Installing a high-pressure roller mill | [4] |
| Mill | Mill | Installing a track and ball vertical mill | [39] |
| Mill | Mill | Installing a vertical roller mill | [13,16,35] |
| Mill | Mill | Grinding the various materials entering the mill separately according to their fineness | [35] |
| Mill | Mill | Replacing and improving the abrasive material used for the balls | [16] |
| Mill | Mill | Installing a roller press in addition to a ball mill | [16,35] |
| Mill | Mill | Grinding the various materials entering the mill separately according to their hardness | [35] |
| Mill | Mill | Installing a dopplerotator mill | [42] |
| Mill | Mill | Installing an aerofall-mill (autogenous mill) | [40] |
| Mill | Mill | Installing a ventilated mill | [40] |
| Mill | Mill/Separator | Installing a mill with a dynamic separator and cyclones with a process filter | Energy audits |
| Separator | Separator | Installing a high-efficiency rotating cage separator | [4,9,35] |
| Separator | Separator | Installing a high-efficiency air separator | [4,9,23] |
| Separator | Separator | Installing a static grid separator | [40] |
| Mill | Mill’s fans | Installing a three-fan system and one fan that is charged to the operations of the vertical roller crusher (cylinders) | [15] |
| Mill | Boilers | Replacing boilers with more advanced and efficient ones | Energy audits |
| Mill and cyclones | Mill and cyclones | Eliminating two cyclones after introducing an electrofilter and a bag filter for the mill | Sample of analyzed companies |
Table A7.
Technological energy-saving solutions for blending.
Table A7.
Technological energy-saving solutions for blending.
| Blending | |||
|---|---|---|---|
| Process Machinery | Solution Object | Energy-Saving Technological Solution | Reference |
| Blending silo | Blending silo | Removing leaks in the compressed air circuit by installing seals or other devices | [9,14] |
| Blending silo | Blending silo | Sizing the air circuit correctly | [9,14] |
| Blending silo | Blending silo | Installing a flow-controlled, multi-outlet blending silo | [40] |
| Blending silo | Blending silo | Installing a flow-controlled cone blending silo | [40] |
| Blending silo | Blending silo | Installing a turbulence blending silo | [40] |
| Blending silo | Blending silo | Restoring the structural integrity of the blending silo and eliminate leaks in its structure | [14] |
| Blending silo | Blending silo | Installing a gravitational blending silo | [13,16,27] |
| Blending silo | Blending tank | Installing a blending tank | [9] |
| Blending silo | Tank’s agitator | Installing high-efficiency agitators | [9] |
| Blending silo | Silo’s blower | Replacing silo’s blowers with inverter-equipped screw compressors | Energy audits |
Table A8.
Technological energy-saving solutions for preheating.
Table A8.
Technological energy-saving solutions for preheating.
| Preheating | ||||
|---|---|---|---|---|
| Process Machinery | Solution Object | Energy-Saving Technological Solution | Reference | Comments from Sector Experts |
| Preheater | Preheater | Installing a cyclone preheater with calciner | [4] | |
| Preheater | Preheater | Installing a grid preheater with calciner | [4] | Solution reported in literature, but currently obsolete |
| Preheater | Preheater | Installing a cyclone preheater | [4] | |
| Preheater | Preheater | Installing a grid preheater | [4] | Solution reported in literature, but currently obsolete |
| Preheater | Preheater | Recovering hot gases from the preheating tower | [4] | |
| Preheater | Cyclones | Increasing the number of cyclones in the cyclone preheater | [15,27,35] | |
| Preheater | Cyclones | Optimizing the number of cyclone stages considering the characteristics and properties of the raw materials and fuels used | [4] | |
| Preheater | Cyclones | Reducing the cyclones from 16 to 12 in the Lepol grid preheater | Sample of analyzed companies | |
| Preheater | Cyclones | Replacing the cyclone preheater with a low pressure drop cyclone preheater | [13,15,17,23,27,35] | |
| Preheater | Preheater’s fans | Installing high-efficiency fans in the preheater | [9,15,27] | |
| Pre-calciner | Pre-calciner | Replacing the existing pre-calciner with a more advanced and efficient one | [13] | |
| Pre-calciner | Pre-calciner | Installing a pre-calciner with a high solid/gas ratio | [4,18] | |
| Pre-calciner | Burners | Replacing calciner burners | [4] | |
Table A9.
Technological energy-saving solutions for heating.
Table A9.
Technological energy-saving solutions for heating.
| Heating | ||||
|---|---|---|---|---|
| Process Machinery | Solution Object | Energy-Saving Technological Solution | Reference | Comments from Sector Experts |
| Kiln | Dispensers | Installing gravimetric dosing units for efficient flour feeding into the kiln | [4] | |
| Kiln | Kiln | Installing a rotary kiln | [4] | |
| Kiln | Kiln | Installing a vertical kiln | [4] | |
| Kiln | Kiln | Improving the refractory lining of the kiln | [9,15,17,23,27] | |
| Kiln | Kiln | Installing a fluidized bed advanced cement kiln | [18] | Emerging solution |
| Kiln | Kiln | Improving the combustion system | [4,18] | |
| Kiln | Kiln | Minimizing leakage or entry of unwanted air/gases into the kiln. Alternatively, replacing inlet and outlet seals | [9,17] | |
| Kiln | Kiln | Stabilizing the outer shell of the kiln | [4,18] | |
| Kiln | Kiln | Minimizing bypass flow | [4,18] | |
| Kiln | Kiln | Installing indirect combustion systems | [4,18] | |
| Kiln | Kiln | Reducing the pressure of the methane gas coming from international network through a turbine. The turbine can be connected to a generator to produce electrical energy. | [4] | |
| Kiln | Kiln | Replacing the existing kiln with a higher capacity one | [13,35] | |
| Kiln | Kiln | Installing an automatic conduction system for the kiln | Energy audits | |
| Kiln | Kiln’s fans | Installing fans for cooling the kiln with a larger inlet diameter | [9] | |
| Kiln | Fuel transport system | Installing a gravimetric feeding system to efficiently feed solid fuel | [4] | |
| Kiln | Fuel transport system | Installing pumps for liquid fuel burners | [4] | |
| Kiln | Burners | Installing single-channel burners | [4] | |
| Kiln | Burners | Installing multi- channel burners | [4] | |
| Kiln | Burners | Installing an advanced dosing device for dosing powder to the main burner of the kiln to optimize consumption | Energy audits | |
| Kiln | Burners | Installing intermediate inverter exhausters for the kiln to optimize the power output during the firing process | Energy audits | |
Table A10.
Technological energy-saving solutions for cooling.
Table A10.
Technological energy-saving solutions for cooling.
| Cooling | ||||
|---|---|---|---|---|
| Process Machinery | Solution Object | Energy-Saving Technological Solution | Reference | Comments from Sector Experts |
| Cooler | Cooler | Installing a tube cooler | [4] | Solution reported in literature, but currently obsolete |
| Cooler | Cooler | Installing a planetary cooler | [4] | Solution reported in literature, but currently obsolete |
| Cooler | Cooler | Installing a travelling grid cooler | [4] | |
| Cooler | Cooler | Installing an oscillating grid cooler | [4] | |
| Cooler | Cooler | Replacing the ventilation system of the touring cooler with a more efficient one | [4,13,35] | |
| Cooler | Cooler | Adding a static grid to the touring grid cooler | [4,13,35] | |
| Cooler | Cooler | Installing a vertical cooler | [4] | |
| Cooler | Cooler | Replacing existing grid coolers with high-efficiency ones | [4] | |
| Cooler | Cooler | Optimizing energy recovery from the cooler by means of a static grid | [4] | |
| Cooler | Cooler | Installing a rotating cooling disc | [4] | |
| Cooler | Cooler | Installing a rapid cooler (only for white cement) | [4] | |
| Cooler | Cooler | Installing a pendulum frame for swinging grilles | [11] | |
| Cooler | Grid | Replacing existing grilles with more advanced and modern ones | [4] | |
| Cooler | Grid | Replacing the grill plates of the second-generation touring cooler | [4,13,35] | |
Table A11.
Technological energy-saving solutions for final milling.
Table A11.
Technological energy-saving solutions for final milling.
| Final Milling | ||||
|---|---|---|---|---|
| Process Machinery | Solution Object | Energy-Saving Technological Solution | Reference | Comments from Sector Experts |
| Mill | Dispensers | Installing weight-measuring devices for material entering the mill | Energy audits | |
| Mill | Feeder | Optimizing the feeding system installing more efficient and advanced systems | Energy audits | |
| Mill | Feeder | Installing a weighing belt for each material entering the mill | [4] | |
| Mill | Feeder | Installing a clinker flow regulator at the tube mill inlet | [4,18] | |
| Mill | Mill | Installing a ball mill with a closed circuit | [4] | |
| Mill | Mill | Installing a ball mill with closed circuit final discharge | [4] | |
| Mill | Mill | Installing a ball mill with open circuit final discharge | [4] | Solution reported in literature, but currently obsolete |
| Mill | Mill | Installing a vertical roller mill | [13] | |
| Mill | Mill | Installing a horizontal roller mill | [4] | |
| Mill | Mill | Installing a high-pressure roller press | [4] | |
| Mill | Mill | Installing a vertical roller mill before the ball mill | [4,18] | |
| Mill | Mill | Installing a roller press before the ball mill | [4,18] | Uncommon solution |
| Mill | Mill | Improving the abrasive material used for the balls or replacing the balls with better performing ones | [4,18] | |
| Mill | Mill | Installing a classification liner for the ball mill at the entrance to the second chamber | [4,18] | |
| Mill | Mill | Installing plasma technology | [18] | Emerging solution |
| Mill | Mill | Installing ultrasound technology | [18] | Emerging solution |
| Mill | Mill | Installing an automatic conduction system for ball mills | Energy audits | |
| Mill | Mill’s fans | Replacing mill fans with high-efficiency ones | [15] | |
Table A12.
Technological energy-saving solutions for fuel grinding.
Table A12.
Technological energy-saving solutions for fuel grinding.
| Fuel Grinding | |||
|---|---|---|---|
| Process Machinery | Solution Object | Energy-Saving Technological Solution | Reference |
| Mill | Fuel transport system | Installing a weighing belt for raw materials entering the mill | [4] |
| Mill | Mill | Installing a ventilated ball mill for solid fuel | [4] |
| Mill | Mill | Installing a vertical roller mill for solid fuel | [4] |
| Mill | Mill | Installing an impact mill for solid fuel | [4] |
| Mill | Mill | Installing a roller press for solid fuel | [27] |
| Mill | Separator | Installing a high efficiency separator/classifier | [13] |
Table A13.
Technological energy-saving solutions for gas treatment.
Table A13.
Technological energy-saving solutions for gas treatment.
| Exhaust Gas Treatment | |||
|---|---|---|---|
| Process Machinery | Solution Object | Energy-Saving Technological Solution | Reference |
| Cooling tower | Cooling tower | Installing a cooling tower | [4] |
| Selective non-catalytic reduction system (SNCR) | SNCR | Installing an SNCR (difficult for long kilns) | [4] |
| Selective catalytic reduction system (SCR) | SCR | Installing a low dust SCR | [4] |
| Selective catalytic reduction system | SCR | Installing a high dust SCR | [4] |
| Selective catalytic reduction system | SCR | Replacing existing low dust SCR with high efficiency low dust SCR | [4] |
| Selective catalytic reduction system | SNCR | Replacing existing SNCRs with high efficiency SNCRs | [4] |
| Activated carbon | Activated carbon | Installing emission reduction systems based on activated carbon | [4] |
| Wet scrubber | Wet scrubber | Installation of a wet scrubber system | [4] |
Table A14.
Technological energy-saving solutions for dedusting.
Table A14.
Technological energy-saving solutions for dedusting.
| Dedusting | ||||
|---|---|---|---|---|
| Process Machinery | Solution Object | Energy-Saving Technological Solution | Reference | Comments from Sector Experts |
| Electrostatic precipitator (ESP) | ESP | Installing an ESP | [4] | |
| ESP | Vibration system | Replacing the electrostatic precipitator vibration system with a more modern and efficient one | [4] | |
| ESP | Electrostatic field generator | Replacing ESP’s electrostatic field generator with a more advanced and efficient one | [4] | |
| ESP | Cleaning system | Installing a vibrating precipitator cleaning system | [4] | |
| ESP and filters | ESP and filters | Installing a hybrid filter system | [4] | |
| Dust filtration system | Dust filtration system | Installing an electrofilter | Energy audits | |
| Dust filtration system | Dust filtration system | Installing a dust filtration system with vertical cylindrical bag fabric filters | [4] | |
| Dust filtration system | Dust filtration system | Installing a dust filtration system with horizontal pocket fabric filters | [4] | Horizontal bag filters are rarely used |
| Dust filtration system | Cleaning system | Installing a low-pressure pulse jet cleaning system for dust filter systems with fabric filters | [4] | |
| Separator | Separator | Installing a high-efficiency air separator at the exhaust gas outlet of the cooler | [4] | |
Table A15.
Technological energy-saving solutions for other transport systems.
Table A15.
Technological energy-saving solutions for other transport systems.
| Other Transport Systems | |||
|---|---|---|---|
| Process Machinery | Solution Object | Energy-Saving Technological Solution | Reference |
| Transport systems | Transport systems | Installing a cup elevator to feed raw materials into the mill | [27] |
| Transport systems | Transport systems | Installing a conveyor belt to feed raw materials into the tank | [9] |
| Transport systems | Transport systems | Installing a cup elevator to feed the blending silo | [15] |
| Transport systems | Transport systems | Installing a conveyor belt to feed clay into the wash/mill | [9] |
| Transport systems | Transport systems | Installing efficient transport systems to handle material entering and leaving the crusher | [17] |
| Transport systems | Transport systems | Installing a conveyor belt to feed the dryer | [9] |
| Transport systems | Conveying systems | Installing a cup lifter to feed raw materials into the kiln | [15,27] |
| Transport systems | Conveying systems | Installing a conveyor belt to feed the oven | [9] |
| Transport systems | Conveying systems | Installing a conveyor belt to bring material to the pelletizer | [9] |
| Transport systems | Conveying systems | Installing a conveyor belt to feed preheater/calciner | [9] |
Table A16.
Technological energy-saving solutions for heat recovery systems.
Table A16.
Technological energy-saving solutions for heat recovery systems.
| Heat Recovery Systems | |||
|---|---|---|---|
| Process Element | Solution Object | Energy-Saving Technological Solution | Reference |
| Heat recovery systems | Heat recovery systems | Installing a high-efficiency air separator heat exchanger on the exhaust gas outlet from the cooler | [4] |
| Heat recovery systems | Heat recovery systems | Installing a steam turbine for electricity production | [35] |
| Heat recovery systems | Heat recovery systems | Installing an ORC turbine for electricity production | [35] |
| Heat recovery systems | Heat recovery systems | Installing a turbine for electricity production using the Kalina cycle | [35] |
| Heat recovery systems | Kiln | Installing heat exchanger to recover heat from the flue gases and pre-heat the thermal oil for the kiln fuel | Energy audits |
| Heat recovery systems | Kiln | Installing heat recovery systems to use the hot gases leaving the kiln to dry raw materials | [4] |
| Heat recovery systems | Cooler | Installing systems to recover heat from the thermal waste of the cooler (useful for heating offices or other) | [4] |
Table A17.
Technological energy-saving solutions for auxiliary systems.
Table A17.
Technological energy-saving solutions for auxiliary systems.
| Auxiliary Systems | |||
|---|---|---|---|
| Process Machinery | Solution Object | Energy-Saving Technological Solution | Reference |
| Engines | Engines | Installing variable speed motors (motors with inverters) | [15,16,27] |
| Engines | Engines | Installing efficient electric motors (class IE2, IE3, or IE4) | [15,16,27] |
| Engines | Engines | Resetting the pre-tensioning of the motor belts | [21] |
| Engines | Engines | Re-phasing the motors (three-phase) to rebalance the loads of each phase using capacitors | [17] |
| Engines | Engines | Replacing motor belts with newer, more efficient ones to optimize tensions. For example, replacing V-belts with toothed belts (preferably for high torques) | [17,21] |
| Engines | Engines | Rewinding motors already in the system | [17] |
| Engines | Engines | Installing inverters in motors | [17] |
| Engines | Engines | Replacing belt motors with hydraulic motors or gearboxes | [17] |
| Engines | Engines | Re-wiring the engines | [9] |
| Engines | Engines | Installing motors correctly sized in relation to the power required by the system | [17,18] |
| Pressure systems | Pressure systems | Replacing compressors, air supply and refrigeration systems with more advanced and efficient machinery | [17,34,43] |
| Pressure systems | Pressure systems | Installing inverters on compressors, pumps, or fans (i.e., kiln fans) | [17,34] |
| Pressure systems | Pressure systems | Select turbomachinery appropriate to plant requirements | [4,18] |
| Pressure systems | Pressure systems | Installing tanks and systems for storing excess compressed air | [4,44] |
| Pressure systems | Compressors | Replacing compressors needed to cool, suck, stir or inflate glass with fans and blowers | [17,34] |
| Pressure systems | Pressure systems | Insulating pipes, valves, and pumps and installing sealing to reduce air leakage | [4] |
| Pressure systems | Compressors | Installing gaskets or other devices or replacing damaged components to reduce air leakage at pipe joints and leakage points | [4,17,34,43,45] |
| Pressure systems | Compressors | Replacing compressors needed to clean or remove debris with brushes, vacuum pumps, or blowers | [17,34] |
| Pressure systems | Compressors | Replacing compressors needed to move components with electric or hydraulic actuators | [17,34] |
| Pressure systems | Compressors | Replacing compressors needed to create a vacuum with vacuum pumps | [17,34] |
| Pressure systems | Compressors | Replacing compressors to power machines, tools, and actuators with electric motors | [17,34] |
| Pressure systems | Compressors | Installing compressors powered by electricity (with lower maintenance costs, longer service life and less down-time) | [4,18] |
| Pressure systems | Compressors | Installing gas-fueled compressors (for which it is easier to obtain variable-speed machines and for which lower plant operating costs are obtained) | [4,18] |
| Pressure systems | Compressed air distribution systems | Correctly size fittings, filters, and hoses to minimize air leaks | [45] |
| Pressure systems | Compressed air distribution systems | Fitting valves and pressure regulators in compressed air distribution systems to regulate air supply or shut it off when the machinery is not in use | [17,34] |
| Pressure systems | Compressed air distribution systems | Installing pipes with the largest possible diameter in air distribution systems to reduce losses | [4,18] |
| Pressure systems | Compressor nozzles | Replacing and renewing compressed air delivery nozzles (which may be worn, clogged, or corroded) | [4,18] |
| Pressure systems | Ventilation system fans | Replace gas handling fans with more efficient ones | [17,34,43] |
| Pressure systems | Heat exchangers | Installing heat exchangers or other systems to recover heat from the compressors | [43,45] |
| Pressure systems | Silo cement extraction plant | Replacing pumps with rotocells | Energy audits |
| Pressure systems | Chilled water distribution systems | Installing shut-off valves on the cooling water branches (pushed by pumps), to block flows when the system is at a standstill | Energy audits |
| Electricity transformers | Electricity transformers | Optimizing transformer losses in the electrical cabin | [17,34] |
| Electricity transformers | Electricity transformers | Renewing transformers in the electrical cabin (preferably installing k-factor transformers) | Energy audits |
| Electricity transformers | Electricity transformers | Replacing oil transformers with resin transformers (having less leakage) | Energy audits |
References
- Xu, J.-H.; Fleiter, T.; Eichhammer, W.; Fan, Y. Energy consumption and CO2 emissions in China’s cement industry: A perspective from LMDI decomposition analysis. Energy Policy 2012, 50, 821–832. [Google Scholar] [CrossRef]
- Atmaca, A.; Yumrutaş, R. Analysis of the parameters affecting energy consumption of a rotary kiln in cement industry. Appl. Therm. Eng. 2014, 66, 435–444. [Google Scholar] [CrossRef]
- Kermeli, K.; Edelenbosch, O.Y.; Crijns-Graus, W.; Van Ruijven, B.J.; Mima, S.; Van Vuuren, D.P.; Worrell, E. The scope for better industry representation in long-term energy models: Modeling the cement industry. Appl. Energy 2019, 240, 964–985. [Google Scholar] [CrossRef]
- Schorcht, F.; Kourti, I.; Scalet, B.M.; Roudier, S.; Delgado Sancho, L. Best Available Techniques (BAT) Reference Document for the Production of Cement, Lime and Magnesium Oxide. In Industrial Emissions Directive 2010/75/EU; Joint Research Centre, European Commission: Seville, Spain, 2013; pp. 1–506. [Google Scholar]
- Vinci, G.; D’Ascenzo, F.; Esposito, A.; Musarra, M.; Rapa, M.; Rocchi, A. A sustainable innovation in the Italian glass production: LCA and Eco-Care matrix evaluation. J. Clean. Prod. 2019, 223, 587–595. [Google Scholar] [CrossRef]
- Ishak, S.A.; Hashim, H. Low carbon measures for cement plant—A review. J. Clean. Prod. 2015, 103, 260–274. [Google Scholar] [CrossRef]
- Su, T.-L.; Chan, D.Y.-L.; Hung, C.-Y.; Hong, G.-B. The status of energy conservation in Taiwan’s cement industry. Energy Policy 2013, 60, 481–486. [Google Scholar] [CrossRef]
- Alghadafi, E.M.; Latif, M. Simulation of a libyan cement factory. In Proceedings of the World Congress on Engineering (WCE), London, UK, 30 June–2 July 2010; Volume 3, pp. 2292–2296. [Google Scholar]
- Madlool, N.; Saidur, R.; Rahim, N.; Kamalisarvestani, M. An overview of energy savings measures for cement industries. Renew. Sustain. Energy Rev. 2013, 19, 18–29. [Google Scholar] [CrossRef]
- Moray, S.; Throop, N.; Seryak, J.; Schmidt, C.; Fisher, C.; D’Antonio, M. Energy efficiency opportunities in the stone and asphalt industry. In Proceedings of the Twenty-Eighth Industrial Energy Technology Conference, New Orleans, LA, USA, 9–12 May 2006; pp. 71–83. [Google Scholar]
- Alsop, P.A. Cement Plant Operations Handbook: For Dry Process Plants; Tradeship Publications Ltd.: Surrey, UK, 2007. [Google Scholar]
- Shanmugam, V.; Natarajan, E. Experimental investigation of forced convection and desiccant integrated solar dryer. Renew. Energy 2006, 31, 1239–1251. [Google Scholar] [CrossRef]
- Brunke, J.-C.; Blesl, M. Energy conservation measures for the German cement industry and their ability to com-pensate for rising energy-related production costs. J. Clean. Prod. 2014, 2, 94–111. [Google Scholar] [CrossRef]
- Lynskey, G. Blending/Homogenizing Silos–All They’re Cracked up to Be? In Proceedings of the 2019 IEEE-IAS/PCA Cement Industry Conference (IAS/PCA), St. Louis, MO, USA, 28 April–2 May 2019; pp. 1–4. [Google Scholar] [CrossRef]
- Hasanbeigi, A.; Menke, C.; Therdyothin, A. The use of conservation supply curves in energy policy and economic analysis: The case study of Thai cement industry. Energy Policy 2010, 38, 392–405. [Google Scholar] [CrossRef]
- Hasanbeigi, A.; Morrow, W.; Masanet, E.; Sathaye, J.; Xu, T. Energy efficiency improvement and CO2 emission reduction opportunities in the cement industry in China. Energy Policy 2013, 57, 287–297. [Google Scholar] [CrossRef]
- Worrell, E.; Galitsky, C.; Price, L. Energy Efficiency Improvement and Cost Saving Opportunities for Cement Making’, Lbnl-54036-Revision; Ernest Orlando Lawrence Berkeley National Laboratory, University of California: Berkeley, CA, USA, 2008. [Google Scholar]
- Institute for Industrial Productivity. Explore Energy Efficiency Technologies across the Industrial Sectors. 2016. Available online: http://www.iipinetwork.org/ (accessed on 11 January 2021).
- Saha, B.K.; Chakraborty, B. Utilization of low-grade waste heat-to-energy technologies and policy in Indian industrial sector: A review. Clean Technol. Environ. Policy 2016, 19, 327–347. [Google Scholar] [CrossRef]
- Bond, J.; Coursaux, R.; Worthington, R. Blending systems and control technologies for cement raw materials. IEEE Ind. Appl. Mag. 2000, 6, 49–59. [Google Scholar] [CrossRef]
- Fischer, R. Crusher and screen drives for the mining, aggregate and cement industries. In Proceedings of the IEEE Cement Industry Technical Conference, Dallas, TX, USA, 10–14 May 1992; pp. 108–147. [Google Scholar] [CrossRef]
- Fujimoto, S. Modern technology impact on power usage in cement plants. IEEE Trans. Ind. Appl. 1994, 30, 553–560. [Google Scholar] [CrossRef]
- Hasanbeigi, A.; Price, L.; Lin, E. Emerging energy-efficiency and CO2 emission-reduction technologies for cement and concrete production: A technical review. Renew. Sustain. Energy Rev. 2012, 16, 6220–6238. [Google Scholar] [CrossRef]
- Mokhtar, A.; Nasooti, M. A decision support tool for cement industry to select energy efficiency measures. Energy Strat. Rev. 2020, 28, 100458. [Google Scholar] [CrossRef]
- Huang, Y.-H.; Chang, Y.-L.; Fleiter, T. A critical analysis of energy efficiency improvement potentials in Taiwan’s cement industry. Energy Policy 2016, 96, 14–26. [Google Scholar] [CrossRef]
- Wang, Y.; Li, K.; Gan, S.; Cameron, C. Analysis of energy saving potentials in intelligent manufacturing: A case study of bakery plants. Energy 2019, 172, 477–486. [Google Scholar] [CrossRef]
- Hasanbeigi, A.; Price, L.; Lu, H.; Lan, W. Analysis of energy-efficiency opportunities for the cement industry in Shandong Province, China: A case study of 16 cement plants. Energy 2010, 35, 3461–3473. [Google Scholar] [CrossRef]
- Supino, S.; Malandrino, O.; Testa, M.; Sica, D. Sustainability in the EU cement industry: The Italian and German experiences. J. Clean. Prod. 2016, 112, 430–442. [Google Scholar] [CrossRef]
- Sustainability Report Federbeton. Federbeton Confindustria. 2019. Available online: https://www.federbeton.it/Pubblicazioni (accessed on 3 November 2020).
- Oggioni, G.; Riccardi, R.; Toninelli, R. Eco-efficiency of the world cement industry: A data envelopment analysis. Energy Policy 2011, 39, 2842–2854. [Google Scholar] [CrossRef]
- Omer, A.M. Energy use and environmental impacts: A general review. J. Renew. Sustain. Energy 2009, 1, 53101. [Google Scholar] [CrossRef]
- Directive 2012/27/EU of the European Parliament and of the Council of 25 October 2012 on energy efficiency, amending Directives 2009/125/EC and 2010/30/EU and repealing Directives 2004/8/EC and 2006/32/EC Text with EEA relevance, Official Journal of the European Union. 2012. Available online: https://eur-lex.europa.eu/legal-content/EN/TXT/?uri=celex%3A32012L0027 (accessed on 29 March 2021).
- National Agency for New Technologies, Energy, and Sustainable Economic Development (ENEA). 9th Annual Energy Efficiency Report (Rapporto Annuale sull’Efficienza Energetica-RAEE). Available online: https://www.efficienzaenergetica.enea.it/pubblicazioni/raee-rapporto-annuale-sull-efficienza-energetica/rapporto-annuale-sull-efficienza-energetica-2021.html (accessed on 13 December 2020).
- Galitsky, C.; Worrell, E.; Masanet, E.; Graus, W. Energy Efficiency Improvement and Cost Saving Opportunities for the Glass Industry. An ENERGY STAR® Guide for Energy and Plant Managers’; University of California, Berkeley National, Laboratory: Berkeley, CA, USA, 2008. [Google Scholar] [CrossRef]
- European Cement Research Academy (ECRA). Development of State of the Art-Techniques in Cement Manufacturing: Trying to Look Ahead. In CSI/ECRA-Technology Papers 2017; European Cement, Research Academy GmbH, Dusseldorf, Geneva, March 2017; pp. 1–190. Available online: https://www.wbcsdcement.org/index.html (accessed on 18 January 2021).
- De Carlo, F.; Schiraldi, M.M. Sustainable choice of the location of a biomass plant: An application in Tuscany. Int. J. Eng. Technol. 2013, 5, 4261–4272. [Google Scholar]
- Cantini, A.; De Carlo, F.; Tucci, M. Application of the lean layout planning system in a leather bags manufacturing plant and proposal of an approach to engage the company’s staff in the research of the layout solution. In Proceedings of the Summer School Web, Bergamo, Italy, 9–11 September 2020. [Google Scholar]
- International Eneergy Agency. Driving Energy Efficiency in Heavy Industries; IEA: Paris, France, 2021; Available online: https://www.iea.org/articles/driving-energy-efficiency-in-heavy-industries (accessed on 29 March 2021).
- Pozzetti, A. Appunti di tecnologie industriali. In Rielaborazione Delle Lezioni del Prof Pozzetti; CUSL (Milano): Milan, Italy, 2003; pp. 1–354. ISBN 8881321823. [Google Scholar]
- Cement Equipment Corp. Infinity for Cement Equipment. 2021. Available online: https://www.cementequipment.org/home-page/ (accessed on 11 January 2021).
- Van Puyvelde, D.R. Modelling the hold up of lifters in rotary dryers. Chem. Eng. Res. Des. 2009, 87, 226–232. [Google Scholar] [CrossRef]
- Duda, W.H. La Fabbricazione del Cemento; ET Edizioni Tecniche: Milan, Italy, 1976. [Google Scholar]
- Benedetti, M.; Bonfa’, F.; Bertini, I.; Introna, V.; Ubertini, S. Explorative study on Compressed Air Systems’ energy efficiency in production and use: First steps towards the creation of a benchmarking system for large and energy-intensive industrial firms. Appl. Energy 2018, 227, 436–448. [Google Scholar] [CrossRef]
- Scalt, B.M.; Garcia Munoz, M.; Sissa, A.; Roudier, S.; Delgado Sancho, L. Best Available Techniques (BAT) Reference Document for the Manufacture of glass: Industrial Emissions Directive 2010/75/EU (Integrated Pollution Prevention and Control); Institute for Prospective Technological Studies (Joint Research Centre), European Commission: Seville, Spain, 2012; pp. 1–485. [Google Scholar] [CrossRef]
- Blaustein, E.; Radgen, R. Compressed Air Systems in the European Union; European Commission Project Report; LOG_X Verlag GmbH: Stuttgart, Germany, 2000; ISBN 3-932298-16-0. [Google Scholar]


Publisher’s Note: MDPI stays neutral with regard to jurisdictional claims in published maps and institutional affiliations. |
© 2021 by the authors. Licensee MDPI, Basel, Switzerland. This article is an open access article distributed under the terms and conditions of the Creative Commons Attribution (CC BY) license (https://creativecommons.org/licenses/by/4.0/).