Article

The Impact of Marketization on Sustainable Economic Growth—Evidence from West China

1
School of Big Data Application and Economics, Guizhou University of Finance and Economics, Guiyang 550000, China
2
School of Accounting and Finance, The Hong Kong Polytechnic University, Hong Kong 999077, China
3
School of Public Economics and Administration, Shanghai University of Finance and Economics, Shanghai 200433, China
*
Author to whom correspondence should be addressed.
Sustainability 2021, 13(7), 3745; https://doi.org/10.3390/su13073745
Submission received: 24 February 2021 / Revised: 20 March 2021 / Accepted: 25 March 2021 / Published: 27 March 2021

Abstract

:
In this paper, we aim to study the relation between the marketization level in the western region of China and its economic development, and to provide policy guidance for the economic development of underdeveloped regions. Mixed methods data analysis was conducted using panel data from 82 prefecture-level cities in west China from 2003 to 2017. The overall regression results show that the level of marketization has a significant role in promoting economic growth. At the same time, regional heterogeneity analyses show that the sub-indicators of marketization have different degrees of influence on economic growth in the southwest and northwest of China, whereas the overall level indicator plays a significant role in both regions. In addition, the threshold panel model was used to test whether the influence of marketization on economic growth in the western region had interval characteristics. Through the self-sampling method, it was found that there are double thresholds. In terms of the gradual progress of the marketization level range, it shows a trend of first increasing, then decreasing and then increasing again. The results show that the level of marketization in west China has significantly promoted the economic development of the western region. Additionally, the impact of marketization on economic development in relatively backward regions is gradually increasing and surpassing that of relatively developed regions. Underdeveloped areas in west China can stimulate their advantages by continuously promoting the construction of marketization and improving the level of economic organization, so as to gradually narrow the development gap between regions.

1. Introduction

After the drastic changes in Eastern Europe in early 1990s, Eastern European countries experienced fundamental changes in social systems and implemented marketization reform. However, some researchers suggest that marketization fails to drive economic growth based on their investigation on reforms in these countries [1,2]. Emerging markets demonstrated stronger endurance compared with developed markets [3], and marketization may have different effects on these two kinds of market. China started implementing system reforms to transition from a planned economy to a market economy in 1978. Over the next forty years, China realized phenomenal achievements in economic development. Marketization reform broke the shackles of traditional systems and mechanisms, improved efficiency in resource allocation and market exploration, and constantly unleashed economic vitality. China’s economy realized high-speed growth, with significant improvements in its comprehensive strengths and economic strengths. People’s livelihood also underwent historical progress as China on the whole transitioned from a hunger-afflicted society toward a moderately prosperous society [4]. For example, after healthcare reform, the input and output of medical research in China surpassed all other BRICS members (including Brazil, Russia, India, and South Africa) [5,6]. This serves as evidence that market-oriented reform has unleashed tremendous system benefits and has played a key role in driving China’s economic growth [7]. A comprehensive review of China’s current economy reveals that GDP growth in China reached its pinnacle in the first quarter of 2010. Since then, its GDP growth has gradually declined and the downward trend has continued for over ten years [8]. China’s economy has entered a new normal, characterized by medium-to-high-speed growth. Therefore, tackling downward pressure in the economy and fully unleashing the positive role of marketization reform in driving economic growth are key and urgent issues in China.
Marketization reform drives high-speed economic growth in China. However, it is worth mentioning that an imbalance in economic development among different regions is prominent. Shi and Wang [9] found, by fitting the curve showcasing the relation between regional marketization level and economic growth by Fan et al. [4], that marketization reform plays a major role in driving economic growth, but the imbalance between the eastern, central, and western regions of China is evident. The imbalance in economic development among different regions of China is closely associated with marketization. For example, the different levels of labor market maturity in different regions has different influences on regional economic growth performance [10]. Most researchers believe that a low level of marketization is the main reason for lagging economic development in the central and western regions of China [7]. As China implements large-scale development and opening-up in the western region and promotes the Belt and Road Initiative, issues in economic development in the western region have become increasingly prominent [11]. The western region covers a vast area. Except for the Sichuan Basin and Guanzhong Plain, the rest of the region is economically backward and awaits further development. The western region enjoys, among other assets, abundant mineral resources, land resources, and hydro resources. This lays a solid foundation for the region to develop its unique and advantageous industries. However, it has also resulted in a singular industrial structure and has become a ‘curse’ in terms of its lagging growth, constituting a major reason for the huge gap between the western region and the eastern region in economic development. Is there a bottleneck for marketization? Can marketization become the main driver of the economy in this underdeveloped region? This study aims to answer these questions by exploring the relation between marketization level in the western region and its economic development.

2. Literature Review

The intrinsic mechanism of economic development has long been the focus of economists. Research on this topic can be traced back to the division of labor by Adam Smith, who believed that the division of labor promotes the accumulation of national wealth. According to neoclassical growth theory and new growth theory, factor input and technological progress are the major factors affecting economic growth. The Harrod–Domar model is a quantitative model evaluating economic growth and is employed to examine the conditions required for long-term and balanced economic growth. According to the model, the key to economic growth lies in capital accumulation. However, the Harrod–Domar model overemphasizes the importance of capital accumulation and leads to capital fundamentalism in society and research. Solow [12] improved the assumptions of the Harrod–Domar model and suggested that economic growth relies not only on capital accumulation, but also on technological progress. However, the neoclassical economic growth theory considers technological progress as an exogenous variable, which carries little importance in guiding practice. Subsequently, Romer [13,14] and Lucas [15] regarded technological progress as an endogenous factor and proposed an endogenous growth theory, which identified the key role of technological progress and knowledge accumulation in driving economic growth. North [16] stressed, however, that evolution growth theory is based on institutional evolution and asserted that the core factor of economic growth is institutional evolution. Strong feedback mechanisms can be formed for the economy in a good market mechanism and promote sustainable development. Once the institutional evolution becomes ineffective, the economy will also fall into path dependence and enter a long-term recession.
Since reform and opening-up, China displayed many achievements in its economy and attracted the attention of academia. Researchers conducted comprehensive analysis from the perspective of influencing factors, spatial patterns, and the development trends of the economy in China. The major focus has been on urbanization, capital investment, and fiscal policy. Belsky et al. [17] held that urbanization plays a role in driving sustainable development, whereas Deng et al. [18] questioned the impact of urbanization on the quality of sustainable development. The latter believe that continued urbanization exerts negative impacts on resources and the environment and ultimately stunts quality economic development. However, most researchers consider urbanization to be a propeller of rapid economic growth [19,20]. In terms of capital investment, Zhu et al. [21] maintained that physical capital has made the greatest contribution to the economic miracle of China and foreign direct investment played an integral part in promoting economic development. Li and Dai [22] believe that investment and internal demand are the main driver for China’s economy. Foreign trade as the driver of the economy is declining, and excess investment may cause irreversible damage on sustainable economic development in China. Moreover, Zhuravskaya [23], Lin and Liu [24], and Lin [25] agree that the implementation of fiscal decentralization in China enables the central government to pay more attention to the welfare of people within the region and promotes economic growth in China. As for the spatial pattern featured by step-by-step development—and with the eastern region growing much faster than the central and western region—Jin and Wu [26] argue that this is the result of government-led policies. Different priorities given to the eastern, central, western, and the northeast regions promotes coordinated economic development among regions [27]. In addition, researchers have explored the reasons for the disparity in economic development among different regions of China from varied angles, for instance, from the technological level [21], foreign direct investment [28], in terms of human capital [29], industrial mixing [30], industrial clusters [31], etc. Qi et al. [32] and Hu [33] believe the economy of China follows a gradual process from balance, to imbalance, and back to balance. The fundamentals of the economy are experiencing historical changes, entering the ‘new normal’, characterized by a slowing growth rate [34].
According to new institutional economics, marketization is a process of institutional evolution. Since the 1990s, the impacts of marketization on economic development have been the focus of researchers [35]. Iradian [36] points out that the effect of economic system reform on economic growth is particularly prominent. Kubo [37] demonstrates, based on the study of marketization transformation in Myanmar, that sustainable economic development requires in-depth system reform for a market economy. As non-OECD (Organization for Economic Co-operation and Development) countries in Asia, the situation in China and Myanmar is similar [38]. The impact of many factors on the economy in China has been studied, such as foreign direct investment level, economic openness, telecommunications, and electricity consumption [39,40,41,42]. There are also plenty of studies revealing the relationship between marketization and economic growth in China. Due to the lack of systematic and authoritative quantitative indexes for marketization reform in the early stage, there is a lack of quantitative research on the relation between marketization reform and economic growth. Instead, the research focus has mainly been on the impact of marketization on the efficiency of resource allocation [43]. Furthermore, only one to two indexes have been used to measure the process of marketization in most of the research [44]. To solve this issue, Fan et al. [45,46] constructed a comprehensive index system to assess the level of marketization and measured the marketization index of provinces in various years to examine the contribution of marketization to economic development. Their results show that marketization significantly promotes economic growth in China by improving resource allocation efficiency. Hou and Wang [47] argue that marketization reform in finance promotes the economy via the contagion effect of monetary policy. Lv and Zhu [48] investigated the impact of marketization on economic growth through the lens of market potential and found that marketization reform promotes sustainable economic growth by expanding market potential.
The existing literature demonstrates that researchers hold positive views of the role of marketization reform on economic growth. Extensive empirical studies have been conducted on the contribution of marketization to economic growth in China, showcasing its positive role in driving economic growth from varied perspectives [49]. However, little attention has been attached to the heterogeneity of marketization in driving the economies of different regions. As one of the main growth drivers in China, marketization reform is essential in lifting national comprehensive strength and industrial development. The vast land area of China leads to a huge disparity in marketization among regions, which will have a substantial driving effect on the economy.
In essence, marketization saves exogenous and endogenous transaction costs to improve the degree of economic organization and promote economic growth. It is one of the breakthroughs required to realize economic growth in an all-round way. It is mainly manifested in the following aspects. First, the cooperation of economic organizations promotes the further expansion of the production scale, reduces transaction costs, and brings scale economic benefits. Second, social capital can be generated in economic organizations. People’s long-term cooperation can give them a deeper understanding of their partners, which is conducive to the spillover of knowledge and technology, the improvement of producers’ subjective initiative, and the smooth realization of collective goals. Third, there will be certain social norms in economic organizations, which can form a kind of “social embeddedness”, resulting in the behavioral norms by which people restrict themselves, which can effectively solve the free riding problem in the supply of public goods. Fourth, the emergence of social norms in economic organizations is also the main driving force of the market economy. This is because the norms of economic cooperation can give rise to a trust pattern, which can reduce transaction costs and improve transaction efficiency in the process of marketization of factors and commodities.
The western region of China includes nine provinces and autonomous regions, i.e., Gansu, Guizhou, Ningxia, Qinghai, Shaanxi, Sichuan, Tibet, Xinjiang, and Yunnan, in addition to the Chongqing Municipality, and covers two thirds of the nation’s territory, with a population making up 22.8 percent of the nation’s total. The western region is rich in natural resources, but owns a singular industrial structure. There is a huge gap in economic development between the East and the West. What, then, is the impact of marketization on the western region of China, an underdeveloped region in relative terms? To address this issue, this study adopted the panel data of 82 prefecture-level cities from 2003 to 2017 to examine the impact of marketization on economic development in the western region on an empirical basis. The threshold model was employed to explore the internal mechanism through which marketization reform affects economic development in the western region. Therefore, this study serves as a compliment to the theory of the economic imbalance between the western region and the eastern region and offers valuable insights in adjusting marketization reform policy or strategic positioning.
In addition, there are also great differences in the level of marketization among different cities in western China, and the mechanism of the influence of marketization level on economic growth is not invariable. Generally speaking, only enterprises with market transaction advantages can obtain a favorable competitive position in the transaction. This kind of market advantage is obtained through organized production and operation, which can reduce costs and produce scale benefits. At the same time, enterprises also need to constantly adjust and optimize the economic organization to adapt to the competition mechanism in the market economy. As a result, under different levels of marketization, marketization has different effects on economic growth. Therefore, this paper further investigates the heterogeneity in the impacts of marketization on economic growth in cities with different characteristics in the western region of China.

3. Analysis of the Current Marketization Level of the Western Region

In this study, we obtained the marketization index from the NERI INDEX of Marketization of China’s Provinces Report compiled by Fan et al. [46] and the Marketization Index of China’s Provinces: NERI Report compiled by Wang et al. [50]. However, these reports only cover the data from 1997 to 2014. This study extracted the data from 2003 to 2014 and adopted the annual growth of provinces in the marketization index from 2008 to 2014 as the annual growth rate for the period from 2014 to 2017 by referring to the practice of Yu et al. [51]. However, the marketization index compiled by Wang et al. starts from the year 2008 and is different from the marketization index estimated by Fan et al. [46] in its basic structure. Therefore, it is not accurate to simply consolidate and compare the data from 2003 to 2007 with those from 2008 to 2017. Relevant treatments were adopted in empirical tests to resolve this issue, which is described in detail below. Therefore, in this study, we selected the data for the ten years from 2008 to 2017 to compare and analyze marketization indexes among provinces in western China.

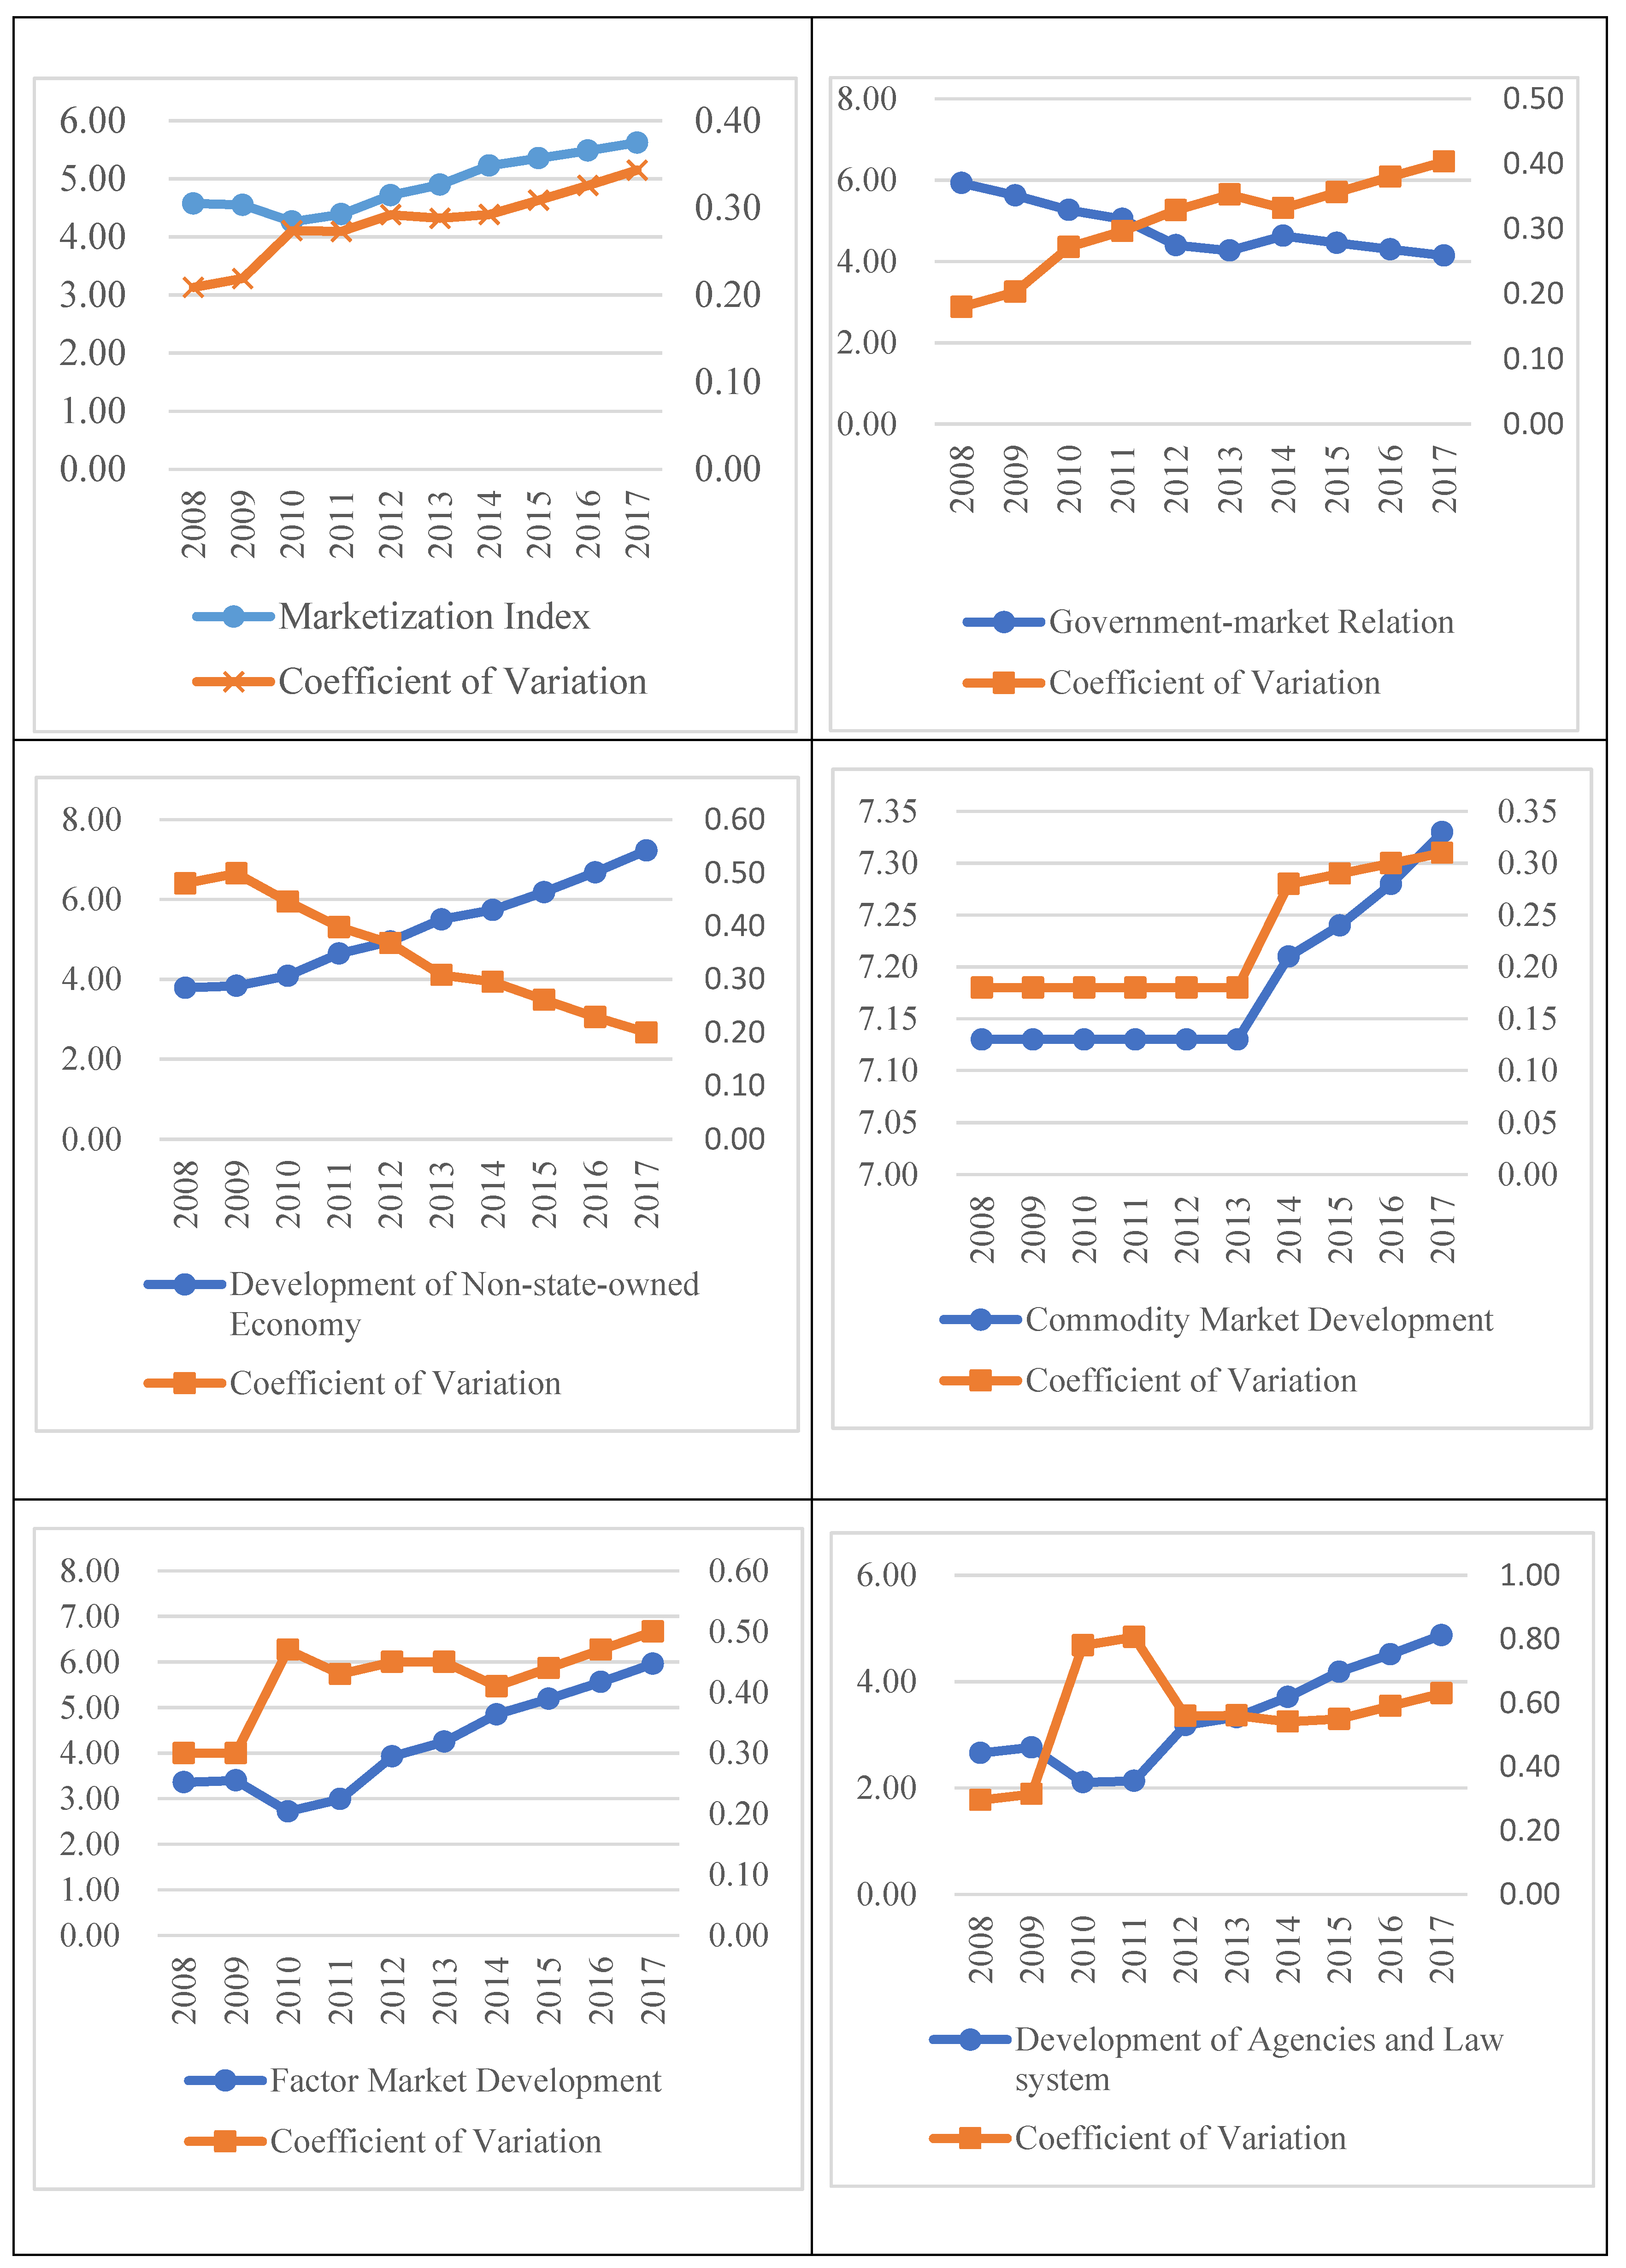
3.1. Marketization Evolution in Western China over Time

The marketization index adopted in this study consists of several dimensions. Its sub-indexes are composed of five indicators, including the government–market relationship, the development of the non-state-owned economy, commodity market development, factor market development, and the development of agencies and legal systems [46]. Figure 1 shows the evolution of the overall marketization index and its sub-indexes for the western region from 2008 to 2017. The coefficient of variation refers to the variation or dispersion of the observed value. In other words, the dispersion degree of the observed value grows along with the increase in the coefficient of variation and vice versa. In this study, the coefficient of variation is used to indicate the disparity in marketization level among provinces in western China. The coefficient of variation displays the evolution of the disparity in the marketization level among provinces over time. The details are shown in the figure below.
According to Figure 1, the marketization index of the western region has been growing from 2008 to 2017 despite the temporary decline from 2008 to 2010. The average marketization level in the western region increased from 4.57 to 5.62. The coefficient of variation witnessed a gradual increase from 0.21 to 0.34, demonstrating a growing disparity in marketization level among provinces in the western region over time.
The government–market relationship has gradually declined. The downgrade from 2008 to 2013 was relatively sharp. The relationship witnessed a temporary uptick from 2013 to 2014 and fell in a slower downward trend. The government–market relationship had a value of 5.92 in 2008, 1.35 higher than the overall marketization level in that year. However, after ten years of decline, the relationship in the western region fell to 4.14 in 2017, 1.48 lower than the overall marketization level. The coefficient of variation of the government–market relationship showcased an upward trend from 2008 to 2017. In 2008 and 2009, the coefficient of variation was 0.18 and 0.20, respectively, which is lower than the overall marketization level of 0.21 and 0.22 in the corresponding year. This means that the gap in the overall marketization level at the beginning was smaller than that at the end of the period. However, the growth rate of the coefficient of variation of the relationship was higher than that of the coefficient of variation of the marketization level in provinces in western China. As of 2017, the coefficient of variation of the government–market relationship grew to 0.4, whereas that of the marketization level was 0.34. This demonstrates that the imbalance in the progress in the government–market relationship is worse than that of the overall marketization level.
In terms of the development of the non-state-owned economy, the trend is similar to that of the marketization level from 2008 to 2017. It grew steadily and picked up pace in 2010. Differently from that of the marketization level, however, the development of the non-state-owned economy was stable, without falls or fluctuations. The development of the non-state-owned economy averaged 3.79 in 2008, lower than the average marketization of 0.78. After ten years of growth, it increased to 7.23 in 2017, higher than the average marketization of 1.61. This means that the development of the non-state-owned economy in western China was faster than the development of marketization. In 2008, the coefficient of variation of the development of the non-state-owned economy was 0.48, higher than the coefficient of variation of marketization. However, in 2017, it was 0.20, lower than the average coefficient of variation of marketization of the year. After ten years of development, the non-state-owned economy in western China realized a favorable balance, which was in a better equilibrium than marketization. Non-state-owned market players increased during the process of reform, which to some extent promoted competition. While competing for a better market position, non-state-owned market players galvanize productivity and push the government to relax rigid management over state-owned enterprises such as tight control and budget constraints. State-owned enterprises are then able to realize the goal of maximum profits, which leads to an overall improvement of total factor productivity across the society.
In the development of commodity market, the value ranged from 7.1 to 7.4 from 2008 to 2017. In 2017, the development of commodity market was as high as 7.33, which is higher than the marketization of 1.72. Moreover, it was higher than marketization throughout the ten years, demonstrating that the development of commodity market stayed ahead of other aspects of marketization. The coefficient of variation of the development of commodity market increased from 0.18 to 0.31 from 2008 to 2017, slightly lower than that of marketization. This shows that the disparity in the development of commodity market in provinces of western China has been widening. However, compared with the marketization equilibrium, the equilibrium commodity market development was better, showcasing better results.
As for the development of factor market, it exhibited an upward trend from 2008 to 2009, declined from 2009 to 2011 in fluctuation, and showcased steady growing momentum from 2011 to 2017. Its overall trend resembles that of marketization, with a decline in fluctuation. Prior to 2015, the average level of factor market development was lower than that of marketization, a scenario which was broken in 2016, and the former was 0.34 higher than that of the latter. This reveals that factor market development in the western region lagged behind marketization at the beginning. The coefficient of variation of factor market development showcased an upswing from 2008 to 2017 and it was higher than that of marketization, demonstrating that the gap in factor market development is widening and the equilibrium of factor market development is lower than that of marketization in provinces of western China.
The evolving trend of market agency and legal systems from 2008 to 2017 was similar to that of factor market development. It was on rise from 2008 to 2009, declined from 2009 to 2011, and was on track to increase from 2011 to 2017. The average level of market agency and legal system development was lower than that of marketization over the ten years, with certain gaps to fill compared with other aspects of marketization. This means that market agency and legal system development in the western region lagged behind that of marketization. Its coefficient of variation exhibited obvious fluctuations. From 2003 to 2011, the coefficient of variation of market agency and legal system development increased from 0.3 to 0.81 from 2003 to 2011, higher than the marketization level of 0.54 and much higher than other sub-indexes. It fell from 2011 to 2014, started to grow again from 2014, and reached 0.63 in 2017, higher than all the other indexes of the year. This represents a fluctuation of the disparity in market agency and legal system development in the provinces of western China. In addition, its equilibrium was lower than that of the other aspects of marketization.
In general, the average level of marketization in the western region is on the rise; however, there is growing disparity in marketization level among provinces in the western region over time. Second, the government–market relationship generally showed a slow declining trend. Third, the development of the non-state-owned economy showed a gentle upward trend. Fourth, the development of commodity market was on the rise, but the disparity in the development of commodity market in provinces of western China was also widening. Fifth, the development of factor market exhibited an upward trend. Finally, the development of market agency and legal systems was on the rise. This is probably due to the fact that the Chinese government started a campaign in 2000 for the development of the western region and has formulated a sequence of preferential policies and measures to encourage foreign investors. However, there are great differences in the original situation of each province in Western China, and reform in the governments of the western region is slower than the marketization progress.

3.2. Spatial Layout of Marketization in the Western Region

This study divided the western region into the northwest and southwest region. The former includes Xinjiang, Shaanxi, Ningxia, Qinghai, Gansu, and Inner Mongolia, whereas the latter consists of Chongqing, Sichuan, Guizhou, Yunnan, and Guangxi. Based on the analysis of marketization index and its sub-indexes of western region, we found in this study that marketization in western region showcased a widening gap between the southwest and the northwest regions. The details are shown in Figure 2, Figure 3, Figure 4, Figure 5, Figure 6 and Figure 7.
The marketization level in the southwest and northwest of China from 2003 to 2017 is shown in Figure 2. The scores of its five sub-indexes are exhibited in Figure 3, Figure 4, Figure 5, Figure 6 and Figure 7. Based on Figure 2, Figure 3, Figure 4, Figure 5, Figure 6 and Figure 7, we found that:
(1)
The overall marketization level and its sub-indexes in the southwest region were all higher than those of the northwest region and were higher than the average level of the western region. However, the overall marketization and its sub-indexes in the northwest were lower than the average level in the western region. Except for commodity market development, the evolving trends of the rest of the indexes in the southwest and the northwest were the same, which is also in line with that of the average level in the western region.
(2)
Based on the disparity among the regions in marketization, we divided the ten years from 2008 to 2017 into two periods in terms of marketization, development of the non-state-owned economy, factor market development, and market agency and legal system development. These two periods were the period from 2008 to 2011 and the period from 2012 to 2017. In the first period, the global financial crisis in 2008 exerted a significant influence on the marketization level in the western region. It is evident that there was a fall in the overall marketization level, factor market development, and market agency and legal system development. The growth rate of the non-state-owned economy decelerated and the decline in growth rate in the northwest was sharper than that of the southwest region, demonstrating a widening gap in development among the two regions. In the second period, from 2012 to 2017, marketization and the three above-mentioned indexes exhibited an upswing. The growth rate of the non-state-owned economy and factor market development in the northwest was higher than that of the southwest, revealing the narrowing of the gap in marketization or a convergence in marketization among the two regions. However, in terms of the overall marketization level and market agency and legal system development, the growth rate of the southwest region was higher than that of the northwest, indicating an expanding gap among the two regions.
(3)
The government–market relationship slowly declined both in the northwest and southwest regions. It worsened relatively fast from 2008 to 2013, exhibited a temporarily uptick from 2013 to 2014, and then fell at a slower rate. Generally, the declining rate in the two regions was similar. Although the relationship between the government and the market in the southwest was better than that in the northwest, the disparity between in two regions did not expand. Commodity market development from 2008 to 2013 remained basically unchanged. However, starting from 2013, commodity market development in the southwest has been growing, whereas that in the northwest has been declining, leading the gap among the two regions to expand.
(4)
The widening gap between the northwest and southwest resulted from commodity market development and market agency and legal system development. The improvement of the marketization level in the northwest was much slower than that in the southwest region. Therefore, the northwest region should pay special attention to commodity market development, the government–market relationship, and the rule of law for the market, while promoting marketization in the region.
In summary, there is still heterogeneity in the marketization process in western China. The marketization level in the southwest region is the highest in the comparison, followed by the western region and the northwest region. There are evident disparities in different aspects of marketization, which are derived from the variance in institutional transformation, openness, and economic development among regions. This explains the intermediate mechanism for the imbalance in economic development among regions. Therefore, there has been progress in marketization in the western region. However, all manner of issues concerning imbalances of development and backwardness are yet to be resolved. Promoting marketization in a balanced manner and resolving the imbalance in economic development are integral parts of marketization reform. This also represents a solution for comprehensive and balanced economic development in western China against the backdrop of supply-side structural reform.

4. Empirical Test for the Impact of Marketization on Economic Growth in Western China

4.1. Variables and Data

4.1.1. Dependent Variables

This study selected the GDPs of 82 prefecture-level cities from 2003 to 2017 as the proxy variable for economic growth and adopted the year 2003 as the base-year to deflate the GDP of cities based on the GDP of provinces to obtain real GDP.

4.1.2. Key Independent Variables

This study employed the marketization data from the NERI INDEX of Marketization of China’s Provinces Report by Fan et al. [46] and the NERI INDEX of Marketization of China’s Provinces Report by Wang et al. [50]. However, these reports only offer data from 1997 to 2014. This study extracted the data from 2003 to 2014 and obtained, referring to the practice of Bai and Liu [52], the marketization index from 2015 to 2017 by taking the average growth from 2008 to 2014 as the annual growth in marketization index from 2014 to 2017. As the data were measured at the provincial level, the marketization level was represented by marketization index of the province where the city is located.

4.1.3. Control Variables

Other control variables which affect economic growth adopted in this study include:
(1)
Capital–labor ratio. The capital–labor ratio measures the capital intensity of a region. Compared with capital stock, it reflects richer information, such as equipment level. This study used the ratio of fixed capital stock to the number of employees as the capital–labor index. Currently, there is no available fixed asset stock data published by the authorities. Therefore, we had to obtain the data based on the investment in fixed assets. In this study, we referred to Ke and Xiang [53] to calculate capital stock through the perpetual stock method ( K t = K t 1 1 δ + I t ). An average construction cycle of fixed assets was introduced and was set at three years. Therefore, a newly invested fixed asset in year t is I t = ( I t + I t 1 + I t 2 ) / 3 . In this way, we constructed the investment series from 2002 to 2017. In addition, the price index of a fixed asset was obtained through the weighted average of the price index of three major investments, namely, investments in construction and installation, purchases of equipment and tools, and other costs. As for the depreciation rate, unlike the common practice of setting a fixed value, we obtained the depreciation rated of regions based on the weighted depreciation rate of the cost of construction and installation and the purchase of equipment and tools based on their share in each year. The depreciation of other costs was included in the previous two parts based on their share.
(2)
Human capital. According to the new economic growth model of Lucas, the accumulation of human capital advances technological progress across the society and significantly promotes economic growth. In addition, Lucas believes the real driver for international growth is specialization in human capital. Therefore, in this study, we selected education expenditure per capita of prefecture-level cities to measure human capital per capita.
(3)
Opening-up level. As globalization deepens, opening-up can expand market size through free trade, improve domestic specialization in the division of labor, and galvanize the optimal allocation of production factors. Ultimately, it improves domestic industrial structures and promotes sustainable economic development. This study used the total imports and exports of prefecture-level cities to measure the opening-up level. In addition, the total volume of imports and exports published by the government is calculated in foreign currency. This study converted the currency based on the average exchange rate.
(4)
Technological progress. Technological progress is the most important factor in economic growth and is the driving source for sustained economic growth. Technological progress promotes improvements in industrial and economic structure, advances productivity, and plays a fundamental role in deepening the division of labor. Its role in the economic development of China is essential. This study adopted granted patents of regions to measure technological progress.
(5)
Infrastructure. Improving infrastructure offers a favorable environment for economic development, lowers transaction cost, and optimizes resource allocation. Better infrastructure galvanizes market competition, boosts total factor productivity, and increases economic growth speed. This study employed paved road area per capita to measure the infrastructure of cities.

4.2. Model Construction

Based on the above discussion, we set a function as below.
Y = f ( M L , c l , h c , o p e n , t e c h , f r a )  
where Y represents economic development, ML denotes the marketization level in western region and includes the overall marketization index and its five sub-indexes, cl indicates the capital–labor ratio, hc is human capital, open signifies the opening-up level, and tech and fra represent technological progress and infrastructure, respectively. This study adopted the marketization index as the key independent variable and constructed, based on Equation (1), the empirical model as Equation (2). i represents region and t denotes year. ε i is an error term.
l n Y i t = α 0 + α 1 M L i t + α 2 l n c l i t + α 3 l n h c i t + α 3 l n o p e n i t + α 4 l n t e c h i t + α 5 l n f r a i t + ε i
The marketization index measured by Wang et al. starts from 2008 and is different in basic indexes from the marketization index by Fan et al. [46]. Therefore, this study refers to the practice of Bai and Liu [52] to control the impact resulting from the difference by setting the dummy variable (D) in the model. The details are as follows.
First, the setting of the dummy variable (D) is shown in Equation (3).
D = { 1 , 2003 t 2007 0 , 2008 t 2017
Then, we added φ ( M L × D ) i t into the right side of Equation (2). φ is the estimated value of the parameter. This treatment ensures different slopes of marketization level (ML) within the two periods of time, thus controlling the impact of changes.
To ensure the smoothness of data, this study obtained the logarithm of economic growth, capital–labor ratio, opening-up level, technological progress, and infrastructure to avoid possible heteroscedasticity in the quantitative analysis. The descriptive statistics of the above variables are shown in Table 1.

4.3. Empirical Analysis

4.3.1. Unit Root Test and Cointegration Test

First, we conducted unit root tests on panel data. There are many test methods for unit roots, but two types are frequently used, namely, the unit root test for the same root and for the different root. Considering the panel in this study as balanced, we employed the LLC test, which is applicable to the same root, and the IPS test, which is applicable to different roots. The unit root test results shown in Table 2 revealed that not all original series of the panel data of the above variables pass the test. However, when we calculate the first-order differences of the variables, all the variables pass the unit root test at the 1% confidence level, demonstrating that the panel data in this study are stationary.
After the unit root test, we conducted a cointegration test on the panel data. This study adopted the method of Kao (Kao, 1999) for the cointegration test on empirical data. The results show that the p-value is 0.000, which is a strong denial of the null hypothesis. Therefore, there is a cointegration relation in the series and spurious regression does not exist.

4.3.2. Full-Sample Estimate Results

We conducted OLS, fixed effect, and random effect regression on the econometric model. The results for the full sample of the western region are exhibited in Table 3. We also performed the LSDV test and the Hausman test on the above three regressions. The p-value was 0.000, showcasing a strong rejection of the null hypothesis. Based on this, we selected the individual fixed effect model.
According to the regression results of the fixed effect model (3), shown in in Table 3, the overall marketization level, the key variable of this study, passed the test at the 1% significance level. Marketization significantly promotes economic development in western region, which is consistent with H1. When other variables remain constant, one percent growth in the overall marketization level increases the GDP of western region by 3.9%, demonstrating an enabling impact of marketization on economic growth. As a compound index of capital factor input and production factor input, the capital–labor ratio promotes regional economic development, which is significant at the 1% level. One percent of growth in the capital–labor ratio lifts regional GDP by 19.8%. Human capital, opening-up level, technological progress, and infrastructure exert positive impacts on the key dependent variable economic growth significantly. One percent growth in each of the aspect boosts regional GDP by 22.1%, 2%, 9.5%, and 5.8% respectively.
Model (4) verified the impact of the five sub-indexes of marketization on economic growth in the western region. The results show that except for agency and legal system development; the remaining four sub-indexes of marketization promote economic growth significantly. According to the value of the coefficient, the role of non-state-owned economic development on economic growth is the greatest. When other factor inputs and market-related indexes remain constant, one percent of growth in non-state-owned economy development galvanizes the GDP in the western region by 7.9%. This shows that economic reform to change the state-owned system in the western region improves economic growth greatly. As for the internal mechanism, market-oriented reform for factors optimizes resource allocation and galvanizes economic growth. Commodity market development also plays a major role in economic development. A one percent increase in commodity market development index drives GDP to grow by 4.2%. The coefficient of factor market development is significant at the 5% level. However, its growth by one unit only a 0.8% contribution to GDP growth, indicating a relatively small impact. However, the government–market relation negatively affects economic growth at a significant level. Market agency and legal system development negatively affect economic growth at a non-significant level. This shows that the government in western region can promote economic growth in the region through certain macro-regulation methods. This means acceleration in transforming the role of the government and building an efficient government are essential aspects of market-oriented reform and are a vital way to boost economic growth in the western region.

4.3.3. Region-Specific Regression Results

This study divided the western region into the northwest and southwest and conducted fixed effect regression on the effect of the marketization index and its sub-indexes on economic growth. The results are presented in Table 4.
The impact of marketization level in the northwest and southwest on regional economic development is significantly positive. As for the five sub-indexes of marketization, their impact on economic development is similar but at different significance level. The impact of the government–market relationship and non-state-owned economy development on the economic development in the northwest and southwest is significant at the 1% level. However, the positive impact of commodity market development is significant in the northwest at the 1% level and in the southwest at the 10% level. The positive impact of factor market development is significant in the economic development in the southwest, whereas that in the northwest is not significant. The impact of agency and legal system development in the northwest and the southwest is negative, with the significance in the southwest being higher than the northwest. For the other factors affecting regional economic growth, the major difference is in the opening-up level and infrastructure. The impact of the two on the economic development in the southwest is both positive at the 1% significance level, whereas their impact on the northwest is not significant. The impact of the capital–labor ratio, human capital, and technological progress on the northwest and the southwest is positive at the 1% significance level.

4.3.4. Regression Results for Cities of Different Sizes

Based on the division of cities shown above, we examined the impact of marketization on economic growth for cities of different sizes. The regression results are presented in Table 5.
According to Table 5, the overall marketization level exerts a significant positive impact on cities of different sizes. However, its significance level on medium-sized cities is lower than that of small cities and large cities. As for the sub-indexes of marketization, the government–market relationship negatively affects economic growth in small and large cities significantly. However, their negative impact on medium-sized cities is not significant. The impact of non-state-owned economic development is positive on cities of different sizes at the 1% level. Product market development positively affects economic development in small and large cities significantly, whereas its impact on medium-sized cities is not significant. The impact of factor market development is positive at a significant level on cities of different sizes, with the significance for small cities being the highest and that for medium-sized cities being the lowest. Agency and legal system development negatively affects economic growth in small cities and medium-sized cities significantly. It exerts positive effects on economic growth in large cities, which is not statistically significant. As for control variables, the most prominent difference is in the opening-up level. It negatively affects economic growth in small cities at a statistically insignificant level but positively influences economic growth in medium-sized and large cities significantly. Infrastructure affects economic growth in small cities at a lower significance compared with its impact on medium-sized and large cities. The impact of all the other variables is significantly positive on cities of different sizes at the 1% level, including the capital–labor ratio, human capital, and technological progress.

4.4. Threshold Effect Test for the Impact of Marketization on Economic Growth in the Western Region

In this study, we employed the threshold regression with panel data developed by Hansen (1999) to test the operation mechanism and characteristics within the sample range. As the model can determine the endogenous threshold interval and number of thresholds, the estimated value of parameters is credible and effective. As the panel in this study is a non-dynamic one, the panel threshold model of its fixed effect is shown in Equation (4).
{ y i t = μ i + β 1 x i t + ε i t , q i t γ y i t = μ i + β 2 x i t + ε i t , q i t > γ
where t = 1, 2... and denotes the year. i = 1, 2... represents the region. y i t is the dependent variable and x i t is the exogenous factors of the research subject, representing economic growth and marketization level, respectively. β 1 and β 1 represent the estimated value of threshold variable q i t when it is no larger than or larger than the threshold value γ , respectively. ε i t is the random error term. Control variables like capital–labor ratio and technological progress are not listed in the model, though they are included in the specific calculation. This study adopted marketization level as the key independent variable and the threshold variable. Exponential function I ( · ) , as shown in Equation (5), better displays the threshold effect.
y i t   =   μ i   +   β 1 x i t   *   I ( q i t γ )   +   β 2 x i t   *   I ( q i t   >   γ )   +   ε i t
where exponential function I ( · ) shows when the expected relation between q i t and γ is met. I ( · ) = 1 , otherwise I ( · ) = 0 . When there is a double-threshold model, the equation transforms into
y i t   =   μ i   +   β 1 x i t   *   I ( q i t     γ 1 )   +   β 2 x i t   *   I ( γ 1   <   q i t     γ 2 )   +   β 3 x i t   *   I ( q i t   >   γ 2 )   +   ε i t
where γ 1 and γ 2 are the two threshold values, γ 1 < γ 2 .
Based on the above model and panel data, we utilized a bootstrap method to test the number of thresholds. The results of the threshold self-sampling test are exhibited in Table 6.
We conducted 300 self-sampling repetitions when testing the number of thresholds. According to the results presented in Table 6, the null hypothesis of the non-presence of a threshold value was rejected. The F-value of the LM statistics is significant at the 1% confidence level, demonstrating the presence of a single threshold. Further, based on the precondition of a single threshold, we tested for the double threshold. The results show that the LM statistics rejected the null hypothesis of the presence of only one single threshold at the 1% significance level, demonstrating the presence of a double threshold. Then, based on this, we tested for the presence of a triple threshold. The results indicate that the LM statistics do not pass the significance test, demonstrating the non-presence of a triple threshold. Therefore, during the self-sampling significance test for marketization’s impact on economic growth in the western region, we identified the presence of a double threshold in the panel model with the threshold. That is, there are two different variables in the impact of marketization on economic growth from 2003 to 2017. Under the precondition of a double threshold, this study tested for the consistency between the estimated threshold value and its actual value and employed the likelihood ratio statistic to construct the confidence interval. The test results are exhibited in Table 7.
The results in Table 7 reveal that the 95% confidence intervals of threshold 1 and 2 are relatively short. The actual value falls within the 95% confidence interval. Therefore, the estimated value of the double threshold is basically consistent with the actual value. However, the confidence interval of the triple threshold is relatively long at the 95% level, which failed the consistency test. Thus, we identified the double threshold in the impact of marketization on economic growth in western region. The two threshold values are 4.3900 and 6.9756, respectively.
Figure 7 and Figure 8 display the distribution of the two threshold values. The threshold value is the minimum of the LR function. Figure 8 shows that the two threshold values of the model are below the lowest point of the LR function line. In Figure 8, the red dashed line represents the confidence value at the 95%. The region where the red dashed line meets with the LR function line is the 95% confidence interval. The threshold value and the interval generated through the threshold regression with the panel data also demonstrate that marketization affects economic growth in the western region through varied mechanisms. Previously, we identified the double threshold value of 4.3900 and 6.9756 and formed three impact intervals, namely, ml ≤ 4.3900, 4.3900 < ml ≤ 6.9756, and ml > 6.9756. ml is the overall marketization in the western region. According to the three intervals, we divided samples into three classes, that is, low marketization, medium marketization, and high marketization. We employed a fixed effects model for regression and present the results in Table 8.
The results presented in Table 8 reveal that the marketization level positively affects economic growth in cities with low marketization in a statistically non-significant way. In cities with medium marketization, the marketization level positively impacts economic growth significantly at the 1% level. As for cities with high marketization, the marketization level promotes economic growth significantly at the 5% level. Generally, the marketization level and economic growth in western region have an N-shaped relationship. The impact of the marketization level on economic growth witnessed two turns in the western region. The two turning points are at the marketization values of 4.3900 and 6.9756. In the three intervals split by the two turning points, the impact of the marketization level on economic growth is varied. It grows, declines, and rises again along with the improvement in the marketization level.

5. Conclusions and Discussion

China commenced system reforms in order to transition from a planned economy to a market economy in 1978. Over the next forty years, China realized phenomenal achievements in economic development. Marketization reform drives high-speed economic growth in China. However, it is worth mentioning that although marketization reform plays a major role in driving economic growth, the imbalance between the eastern, central, and western regions of China is evident. Imbalance in economic development among different regions of China is closely associated with marketization. The western region covers a vast area. Except for the Sichuan Basin and Guanzhong Plain, the rest of the region is economically backward and awaits further development. Is there a bottleneck for marketization? Can marketization become the main driver of the economy in underdeveloped regions? In this study, we aimed to answer these questions by exploring the relation between the marketization level in the western region and its economic development based on panel data from 82 prefecture-level cities in west China from 2003 to 2017.
First, the overall regression results demonstrate that the marketization level significantly promotes economic growth. Second, we explored the regional heterogeneity in their relationship. The results show that the overall marketization significantly galvanized economic growth in the northwest and southwest and in cities of different size. The sub-indexes of marketization showcased different degrees of influence on economic growth in various regions.
Third, threshold regression with panel data was employed to test for the presence of an interval-based impact of the marketization index on economic growth in the western region. We found a double threshold through self-sampling. The impact of marketization on economic growth increases first, declines, and increases again as the marketization level moves from the low marketization interval, through the medium marketization interval, and to the high marketization interval.
The conclusions of this paper have important policy implications. On the one hand, the marketization level significantly promotes economic growth in the western region. Both underdeveloped regions and developed regions should realize the pivotal role of marketization in driving economic growth. On the other hand, the impact of marketization on economic growth in underdeveloped regions is growing and exceeds its relative impact on developed regions. This demonstrates that the underdeveloped region in the western region of China should continue to push forward with marketization and improve its marketization level. In this way, the western region will be able to unleash its advantages and gradually narrow the gap with other regions of China. In addition, different regions adopt varied methods to promote marketization, resulting in varied impacts on economic growth. Therefore, the western region should take into account local conditions and implement scenario-based and industry-specific policies while promoting marketization. Continued efforts in promoting marketization play a pivotal role in growth mode switch and the improvement of development quality. This also serves as the key institutional arrangement for deepening supply-side structural reform and the transformation of growth drivers.
Due to constraints in access to data, there are deficiencies in these research results, which need further consideration. Limitations in the measurement of variables are as follows. This study employed the marketization data from the NERI INDEX of Marketization of China’s Provinces Report by Fan et al. [46] and the NERI INDEX of Marketization of China’s Provinces Report by Wang et al. [50]. However, as the data were measured at the provincial level, the marketization level is represented by marketization index of the province where the city is located. In follow-up studies, additional data on marketization need to be compiled and combined with economic growth for further analysis.

Author Contributions

Data curation and visualization, T.C.; writing—original draft preparation, T.C. and R.C.; writing—review and editing, H.L. and L.W. All authors have read and agreed to the published version of the manuscript

Funding

This research was funded by the National Natural Science Foundation of China (Grant Nos. 71503225).

Data Availability Statement

The public data used in this article can be accessed from the following website: http://www.stats.gov.cn/.

Conflicts of Interest

The authors declare no conflict of interest

References

  1. Deliktas, E.; Balcilar, M.A. Comparative Analysis of Productivity Growth, Catch-Up, and Convergence in Transition Economies. Emerg. Mark. Financ. Trade 2005, 41, 6–28. [Google Scholar] [CrossRef]
  2. Iradian, G. What Explains the Rapid Growth in Transition Economies? IMF Staff Pap. 2009, 56, 811–851. [Google Scholar] [CrossRef]
  3. Jakovljevic, M.; Timofeyev, Y.; Ranabhat, C.; Fernandes, P.; Teixeira, J.; Rancic, N.; Reshetnikov, V. Real GDP growth rates and healthcare spending—Comparison between the G7 and the EM7 countries. Glob. Health 2020, 16, 1–13. [Google Scholar] [CrossRef] [PubMed]
  4. Fan, G.; Wang, X.L.; Ma, G.R. Contribution of Marketization to China’s Economic Growth. Econ. Res. J. 2011, 46, 4–16. (In Chinese) [Google Scholar]
  5. Jakovljevic, M. BRIC’s growing share of global health spending and their diverging pathways. Front. Public Health 2015, 5, 186–199. [Google Scholar] [CrossRef] [PubMed] [Green Version]
  6. Jakovljevic, M.; Potapchik, E.; Popovich, L.; Barik, D.; Getzen, T.E. Evolving Health Expenditure Landscape of the BRICS Nations and Projections to 2025. Health Econ. 2017, 26, 844–852. [Google Scholar] [CrossRef]
  7. Sun, X.H.; Li, M.S.; Wang, Y. Marketization Process and Regional Economic Development Differences. J. Quant. Tech. Econ. 2015, 32, 39–55. (In Chinese) [Google Scholar] [CrossRef]
  8. Bonham, C.; Wiemer, C. Chinese saving dynamics: The impact of GDP growth and the dependent share. Oxf. Econ. Pap. 2013, 65, 173–196. [Google Scholar] [CrossRef] [Green Version]
  9. Shi, Z.K.; Wang, M.C. Marketization and Economic Growth in China: Based on a Bayesian Model Averaging Approach. Econ. Rev. 2016, 1, 26–38. (In Chinese) [Google Scholar] [CrossRef]
  10. Cai, F.; Wang, D.; Du, Y. Regional disparity and economic growth in China: The impact of labor market distortions. China Econ. Rev. 2002, 13, 197–212. [Google Scholar] [CrossRef]
  11. Guo, Y.Y.; Li, L. Influencing factors of regional economic inequality in inland provinces of western China: A case study of Chongqing. Geogr. Res. 2017, 36, 926–944. (In Chinese) [Google Scholar]
  12. Solow, R.M. A Contribution to the Theory of Economic Growth. Q. J. Econ. 1956, 70, 65–94. [Google Scholar] [CrossRef]
  13. Romer, P.M. Increasing Returns and Long-run Growth. J. Political Econ. 1986, 94, 1002–1037. [Google Scholar] [CrossRef] [Green Version]
  14. Romer, P.M. Endogenous Technological Change. J. Political Econ. 1990, 98 Pt 2, S71–S102. [Google Scholar] [CrossRef] [Green Version]
  15. Lucas, R.E. On the Mechanics of Economic Development. J. Monet. Econ. 1988, 22, 3–42. [Google Scholar] [CrossRef]
  16. North, D.C. Institutions, Institutional Change and Economic Performance; Cambridge University Press: Cambridge, UK, 1990. [Google Scholar]
  17. Belsky, E.S. Planning for Inclusive and Sustainable Urban Development; Island Press: Washington, DC, USA, 2012. [Google Scholar]
  18. Deng, X.Z.; Zhong, H.Y.; Bai, X.M. Path of Sustainable Urbanization in Western China. China Popul. Resour. Environ. 2013, 10, 24–30. (In Chinese) [Google Scholar]
  19. Gu, S.Z.; Li, H.; Yi, S.C. Urbanization as an Engine for Expanding Domestic and Sustaining Economic Growth. Chin. J. Popul. Sci. 2010, 30, 2–10. (In Chinese) [Google Scholar]
  20. Xi, X.; Qiao, Y.B.; Wu, K.P.; Li, C. The Selection of Metropolises or Towns in Urbanization in the Perspective of Sustainable Development: Based on the the Research of the International Ecological Footprint Panel Data. China Popul. Resour. Environ. 2015, 2, 47–56. (In Chinese) [Google Scholar]
  21. Zhu, C.L.; Yue, H.Z.; Li, T. An Empirical Study on Economic Growth Efficiency and Affecting Factors in China:1985–2007. J. Quant. Tech. Econ. 2009, 26, 52–63. (In Chinese) [Google Scholar]
  22. Li, Q.; Dai, F.T. The Influencing Factors and Structural Features of Economic Growth: Theoretical Hypothesis and Empirical Test—An Explanation of the New Normal of China’s Economy. Inq. Econ. Issues 2015, 3, 58–63. (In Chinese) [Google Scholar]
  23. Zhuravskaya, E.V. Incentives to provide local public goods:fiscal federalism, Russian style. J. Public Econ. 2000, 76, 337–368. [Google Scholar] [CrossRef] [Green Version]
  24. Lin, Y.F.; Liu, Z.Q. China’s Fiscal Decentralization and Economic Growth. J. Peking Univ. 2000, 37, 5–17. (In Chinese) [Google Scholar]
  25. Lin, C. Study on the Relationship between Fiscal Decentralization System and the Quality of China’s Economic Growth—Based on the Perspective of Total Factor Productivity. Public Financ. Res. 2017, 2, 73–83. (In Chinese) [Google Scholar] [CrossRef]
  26. Jin, X.Y.; Wu, P. Trend and Characteristics of Regional Economic Development Disparity in China:Using after-Modified GDP. Nankai Econ. Stud. 2010, 1, 79–96. (In Chinese) [Google Scholar] [CrossRef]
  27. Tan, C.L.; Zheng, Y.F.; Zhang, H. A Study on the Tendencies and Features of the Coordinated Development of Regional Economy in China. Econ. Geogr. 2013, 33, 9–14. (In Chinese) [Google Scholar] [CrossRef]
  28. Ouyang, P.; Fu, S. Economic Growth, Local Industrial Development and Inter-Regional Spillovers from Foreign Direct Investment: Evidence from China. China Econ. Rev. 2012, 23, 445–460. [Google Scholar] [CrossRef]
  29. Yao, X.G.; Zhang, H.F. Education, Human Capital and Regional Economic Differentials. Econ. Res. J. 2008, 5, 47–57. (In Chinese) [Google Scholar]
  30. Gan, C.H.; Zheng, R.G. The Evolution of Regional Economic Disparities in China and Its Decomposition by Industry. China Ind. Econ. 2010, 6, 25–34. (In Chinese) [Google Scholar] [CrossRef]
  31. Liu, J.; Xu, K.N. Industrial Agglomeration, Economic Growth and Regional Disparity—An Empirical Study Based on Provincial Panel Data in China. China Soft Sci. 2010, 7, 91–102. (In Chinese) [Google Scholar]
  32. Qi, Y.J.; Yang, Y.; Jin, F.J. China’s economic development stage and its patio-temporal evolution: A prefectural-level analysis. Acta Geogr. Sin. 2013, 68, 517–531. (In Chinese) [Google Scholar]
  33. Hu, A.G. Future Trends of China’s Economic Development and Thinking of Opening to the Outside World. Chin. Cadres Trib. 2015, 2, 33–37. (In Chinese) [Google Scholar] [CrossRef]
  34. Jin, B. Study on the New Normal of Chinese Economic Development. China Ind. Econ. 2015, 1, 5–18. (In Chinese) [Google Scholar] [CrossRef]
  35. Roland, G. Transition and Economics: Politics, Markets and Firms; MIT Press: Cambridge, MA, USA, 2000. [Google Scholar]
  36. Iradian, G. Rapid Growth in the CIS: Panel Regression Approach; International Monetary Fund: Washington, DC, USA, 2007. [Google Scholar]
  37. Kubo, K. Myanmar’s two decades of partial transition to a market economy: A negative legacy for the new government. Post-Communist Econ. 2013, 25, 357–370. [Google Scholar] [CrossRef]
  38. Jakovljevic, M.; Sugahara, T.; Timofeyev, Y.; Rancic, N. Predictors of (in)efficiencies of Healthcare Expenditure Among the Leading Asian Economies—Comparison of OECD and Non-OECD Nations. Risk Manag. Healthc. Policy 2020, 13, 2261–2280. [Google Scholar] [CrossRef]
  39. Zhang, K. How does foreign direct investment affect economic growth in China? Econ. Transit. Inst. Chang. 2003, 9, 679–693. [Google Scholar] [CrossRef]
  40. Sun, P.; Heshmati, A. International Trade and Its Effects on Economic Growth in China. IZA Discussion Paper. 2010. No. 5151. Available online: https://ssrn.com/abstract=1667775 (accessed on 30 August 2010).
  41. Shiu, A.; Lam, P. Causal Relationship between Telecommunications and Economic Growth in China and its Regions. Reg. Stud. 2008, 42, 705–718. [Google Scholar] [CrossRef]
  42. Yuan, J.; Zhao, C.; Yu, S.; Hu, Z. Electricity consumption and economic growth in China: Cointegration and co-feature analysis. Energy Econ. 2007, 29, 1179–1191. [Google Scholar] [CrossRef]
  43. Wang, X.L. Sustainability of China’ s Economic Growth and Institutional Changes. Econ. Res. J. 2000, 7, 3–15. (In Chinese) [Google Scholar]
  44. Fujita, M.; Hu, D. Regional disparity in China 1985–1994: The effects of globalization and economic liberalization. Ann. Reg. Sci. 2001, 35, 3–37. [Google Scholar] [CrossRef]
  45. Fan, G.; Wang, X.L.; Zhang, L.W.; Zhu, H.P. Marketization Index for China’s Provinces. Econ. Res. J. 2003, 3, 9–18. (In Chinese) [Google Scholar]
  46. Fan, G.; Wang, X.L.; Zhu, H.P. NERI INDEX of Marketlization of China’s Provinces 2011 Report; Economic and Science Press: Beijing, China, 2011. (In Chinese) [Google Scholar]
  47. Hou, X.; Wang, Q. Implications of banking marketization for the lending channel of monetary policy transmission: Evidence from China. J. Macroecon. 2013, 38, 442–451. [Google Scholar] [CrossRef]
  48. Lv, C.F.; Zhu, D.D. How does market reform affect long-term economic growth?—Analysis based on market potential. Manag. World 2016, 2, 32–44. (In Chinese) [Google Scholar] [CrossRef]
  49. Li, R.; Ma, Z.; Chen, X. Historical market genes, marketization and economic growth in China. Econ. Model. 2020, 86, 327–333. [Google Scholar] [CrossRef]
  50. Wang, X.L.; Fan, G.; Yu, J.W. Marketization Index of China’s Provinces:NERI Report 2016; Social Science Academic Press: Beijing, China, 2017. (In Chinese) [Google Scholar]
  51. Yu, H.H.; Xu, L.B.; Chen, B.Z. The Control Right of Ultimate Controlling Shareholder and Overinvestment of Free Cash Flow. Econ. Res. J. 2010, 45, 103–114. (In Chinese) [Google Scholar]
  52. Bai, J.H.; Liu, Y.Y. Can FDI improve China’s resource mismatch. China Ind. Econ. 2018, 1, 60–78. (In Chinese) [Google Scholar] [CrossRef]
  53. Ke, S.Z.; Xiang, J. Estimation of the Fixed Capital Stocks in Chinese Cities for 1996–2009. Stat. Res. 2012, 29, 19–24. (In Chinese) [Google Scholar] [CrossRef]
Figure 1. Marketization index, sub-indexes, and coefficient of variation in the western region. The top left picture shows the marketization index. All the rest pictures show sub-indexes. The top right picture shows government–market relationship. The middle left picture shows the development of the non-state-owned economy. The middle right picture shows the development of commodity market. The bottom left picture shows the development of factor market. The bottom right picture shows the development of agencies and legal systems. All pictures show indexes’ coefficient of variation in the western region.
Sustainability 13 03745 g001
Figure 2. Marketization of the western region.
Sustainability 13 03745 g002
Figure 3. Government–market relationship in the western region.
Sustainability 13 03745 g003
Figure 4. Development of the non-state-owned economy in the western region.
Sustainability 13 03745 g004
Figure 5. Commodity market development in the western region.
Sustainability 13 03745 g005
Figure 6. Factor market development in the western region.
Sustainability 13 03745 g006
Figure 7. Market agency and legal system development in the western region.
Sustainability 13 03745 g007
Figure 8. LR distribution of estimated threshold value under 95% confidence interval.
Sustainability 13 03745 g008
Table 1. Descriptive statistics of variables.
VariableMeanStandard DeviationMinimumMaximumIndependent Variable
Economic growth (lnY)6.010.953.459.43Logarithm of gross domestic product
Overall marketization level (ml)5.371.142.358.89Score of overall marketization in the western region
Government-market relation (ml_1)6.041.661.439.52Score of government–market relationship in the western region
Non-state-owned economy development (ml_2)5.522.050.949.76Score of non-state-owned economy development in the western region
Commodity market development (ml_3)7.631.110.889.71Score of commodity market development in the western region
Factor market development (ml_4)4.151.730.3711.78Score of factor market development in the western region
Agency development and law system (ml_5)3.661.63−0.4110.88Score of agency and legal system development in the western region
Capital-labor ratio (lncl)3.720.85−0.455.90Logarithm of fixed capital stock/the number of employees
Human capital (lnhc)6.400.933.938.98Education expenditure per capita
Opening-up level (lnopen)2.822.08−6.448.67Logarithm of total imports and exports
Technological progress (lntech)5.121.730.6910.67Logarithm of granted patents
Infrastructure (lnfra)1.940.72−1.174.69Logarithm of paved road area per capita
Table 2. Results of unit root tests.
Original DataLLC
(p-Value)
LCP
(p-Value)
Test ResultsFirst-Order DifferenceLLC
(p-Value)
LC P
(p-Value)
Test Results
Lny0.9680.875Not pass△lny0.0000.000Pass
ml0.9971.000Not pass△ml0.0000.000Pass
ml_10.0000.000Pass△ml_10.0000.000Pass
ml_21.0001.000Not pass△ml_20.0000.000Pass
ml_30.0000.618Not pass△ml_30.0000.000Pass
ml_41.0000.860Not pass△ml_40.0000.000Pass
ml_51.0001.000Not pass△ml_50.0000.000Pass
lncl0.0000.999Not pass△lncl0.0000.000Pass
lnhc0.0000.000Pass△lnhc0.0000.000Pass
lnopen0.0000.104Pass△lnopen0.0000.000Pass
lntech0.0010.248Not pass△lntech0.0000.000Pass
lnfra0.0000.001Pass△lnfra0.0000.000Pass
Table 3. The results on the full sample of the western region.
OLSFixed EffectRandom Effect
(1)(2)(3)(4)(5)(6)
lnylnylnylnylnylny
ml0.065 *** 0.039 *** 0.040 ***
(5.179) (5.668) (5.516)
ml_1 0.026 * −0.034 *** −0.019 ***
(1.749) (−5.381) (−2.680)
ml_2 0.051 *** 0.079 *** 0.074 ***
(5.011) (14.492) (12.115)
ml_3 0.040 *** 0.042 *** 0.039 ***
(2.655) (6.402) (5.093)
ml_4 0.032 *** 0.008 ** 0.008 **
(2.872) (2.346) (1.984)
ml_5 −0.076 *** −0.006 −0.008 **
(−6.285) (−1.606) (−1.964)
lncl0.150 ***0.116 ***0.198 ***0.130 ***0.182 ***0.116 ***
(5.607)(3.988)(18.056)(11.957)(15.496)(9.259)
lnhc−0.027−0.0320.221 ***0.184 ***0.204 ***0.170 ***
(−1.091)(−1.251)(21.494)(19.544)(18.454)(15.683)
lnopen0.090 ***0.076 ***0.020 ***0.018 ***0.032 ***0.033 ***
(12.380)(10.122)(4.105)(4.241)(6.177)(6.891)
lntech0.379 ***0.407 ***0.095 ***0.049 ***0.114 ***0.084 ***
(37.532)(37.882)(14.813)(7.348)(16.797)(11.330)
lnfra0.0210.0000.058 ***0.039 ***0.058 ***0.043 ***
(1.009)(0.024)(6.011)(4.713)(5.604)(4.435)
D * ml−0.000 −0.020 *** −0.020 ***
(−0.002) (−7.158) (−6.704)
D * ml_1 −0.013 0.048 *** 0.046 ***
(−0.626) (6.923) (5.803)
D * ml_2 −0.052 *** −0.030 *** −0.032 ***
(−3.242) (−7.440) (−6.677)
D * ml_3 −0.005 −0.057 *** −0.056 ***
(−0.247) (−9.463) (−8.033)
D * ml_4 −0.027 −0.043 *** −0.029 ***
(−0.914) (−4.792) (−2.835)
D * ml_5 0.134 *** 0.036 *** 0.028 **
(3.644) (3.433) (2.297)
_cons3.042 ***2.881 ***3.032 ***3.482 ***3.060 ***3.371 ***
(23.667)(15.467)(68.823)(47.940)(50.086)(37.652)
N123012301230123012301230
R20.8350.8450.9600.970
adj. R20.8340.8430.9570.968
F881.986439.9563886.9532450.149
p0.0000.0000.0000.0000.0000.000
Note: t value in parentheses; *, **, and *** represent the significance at the 10%, 5%, and 1%.
Table 4. Region-specific regression results.
NorthwestSouthwest
(7)(8)(9)(10)
lnylnylnylny
ml0.030 *** 0.075 ***
(3.524) (6.244)
ml_1 −0.036 *** −0.039 ***
(−3.069) (−5.472)
ml_2 0.066 *** 0.116 ***
(7.667) (10.338)
ml_3 0.040 *** 0.018 *
(3.409) (1.697)
ml_4 0.007 0.049 ***
(1.601) (6.099)
ml_5 −0.013 * −0.016 ***
(−1.947) (−3.077)
lncl0.250 ***0.159 ***0.145 ***0.102 ***
(15.205)(9.673)(9.855)(7.340)
lnhc0.223 ***0.166 ***0.199 ***0.134 ***
(15.564)(11.443)(13.375)(10.780)
lnopen0.0010.0040.039 ***0.025 ***
(0.186)(0.606)(5.948)(4.642)
lntech0.080 ***0.060 ***0.104 ***0.035 ***
(9.290)(6.015)(11.072)(3.965)
lnfra0.027 **0.0130.086 ***0.048 ***
(2.009)(1.068)(6.527)(4.442)
D * ml−0.023 *** −0.027 ***
(−5.019) (−7.110)
D * ml_1 −0.003 0.075 ***
(−0.247) (7.452)
D * ml_2 −0.040 *** −0.035 ***
(−6.628) (−3.037)
D * ml_3 −0.041 *** −0.080 ***
(−3.962) (−8.791)
D * 0.063 *** −0.079 ***
(3.657) (−6.634)
D * ml_5 0.026 * 0.038 **
(1.906) (2.120)
_cons2.894 ***3.516 ***3.133 ***3.906 ***
(43.078)(29.982)(52.470)(39.837)
N555555675675
R20.9580.9690.9650.979
adj. R20.9550.9660.9620.977
F1670.7381052.4512457.6681888.258
p0.0000.0000.0000.000
Note: t value in parentheses; *, **, and *** represent the significance at the 10%, 5%, and 1%.
Table 5. Regression results for cities of different sizes.
SmallMediumLarge
(11)(12)(13)(14)(15)(16)
lnylnylnylnylnylny
ml0.068 *** 0.025 ** 0.038 ***
(3.162) (2.316) (4.034)
ml_1 −0.026 ** −0.012 −0.043 ***
(−2.056) (−0.960) (−5.521)
ml_2 0.115 *** 0.066 *** 0.067 ***
(10.901) (6.384) (9.103)
ml_3 0.115 *** 0.012 0.058 ***
(7.856) (1.043) (6.328)
ml_4 0.029 *** 0.013 * 0.012 **
(3.830) (1.804) (2.431)
ml_5 −0.033 *** −0.031 *** 0.002
(−3.864) (−4.066) (0.496)
lncl0.156 ***0.057 ***0.286 ***0.221 ***0.180 ***0.119 ***
(6.882)(2.979)(13.638)(9.984)(11.491)(7.819)
lnhc0.248 ***0.128 ***0.136 ***0.124 ***0.240 ***0.212 ***
(12.338)(7.167)(7.484)(7.166)(14.502)(15.133)
lnopen−0.015−0.0100.027 ***0.0120.040 ***0.031 ***
(−1.529)(−1.286)(3.070)(1.495)(5.294)(4.903)
lntech0.097 ***0.043 ***0.095 ***0.081 ***0.092 ***0.038 ***
(8.213)(3.725)(8.946)(6.586)(8.345)(3.620)
lnfra0.039 *0.027 *0.061 ***0.039 **0.077 ***0.056 ***
(1.893)(1.708)(3.416)(2.340)(5.943)(5.246)
D * ml−0.037 *** −0.017 *** −0.015 ***
(−4.488) (−3.302) (−4.287)
D * ml_1 0.057 *** −0.022 * 0.086 ***
(3.648) (−1.661) (9.620)
D * ml_2 −0.006 −0.047 *** −0.022 ***
(−0.674) (−6.074) (−3.914)
D * ml_3 −0.092 *** −0.001 −0.076 ***
(−7.407) (−0.124) (−9.437)
D * ml_4 −0.073 *** −0.018 −0.049 ***
(−3.642) (−0.820) (−4.641)
D * ml_5 0.036 0.079 *** 0.002
(1.554) (3.907) (0.119)
_cons2.468 ***2.982 ***3.116 ***3.438 ***3.236 ***3.629 ***
(24.201)(22.666)(39.621)(23.369)(53.659)(37.319)
N285285330330615615
R20.9490.9720.9650.9730.9670.979
adj. R20.9440.9680.9620.9690.9650.977
F682.707578.4761190.045692.1902399.1711712.579
p0.0000.0000.0000.0000.0000.000
Note: t value in parentheses; *, **, and *** represent the significance at the 10%, 5%, and 1%.
Table 6. Self-sampling results of the threshold effect of marketization level on economic growth in the western region.
ModelF-Valuep-ValueBS TimeThreshold Value
1%5%10%
Single threshold44.82 ***0.000030022.502615.714113.9527
Double threshold30.57 ***0.003330021.979015.703113.7491
Triple threshold6.640.816730027.293122.885520.2436
Note: p-value and threshold value in the table were obtained by 300 times of self-sampling. *** indicate significance at the 1% levels, respectively.
Table 7. Estimated threshold value and its confidence interval.
Model Estimated Threshold Value95% Confidence Interval
Single thresholdThreshold4.3900(4.3700,4.4600)
Double thresholdThreshold 14.3900(4.3700,4.4650)
Threshold 26.9756(6.8168,7.0400)
Triple thresholdThreshold5.1100(5.1000,5.5200)
Table 8. Results of double threshold panel model.
LowMediumHigh
(17)(18)(19)
lnylnylny
ml0.016−0.021 ***0.070 ***
(0.671)(−2.896)(4.328)
lncl0.0280.043 ***0.043 ***
(1.610)(4.189)(3.563)
lnhc0.030 *0.065 ***0.007
(1.847)(6.573)(0.379)
lnopen−0.0020.0030.031 ***
(−0.239)(0.834)(5.812)
lntech0.024 **−0.019 ***−0.021 *
(2.386)(−2.768)(−1.906)
lnfra0.0030.030 ***0.033 ***
(0.268)(3.898)(3.745)
N283859101
R20.9830.9850.999
adj. R20.9770.9840.998
F643.0992567.2554052.308
p0.0000.0000.000
Note: t value in parentheses; *, **, and *** represent the significance at the 10%, 5%, and 1%.
Publisher’s Note: MDPI stays neutral with regard to jurisdictional claims in published maps and institutional affiliations.

