Abstract
This paper investigates the impact of air pollution on the labor supply of the middle-aged and elderly in rural China. The results suggest that exposure to high concentrations of PM2.5 has detrimental effects on working hours of the middle-aged and elderly. We further demonstrate the heterogeneous effects of PM2.5 by income and geographic regions. In particular, people with vulnerable economic conditions are more likely than others to reduce their labor hours due to PM2.5 exposure. Moreover, higher PM2.5 levels affected people in Central and Northeastern China more significantly than those in other regions.
1. Introduction
China, as the largest developing country in the world, has been experiencing tremendous economic growth accompanied by deterioration of air quality in recent decades. According to the Asian Development Bank Report (2012), of the 10 most polluted cities in the world, seven were in China. Air quality in China is largely affected by the structure and the intensity of economic activities [1,2]. As shown in Figure 1, regions with high PM2.5 (particles with a diameter below 2.5 µm) concentration are mainly located in the east, central, and northeast parts of China, which are the most economically developed areas in China.
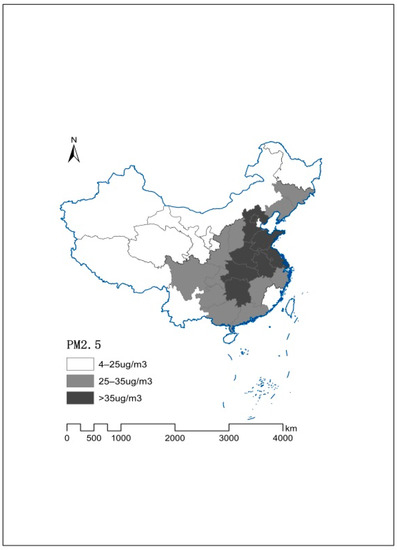
Figure 1.
Spatial distribution of PM2.5 in China. Data sources: Global Annual PM2.5 Grids from MODIS, MISR, and SeaWiFS Aerosol Optical Depth (AOD) with geographically weighted regression (GWR).
A considerable body of literature from toxicological and epidemiological researches has provided evidence that the air pollutants, especially PM2.5, may deteriorate human health and cause chronic or acute diseases in respiratory and cardiovascular systems [3,4,5]. Literature in social science also documented that cumulative exposure to air pollution will ultimately affect people’s life expectancy [6].
There is a consensus that health, viewed as an essential part of human capital, plays a non-negligible role in personal performance in labor markets [7,8]. Human capital is expressed as the total number of people engaged in work and the working hours in the labor market [9]. Many studies have suggested that acute health shock or chronic diseases would lead to a reduction of working time, early retirement, or withdrawal from the labor market [10,11]. Therefore, the distortion of the labor force market caused by air pollution should not be neglected [12].
Air pollution-related diseases are often accompanied by symptoms including headache, numbness of hands and feet, fatigue, chest pain, chest tightness, palpitation and dyspnea, which hinder individuals’ working ability to a large extent. For the rural middle-aged and elderly engaged in agricultural production, healthy human capital is the key factor to obtain remuneration in labor markets [13,14]. Damage on physical health will directly lower their working efficiency and further shorten the length of their working time [15]. With fixed personal time resource, individuals will maximize their utility by constantly adjusting their time allocation of leisure, market labor and family labor. Hence, the labor supply time will be reduced with the aggravation of the diseases, and lead to a lower economic output. Consequently, implementing a proper environmental regulation to improve public health as well as human capital is critical.
Many studies have found that air pollution had a negative impact on labor performance in economically developed areas [16,17]. It has been proved that 1 μg/m3 increase in the PM2.5 concentration reduces the monthly labor supply by 0.41–0.48 h per worker in Japan [18]. Nevertheless, the labor productivity reduction effect from air pollution is likely to be much larger for the residents in rural areas. However, associations between air pollution and working hour reduction in rural areas have not been clearly identified given the difficulty in collecting the data of air pollution and rural residents’ labor supply. In fact, the loose environmental regulation in rural areas has attracted a large number of high-emission enterprises to move into the countryside, causing air pollution incidents to take place frequently in rural China [19]. Additionally, rural residents create high emissions from their living activities, including the domestic combustion of solid fuels, burning coal for heat in winter and so on, further worsening the air pollution in rural areas [20,21]. In addition, due to low educational attainment and lack of technical skills, the rural residents have no choice but to engage in physically strenuous jobs on farms or in manufacturing factories [22,23]. Consequently, health is the determinant factor for them to acquire a job [24], which means their labor supply will be greatly affected by their health status. The middle-aged and elderly are more susceptible to the adverse effects of air pollution, especially for those who live in rural areas and/or engage in manual demanding agricultural production.
A wide range of literatures examined the negative influence on labor productivity from the ambient air pollution among the manual workers in the agricultural sector [10], manufacturing sector [25,26,27] and higher-skilled employees in the tertiary industry [28]. Some studies focused on identifying the causal relationship between air pollution and labor supply [16,17]. In our study, we pay close attention to the vulnerable groups in rural areas and aim to provide policy implications for economic welfare improvement, such as promoting basic healthcare services for chronic diseases, including respiratory diseases and cardio-cerebrovascular diseases.
The objective of this study is to provide a fresh insight into the labor supply behavior of the economic individuals under the conditions of air pollution by answering the following questions. (1) Does air pollution significantly reduce the labor supply of the middle-aged and elderly in rural China, and to what extent? (2) Is there any heterogeneity effect in the impact of air pollution on the labor supply of different individuals with various economic statuses or local economic structure? In addition, we also discuss some potential mechanisms that may link air pollution and workings hours.
This paper contributes to the literature by providing a rigorous evaluation of the impact of air pollution on the labor supply from a microeconomic perspective in different regions with distinct degrees of air pollution. The results can also provide insights for air pollution studies in other developing countries that are undergoing unprecedented air pollution with rapid economic growth.
2. Data
2.1. Data
The primary dataset used in this study is obtained from the China Health and Retirement Longitudinal Survey (CHARLS) conducted by the National Development Research Institute of Peking University. CHARLS is a large-scale longitudinal dataset on demographic and household information of the representative middle-aged and elderly above 45 covering 150 counties and 450 communities (villages) in 28 provinces. By 2015, the dataset had covered 23,000 respondents from a total of 124,000 households [29,30]. It contains information from various aspects including demographic background, family information, personal health status and functioning, health care and insurance, work retirement and pension, and income. The rich information on personal health status and work makes it available for us to have an insight into the causal relationship between air pollution and labor supply.
In this study, we focused on investigating the reduction of work hours caused by PM2.5 exposure among the rural middle-aged and elderly labor force in the years 2011, 2013, and 2015. Therefore, the samples with limited physical function or disability were dropped from the analysis, as physical dysfunction is generally regarded as the predominant determinant of labor supply reduction. After deleting the observations with outlier values, the final dataset contains 20,972 respondents who worked in the past year.
Considering the lag effect of PM2.5 on labor supply, we matched the total working hours with the average PM2.5 concentration of the current and lag one year (the dependent variable is the total working hours in the past year. For example, the total working time in the past year in the 2015 survey refers to the working hours from June 2014 to June 2015. PM2.5 concentration is annual average data, so it can only be used to match the mean PM2.5 concentration of the current and lag one year with the labor supply time collected in the current year). Since the dataset of the PM2.5 concentration before 2013 suffers from the problem of unavailable or missing as a result of not officially being monitored, to overcome this drawback, we adopted the Global Annual PM2.5 Grids from MODIS, MISR, and SeaWiFS Aerosol Optical Depth (AOD) with geographically weighted regression (GWR). It is a dataset released by the NASA Socioeconomic Data and Applications Center with a collection of 18 gridded data files that recorded the annual concentration of ground-level fine particulate matter (PM2.5) from 1998 to 2016. In this study, we extracted the data of PM2.5 concentration using ArcGIS. First, the vector map of China and the Global Annual PM2.5 Grids were uploaded to ArcGIS software and adjusted to the same geographic coordinate system. Second, the PM2.5 concentration data of the city where the interviewees lived was cut out by a mask extraction tool. Third, to improve the data’s accuracy, the extracted PM2.5 concentration data was converted into Lambert azimuth. Then, the nearest neighbor method was used for resampling, and the spatial data analysis module of the software was used to calculate the average concentration of PM2.5 in each region. Finally, the socio-demographic characteristics of the observations were merged with local PM2.5 average concentration to obtain an objective measurement of the variables. Furthermore, some information reflecting regional heterogeneity was extracted from the China Urban Statistical Yearbook and merged with the socio-demographic and PM2.5 concentration data at the county level.
2.2. Variables
2.2.1. Dependent Variable
According to the labor supply information documented in CHARLS, we summed up the total working hours of the respondents who were engaged in labor market activities in the past year. The data of working time came from the questionnaire by asking each interviewee, “How many months have you been engaged in agricultural work/ non-agricultural employment/non-agricultural self-employment in the past year?” “How many days a week did you usually work?” and “How many hours did you usually work every day?” The total working hours of the respondents was obtained through calculation.
2.2.2. Independent Variables: PM2.5
On the aspect of air pollution indicator, some research selected CO, O3 [31], SO2 [6], PM10 [32], SO2, NO2 [33], total suspended particulates (TSPs) and PM [6]. However, PM2.5 has been identified as the predominant toxic substance in the exhaust gas that directly damages human health [34]. Several recent studies have emphasized the negative role of PM2.5 in cardiovascular diseases’ morbidity and mortality [35]. A study from China found that the relationship between ambient PM2.5 exposure and air pollution-related chronic diseases was closer for rural populations than that of urban populations [21], so the variable of PM2.5 was eligible to reflect the air pollution level in the case of our study. A continuous variable of PM2.5 concentration was defined according to the data of annual average concentration, which was drawn from the Global Annual PM2.5 Grids. The objective measurement of PM2.5 concentration helps to improve the accuracy of estimating the effect of PM2.5 on labor supply.
2.2.3. Other Control Variables
In addition to independent and dependent variables, this study also included information such as personal demographic characteristics, family, and local economic conditions that affect both air quality and the labor supply decisions of the respondents. First, the respondent’s job was measured as a dummy variable to identify whether he/she was engaged in agriculture. The value was 1 if he/she worked in the agriculture sector and 0 otherwise. Then, we generated a binary indicator to represent whether the respondent had been diagnosed with other chronic diseases except for chronic cardio-cerebrovascular and respiratory diseases. Next, a dummy variable was defined for the marital status of the middle-aged and elderly. The value was equal to 1 if the respondent was living with a spouse and 0 otherwise. Finally, we constructed a variable to stand for the health condition in childhood by employing a continuous measure from 0 to 4.
Apart from individual characteristics, some variables reflecting household and regional information were specified to control for the possible influence factor on labor supply from household and regional heterogeneity. The indicator of per capita household income in the last year was applied to reflect household economic characteristics. Meanwhile, the variable at the city level was the average proportion of secondary industry added value in GDP of the current and lag one year. Moreover, noting that China is a country with a large land area, we classified the research regions into four parts to control the region-fixed effects.
2.3. Descriptive Statistics
Table 1 presents the definitions and sample statistics of all variables. The results show that the average total working time in the past year was 1461.186 h for the whole sample. The mean PM2.5 concentration of the research areas in the current and lag one year was 39.099 μg/m3. Of the respondents, 11% have been diagnosed with chronic respiratory diseases or cardio-cerebrovascular diseases in the past two years. The average age of the respondents was approximately 60, and more than half of them dedicated themselves to agriculture (75.2%). Most of them were illiterate, so the mean years of education they received were 4. About half (48.4%) of the respondents were male, and 11.1% of the sample suffered from other chronic diseases in the past two years. Of the respondents, 88.4% were married or cohabitated with their spouses. Most of them reported that their childhood health condition was good. With regard to the household information, the per capita household income was approximately 5637 CNY (1 CNY ≈ 0.15 USD) in the last year. In terms of local economic status, the added value of the secondary industry accounted for 49.059% of the GDP. East region includes Beijing, Hebei, Tianjin, Shandong, Shanghai, Zhejiang, Fujian, Guangdong, Hainan, and Jiangsu; Central region includes Shanxi, Henan, Anhui, Hubei, Jiangxi, and Hunan; West region includes Sichuan, Shanxi, Yunnan, Chongqing, Neimenggu, Gansu, Qinghai, and Guangxi; Northeast region includes Heilongjiang, Jilin, and Liaoning.

Table 1.
Variable definitions and descriptive statistics.
3. Regression Analysis
3.1. Multiple Linear Regression
Using Breush–Pagan (BP), we test whether the random error term in the regression function had the same variance. The BP test does not reject the null hypothesis, so heteroscedasticity does not exist (chi-square value = 0.39, p-value = 0.5314). Therefore, we use the traditional ordinary least squares (OLS) method to estimate the impacts of air pollution on the total working hours of rural middle-aged and elderly.
We employ 365 h of labor per year (an average of 1 h per day) as the boundary to distinguish whether respondents participate in the labor market. In other words, respondents who work more than 365 h a year are considered to participate in the labor market. Otherwise, they are defined as unemployed (Note that some literature used 52 h of labor per year (an average of 1 h per week) as the boundary to identify whether respondents participate in the labor market [15]. However, in this paper, we take 365 h of labor per year as the boundary as it is more in line with the actual working time of the rural middle-aged and elderly; on the other hand, it helps to filter out ineffective labor supply). Therefore, there are two sample selection methods in the traditional OLS regression. One is to run the regression with all samples. The other is to estimate the impacts on the individuals who participated in the labor market. In order to reduce the volatility of variables and make them more in line with the normal distribution, the variables of total working hours and PM2.5 concentration are taken as the logarithm to build a double-log model. The equation is shown in (1):
In Equation (1), the dependent variable () is the logarithm of total working hours of respondent i in region j in year t. The parameter of interest in Equation (1) is , which represents the effect of long-term exposure to PM2.5 on individuals’ total working hours. The main independent variable () is the logarithmic form of PM2.5 average concentration in the year of t − 1 and t in area j. Meanwhile, covariate () that reflects individual, household, and regional heterogeneity is controlled in the regression model to eliminate estimation biases and improve the accuracy [36]. Specifically, it contains the individual characteristics that might influence personal labor supply, including age, job, years of education, sex, whether the respondent has other chronic diseases, the health condition in childhood, and marital status. The per capita net income of the respondent’s family was used to reflect the characteristics at the household level. As economic activities are the main driving force of air pollution [37], and air quality is affected by economic structure and intensity [1], the proportion of secondary industry added value in local GDP is adopted to reflect the local economic structure. The regional and year dummy variables are also included in the regression model to examine the regional and time fixed effects. is the error term.
Different from previous studies that have discussed the endogenous problem due to the reverse causality between labor supply and environmental quality [38], we employ the rural micro individuals as the research objects in this paper. The reduction of work hours caused by air pollution for the rural middle-aged and elderly is too small to cause a significant decline in local economic output, which will further impact local air quality. The reason lies in the fact that the rural middle-aged and elderly are predominantly engaged in the sectors whose output accounts for a small proportion of the gross domestic product and thus has limited influence on the amount of both gross domestic product and exhaust emissions. Meanwhile, we choose the rural middle-aged and elderly who have lived in their hometown for a long time as the research objects to avoid endogeneity caused by population mobility.
3.2. Heckman Selection Model
When conducting the data analysis, we can observe the working hours of the individuals who are in the labor force, whereas on the contrary, the labor time of those who are out of work cannot be observed [39,40]. In the case of our study, for the rural middle-aged and elderly who do not work, dropping out of the labor market does not mean their decisions are not affected by air pollution. Direct application of the OLS estimation method to examine the effects of working time reduction by air pollution would lead to endogeneity caused by selection bias as the individuals who do not work are omitted. Therefore, it is necessary to correct the sample selection bias when we consider the whole sample with working and non-working groups. To overcome the drawback, we adopt the method of the Heckman selection model (Heckit), which is an effective approach to reduce endogeneity [39,40]. The analysis is conducted in two stages. In the first step, we run a regression by using a binary probit model to compute the inverse Mills ratio for each respondent who participates in the labor market under the impact of air pollution. The second stage is to conduct a regression of total working hours on the PM2.5 concentration with the inverse Mills ratio computed in the first stage. The binary probit model in the first stage will be exhibited as follows:
Equation (2) is an estimated probit for work decisions using all observations (working and non-working middle-aged and elderly). The purpose of this step is to estimate the correction term that will be included in the second stage, where indicates the probability of labor participation of the rural middle-aged and elderly under the influence of air pollution. The main independent variable () is the logarithmic form of local average PM2.5 concentration of the current and lag one year. reflects the factors that affect labor participation decisions of the rural middle-aged and elderly, including individual, family, and regional characteristics. Based on Heckman’s first stage econometric model, we further establish the regression equation of the second stage. The equation can then be specified as:
Equation (3) is the main regression, including the estimated correction term from the first step, where represents the control variables that may affect both air pollution exposure and working hours. is the correction term of the variables in the first stage, which was used to calculate the inverse Mills ratio. If the coefficient of the inverse Mills ratio is not zero, there is a non-ignorable sample selection bias. is a constant term. is the residual that cannot be interpreted by the correction term and . According to the setting of empirical models, the influence of air pollution on total labor time is estimated by Formulas (1)–(3). We follow the spirit of the Heckman selection model; that is, the variables of the regression equation might be consistent with those of OLS regression. Meanwhile, there have to be explanatory variables in the selection equation that are not in the main equation [40]. Otherwise, it may lead to multicollinearity, which makes the regression coefficient difficult to be identified [40,41]. In this study, the selection equation should contain at least one explanatory variable with exclusive characteristics, which affects the labor participation decision of the rural middle-aged and elderly, but does not directly affect their working hours. To meet the requirements, we choose whether or not to reach the retirement age of 60 years old as the identification variable of the selection equation.
3.3. Binary Probit Model
After assessing the impact of long-term exposure to PM2.5 on the individuals’ labor supply reduction, the potential mechanism that links air pollution and working hours is further explored. Previous studies have documented that cumulative exposure to PM2.5 increases the risk of chronic respiratory diseases or cardio-cerebrovascular diseases among the middle-aged and elderly. Accordingly, we construct a binary probit model with a maximum likelihood estimation method (MLE) to assess the impact of PM2.5 exposure on the probability of being attacked by chronic respiratory diseases or cardio-cerebrovascular diseases. The empirical approach can be expressed by the following equation:
where denotes whether the respondent i in region j in the year of t − 1 and t has been diagnosed with chronic respiratory diseases or cardio-cerebrovascular diseases. Specifically, P = 1 indicates the respondent has been diagnosed with the diseases, otherwise, P = 0. is the estimated parameter reflecting the influence on health from the PM2.5 pollution that can be obtained by implementing the maximum likelihood estimation method (MLE) [40].
4. Results
4.1. Effects of PM2.5 on Working Hours
Table 2 presents the estimation results of OLS and the Heckman selection model. It can be seen from the table that PM2.5 significantly reduces the working hours of the rural middle-aged and elderly. However, there is a big difference between the significance level of the OLS results of the whole sample regression (in column 1) and those of the regression only involving the individuals who actually work (in column 2). It indicates that the result estimated by OLS suffers from non-ignorable sample selection bias. R-squared values are low here, possibly due to the large individual differences in the pooled cross-sectional data. Note that we have performed tobit regressions which yield similar results to the Heckman selection model, and we chose to report Heckman results given its efficiency in reducing selection bias and endogeneity.
Table 2.
Effect of PM2.5 on working hours.
In order to test and correct the sample selection bias caused by unobservable working time for the non-working middle-aged and elderly, we conducted a Heckman selection model for labor force participation in the first stage with a selection equation. The coefficient of the inverse Mills ratio is −0.1667 with a statistical significance level of 5%, which verifies the existence of sample selection bias. The results exhibited in the select portion in column [3] suggest that PM2.5 does not significantly reduce the probability of labor force participation for the rural middle-aged and elderly. The finding is in line with reality. Generally, labor force participation is mainly affected by the factors such as age, family income, and working conditions. In contrast, air pollution plays a relatively small role in people’s labor participation decision-making.
The results of the second stage regression illustrated in column [3] suggest that PM2.5 negatively affects the respondents’ total working hours, as shown by the negative coefficient for the PM2.5 variable. This finding supports the conclusion illustrated in the theoretical framework that PM2.5 exerts a significant negative influence on the individuals’ labor supply. It indicates that 1 unit increase in mean PM2.5 concentration leads to a 3.59% decline in total working hours at a significance level of 1%. The possible explanation of the result is that low education level and lack of specialized quality limit and hinder the employment of the rural middle-aged and elderly, and consequently, they have no choice but to engage in physically strenuous outdoor labor and expose themselves to air pollution for a longer time. Moreover, they are more vulnerable to the air pollution-related diseases caused by PM2.5 for their weak immune system, and the chronic diseases caused by PM2.5 will weaken their physical strength to a great degree. In general, the air pollution-related chronic diseases caused by PM2.5 are accompanied by symptoms of headache, weakness of limbs, cough, chest tightness, shortness of breath, or dyspnea [42]. Although they are not severe health shocks that require chronic bed rest, the impaired health condition may lead to physical insufficiency, which may reduce the productivity and working hours of labor participants, especially those engaged in physically demanding jobs [14]. As a consequence, poor health may reduce the individuals’ incentives to work and ultimately decreases their working time. Finally, the coefficient and significance level of the Heckman selection model is similar to those of OLS with working middle-aged and elderly, which further shows the robustness of the results.
4.2. Heterogeneous Effects of PM2.5 on Working Hours
4.2.1. Heterogeneous Effects of PM2.5 on Working Hours by Income
Previous research has illustrated that individuals’ economic status has a vital influence on their labor supply decision-making. Those with higher income tend to pursue time-autonomy at the expense of reducing their working hours [15,43]. However, whether the influence mechanism works in the impact of PM2.5 on the labor supply time reduction is still ambiguous. Investigation on the heterogeneous effects of PM2.5 on labor supply by personal economic status provides guidance for policymakers to accurately identify the targeted vulnerable groups with the worst economic conditions. Therefore, we repeat estimations by running separate regressions on working hours for three subgroups based on three different income levels to explore the potential heterogeneous effects by income. According to China’s poverty line, respondents with an annual per capita income of less than 3000 CNY are low-income. After excluding the low-income group, the middle-income and the high-income groups are divided according to the median, which is 8800 CNY.
As shown in Table 3, overall, cumulative exposure to PM2.5 lowers the working hours for all survey subjects. Nevertheless, the magnitude of impacts differs by income levels. Exposure to PM2.5 is negatively associated with the working hours of individuals with low and middle income. By contrast, the effect is negative but statistically insignificant for those in high-income status. A potential explanation might be consistent with the fact that the middle-aged and elderly with low and middle income are usually outdoor blue-collar workers, whose health is the crucial human capital to acquire a job in the labor market. The chronic diseases caused by cumulative exposure to PM2.5 likely reduce physical capacity to a great extent for the low- and middle-income earners, so they shorten their working hours for the purpose of recovery. In contrast, individuals with high income often enjoy better working conditions or preventive interventions to prevent negative threats from air pollution.
Table 3.
Heterogeneous effects of PM2.5 on working hours by different income groups.
From the perspective of policy, special attention is urgently needed for economically vulnerable groups in rural areas with severe air pollution. On one hand, they are forced to undertake the health burden from air pollution, which is transferred from industrial sectors. On the other hand, the economic losses contributed by labor force reduction may trap them into deeper poverty.
4.2.2. Heterogeneous Effects of PM2.5 on Working Hours by Geographical Regions
The policy of industrial transfer from the east to the central and west has narrowed the long-standing regional economic gap [44]. The industrial sector, which accounts for the largest proportion of energy consumption in China, is the largest contributor to the emission of air pollutants [45]. We further identify the potential heterogeneous effects of PM2.5 on working hours by categorizing the research regions into four parts: east, central, west, and northeast. As revealed in Table 4, a regional difference in the influence of PM2.5 on the labor supply is evident. Compared to the individuals in the east and west parts of China, those who reside in the central and northeast regions have a higher propensity to have working time decline. One possible interpretation is, in East China, the high-tech and service industry with low emission constitutes the backbone of the local economy that distinguishes it from other regions. Local residents prefer to work in these enterprises for higher wages rather than engage in outdoor physically strenuous jobs. For this reason, the influence of PM2.5 on the labor supply of the middle-aged and elderly in the eastern part of China is too little to be identified. Second, China is committed to building the central region into an important advanced manufacturing center by moving eastern enterprises to the central region. The relocation of enterprises has led to the aggravation of air pollution in the central region. Consequently, the working time reduction by PM2.5 is more pronounced in the central region than in the eastern part of China. Third, the western part of China mainly consists of poverty-stricken areas with low industrial pollution, so the influence is too light to be considered. Finally, the northeast part of China is the most vital industrial base that produces petroleum, machinery, metallurgy, and minerals. Substantial exhaust gas from industrial production poses a significant threat to the health and labor supply of local residents. The results are consistent with the average proportion of secondary industry added value in GDP of each region as shown in Figure 2, that the regions with a higher average proportion of secondary industry added value in GDP are mostly located in the central and northeast parts of China.
Table 4.
Heterogeneous effects of PM2.5 on working hours by geographical regions.
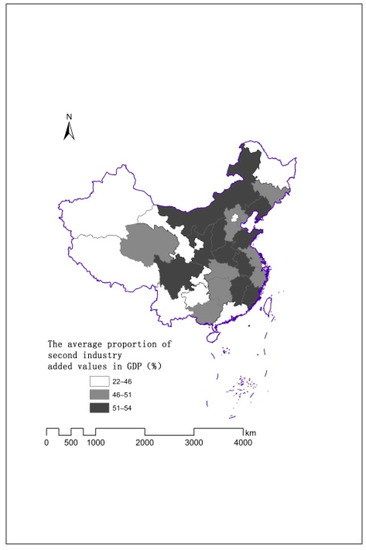
Figure 2.
Average proportion of secondary industry added value in GDP (%). Data sources: China Urban Statistical Yearbook.
4.3. Mechanisms That Link between PM2.5 and Working Hours
As mentioned above, PM2.5 exerts influence on the labor supply of the middle-aged and elderly through the pathway of chronic respiratory diseases and cardiovascular diseases. It is meaningful to discuss the possible mechanism that links PM2.5 concentration and total working hours because PM2.5 affects the labor supply of the respondents in an indirect way. In addition, air pollution-related chronic diseases are generally not severe health shocks that require one to totally draw out from labor markets. However, they do create negative incentives for individuals’ labor supply and shorten the lengths of their working hours indirectly. The appealing feature makes the observations have sufficient variation to meet the needs of the econometric model and make it available for us to investigate the behavior of the rural middle-aged and elderly in the air pollution environment. Therefore, we conduct an empirical test to explore whether and to what extent sustained PM2.5 exposure increases the risk of suffering from chronic cardio-cerebrovascular or respiratory diseases among the middle-aged and elderly in rural China.
To empirically test the possible mechanism, we constructed a binary probit model (Equation (4)) to estimate the effects of air pollution on the risk of suffering from air pollution-related chronic diseases. A dummy variable is defined to indicate whether the respondent has been diagnosed with chronic respiratory diseases or cardio-cerebrovascular diseases in the past two years. We took the average number of cigarettes per week (data sources: China Health and Retirement Longitudinal Survey (CHARLS)) as the control variable and put it into the regression model. The estimation results are demonstrated in Table 5.
Table 5.
Effects of PM2.5 on the likelihood of chronic cardio-cerebrovascular or respiratory diseases.
The estimation results support the evidence documented by toxicological and epidemiological research, that is, long-term exposure to PM2.5 has significant positive associations with the probability of being attacked by chronic cardio-cerebrovascular or respiratory diseases. It indicates that each unit of PM2.5 concentration increases the likelihood of suffering from the diseases by 6.34%, with significance at the 5% statistic level. The chronic cardio-cerebrovascular or respiratory diseases caused by PM2.5 are generally accompanied by symptoms that may reduce the physical strength or working efficiency and ultimately lower the total working hours of the labor participants.
4.4. Robustness Check
4.4.1. Robustness Check 1: Fixed-Effect Estimation
We further implement a robustness check to examine the individual-specific fixed effects. As some time-invariant factors (e.g., individuals’ sex, years of education received, and health condition in childhood) and some unobserved determinants (e.g., local climate, customs, culture, and individuals’ preference for labor supply) may likely lead to estimation bias when investigating the effect of PM2.5 on working hours. In addition, to some extent, the bilateral causality between labor supply and air quality may lead to endogeneity. To remove the barriers of estimation bias [46,47], a balanced panel data including 5118 observations will be analyzed with the fixed-effect method to identify the impacts of PM2.5 and other time-variant individual characteristics on working hours.
The findings of the fixed-effect regression presented in Table 6 suggest that the PM2.5 exerts a detrimental effect on the total working hours of the rural middle-aged and elderly, which is consistent with the main results estimated by the conventional OLS and Heckman selection model. Both of the coefficients are at the significance level of 1%, which indicates that the main result of our study is robust. The robustness check with fixed-effect estimation supports our finding that PM2.5 has an adverse impact on the labor supply of the rural middle-aged and elderly.
Table 6.
Robustness estimation: fixed-effect estimation results.
4.4.2. Robustness Check 2: Estimation of AQI and Six Air Pollutants on Working Hours
This robustness check was designed to examine whether other pollutants in the air have impacts on the working hours of middle-aged and elderly in rural areas. Following previous relevant studies [43], we conducted seven separate regressions using the data from the urban ambient air quality daily report, which was released by China’s environmental monitoring station (http://www.cnemc.cn/sssj/) (accessed on 25 January 2021). The data was collected by the automatic air quality monitors installed in various parts of the country. It includes the air quality index (AQI) and concentrations of six air pollutants, which are PM2.5, sulfur dioxide (SO2), particulate matter smaller than 10 µm (PM10), nitrogen oxides (NO2), ozone (O3), and carbon monoxide (CO). The daily concentration data were summed up to calculate the annual average. After excluding cities with missing data, the annual average AQI and six air pollutants concentrations in 2014 and 2015 were calculated and were matched with the individual data of CHARLS in 2015 for the regression model. (Since PM2.5 concentration was not officially monitored until December 2013, the data of 2011 and 2013 were not included in the regression.) The results are presented in Table 7 and Table 8. It suggests that AQI, PM2.5, SO2, PM10, NO2, and O3 all have significant negative impacts on the working hours of the middle-aged and elderly in rural areas, which is consistent with previous results.
Table 7.
Estimation results of air quality index (AQI) and three air pollutants on working hours.
Table 8.
Estimation results of three air pollutants on working hours.
5. Conclusions and Policy Implications
This paper assesses the extent to which PM2.5 may affect the working hours of the middle-aged and elderly in rural China. A considerable reduction in total working hours can be found for the rural middle-aged and elderly exposed to a high concentration of PM2.5. To be more specific, ceteris paribus, an additional unit increase in mean PM2.5 concentration, reduces the respondents’ total working hours by 3.75%. Moreover, the working hours of elderly labor participants are reduced more significantly by PM2.5 concentration compared to younger people.
Heterogeneous effects suggest that people in vulnerable economic conditions are more likely to have their labor supply influenced by PM2.5. In addition, the individuals who reside in the central and northeast regions have a higher propensity to have working time decline caused by PM2.5 than those who live in the east and west parts of China. In terms of the possible mechanism, the result suggests that cumulative exposure to high concentrations of PM2.5 increases the risk of suffering from chronic cardio-cerebrovascular or respiratory diseases, which may further reduce their working hours.
Our study justifies the need for government programs in health care, environmental protection, air pollution regulations, and rural and regional economic development. First, the provision of accessible and affordable health care services that target chronic cardio-cerebrovascular or respiratory diseases are urgently needed to reduce the out-of-pocket expenditures of the economically vulnerable senior citizens in highly polluted areas. Second, reasonable environmental regulations that limit the exhaust emission from the secondary industries will generate significant benefits in rural human capital accumulation and economic development by alleviating the labor supply decrease caused by air pollution. Third, government intervention will effectively promote enterprises to adopt advanced production technology or clean energy to minimize the emissions of exhaust gases in rural areas. Finally, it is necessary for the government and enterprises to design a compensation system to provide pollution allowance so as to improve the working enthusiasm of the rural residents whose working hours have been affected by the air pollution.
Author Contributions
Conceptualization, M.N., Q.C., and Q.H.; methodology, M.N., Y.Y.Z., and Q.H.; software, Q.H.; formal analysis, Q.H.; data curation, Q.H.; writing—original draft preparation, Q.H.; writing—review and editing, M.N., Y.Y.Z., and Q.H.; supervision, M.N. and Y.Y.Z.; project administration, M.N.; funding acquisition, M.N. All authors have read and agreed to the published version of the manuscript.
Funding
Manxiu Ning is sponsored by the National Natural Science Foundation of China (project number: 71773017); Manxiu Ning is supported by the Humanities and Social Sciences Research Fund for Youth Scholars, Ministry of Education of China (project number: 19YJC630111).
Institutional Review Board Statement
Not applicable.
Informed Consent Statement
Not applicable.
Data Availability Statement
Publicly available datasets were analyzed in this study. This data can be found here: http://charls.pku.edu.cn/ (accessed on 1 March 2021).
Conflicts of Interest
The authors declare no conflict of interest.
References
- Li, B.; Wu, X. Economic Structure and Intensity Influence Air Pollution Model. Energy Procedia 2011, 5. [Google Scholar] [CrossRef]
- Yi, F.; Ye, H.; Wu, X.; Zhang, Y.Y.; Jiang, F. Self-Aggravation Effect of Air Pollution: Evidence from Residential Electricity Consumption in China. Energy Econ. 2020, 86. [Google Scholar] [CrossRef]
- Dockery, D. Acute Respiratory Effects of Particulate Air Pollution. Annu. Rev. Public Health 1994, 15. [Google Scholar] [CrossRef]
- Pope, C.A. Epidemiology of Fine Particulate Air Pollution and Human Health: Biologic Mechanisms and Who’s at Risk? Environ. Health Perspect. 2000, 108 (Suppl. 4). [Google Scholar] [CrossRef]
- Seaton, A.; Godden, D.; MacNee, W.; Donaldson, K. Particulate Air Pollution and Acute Health Effects. Lancet 1995, 345. [Google Scholar] [CrossRef]
- Pope, C.A.; Dockery, D.W. Air Pollution and Life Expectancy in China and Beyond. Proc. Natl. Acad. Sci. USA 2013, 110, 12861–12862. [Google Scholar] [CrossRef]
- Zivin, J.G.; Neidell, M. The Impact of Pollution on Worker Productivity. Am. Econ. Rev. 2012, 102. [Google Scholar] [CrossRef]
- Zhang, Y.Y.; Zheng, Q.; Wang, H. Challenges and Opportunities Facing the Chinese Economy in the New Decade: Epidemics, Food, Labor, E-Commerce, and Trade. Chin. Econ. 2021, 1–3. [Google Scholar] [CrossRef]
- Breneman, D.W.; Schultz, T.W. Investing in People: The Economics of Population Quality. J. Policy Anal. Manag. 1982, 1. [Google Scholar] [CrossRef]
- Berkowitz, M.; Johnson, W.G. Health and Labor Force Participation. J. Hum. Resour. 1974, 9. [Google Scholar] [CrossRef]
- Dwyer, D.S.; Mitchell, O.S. Health Problems as Determinants of Retirement: Are Self-Rated Measures Endogenous? J. Health Econ. 1999, 18. [Google Scholar] [CrossRef]
- Trevisan, E.; Zantomio, F. The Impact of Acute Health Shocks on the Labour Supply of Older Workers: Evidence from Sixteen European Countries. Labour Econ. 2016, 43. [Google Scholar] [CrossRef]
- Kalwij, A.; Vermeulen, F. Health and Labour Force Participation of Older People in Europe: What Do Ojective Health Indicators Add to the Analysis? Health Econ. 2008, 17. [Google Scholar] [CrossRef]
- Li, Q.; Lei, X.; Zhao, Y. The Effect of Health on the Labor Supply of Middle-aged and Older Chinese. China Econ. Q. 2014, 13, 917–938. [Google Scholar]
- Ning, M.; Gong, J.; Zheng, X.; Zhuang, J. Does New Rural Pension Scheme Decrease Elderly Labor Supply? Evidence from CHARLS. China Econ. Rev. 2016, 41, 315–330. [Google Scholar] [CrossRef]
- Aragón, F.M.; Miranda, J.J.; Oliva, P. Particulate Matter and Labor Supply: The Role of Caregiving and Non-Linearities. J. Environ. Econ. Manag. 2017, 86. [Google Scholar] [CrossRef]
- Hanna, R.; Oliva, P. The Effect of Pollution on Labor Supply: Evidence from a Natural Experiment in Mexico City. J. Public Econ. 2015, 122. [Google Scholar] [CrossRef]
- Yamada, D.; Narita, D. The Effects of Air Pollution on Labor Supply in Japan: A Panel Data Analysis Based on PM2.5 Pollution and Labor Data. SSRN Electron. J. 2020. [Google Scholar] [CrossRef]
- Qin, B. Research on Industrial Pollution in Rural China: Seeking a Solution to the Pollution Incurred to the Farmers. In Sustainable Development in Rural China; Springer: Berlin/Heidelberg, Germany, 2015. [Google Scholar] [CrossRef]
- Aunan, K.; Hansen, M.H.; Liu, Z.; Wang, S. The Hidden Hazard of Household Air Pollution in Rural China. Environ. Sci. Policy 2019, 93. [Google Scholar] [CrossRef]
- Balmes, J.R. Household Air Pollution from Domestic Combustion of Solid Fuels and Health. J. Allergy Clin. Immunol. 2019. [Google Scholar] [CrossRef]
- Lin, B.; Lin, Z.; Zhang, Y.Y.; Liu, W. The Impact of the New Rural Pension Scheme on Retirement Sustainability in China: Evidence of Regional Differences in Formal and Informal Labor Supply. Sustainability 2018, 10, 4366. [Google Scholar] [CrossRef]
- Lin, B.; Zhang, Y.Y. The Impact of Fiscal Subsidies on the Sustainability of China’s Rural Pension Program. Sustainability 2020, 12, 186. [Google Scholar] [CrossRef]
- Jin Feng, Y.Y. Income Inequality and Health in Rural China. Econ. Res. J. 2007, 1, 26–35. (In Chinese) [Google Scholar]
- Chang, T.; Zivin, J.G.; Gross, T.; Neidell, M. Particulate Pollution and the Productivity of Pear Packers. Am. Econ. J. Econ. Policy 2016, 8. [Google Scholar] [CrossRef]
- He, J.; Liu, H.; Salvo, A. Severe Air Pollution and Labor Productivity: Evidence from Industrial Towns in China. Am. Econ. J. Appl. Econ. 2019, 11. [Google Scholar] [CrossRef]
- Li, T.; Liu, H.; Salvo, A. Severe Air Pollution and Labor Productivity: Evidence from Industrial Towns in China. SSRN Electron. J. 2015. [Google Scholar] [CrossRef]
- Archsmith, J.; Heyes, A.; Saberian, S. Air Quality and Error Quantity: Pollution and Performance in a High-Skilled, Quality-Focused Occupation. J. Assoc. Environ. Resour. Econ. 2018, 5. [Google Scholar] [CrossRef]
- Liu, J.; Rozelle, S.; Xu, Q.; Yu, N.; Zhou, T. Social Engagement and Elderly Health in China: Evidence from the China Health and Retirement Longitudinal Survey (CHARLS). Int. J. Environ. Res. Public Health 2019, 16, 278. [Google Scholar] [CrossRef]
- Lei, X.; Sun, X.; Strauss, J.; Zhao, Y.; Yang, G.; Hu, P.; Hu, Y.; Yin, X. Reprint of: Health Outcomes and Socio-Economic Status among the Mid-Aged and Elderly in China: Evidence from the CHARLS National Baseline Data. J. Econ. Ageing 2014, 4, 59–73. [Google Scholar] [CrossRef]
- Beatty, T.K.M.; Shimshack, J.P. School Buses, Diesel Emissions, and Respiratory Health. J. Health Econ. 2011, 30. [Google Scholar] [CrossRef]
- Arden Pope, C. Respiratory Disease Associated with Community Air Pollution and a Steel Mill, Utah Valley. Am. J. Public Health 1989, 79. [Google Scholar] [CrossRef]
- Pi, T.; Wu, H.; Li, X. Does Air Pollution Affect Health and Medical Insurance Cost in the Elderly: An Empirical Evidence from China. Sustainability 2019, 11, 1526. [Google Scholar] [CrossRef]
- Yu, G.; Wang, F.; Hu, J.; Liao, Y.; Liu, X. Value Assessment of Health Losses Caused by PM2.5 in Changsha City, China. Int. J. Environ. Res. Public Health 2019, 16, 2063. [Google Scholar]
- Benjamin, E.J.; Virani, S.S.; Callaway, C.W.; Chamberlain, A.M.; Chang, A.R.; Cheng, S.; Chiuve, S.E.; Cushman, M.; Delling, F.N.; Deo, R.; et al. Heart Disease and Stroke Statistics-2018 Update: A Report from the American Heart Association. Circulation 2018, 137. [Google Scholar] [CrossRef]
- Wooldridge, J.M. What’s New in Econometrics? Available online: https://scholar.harvard.edu/imbens/classes/nber-course-whats-new-econometrics (accessed on 1 March 2007).
- Zhu, L.; Hao, Y.; Lu, Z.N.; Wu, H.; Ran, Q. Do Economic Activities Cause Air Pollution? Evidence from China’s Major Cities. Sustain. Cities Soc. 2019, 49. [Google Scholar] [CrossRef]
- Zhang, Y.J.; Jin, Y.L.; Zhu, T.T. The Health Effects of Individual Characteristics and Environmental Factors in China: Evidence from the Hierarchical Linear Model. J. Clean. Prod. 2018, 194, 554–563. [Google Scholar] [CrossRef]
- Heckman, J. Sample Selection Bias as a Specification Error. Econometrica 1979, 47, 153–161. [Google Scholar]
- Wooldridge, J.M. Introductory Econometrics: A Modern Approach; Cengage Learning: Stanford, CA, USA, 2013. [Google Scholar]
- Puhani, P.A. The Heckman Correction for Sample Selection and Its Critique. J. Econ. Surv. 2000, 14. [Google Scholar] [CrossRef]
- Diamanti, S.; Longoni, M.; Agostoni, E.C. Leading Symptoms in Cerebrovascular Diseases: What about Headache? Neurol. Sci. 2019. [Google Scholar] [CrossRef]
- Zhang, Z.; Hao, Y.; Lu, Z.N. Does Environmental Pollution Affect Labor Supply? An Empirical Analysis Based on 112 Cities in China. J. Clean. Prod. 2018, 190. [Google Scholar] [CrossRef]
- Lu, M.; Wang, E. Forging Ahead and Falling behind: Changing Regional Inequalities in Post-Reform China. Growth Chang. 2002, 33. [Google Scholar] [CrossRef]
- Zheng, J.; Jiang, P.; Qiao, W.; Zhu, Y.; Kennedy, E. Analysis of Air Pollution Reduction and Climate Change Mitigation in the Industry Sector of Yangtze River Delta in China. J. Clean. Prod. 2016, 114. [Google Scholar] [CrossRef]
- Baltagi, B.H.; Sun, Y.; Zhang, Y.Y.; Li, Q. Nonparametric Panel Data Regression Models. In The Oxford Handbook of Panel Data; Baltagi, B.H., Ed.; Oxford University Press: Oxford, UK, 2015. [Google Scholar] [CrossRef]
- Zhang, Y.Y.; Gu, J.; Li, Q. Nonparametric Panel Estimation of Online Auction Price Processes. Empir. Econ. 2011, 40. [Google Scholar] [CrossRef]


Publisher’s Note: MDPI stays neutral with regard to jurisdictional claims in published maps and institutional affiliations. |
© 2021 by the authors. Licensee MDPI, Basel, Switzerland. This article is an open access article distributed under the terms and conditions of the Creative Commons Attribution (CC BY) license (http://creativecommons.org/licenses/by/4.0/).