Article

Sustainability and Slovenian Karst Landscapes: Evaluation of a Low Karst Plain

Anton Melik Geographical Institute, Research Centre of the Slovenian Academy of Sciences and Arts, 1000 Ljubljana, Slovenia
*
Author to whom correspondence should be addressed.
Sustainability 2021, 13(4), 1655; https://doi.org/10.3390/su13041655
Submission received: 1 January 2021 / Revised: 20 January 2021 / Accepted: 31 January 2021 / Published: 4 February 2021
(This article belongs to the Special Issue Karst and Environmental Sustainability)

Abstract

:
The purpose of this study was to identify the influence of karst landscape on the sustainable development of the Bela krajina region, southeast Slovenia. In order to better understand the influence of karst landscape on sustainable development we used three approaches: (1) the Karst Disturbance Index, (2) a quantitative analysis by using sustainable development indicators and (3) a qualitative analysis using structured interviews. The Karst Disturbance Index classified the degree of disturbance in Bela krajina as low. According to sustainable development indicators we found differences in the structure related to economy, population and environment within the region. And, according to the qualitative analysis, the negative impacts of the karst landscape on sustainable development are mainly associated with hampered agriculture and the positive with tourism; thus, karst landscape cannot only be seen as a limiting factor, since it also has development potential. Regional development in karst areas should therefore be adapted to their specificities and take into account their vulnerability.

1. Introduction

Understanding the relationship between natural and human factors that have shaped landscapes is critical for understanding sustainability [1]. This is very important when discussing karst landscapes, considering the vulnerability of karst systems [2,3]. Karst landscapes are particularly vulnerable to overuse and misuse due to the nature of the karst hydrological system, and once “damaged” it can be extremely difficult to “repair”. Human activities have impacted karst environments for thousands of years [4,5,6,7], but as human population has increased, so has human disturbance of karst landscapes.
Although the modern sustainability movement has gained momentum in recent years [8,9,10], in reviewing sustainability performance indicators we found that there is a lack of indicators specific to karst landscapes. There have been some efforts to gain an understanding of the impacts of karst landscapes from an environmental perspective [2,11], but a holistic measure of the sustainable development of karst landscapes is lacking. Studies on the sustainable development of karst regions are scarce [3,12,13,14,15] and are mainly concerned with the environmental degradation of karst landscapes, ignoring the development potential of these areas, with few exceptions [12].
Nevertheless, the analysis of the development potential and management of karst areas in Slovenia is of great importance. Karst occupies 44% of the area of Slovenia [16], and its value is reflected in the importance of natural values and rich supplies of karst groundwater. Karst springs provide about 43% of drinking water [17]. On the other hand, various studies have indicated that karstification of Slovenian landscapes is a distinct limiting factor, especially for agriculture [18,19,20,21,22].
The aim of this study was to identify the influence of karst landscape features on the sustainable development of the Bela krajina region, a low karst plain.

2. Materials and Methods

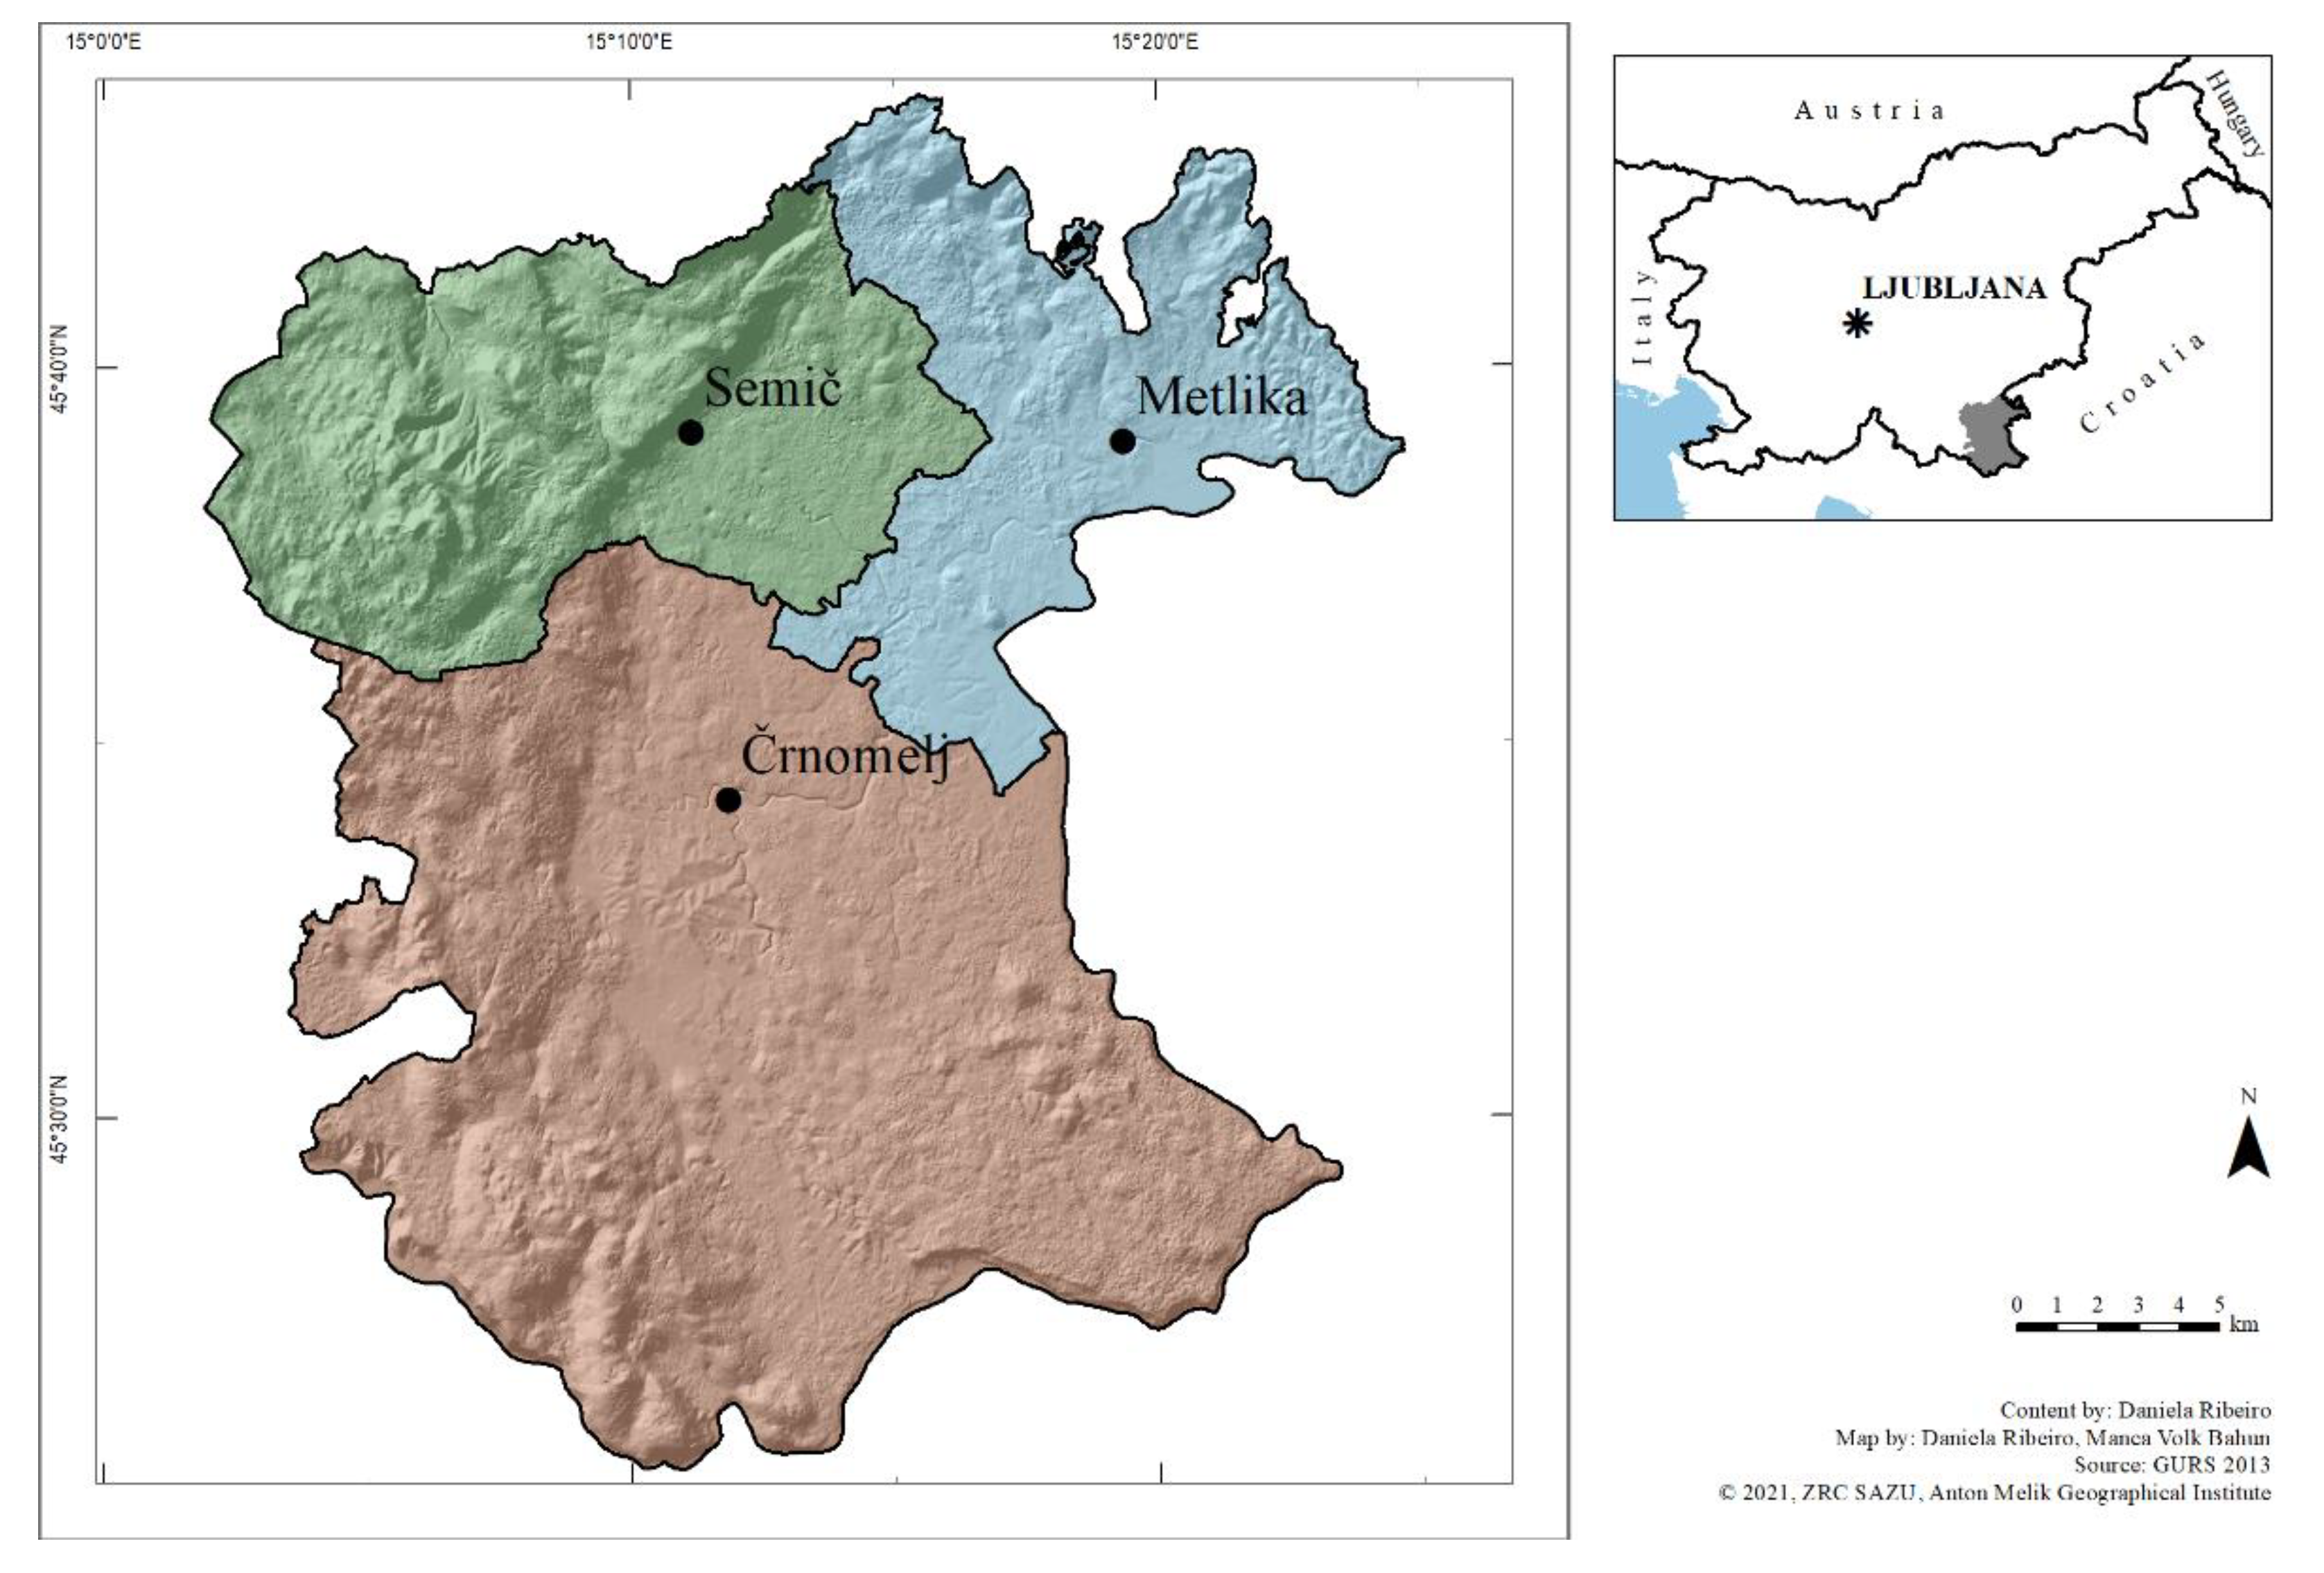
2.1. Description of the Study Area

Karst landscapes in Slovenia cover approximately 8800 km2 or over 44% of the country’s area. Karst landscapes are characterised by stony surfaces with dolines, collapse dolines, solution valleys, poljes, corrosion plains and dry and blind valleys [16]. According to the geological, hydrological and morphological conditions, Slovenian karst can be divided into: the Alpine karst, the Dinaric karst and the isolated karst [16,23]. The Dinaric karst is the largest karst area in Slovenia and accounts for about two thirds of the total karst area in the country [16]; the Bela krajina region, as our study region, is a part of it.
Bela krajina is located in the southeastern part of Slovenia, along the Slovenian-Croatian border and covers 595 km2 (Figure 1). Its central part is characterized by a low karst plateau at elevations of between 160 and 200 m. This area is covered by farmland, vineyards and settlements, while other land uses (especially pastures) are becoming overgrown. Carbonate rocks are a base for the development of shallow karst and rocky terrain with dolines as a common landscape feature. Since Bela krajina is distinctly karstified, a lot of caves have developed. Due to karstification, the region was considered by Ciglič et al. [22] (p. 79) “among the Slovenian areas with the poorest natural conditions for agriculture”, where 83.3% of the agricultural land is classified as less suitable for agriculture. Since the opportunities for people to find jobs locally in non-agricultural activities were also modest, a large number of people have emigrated to other Slovenian regions or abroad. As a result of such out-migration, the region is today grappling with significant social and economic challenges [24].

2.2. Methods

In order to better understand the influence of karst landscape on the sustainable development we used three approaches: (1) the Karst Disturbance Index, (2) a quantitative assessment using set of sustainable development indicators, and (3) a qualitative analysis using interviews.
With the first approach we assessed the degree of human disturbance, based on an environmental index specific to karst areas, i.e., Karst Disturbance Index [24]. The index was assessed for the whole region as well as for its three municipalities: Črnomelj, Metlika and Semič (Figure 1). The Karst Disturbance Index used was defined by van Beynen and Townsend [11], and classifies human disturbance of karst areas by considering a variety of factors associated with environmental degradation of karst, including pollution, cave destruction and development. The Index is composed of five main categories: (1) geomorphology, (2) atmosphere, (3) hydrology, (4) biota and (5) culture; and these categories include physical, biological and social interactions within the landscape. To minimise complexity and provide the evaluator with a systematic approach, the index provides a categorical framework in which indicators are collected and ranked. Each indicator is assigned a score from 0–3, depending on the extent and severity of the variable being assessed. No human impact/disturbance is scored as 0. In the case of an obvious disturbance, a judgement is made as to whether the impact is considered localised and not severe (score = 1), widespread (score = 2) or catastrophic (score = 3). The scores for all indicators are added together and divided by the highest possible score to give a value between 0 and 1. In the end, the compilation of the scores gives a rating of the extent of human disturbance to the karst landscape [11]. If there is no information/data available for some indicators, these indicators are assigned a “Lack of Data” value (LD). The “Lack of Data” rating is calculated by dividing the number of LD listed in the index by the total number of indicators used. This rating allows us to assess the credibility of the index. If the credibility rating is below 0.1, it indicates a high level of confidence, while values above 0.4 indicate that more research is needed before the application of the index is plausible for the selected study region [11]. The original index was adapted to fit the data and characteristics of the study region [24], therefore some indicators were not included as they were found to be irrelevant to the study region, while others were included instead. This process also took into account the availability of data and the indicators were discussed among karst experts to validate their use. Data collection for the index was obtained from published research articles and government reports.
With the second approach we analysed the sustainable development with a quantitative assessment by using sustainable development indicators [24]. We used a combined set of indicators, mainly from Ravbar [25] and Vintar Mally [26], consisting in a balanced way of the three main dimensions of sustainable development: environmental, economic and social. These two studies were the main references for the selection of indicators, as they present the most up-to-date indicators used in the assessment of regional development in Slovenia. Other recent studies evaluating well-being in Slovenia were also taken into account [27,28], as well-being is considered a very important aspect for sustainable development. The economic characteristics of development in the three municipalities were studied using 12 indicators divided into three themes. The selection of these indicators is based on the assumption that greater economic activity has a positive impact on the economy as people have better employment opportunities. The environmental dimension is represented by 8 indicators (the number of indicators used in the analyses was limited due to the unavailability of municipality-level data) that describe the environmental pressures caused by human activities, social responses to environmental problems and the condition of some landscape features [26]. These indicators were grouped into five themes. The 8 indicators selected to represent the social status of the three municipalities were grouped into two themes. The demographic indicators show the characteristics and population dynamics in the municipality, which are the main drivers of development initiatives in the communities [25]. We assume that a positive population growth rate and its components are generally characteristic of areas with higher development (at least in social aspects).
The final selection of indicators to be used was largely influenced by the availability of data. Data were obtained from various sources: Statistical Office of the Republic of Slovenia [29,30,31], the Institute of the Republic of Slovenia for Nature Conservation [32], the Ministry of Agriculture, Forestry and Food [33], the Slovenian Environmental Agency [34] and previous studies that collected information for some indicators. The data collected varies between 2010 and 2016.
The values of each indicator were assigned a score in terms of their contribution to sustainable development. Three scores were possible for each indicator: 1: for a positive contribution to sustainable development, −1: for a negative impact on sustainable development and 0: if the scores were equal to the region average. We calculated the mean value of the indicators ordered by theme and then by sustainable development domain. Finally, we calculated the final sum of the scores to give an indication of sustainable development for each municipality [24]. If the sum value of the municipality was lower than the average in the region, a minus (–) was assigned; if the value was equal or not significantly different from the average for the region, an equal (=) was assigned; and if the value was higher than the average for the region, a plus (+) was assigned.
Within the third approach we used a qualitative analysis, i.e., structured interviews, to assess the influence of karst landscape features on sustainable development [24]. This technique of data collection is widely used in social sciences and is also becoming popular in various fields of natural sciences [35], as it can lead to obtaining information that is not provided by other sources. We used a structured type of interview as we intended to obtain responses from different local stakeholders to the same questions, allowing deeper insights into the views and perspectives of respondents. We conducted interviews with a total of 32 respondents, which included farmers, resident non-farmers, and nature protection, tourism and local development professionals (city council representatives). Some interviewees were selected based on their respective areas of expertise, while others were selected through snowballing. Potential interviewees were contacted by phone in advance, the basic research objectives were outlined, and an interview date was arranged. Interviews were conducted in June and July 2016. Three different types of questionnaires were prepared according to the target stakeholders: one type was prepared for farmers and resident non-farmers; another type was prepared for tourism professionals and nature protection professionals; and the third type was prepared for local government representatives. Some questions were the same in all three questionnaires, while others differed between them (Table 1). Most interviews were conducted in the respondent’s home or workplace. After a brief introduction of the interviewer and the research topic, individuals were asked between 10 and 14 questions depending on the target stakeholder. Each interviewee was allocated a two-hour visit. The interviews were recorded with the permission of the interviewee and later transcribed. The interviews were conducted in Slovenian. In this study, the transcripts of the interviews represent a collection of views and discussions that local stakeholders involved in landscape management have in relation to regional development and the functions provided by the landscape. As the transcripts yielded an enormous amount of qualitative data, the text segments were tightly coded. The codes were then analysed and used to identify key ideas and were later used to calculate summary scores for each response given [24].
Furthermore, based on the above analyses resulting from the three approaches, and following a similar approach used by Kovács et al. [36], we constructed a model matrix of different landscape types reflecting the population retention capacity of the three municipalities in the future. According to the relationships between the three dimensions represented by sustainable development indicators, landscape types were identified and scenarios regarding population retention capacity were described [24]. The three dimensions are classified as low, medium and high, according to their contribution to sustainable development as assessed in the quantitative analyses. ‘Low’ means that more than half of the indicators were assessed below the average of Bela krajina, while ‘medium’ means that half of the indicators were assessed negatively and the other half positively. A ‘high’ scale means that more than half of the indicators used to evaluate the domain were rated positively. The main objective of this matrix was to determine whether the municipalities are managed sustainably. We only considered rural landscapes, and although there are a number of other landscape types, they are not relevant to this study. In the next step we placed the municipalities within the model scenarios and finally we dealt with future alternative scenarios (possible futures) for Bela krajina based on the model scenarios assigned to each municipality.

3. Results

3.1. Karst Disturbance Index

The evaluation of landscape conditions through the Karst Disturbance Index showed that all three municipalities were classified as low disturbance, so we can say that the karst landscapes of Bela krajina generally have low disturbance from human activities. Table 2 gives a general overview of the ranking of each indicator for each municipality, details of the descriptive evaluation for each indicator that makes up the Karst Disturbance Index are descrived below.
  • Quarrying/mining: Quarry locations were first identified from a 1984 map of quarrying and mining activities in Bela krajina [37], and then these locations were verified with Lidar data from 2014 and DOF from 2014/2015. The size of inactive quarries was measured using GIS. All identified quarrying and mining activities in the region are classified as minor. A rating of 3 was assigned to this indicator for the municipality of Črnomelj, where ten quarry/mining sites are located, with one large coal mine. In the municipality of Semič there are seven small mining sites, therefore this indicator was assigned a score of 2. In the municipality of Metlika there are three small quarries, therefore we assigned a score of 1 to this indicator.
  • Surface flooding (artificial surfaces): Taking into consideration the flood hazard maps for rare floods [34], we concluded that there are no catastrophic or frequent floods in Bela krajina, but only some occasional flooding. Therefore, this indicator is 0 in all three municipalities.
  • Storm water drainage (% of total stormwater funnelled into ponors): From the classification of registered caves, we identified eight ponors within the study region [38]. However, it is important to note that all of the water bodies in the study region are small in size and none of these eight ponors have a high disturbance impact, therefore the maximum rating is 2.
  • Infilling caves (% of infilled caves): Bela krajina has 622 registered caves [38]. Almost 19% (118) of Bela krajina’s caves are considered degraded (destroyed and polluted), of which 1.4% are destroyed and 17.5% are polluted [39]. 70 degraded caves are located in the municipality of Črnomelj, 15 in the municipality of Metlika and 33 degraded caves in the municipality of Semič. In all three municipalities, the percentage of degraded caves is ranked on a scale of 1–33%, so this indicator was rated 1 for all three municipalities.
  • Illegal waste dumping: In Črnomelj there are 98 illegal landfills covering a total area of 20,755 m2, which is 0.006% of the Črnomelj municipality. In Metlika there are 32 illegal landfills covering 2870 m2 or 0.003% of the municipality area. In Semič, 57 illegal landfills were identified, covering a total of 16,834 m2 [40] or 0.011% of the municipality area. From these numbers, we assigned Črnomelj and Metlika a score of 1 and Semič a score of 2, as this municipality has a comparatively higher number of areas affected by waste disposal than the other two municipalities. In reality, this number could be higher than indicated, as there could be many more illegal dumpsites that have not yet been identified/mapped. However, these figures are a good estimate of the environmental impact that this activity could have in the study region.
  • Soil erosion: More than 38% of the cultivated land within the Črnomelj municipality poses a severe erosion risk due to its slope. Only about 8% is classified as low erosion risk and slightly more than 25% as moderate erosion risk. About the same percentage of the area has a high erosion risk. Approximately 42% of the cultivated land within the Metlika municipality is located in areas considered to have a severe erosion risk, while 12% is at low risk of erosion. 25% of the cultivated land has a moderate erosion risk and 21% has a high erosion risk. These values are very similar to those of Črnomelj municipality, so both municipalities were assigned a high erosion risk (considering that about 40% of cultivated land has a severe erosion risk). According to erosion indicators, Semič is the most affected municipality in the region, where almost 75% of cultivated land is located in places with severe erosion risk. Only slightly more than 1% have low erosion risk, about 8% have moderate erosion risk and the rest have high erosion risk. Therefore, this municipality was given a score of 3.
  • Compaction due to livestock or humans: The share of land use activities causing soil compaction (in pastures and built-up areas) is quite similar in all three municipalities and is 2.9% in Črnomelj, 4.6% in Metlika and 2.2% in Semič. All three municipalities have a share of pastures and urban infrastructure between 1–33%, therefore all of them were assessed as 1, which corresponds to some isolated concentrated areas of compaction due to livestock and people.
  • Subsurface flooding (human-induced cave flooding due to surface alteration): No dams have been built in the study region. Natural flooding events occur due to high rainfall, but not due to dams, therefore this indicator is zero in all three municipalities.
  • Cave formation removal or vandalism: Many of the registered caves in the study region were recently discovered and had never been visited before; at least, there was no evidence of human intervention in these newly-registered caves. Cave tourism is not a significant economic activity in Bela krajina. There is one known tourist cave, Malikovec cave, located in Semič municipality. Nevertheless, some cases of speleothem mining were found in all three municipalities through the survey of Cave Registry [38]. In Črnomelj, six caves with speleothem removal were found. In Semič municipality, only one cave identified was affected by the removal of cave formations. Also, in Metlika, one cave was identified with cave formation removal. As these cases are isolated examples of removal compared to the total number of existing caves in the study region, this indicator was scored as 1 for all three municipalities.
  • Mineral and sediment removal: In Slovenia, the extraction of minerals and sediments from caves is prohibited for economic reasons [41], nevertheless, while reviewing cave records, we found one case of sediment extraction that is located in Metlika municipality. Therefore, we assigned a 1 for Metlika municipality. The other two municipalities were considered untouched in terms of mineral and sediment removal.
  • Floor sediment compaction-destruction: This indicator is zero for all three municipalities. Since only one cave can be considered as touristic (Malikovec Cave) within the study region, the path through Malikovec Cave is not limited to a single small path used by cave visitors, but the entire cave floor has been damaged or even destroyed. However, the impact can be disregarded in terms of its significance for the assessment of sediment compaction-destruction of the ground in the municipality/region.
  • Desiccation: Only Malikovec Cave was considered a touristic cave that could be affected by desiccation. Since there are no artificial entrances in the Malikovec Cave that affect the desiccation of the cave, this indicator was evaluated as 0 for the Semič municipality, as well as for the other two municipalities, since there are no touristic caves where this impact is usually greater.
  • Human-induced condensation, corrosion: This indicator is scored zero for all three municipalities for the same reasons as the previous four indicators.
  • Pesticides and herbicides: If we consider the impact of this indicator only through the share of cultivated fields, orchards and vineyards, the share of land on which herbicides and pesticides are applied is 7.2% in Črnomelj, 13.7% in Metlika and 1.8% in Semič. Thus, this percentage is below 33% in all three municipalities and we therefore believe that these values indicate low use of chemicals in all three municipalities, which is why they were scored as 1. However, through literature research we discovered information about one pig farm located in Črnomelj municipality. This pig farm is considered problematic due to the spreading of manure, which leads to an unbearable smell [42]. Although there is no evidence (monitoring) of groundwater pollution, it is possible that this activity may cause groundwater pollution (this issue has been reported in the media, e.g., [43]). Therefore, this indicator for the municipality of Črnomelj was assessed as 2.
  • Industrial and petroleum spills or dumping: We summarised all wastewater treatment plants according to their location within the three municipalities, as well as in all existing industries. According to these data, Črnomelj was rated 2 because there are 11 wastewater treatment plants and industries that pose a potential risk for spillage and dumping. Metlika was also rated 2, as there are 13 facilities in the municipality. Although there are only four facilities in Semič, we assigned the highest score to this municipality. An anthropogenic disaster in the mid-1980s due to improper handling of hazardous PCBs from the dumping of condensers in the unprotected karst hinterland of the Krupa River slowly leached PCBs into the sub-surface, which later reappeared in the Krupa spring. Long-term monitoring measurements show that the pollution of the Bela krajina with PCBs has gradually decreased, but the concentration in the area of the Krupa River and in the immediate surroundings of the Iskra factory in Semič, as well as in individual elements of the food chain, is still high. The Krupa River is still the main source of PCB emissions in the environment through water evaporation [44].
  • Occurrence of algal blooms: According to the Map of Sensitive Areas due to Eutrophication [34], there are no sensitive areas due to eutrophication in the study region, therefore this indicator was scored 0 for the three municipalities.
  • Changes in the water table (decline in meters): The variability of water levels could not be calculated because the national hydrological monitoring data from the Slovenian Environmental Agency are not complete, so the comparison of these values between different years is not possible. Thus, there is a lack of data for this indicator.
  • Changes in cave drip waters: We do not have available data for this indicator because there are no studies on the relationship between land use activities outside caves and cave drip water in Slovenian caves; this type of monitoring has not been carried out in Slovenia so far. Kogovšek [45] demonstrated that runoff water entering karst waters after precipitation was polluted due to the proximity of a highway. However, this study did not take place in Bela krajina, and therefore a “Lack of Data” was assigned to this indicator for the three municipalities.
  • Vegetation removal (% of the total): Since in Slovenia “clear-cutting is prohibited as a form of forest management” [46] and there had been no recent fires in any of the three municipalities, this indicator was scored 0 for all three municipalities.
  • Species richness in caves (% decline): The number of cave-dwelling species in Slovenia is among the highest in the world [47,48]. The best-known cave-dwelling species is the Proteus or Olm (Proteus anguinus), an endemic amphibian of the underground waters of Dinaric Karst [47,49]. Two subspecies of Proteus occur in Bela krajina, the White Olm (Proteus anguinus anguinus) and the Black Olm (Proteus anguinus parkelj). The latter subspecies is rare and endemic to and known only in the Bela krajina region [47]. Culver and colleagues [48] studied patterns of species richness in Slovenian caves. The authors found an increase in species richness in the Bela krajina region from 1940 to 2000, but comparisons between years are difficult because new caves and new species are constantly being discovered [48], which complicates the monitoring process. In the absence of species richness studies separated by decades for the study region to show some degree of disturbance, a “Lack of Data” was assigned.
  • Population density in caves (% decline): As the Olm is a habitat specialist among cave dwellers, it would be a suitable indicator species for the condition of subterranean habitats [47]. Therefore, we could use population data for this species as an indicator since it is an umbrella species; yet, there is no systematic monitoring of groundwater quality at the national level, and especially for the study region, limited to sites of Olm or other cave fauna [47], so a “Lack of Data” was assigned for the three communities here as well.
  • Groundwater species richness (% decline): Slovenia has a remarkable concentration of groundwater fauna compared to other countries [50]. Studies of groundwater species in Slovenia exist, but they do not take into account temporal variation in species numbers, and these studies have not been conducted for the study region. Therefore, we assigned “Lack of Data” for the same reason as for the previous two indicators.
  • Groundwater population density (% decline): Although there are several studies on population diversity (e.g., [51,52]), we could not find any studies monitoring changes in groundwater population density, so this indicator was rated “Lack of Data” due to unavailability of data.
  • Destruction/removal of historical artefacts (% taken): This indicator refers to historical artefacts that have been removed from their original locations. Through literature research (e.g., [53]) we found two cases located in the Črnomelj municipality. The tumulus cemetery Veliki Nerajec originally had at least seven tumuli, but only two of them are partially ploughed up today. In the Šipek cemetery, locals ploughed up various objects, destroying and scattering them [53]. There are probably more cases of destruction or removal of historical artefacts, although only these two cases have been identified. We assigned a rating of 2 to the Črnomelj municipality and 0 to the other two municipalities.
  • Regulatory protection: Although the entire region is not fully protected, all three municipalities have protected areas that directly or indirectly protect the karst environment; therefore, the Regulatory Protection indicator was scored as 1 for all municipalities. The regulatory protection present in the study region is as follows:
    • Natura 2000;
    • Lahinja Landscape Park;
    • Kolpa Landscape Park;
    • The Underground Cave Protection Act.
  • Enforcement of regulations: Through literature searches we could not find any information on this indicator. During the fieldwork we noticed some information boards near protected areas and some caves. However, no additional enforcement measures were found, so we gave a score of 2 to all three municipalities on this issue.
  • Public education: During the research we had contact with many people from the region, and we found that many people from Bela krajina are also active in nature conservation. There are several non-profit organisations connected with nature conservation (Proteus, Eko društvo Krupa, various caving clubs). The NGO Proteus was founded to participate in environmental protection and to intervene in cases and processes that harm nature in Bela krajina. Among the caving associations active in Bela krajina are Novo mesto Caving Club, Krka Caving Club and Črnomelj Caving Club, which organise annual caving schools aimed specifically at schoolchildren. This educational programme aims to teach people about karst and karst phenomena, focusing on the characteristics of the Dolenjska karst (i.e., karst of southeast Slovenia); the living environment of caves and the fauna of the Dolenjska karst; together with the risks and protection of karst and the Underground Cave Protection Act [41,54]. These topics are also covered in some subjects of the school curriculum, where students learn about karst features and the vulnerability of the karst environment (e.g., [55,56]). Therefore, based on the above initiatives, we have given all three municipalities a score of 1, as we believe that more activities could take place with local residents.
  • Building of roads: There are no highways in Bela krajina, only national and regional roads. It is important to mention that in Slovenia roads have a great impact on the environment even in winter due to the heavy use of road salt during icy conditions [57]. In the summer months, traffic in Bela krajina increases greatly because Bela krajina is a border region with Croatia, which allows the passage of people towards the Croatian coast. Therefore, we assigned a value of 1 to all three municipalities, as all three are similarly affected by roads and traffic.
  • Building on karst features: The highest rating of this indicator (3) represents the presence of large cities, but as only towns and villages are present in the region, this indicator was rated as 2 for all three municipalities.
  • Construction within caves: Although there is a path through the Malikovec Cave, its impact can be neglected compared to its importance for the municipality in which it is located, therefore this indicator has been assigned a value of 0 for the municipality of Črnomelj and also for the other two municipalities where no construction work inside caves is recorded.
The compilation of the scores and interpretation of the values on the degree of karst disturbance for each municipality is summarised in Table 3. The results show that the karst environment of all three municipalities in Bela krajina has a low degree of disturbance.
We assessed the credibility of the index by rating “Lack of Data” from Table 2. Since we had LD for six indicators for the three municipalities, the LD rating was 0.2, meaning that one-fifth of the indicators did not have enough data to allow a rating, which corresponds to moderate confidence in the index. A small difference was found between the three municipalities, showing that Črnomelj has slightly more disturbance than Metlika and Semič. This could be accentuated by the fact that this municipality has recently been exposed to human activities with a large impact on the karst environment (e.g., biogas plant, pig breeding) or because the media have reported more on it and therefore more attention has been paid to such activities.

3.2. Quantitative Assessment of Sustainable Development (Sustainable Development Indicators)

The quantitative analysis of the landscape features for sustainable development, through the application of classic sustainable development indicators for the three municipalities, shows that there are differences between the municipalities. The most favourable area in Črnomelj municipality is the environment and the least developed is the social area. In Metlika, the most developed area is economic, while the environment and social areas are less developed. In Semič, all three pillars of sustainable development in this municipality are above the average for Bela krajina. The most favourable domain of sustainability is the environment, followed by the economy and finally the social domain.
According to the analysis of economic indicators, Semič and Metlika are the most developed municipalities in the study region, while Črnomelj is the least developed (Table 4).
According to the environmental indicators, both Črnomelj and Semič are in a favourable position in terms of environmental sustainability. However, Semič is in a relatively better position, followed by Črnomelj and then Metlika (Table 5).
In accordance with the social indicators, Semič has achieved higher development, followed by Metlika and finally Črnomelj (Table 6).
Considering the results, we can state that within Bela krajina we found differences in the structure related to economy, population and environment. Taking into account the three domains and comparing all three municipalities, we can conclude that Semič is the most sustainably developed municipality in Bela krajina and Črnomelj is the least sustainably developed municipality, with Metlika in between (Table 7).

3.3. Qualitative Assessment of the Sustainable Development (Structured Interviews)

Responses to all questions from the interviews conducted by the five stakeholder groups (farmers, resident non-farmers, nature protection professionals, tourism professionals, local government representatives) were analysed individually. Figure 2 provides the coded answers to the question number 4 (Table 1), “What are the characteristics of this landscape that distinguish this place from other landscapes?”. More frequently mentioned special characteristics of landscapes in Bela krajina were “Karstic terrain”, “Litter raking forests” and “Absence of large factories/industry”. One might think that when respondents mentioned features of their landscape such as “Remote”, “Absence of large factories/industry”, “Absence of mass tourism” and “Not well developed”, these were meant as negative aspects, however, these were actually expressed as positive features of their landscape. The majority of respondents answered that the region benefits from being less developed, as this protects the natural areas from being destroyed for development.
Even though this exercise was done to all the questions, here we only provide a general overview of the responses (for more details see [24]). Through the use of interviews, the qualitative analysis of landscape features for sustainable development gave us different insights into local stakeholders’ perspectives on their landscapes.
Farmers affirmed that their local landscape contributes to their well-being. In general, they argued that they play an important role in landscape management, and they are proud to contribute to the conservation of Bela krajina’s cultural landscapes. Nevertheless, some claim that the landscape was more abandoned in the recent past than today, while others said that the landscape is currently overgrown. The differences in responses could be due to farmers’ locations, as some areas are more overgrown while others are still subject to intervention. Some farmers expressed concern about the existence of large commercial areas in the region selling non-local products that they cannot compete with (e.g., through lower prices) and pointed the finger at national policies. They affirmed that karst landscape features influence the type of agriculture, mainly due to the stoniness and shallow soils. Thus, these affect local development as difficult agricultural conditions lead to out-migration. On the other hand, they also said that karst landscapes can attract tourism to the region, and in this way karst features have a positive influence on local development. We found differences in the responses of beekeepers and other farmers. Beekeepers said that karst features have no influence on local development. Their response is understandable, as beekeepers are not directly affected by the agricultural constraints that karst features might bring. In addition, a farmer from Griblje village said that karst features do not affect his activities or local development. This answer is reasonable, as the natural conditions around Griblje are more favourable for agriculture than in other parts of the study region. Farmers shared a general vision of their landscape in the future: that it should remain at least as it is now.
For resident non-farmers, the green and clean landscape has a positive effect on their well-being and provides relaxation. Half of the resident non-farmers responded that they play no role in landscape maintenance, while the other half said they play an indirect role through their attitudes and ideologies. Unanimously, resident non-farmers said that karst features do not influence their activities. However, their opinion regarding the influence of karst features on local development is again divided. Some stated that such features have no influence on development while others said that they do. This disagreement may be related to the heterogeneity of this group of stakeholders in terms of their ages and occupations, however, the profile data of the respondents was not recorded so this relationship could not be assessed. In terms of changes to the landscape, some resident non-farmers indicated that changes were related to infrastructure improvements, while others indicated that changes were related to the abandonment of agricultural practices. Resident non-farmers affirmed that nature protection has no influence on their activities and only one respondent claimed that nature protection positively influences his activities because he owns a restaurant that benefits from tourism. They are very much in favor of nature protection, as it is necessary to preserve the nature of the region and to attract tourists. Like the farmers, the resident non-farmers also want to keep their landscape as it is now. However, some are afraid that the landscape will continue to overgrow, while others said that if the landscape changes, these changes will be minimal.
In general, local government representatives commented that Bela krajina is not as developed as it should be, especially in comparison with other Slovenian regions. They mentioned that the main aspects of the underdeveloped landscape are the lack of jobs, the lack of basic infrastructure and the lack of industry. These answers show that local government representatives see development mainly from a socio-economic point of view. They feel responsible for improving the current state of the landscape through their activities (e.g., addressing overgrowth of agricultural land through financial incentives, sanitation and construction of a wastewater treatment plant). The responses on the main drivers leading to landscape change were likely to vary because respondents were from different departments and therefore had different opinions. Apart from one respondent, all local government representatives mentioned increasing food self-sufficiency as a possible source of employment opportunities in Bela krajina, and the majority stated that the region has the potential to become self-sufficient. Surprisingly, the only respondent who disagreed with this vision, calling it an illusion, was an employee of the department of agriculture. Regarding the importance of involving local stakeholders in decision-making processes, we found two opposing positions: on the one hand, local government representatives claimed that local stakeholders rarely show interest and rarely participate in decision-making processes; on the other hand, farmers claimed that their ideas and opinions are not taken into account. Thus, we found a lack of communication and mistrust between the different local stakeholders. Lack of financial resources was one of the most frequently mentioned problems faced by local governments in achieving their sustainable development goals. A common vision for the future of Bela krajina’s landscapes is the preservation of cultural landscapes and attracting young people to stay in the region.
Nature protection professionals indicated that Bela krajina landscapes are valuable because they are rich and diverse. As expected, nature protection stakeholders see nature protection as a positive influence on local development. Interestingly, this is because they claim that nature protection contributes to development through tourism. This group of stakeholders affirmed that karst features are positive elements of Bela krajina landscapes. Opinions are divided on the development status of Bela krajina in this case. While some believe that the region is sufficiently developed, others claim that it is lagging behind, mainly due to the centralization of funds that do not reach the less developed regions of the country. Their visions of the future landscape are similar to those of other stakeholders; they would like to see the landscape preserved as it is now and tourism to increase in the region.
Tourism professionals affirmed that Bela krajina landscapes are valuable because of their diversity and nature, and these aspects are the ones that distinguish Bela krajina landscapes from other places. As stakeholders in nature protection, this group also spoke about the importance of nature and nature protection for the development of tourism in the region. In general, they do not see karst features as a negative influence on local development, rather the opposite. However, tourism stakeholders have a more negative vision of the future of their landscape, believing that it will become even more overgrown, and therefore would like to see an increase in local awareness of the qualities of the region.

3.4. Model Matrix and Plausible Future Scenarios for Bela Krajina

According to the relationships between the three dimensions represented by sustainable development indicators (presented in Table 7), landscape types were identified and scenarios regarding population retention capacity of these landscape types are described in Table 8.
According to the results obtained previously, we have made an evaluation for all three municipalities in terms of their economic, social and environmental values (Table 9).
According to the scenarios proposed in the model matrix of landscape types reflecting their population retention capacity (Table 8), Črnomelj is considered closest to a natural landscape (column 2 in Table 9). We have reclassified Črnomelj municipality because we believe that Črnomelj can be characterised according to sustainable development indicators as an abandoned rural landscape characterised by a significant ageing population, poor transport infrastructure, and a particularly acute decline in agriculture. This municipality is at risk of depopulation and therefore has low long-term population retention due to low viability, depopulation and land abandonment. According to the model matrix, Metlika is characterised as an intensive agricultural landscape with low long-term population retention due to resource depletion (column 3 in Table 9). In terms of sustainable development indicators and the model matrix, Semič is defined as a valuable natural and cultural landscape (column 4 in Table 9), i.e., a landscape maintained by agricultural subsidies and tourism with the ability to maintain population through subsidies and tourism income.
The scenarios assigned to the three municipalities based on their population retention capacity were the basis for plausible future scenarios for Bela krajina (Table 10). Their aim is to inform and encourage decision-makers to look beyond the current state of the landscape and envision more sustainable options for future landscapes.

4. Discussion

The study is based on the understanding and measurement of sustainable local development (development of three municipalities), taking into account socio-geographical, economic and natural geographic features. Several studies have been conducted in the field of landscape research [58,59,60] and regional development [61,62], but there is still a lack of interdisciplinary and integrated studies. Studies on regional development usually do not include landscape-related variables [63]. In this regard, a common practice within the literature dealing with this topic is to restrict it to a one-dimensional variable [64].
Using the first approach, we measured the degree of disturbance as a result of human impact on the karst landscape in three municipalities (Črnomelj, Metlika and Semič). This was done using an environmental index—the “Karst Disturbance Index”, defined by van Beynen and Townsend [11] and tested in various countries [65,66]. In this study, we slightly modified the indicators used according to their relevance to the study region. A novelty of this method is that it allows the evaluation of karst disturbance as a result of human activities in different regions with the application of only one index, which contains different indicators specific to karst areas. Since the Karst Disturbance Index has not been tested so far in Slovenia or on the whole territory of the Dinaric karst, it is not possible to compare the index results with other karstic areas in Slovenia. However, from reports on human impact on karst landscapes in Slovenia [67] we can say that when comparing Bela krajina with the Kras region in southwest Slovenia [68], which is also part of Dinaric karst, the degree of human disturbance in Bela krajina is lower than in the Kras region. This does not mean that human disturbance in the study region can be neglected. On the contrary, human disturbance should be used to inform and raise awareness among locals about the vulnerability of karst landscapes, which has implications not only for the environment and human health, but also for the sustainable development of Bela krajina.
Using the second approach, we conducted quantitative analysis of landscape features for sustainable development of Bela krajina. From this analysis and considering the three pillars of sustainable development, we concluded that the most developed municipality in Bela krajina is Semič and the least developed is Črnomelj. The main differences between the three municipalities seem to be related to their structure. Semič seems to be the most developed municipality in Bela krajina, being a small municipality dominated by conventional agriculture and geographically close to regional centres. The municipality has a rather significant industrial tradition, which has been an important driver of its development, and it also benefits economically from wine production. The Semič municipality is also characterised by: scattered settlements, construction challenges for infrastructure and mobility, low population density and remote villages with few inhabitants. There is also almost no public transport [69]. According to Development Strategy for Semič Municipality, transport infrastructure still does not meet the needs of economic development [69]. Meanwhile, Črnomelj seems to be the least developed municipality due to the long distances to regional centres, poorer accessibility, the fact that it is a larger municipality, large differences within the municipality and low population density. The results are somewhat surprising, as according to Nared et al. [70] the municipalities of Črnomelj and Metlika are considered “centres of inter-municipal importance” and Semič is considered a “centre of local importance”, which is why one would expect greater development from these two municipalities. However, it is important to note that these results are based on a set of sustainable development indicators that may not be sufficient to show the current situation of each municipality.
Using the third approach, we conducted a qualitative analyses of landscape features for sustainable development with 32 interviews with local stakeholders. We found no significant differences between the responses of interviewees from different municipalities. Probably because respondents tended to talk about Bela krajina as a whole and not about their local landscape, although this was asked at the beginning of the interview. Different perceptions were found among the different stakeholders, however all of them shared similar opinions about the naturalness of Bela krajina’s landscapes. Related to this, we can point out two landscape features that were mentioned by local stakeholders: water and remoteness. It is well known that water is one of the most valued landscape elements [71] and this was also confirmed in this study by the answers to questions such as “What makes this landscape attractive?” and “What do you consider a valuable landscape?”. Remoteness is also another characteristic of Bela krajina. However, remoteness is perceived by people from Bela krajina as both an advantage and a great burden, a view also held by [72]. Some respondents said that remoteness and isolation are advantages that contribute to the preservation of pristine nature in the region. Other respondents associated remoteness with limitations in service delivery, communication and job opportunities.
These three approaches complemented each other to achieve the proposed goal, although we detected some weakness related to each of them. While the quantitative evaluation captured a large amount of information from a range of sources and sought to use context objectively to understand the influence of landscape features on regional development, the qualitative evaluation involved local stakeholders but incorporated their insights to generate a subjective understanding of how locals perceive karst landscape features and their influences on regional development. Data availability can be a limiting factor for the application of the Karst Disturbance Index. The quantitative assessment of the sustainable regional development was affected by the availability of environmental data at municipal level (LAU 2), and the lack of a common framework to measure sustainable regional development hampering the comparison among different studies. Therefore, our analysis was only compared within Bela krajina. The qualitative assessment through structured interviews allowed the examination of the respondent’s perceptions of landscape features and their cultural values, although it’s a time-consuming and costly method, and can be subject to subjectivity.
The results of our study show that the characteristics of the karst landscape influence the sustainable regional development of Bela krajina. Agriculture in Bela krajina faces challenges. It is not competitive due to soil and relief conditions, low economic and financial strength of farms and unfavourable age and educational structure of the local population. As a result, there is abandonment of agriculture and reduction of farms. Even though the economic importance of agriculture is low and has decreased in recent decades in favour of other activities, it is crucial for landscape stability and sustainable regional development. The preservation of extensive agriculture (traditional practices) should be stimulated in order to fight against the overgrowth of agricultural land. At the same time, the conservation of extensive agriculture is very important for the preservation of biodiversity, landscape diversity and cultural landscapes. Another challenge for agriculture in the study region is to produce enough food at competitive prices and to feed the local population with a smaller rural labour force. Nevertheless, the growth of agriculture using efficient and sustainable techniques adapted to karst characteristics is the key to sustainable regional development. Due to the karst landscape characteristics in the study region, organic farming is potentially attractive for the region where land is small and conventional agricultural production is very limited. An incentive-based policy to influence land use decisions adapted to karst features should be prepared. In vulnerable areas such as karst landscapes, farmers should be encouraged to adopt appropriate farming practices (e.g., organic farming). Expanding the share of organic products and increasing the demand for local products is emerging as an answer to improve the economic situation of local farmers and thus contribute to local development [73]. Promotion of local markets with locally produced and environmentally friendly products also contributes to the local economy (e.g., creation of small businesses), to the health care of the local population (promotion of healthy local food in schools, kindergartens, nursing homes and canteens of other institutions) and to the environmental condition of the karst landscapes of Bela krajina. Therefore, we propose the promotion of regional food self-sufficiency as a contribution to sustainable regional development [74], which would contribute to the preservation of landscape diversity and traditions, as well as to employment in the rural areas. This includes the creation of agro-food chains [74], which are currently lacking in the region. This strategy would provide reasons for people to stay in the region and reduce out-migration. However, this is only possible with the participation of local people, and by encouraging local people to think about their future and use their ideas to stay in the region. The same applies to the involvement of local people in the protection and management of protected areas, which account for 46% of Bela krajina’s territory. As important stakeholders, local residents must be educated and involved in the management processes and must not be against it, otherwise the protected areas will not benefit the locals. The local people would adopt the protected areas as their own and the protected areas could be a facilitator for local development [75]. We argue that protected areas in Bela krajina should be promoted as specific development areas, as suggested by Plut and Brečko Grubar [76]. According to Lampič, Mrak and Plut [77], the protection and development of areas included in the IUCN with category V, as in the case of Lahinja and Kolpa Landscape Parks, is equally important. Thus, the study region has a good potential for development based on the existing protected areas. Today, the Kolpa River is the heart of local tourism. As tourism in Bela krajina is linked to the natural and cultural assets of the region, the well-preserved natural and cultural heritage has the potential to promote tourism development. Therefore, promotion of unique landscape features (e.g., karst features) as tourist attractions, are promoters of development [78]. We suggest the promotion of the Black Olm as a unique karst symbol of Bela krajina, which is a distinctive symbol for the promotion of sustainable tourism in the region. The attraction of the natural environment and tourism can be a significant part of the economy of Bela krajina. Businesses built around the exploitation of the region’s amenities (e.g., tourism services using local agricultural products and accommodation) can lead to the development of the region and create new jobs. However, additional infrastructure is still needed, such as different types of accommodation, paths and roads, and transport and other facilities. Despite this, and although many of the respondents indicated that the region has high tourism potential, sustainable development of the region cannot be based only on recreation and tourism, due to its vulnerability. The establishment and development of small-scale industries is thus of extreme importance for the development of the study region, which does not allow for the development of industry on a larger scale due to its vulnerability (e.g., the ecological vulnerability of water sources can be considered a limiting factor for the development of industry). Although one aspect influencing the regional development of Bela krajina is its poor accessibility as well as limited connectivity to larger urban centres and neighbouring regions, some local stakeholders indicated that the remoteness of Bela krajina contributes to the preservation of the pristine nature of the study region. This weak connectivity to larger urban centres also affects the socio-economic structure of the region (hindering service delivery, communication and employment opportunities). However, the strategic location of the study region, along the Croatian border, could be used to promote cross-border cooperation with neighbouring Croatian municipalities [79] and take advantage of easier trade with the neighbouring country. It is relevant to mention the importance of development projects, such as [80], to promote business opportunities and benefits for investment and employment in the study region. Thus, the development of Bela krajina must be based on strengthening the multifunctional role of the landscape, based on the principles of sustainable development and management of renewable natural resources, preservation of the cultural landscape, protection of the karst environment and biodiversity [81].

5. Conclusions

The main goal of this study was to identify the influence of karst landscape features on sustainable development of Bela krajina. In order to draw attention to the combination of social perspectives with natural conditions for an integrative view of the karst landscapes, we used three approaches: the Karst Disturbance Index, a quantitative analysis and a qualitative analysis. We made efforts to measure the sustainable development of the study region by balancing social, economic and environmental aspects.
Considering the vulnerability of karst regions to human impacts, these areas pose a special challenge to sustainable development. Taking into account the obtained results, karst landscape features should be considered not only as limiting factors (e.g., to agriculture and development of industry), but also as development potential (e.g., karst features can be promoted as tourism attraction).
The study region has areas of high value for development that are not very important for conservation (such as business zones), as well as areas of high conservation value yet with low development interess (e.g., karst caves, karst springs). In the study region there are also areas that meet both criteria, i.e., of high conservation value and high development appeal (e.g., Lahinja and Kolpa Landscape Parks). Regional development in karst areas should therefore be adapted to their specificities and take into account their vulnerability.

Author Contributions

Conceptualization, D.R. and M.Z.; methodology, D.R.; software, D.R.; validation, D.R.; formal analysis, D.R.; investigation, D.R. and M.Z.; resources, D.R.; data curation, D.R.; writing—original draft preparation, D.R.; writing—review and editing, D.R. and M.Z.; visualization, D.R.; supervision, M.Z.; project administration, D.R.; funding acquisition, D.R. All authors have read and agreed to the published version of the manuscript.

Funding

This research was funded by the Slovenian Research Agency, grants number P6-0101 and Z7-1885.

Acknowledgments

We are thankful to the employees from the Statistical Office of the Republic of Slovenia, from the Institute of Macroeconomic Analysis and Development, and from the Agency for Agricultural Markets and Rural Development which promptly answered the requests regarding quantitative data for the analyses. We are also thankful to all respondents from Bela krajina for their participation in the interviews that supported this study.

Conflicts of Interest

The authors declare no conflict of interest.

References

  1. Wu, J. Landscape sustainability science: Ecosystem services and human well-being in changing landscapes. Landsc. Ecol. 2013, 28, 999–1023. [Google Scholar] [CrossRef]
  2. Van Beynen, P.; Brinkmann, R.; van Beynen, K. A sustainability index for karst environments. J. Cave Karst Stud. 2012, 74, 221–234. [Google Scholar] [CrossRef]
  3. Brinkmann, R.; Jo Garren, S. Karst and Sustainability; Karst, M., van Beynen, P.E., Eds.; Springer: Berlin/Heidelberg, Germany, 2011; pp. 361–378. [Google Scholar]
  4. Burri, E.; Castiglioni, B.; Sauro, U. Agriculture, Landscape and Human Impact in Some Karst Areas of Italy. Int. J. Speleol. 1999, 28, 33–54. [Google Scholar] [CrossRef] [Green Version]
  5. Urich, P.B. Land Use in Karst Terrain: Review of Impacts of Primary Activities on Temperate Karst Ecosystems; Science Publishing, Science & Research Unit: Wellington, New Zealand, 2002. [Google Scholar]
  6. Zorn, M.; Kumer, P.; Ferk, M. Od gozda do gozda ali kje je goli, kamniti Kras? [From Forest to Forest or Where is the Bare Rocky Karst?]. Kronika 2015, 63, 561–574. [Google Scholar]
  7. Breg, M. Degradation of dolines on Logaško polje (Slovenia). Acta Carsol. 2007, 36, 223–231. [Google Scholar] [CrossRef]
  8. Earth Summit. Report of the United Nations Conference on Environment and Development; UNCED: Rio de Janeiro, Brazil, 1992. [Google Scholar]
  9. World Summit on Sustainable Development; United Nations: New York, NY, USA, 2002.
  10. Transforming Our World: The 2030 Agenda for Sustainable Development; United Nations: New York, NY, USA, 2015.
  11. Van Beynen, P.; Townsend, K.A. Disturbance Index for Karst Environments. Environ. Manag. 2005, 36, 101–116. [Google Scholar] [CrossRef] [PubMed]
  12. Smrekar, A.; Urbanc, M.; Kladnik, D.; Breg, M.; Erhartič, B.; Nared, J.; Petek, F. Kras kot razvojni potencial: V iskanju ravnovesja med varovanjem in razvojem [Karst as a development potential: In search of a balance between protection and development]. In Veliki Razvojni Projekti in Skladni Regionalni Razvoj; Nared, J., Perko, D., Ravbar, M., Horvat, A., Hren, M., Juvančič, L., Piry, I., Rončević, B., Eds.; Založba ZRC: Ljubljana, Slovenia, 2007; pp. 91–101. [Google Scholar]
  13. Luthar, O.; Dobrovoljc, H.; Fridl, J.; Mulec, J.; Pavšek, M. (Eds.) Kras, Trajnostni Razvoj Kraške Pokrajine [Karst, Sustainable Development of Karst Landscapes]; Založba ZRC: Ljubljana, Slovenia, 2008. [Google Scholar]
  14. Bonacci, O. (Ed.) Sustainability of the Karst Environment Dinaric Karst and Other Karst Regions. In Proceedings of the International Interdisciplinary Scientific Conference, Plitvice Lakes, Croatia, 23–26 September 2009; UNESCO: Paris, France, 2010. [Google Scholar]
  15. Gabrovšek, F.; Knez, M.; Kogovšek, J.; Mihevc, A.; Mulec, J.; Perne, M.; Pipan, T.; Prelovšek, M.; Slabe, T.; Šebela, S.; et al. Development challenges in karst regions: Sustainable land use planning in the karst of Slovenia. Carbonate Evaporite 2011, 26, 365–380. [Google Scholar] [CrossRef]
  16. Gams, I. Kras v Sloveniji v Prostoru in Času [Karst in Slovenia in Space and Time]; Založba ZRC: Ljubljana, Slovenia, 2003. [Google Scholar]
  17. Lah, A. Voda-Vodovje: Poglavitni Življenjski vir Narave in Gospodarstva; Svet za varstvo okolja Republike Slovenije: Ljubljana, Slovenia, 1998. [Google Scholar]
  18. Gams, I.; Lovrenčak, F.; Ingolič, B. Krajna vas: A study of the natural conditions and of agrarian land utilization on the Karst. Geogr. Zb. 1971, 12, 221–261. [Google Scholar]
  19. Kladnik, D.; Senegačnik, J. Opredelitev Naselij s Kraškim Površjem [Definition of Settlements with Karst Surface]; Inštitut za Geografijo Univerze Edvarda Kardelja v Ljubljani: Ljubljana, Slovenia, 1983.
  20. Kladnik, D. Dinarski svet. In Slovenija—Pokrajine in Ljudje; Perko, D., Orožen Adamič, M., Eds.; Mladinska Knjiga: Ljubljana, Slovenia, 1998; pp. 296–309. [Google Scholar]
  21. Cunder, T. Območja z Omejenimi Dejavniki za Kmetijstvo in Reforma Kmetijske Politike v Sloveniji; Učinki Reforme Slovenske Kmetijske Politike: Ljubljana, Slovenia, 2001; pp. 83–100. [Google Scholar]
  22. Ciglič, R.; Hrvatin, M.; Komac, B.; Perko, D. Karst as a criterion for defining areas less suitable for agriculture. Acta Geogr. Slov. 2012, 52, 61–98. [Google Scholar] [CrossRef] [Green Version]
  23. Habič, P. Hidrografska rajonizacija krasa v Sloveniji. Krs Jugosl. 1969, 6, 79–91. [Google Scholar]
  24. Ribeiro, D. Bela Krajina—Sustainability in a Karst Landscape; Razpotnik Visković, N., Šmid Hribar, M., Eds.; Založba ZRC: Ljubljana, Slovenia, 2020. [Google Scholar] [CrossRef]
  25. Ravbar, M. Razvojni potenciali slovenskih občin. IB Rev. 2014, 48, 37–48. [Google Scholar]
  26. Vintar Mally, K. Regional differences in Slovenia from the viewpoint of achieving Europe’s sustainable development. Acta Geogr. Slov. 2018, 58, 31–46. [Google Scholar] [CrossRef] [Green Version]
  27. Rovan, J.; Malešič, K.; Bregar, L. Blaginja občin v Sloveniji [Well-being of the municipalities in Slovenia]. Geod. Vestn. 2009, 53, 70–91. [Google Scholar]
  28. Kazalniki Blaginje v Sloveniji. Available online: http://www.kazalniki-blaginje.gov.si/ (accessed on 1 August 2016).
  29. Statistical Office of the Republic of Slovenia. Statistični Register Delovno Aktivnega Prebivalstva; Statistical Office of the Republic of Slovenia: Ljubljana, Slovenia, 2015. Available online: http://www.stat.si/StatWeb/en/News/Index/5198 (accessed on 9 February 2017).
  30. Slovene Statistical Regions and Municipalities in Numbers; Statistical Office of the Republic of Slovenia: Ljubljana, Slovenia, 2008 2011 2015. Available online: http://www.stat.si/obcine/en (accessed on 24 March 2017).
  31. Raba Kmetijskih Zemljišč, po Občinah, Slovenija; Statistical Office of the Republic of Slovenia: Ljubljana, Slovenia, 2000 2010. Available online: http://pxweb.stat.si/pxweb/Database/Kmetijstvo_2010/00_kazalniki/05_15P92_obcine/05_15P92_obcine.asp (accessed on 10 May 2017).
  32. Institute of the Republic of Slovenia for Nature Conservation. Nature Conservation Atlas; Institute of the Republic of Slovenia for Nature Conservation: Ljubljana, Slovenia, 2000. Available online: https://www.naravovarstveni-atlas.si/web/DefaultNvaPublic.aspx?culture=en-US (accessed on 11 May 2017).
  33. Ministry of Agriculture, Forestry and Food. Land Use Data Base; Ministry of Agriculture, Forestry and Food: Ljubljana, Slovenia, 2016. Available online: http://rkg.gov.si/GERK/ (accessed on 25 April 2016).
  34. Slovenian Environmental Agency. Atlas of the Environment; Slovenian Environmental Agency: Ljubljana, Slovenia, 2016. Available online: http://gis.arso.gov.si/atlasokolja/profile.aspx?id=Atlas_Okolja_AXL@Arso (accessed on 12 May 2016).
  35. MacDonald, D.H.; Bark, R.; MacRae, A.; Kalivas, T.; Grandgirard, A.; Strathearn, S. An interview methodology for exploring the values that community leaders assign to multiple-use landscapes. Ecol. Soc. 2013, 18. [Google Scholar] [CrossRef] [Green Version]
  36. Filepné Kovács, K.; Valánszki, I.; Sallay, Á.; Jombach, S.; Mikházi, Z.; Kollányi, L. Landscape function analysis as a base of landscape visions. Acta Univ. Sapientiae Agric. Environ. 2015, 7, 58–70. [Google Scholar] [CrossRef] [Green Version]
  37. Bukovac, J.; Poljak, M.; Šušnjar, M.; Čakalo, M. Tumač za List Črnomelj: L 33-91: Osnovna Geološka Karta, 1:100 000; Socijalistička Federativna Republika Jugoslavija: Beograd, Serbia, 1984. [Google Scholar]
  38. Jamarska Zveza Slovenije. Cave Registry; Jamarska Zveza Slovenije: Ljubljana, Slovenia, 2016. [Google Scholar]
  39. Ribeiro, D.; Tičar, J. The problematics of cave pollution in Bela krajina. Nat. Slov. 2017, 19, 43–45. [Google Scholar]
  40. Register of Wild Landfills. Available online: http://register.ocistimo.si/RegisterDivjihOdlagalisc/ (accessed on 8 April 2016).
  41. Zakon o Varstvu Podzemnih Jam [Underground Cave Protection Act]; Official Gazette of the Republic of Slovenia 2/2004, 61/2006 and 46/2014; Uradni List Republike Slovenije: Ljubljana, Slovenia, 2004.
  42. Društvo Proteus. Stanje Območij Natura 2000 za Človeško Ribico, Okoljske Nevarnosti na Terenu in Predlog Ukrepov; Društvo Proteus: Črnomelj, Slovenia, 2016. [Google Scholar]
  43. Rajšek, B. Stariha za Smrad Krivi Prebavne Težave Prašičev. Available online: http://www.delo.si/novice/slovenija/stariha-za-smrad-kriviprebavne-tezave-prasicev.html (accessed on 20 September 2016).
  44. Plut, D. Bela krajina. In Regionalnogeografska Monografija Slovenije; Perko, D., Ed.; Geografski Inštitut Znanstvenoraziskovalni Center SAZU: Ljubljana, Slovenia, 1996; pp. 40–60. [Google Scholar]
  45. Kogovšek, J. Podrobno spremljanje kvalitete vode, odtekajoče z avtoceste in njen vpliv na kraško vodo. Annales 1995, 5, 149–154. [Google Scholar]
  46. Zakon o Gozdovih [Act on Forests]; Official Gazette of the Republic of Slovenia 30/93, 56/99, 67/02, 110/02, 115/06, 110/07, 106/10, 63/13, 101/13, 17/14, 24/15, 9/16 in 77/16; Uradni List Republike Slovenije: Ljubljana, Slovenia, 1993.
  47. Hudoklin, A. Are we guaranteeing the favourable status of the Proteus anguinus in the Natura 2000 network in Slovenia? In Pressures and Protection of the Underground Karst–Cases from Slovenia and Croatia; Prelovšek, M., Zupan Hajna, N., Eds.; Karst Research Institute ZRC SAZU: Postojna, Slovenia, 2011; pp. 169–181. [Google Scholar]
  48. Culver, D.C.; Christman, M.C.; Sket, B.; Trontelj, P. Sampling adequacy in an extreme environment: Species richness patterns in Slovenian caves. Biodivers. Conserv. 2004, 13, 1209–1229. [Google Scholar] [CrossRef]
  49. Aljančič, G.; Năpăruș-Aljančič, M.; Stanković, D.; Pavićević, M.; Gorički, Š.; Kuntner, M.; Merzlyakov, L. A Survey of the Distribution of Proteus Anguinus by Environmental DNA Sampling; CEPF Final Project Completion Report; Society for Cave Biology: Ljubljana, Slovenia, 2014. [Google Scholar] [CrossRef]
  50. Culver, D.C.; Sket, B. Hotspots of subterranean biodiversity in caves and wells. J. Cave Karst Stud. 2000, 62, 11–17. [Google Scholar]
  51. Sket, B. Biotic diversity of hypogean habitats in Slovenia and its cultural importance. In Biodiversity International Biodiversity Seminar; UNESCO: Gozd Martuljek, Slovenia, 1996; pp. 59–74. [Google Scholar]
  52. Sket, B. High Biodiversity in Hypogean Waters and Its Endangerment: The Situation in Slovenia, the Dinaric Karst, and Europe. Crustaceana 1999, 72, 767–779. [Google Scholar] [CrossRef]
  53. Plut, D. Osnovne geografske značilnosti Bele krajine. In Bela Krajina in Krajinski Park Lahinja; Plut, D., Ed.; Znanstvena Založba Filozofske Fakultete: Ljubljana, Slovenia, 2008; pp. 9–24. [Google Scholar]
  54. Program Jamarske Šole. Jamarski Klub Novo Mesto: Novo Mesto, Slovenia. Available online: http://www.jknm.si/si/izobrazevanje/program/ (accessed on 12 April 2016).
  55. Križnik, K.; Purkat, N. Učni Načrt. Geografija: Gimnazija: Splošna, Klasična, Ekonomska Gimnazija; Ministrstvo za Šolstvo in Šport; Zavod RS za Šolstvo: Ljubljana, Slovenia, 2008. Available online: http://www.mss.gov.si/fileadmin/mss.gov.si/pageuploads/podrocje/ss/programi/2008/Gimnazije/UN_GEOGRAFIJA_gimn.pdf (accessed on 1 August 2016).
  56. Štrukelj, A. UČNI Načrt. Program. Osnovna Šola. Geografija; Ministrstvo za Šolstvo in Šport, Zavod RS za Šolstvo: Ljubljana, Slovenia, 2011. Available online: http://www.mss.gov.si/fileadmin/mss.gov.si/pageuploads/podrocje/os/devetletka/predmeti_obvezni/Geografija_obvezni.pdf (accessed on 1 August 2016).
  57. Kogovšek, J.; Petrič, M. Ogroženost kraškega sveta. In Nesreče in Varstvo Pred Njimi; Ušeničnik, B., Ed.; Uprava RS za Zaščito in Reševanje, Ministrstvo za Obrambo: Ljubljana, Slovenia, 2002; pp. 170–183. [Google Scholar]
  58. Hladnik, D. Spatial structure of disturbed landscapes in Slovenia. Ecol. Eng. 2005, 24, 17–27. [Google Scholar] [CrossRef]
  59. Paudel, S.; Yuan, F. Assessing landscape changes and dynamics using patch analysis and GIS modeling. Int. J. Appl. Earth Obs. Geoinf. 2012, 16, 66–76. [Google Scholar] [CrossRef]
  60. Swetnam, R. Rural land use in England and Wales between 1930 and 1988: Mapping trajectories of change with a high resolution spatio-temporal dataset. Landsc. Urban Plan. 2007, 81, 91–103. [Google Scholar] [CrossRef]
  61. Černe, A. Regional development perspectives of Slovenia. Dela 2003, 19, 107–121. [Google Scholar] [CrossRef] [Green Version]
  62. Ravbar, M. Razvojni Dejavniki v Sloveniji Ustvarjalnost in Naložbe; Založba ZRC: Ljubljana, Slovenia, 2009. [Google Scholar]
  63. Dissart, J.-C. Landscapes and regional development: What are the Links? Cah. D’economie Sociol. Rural. 2007, 84, 61–91. [Google Scholar]
  64. Deller, S.C.; Tsai, T.-H.; Marcouiller, D.W.; English, D.B.K. The role of amenities and quality of life in rural economic growth. Am. J. Agric. Econ. 2001, 83, 352–365. [Google Scholar] [CrossRef]
  65. Calò, F.; Parise, M. Evaluating the Human Disturbance to Karst Environments in Southern Italy. Acta Carsologica 2006, 35, 47–56. [Google Scholar] [CrossRef] [Green Version]
  66. North, L.A. Application and Refinement of the Karst Disturbance Index in West Central, Florida. Master’s Thesis, University of South Florida, Tampa, FL, USA, 2007. [Google Scholar]
  67. Prelovšek, M.; Zupan Hajna, N. Pressures and Protection of the Underground Karst—Cases from Slovenia and Croatia; Inštitut za Raziskovanje Krasa ZRC SAZU: Postojna, Slovenia, 2011. [Google Scholar]
  68. Perko, D. The Regionalization of Slovenia. Geogr. Zb. 1998, 38, 12–57. [Google Scholar]
  69. Adamič, M.; Plut, D.; Kambič, A.; Kambič, M.; Štukelj, P. Strategija Razvoja Občine Semič do Leta 2020; Občina Semič: Semič, Slovenia, 2012. [Google Scholar]
  70. Nared, J.; Bole, D.; Breg Valjavec, M.; Ciglič, R.; Goluža, M.; Kozina, J.; Razpotnik Visković, N.; Repolusk, P.; Rus, P.; Tiran, J.; et al. Central Settlemens in Slovenia in 2016. Acta Geogr. Slov. 2017, 57, 57–73. [Google Scholar] [CrossRef] [Green Version]
  71. Kaltenborn, B.P.; Bjerke, T. Associations between environmental value orientations and landscape preferences. Landsc. Urban Plan. 2002, 59, 1–11. [Google Scholar] [CrossRef]
  72. Keller, J.W. The Importance of Rural Development in the 21st Century—Persistence, Sustainability, and Futures. Future Aust. Ctry. Towns 2001, 19–31. [Google Scholar]
  73. Bisht, I.S.; Rana, J.C.; Pal Ahlawat, S. The Future of Smallholder Farming in India: Some Sustainability Considerations. Sustainability 2020, 12, 3751. [Google Scholar] [CrossRef]
  74. Kneafsey, M.; Venn, L.; Schmutz, U.; Balázs, B.; Trenchard, L.; Eyden-Wood, T.; Bos, E.; Sutton, G.; Blackett, M. Short Food Supply Chains and Local Food Systems in the EU. A State of Play of their Socio-Economic Characteristics; European Commission—JRC: Luxembourg, 2013. [Google Scholar]
  75. Palomo, I.; Martín-López, B.; López-Santiago, C.; Montes, C. Participatory scenario planning for protected areas management under the ecosystem services framework: The doñana social-ecological system in southwestern Spain. Ecol. Soc. 2011, 16, 23. [Google Scholar] [CrossRef] [Green Version]
  76. Plut, D.; Brečko Grubar, V. Hidrogeografske značilnosti Lahinje in Krajinskega parka Lahinja [Hydrogeographical characteristics of Lahinja and Lahinja Landscape Park]. In Bela Krajina in Krajinski Park Lahinja; Znanstvena Založba Filozofske Fakultete: Ljubljana, Slovenia, 2008. [Google Scholar]
  77. Lampič, B.; Mrak, I.; Plut, D. Geographical Identification of Development Potential for the Sustainable Development of Protected Areas in Slovenia. Hrvat. Geogr. Glas. 2011, 73, 49–65. [Google Scholar] [CrossRef] [Green Version]
  78. Ruban, D. Karst as Important Resource for Geopark-Based Tourism: Current State and Biases. Resources 2018, 7, 82. [Google Scholar] [CrossRef] [Green Version]
  79. Kukovič, S.; Haček, M. Cross-Border Cooperation as a Tool of Escaping Crisis Conditions in Slovenia. Transylv. Rev. Adm. Sci. 2018, 53, 54–66. [Google Scholar] [CrossRef]
  80. Pokolpje Poslovna Priložnost [Pokolpje Business Opportunity]. Available online: https://www.pokolpje.si/ (accessed on 5 May 2017).
  81. Ribeiro, D.; Šmid Hribar, M. Assessment of land-use changes and their impacts on ecosystem services in two Slovenian rural landscapes. Acta Geogr. Slov. 2019, 59, 143–159. [Google Scholar] [CrossRef] [Green Version]
Figure 1. Geographical location of the study region and its three municipalities (Črnomelj, Metlika and Semič).
Sustainability 13 01655 g001
Figure 2. Prominence of words most frequently mentioned in relation to features of the Bela krajina landscape that distinguish it from other landscapes.
Sustainability 13 01655 g002
Table 1. List of all questions from the interviews and target stakeholders to whom the questions were directed.
QuestionsFarmersResident
Non-Farmers
Professionals of
Nature Protection
Tourism
Professionals
Representatives of
Local Governments
1. What does the landscape provide you with?
2. What makes this landscape attractive?
3. Does the landscape contribute to your well-being? How?
4. What are the characteristics of this landscape that distinguish this place from other landscapes?
5. Has the landscape changed from the past until now? Has it changed for better or worse, how and why?
6. What are the main factors that influence landscape change?
7. What role do you play in landscape management?
8. What do you consider to be a valuable landscape?
9. Do you think that agricultural activities affect the appearance of this landscape?
10. Do you recognise the overgrowth of the agricultural
landscape?
11. Do the karst features of the landscape influence your activities?
12. Do you think that the karst characteristics of this landscape influence local development?
13. Do you think that nature protection influences your activities?
14. Do you think that nature protection influences local
development?
15. In your opinion is this landscape developed? Why?
16. What is the goal of the regional development process?
17. What problems have you encountered in reaching this goal?
18. Do you think that it is important to involve local stakeholders in decision-making processes on landscape management?
19. Are local stakeholders involved in the decision-making
processes on landscape practices or management? How?
20. Do you see the increase in self-sufficiency in food as an employment opportunity for rural development?
21. How do you see this landscape in 2030?
Table 2. Karst Disturbance Index ranking for the three municipalities.
CategoryAttributeIndicatorČrnomeljMetlikaSemič
GeomorphologySurface landformsQuarrying/mining312
Surface flooding000
Stormwater drainage121
Infilling caves111
Illegal waste dumping112
SoilsSoil erosion223
Compaction due to livestock or
humans
111
Subsurface karstSubsurface flooding000
Cave formation removal or
vandalism
111
Mineral and sediment removal010
Floor sediment Compaction—
destruction
000
AtmosphereAir qualityDesiccation000
Human-induced condensation,
corrosion
000
HydrologyWater quality (Surface practices)Pesticides and herbicides211
Industrial and petroleum spills or dumping223
Water quality (springs)Occurrence of algal blooms000
Water quantityChanges in water table LDLDLD
Changes in cave drip watersLDLDLD
BiotaVegetation disturbanceVegetation removal000
Subsurface biota, caveSpecies richness in cavesLDLDLD
Population density in cavesLDLDLD
Subsurface biota, ground waterGroundwater species richnessLDLDLD
Groundwater population densityLDLDLD
CulturalHuman artefactsDestruction/removal of historical
artefacts
200
Stewardship of Bela
krajina
Regulatory protection111
Enforcement of regulations222
Public education111
Building infrastructureBuilding of roads111
Building on karst features 222
Construction within caves000
Table 3. Classification of karst disturbance for the three municipalities.
MunicipalityRatingDegree of Disturbance
Črnomelj0.26Low disturbance
Metlika0.22Low disturbance
Semič0.22Low disturbance
Table 4. Values attributed to the economic indicators for the three municipalities and average for the study region.
ThemeIndicatorČrnomeljMetlikaSemičBela Krajina
WelfarePurchasing power per capita (€)=+6906.7
Added value per employee (€)+31,165.7
Average annual gross salary per employee (€)+1276.9
Gross investment in new fixed assets per 1000 inhabitants (in 1000 €)++5705.6
Labour marketJob density (number of jobs per 1000
inhabitants)
=+357.3
Location divergence++88.6
Registered unemployment rate (%)++17.6
Proportion of population with service
occupations, by place of residence (%)
++45.1
Proportion of population with tertiary
education (%)
+=9.5
Traffic-geographical
accessibility
Average travel time by car to the nearest
accessible regional centre (minutes)
++32
Average travel time by car to the nearest
accessible motorway or highway connection (minutes)
=+29
Proportion of population living within a
radius of 0.5 km from the nearest public transport stop (%)
+71.6
Table 5. Values attributed to the environmental indicators for the three municipalities and average for the study region.
ThemeIndicatorČrnomeljMetlikaSemičBela Krajina
AgricultureOrganically farmed land (%)+18.1
Wooded areas (m2/capita)+22,077.2
Intensively farmed land (cropland/grassland)+0.70
Infrastructure/
technology
Built-up areas (%)++3.8
Housing with district heating (%)++8.3
Road freight transport growth index/ *///
Motorisation rate (cars/100 people)+=52
LivestockLivestock density index (LSU/ha)+=0.54
Protected areasNatura 2000 sites (%)++43.4
Average expenditure on
environmental protection
(% GDP)
////
Management of
natural resources
Water consumption (m3/capita)////
Treated wastewater (m3/capita)////
Air quality (monitoring parameters)////
Municipal waste (kg/capita)+=378.7
* Lack of data.
Table 6. Values attributed to the social indicators for the three municipalities and average for the study region.
ThemeIndicatorČrnomeljMetlikaSemičBela Krajina
Demographic strengthPopulation density (people/km2)+48.6
Ageing index+126.4
Natality (births per 1000 inhabitants)=+9.4
Population growth (population index
between 2010 and 2015)
=+=99.0
Migration balance (%)+–3.4
Proportion of economically
active population among
inhabitants, by place of
residence (%)
=+38.6
Social
situation
Proportion of population which receives
social assistance (number of recipients/1000 people)
+37.3
Number of associations per 1000 inhabitants=+13.5
Table 7. Sustainable development in the three municipalities.
Domain of Sustainable DevelopmentČrnomeljMetlikaSemič
Economic−2+2+2
Environmental+1−3+3
Social−6−2+1
Total score (sum)−7−3+6
Table 8. Model matrix of possible landscape types reflecting their population retention capacity.
Economic ValueEnvironmental ValueSocial ValueLandscape TypePopulation
Retention
Capacity
LowLowLowDegraded landscapeLow population
retention capacity.
LowHighLowNatural landscape/
LowHighHighTraditional landscape with extensive agriculture and little industry. Agriculture is not retreating to a great extent but farms are extensively managed. This results in a traditional agricultural landscape.Low population
retention in the
long-term due to low profitability.
LowMedium/HighMediumAbandoned rural landscape characterised by a marked ageing of the population and a particularly sharp decline in agriculture, largely due to the poor transport infrastructure in these areas. These areas are at risk of depopulation.Low population
retention in the
long-term due to low profitability,
depopulation and land abandonment.
MediumHighHighMultifunctional cultural landscapeStrong ability to retain long-term population.
MediumHighMediumValuable natural and cultural landscape; landscape is preserved by
agricultural subsidies and tourism
Ability to retain
population through subsidies and tourism income.
HighLowHighIntensive agricultural (or industrial) landscapeLow population retention in the long-term due to consumption of environmental goods.
Table 9. Placing the three municipalities in the model scenarios.
ČrnomeljMetlikaSemič
Economic valueLowMedium-highHigh
Environmental valueHighLowHigh
Social valueLowMediumMedium
Landscape typeNatural landscapeIntensive agricultural landscapeValuable natural and cultural landscape
Table 10. Plausible future scenarios for Bela krajina.
Scenario 1Scenario 2Scenario 3
The first scenario is based on the interpretation of the current situation of the Črnomelj municipality and assumes that the current situation will continue in the future, so that the landscapes of Bela krajina will become completely overgrown as a result of the poor demographic structure (depopulation, ageing population). The abandonment of agricultural land will continue and forests will expand regardless of agricultural potential. This scenario is likely to lead to a loss of cultural landscape.The second scenario is based on the situation of Metlika municipality, which predicts that industry will grow on the account of nature and that built-up areas and infrastructure will expand. This will lead to an increase in job opportunities, migration will decrease and karst systems will be more affected. Agricultural activities will be more intensive, and an increase in the number of agricultural holdings and a decrease in the number of farms will take place. This scenario leads to unsustainable development of the study region.The third scenario is based on the interpretation of the Semič municipality and assumes that agricultural land will be more or less preserved due to financial incentives, especially through the promotion of organic farming. The overgrowth process will stabilise. The number of small enterprises will increase, as will the creation of new jobs. Tourism will develop. Population growth will increase slightly.
Publisher’s Note: MDPI stays neutral with regard to jurisdictional claims in published maps and institutional affiliations.

