Abstract
The acceleration of the development of the Metropolitan Mamminasata area has an impact on the socio-economic dynamics of the community and the use of excess energy resources. The purpose of this study was to analyze (1) economic growth and energy security work as determinants of urban development for Metropolitan Mamminasata, (2) the effect of economic growth, energy consumption, availability of transportation infrastructure, and renewable energy on the quality of the environment and the sustainability of the Metropolitan Mamminasata system, and (3) renewable energy management strategies and sustainable urban development for Metropolitan Mamminasata. An explanatory sequential approach was used. Data were obtained through observation, surveys, and documentation. The results showed that renewable energy which has the potential to used, in the Mamminasata Metropolitan urban area to support economic growth and increase urban productivity, namely water energy, wind energy, and biomass energy. Furthermore, it takes the effectiveness and efficiency of energy users toward improving environmental quality. Economic growth, energy consumption savings, the availability of transportation infrastructure, and renewable energy have a significant effect on environmental quality, with a determination coefficient of 82.3%, and the sustainability of the Metropolitan Mamminasata system, with a determination coefficient of 75.7%. Use of renewable energy in the management of urban development will require support from government policies, as well as community and business participation. This study recommends a renewable energy management strategy as an important part of supporting the sustainability of urban development in Metropolitan Mamminasata, Indonesia.
1. Introduction
Development policies that are oriented toward economic growth contribute to regional income and regional growth. The dependence of the global economy and society on the use of natural resources provides an opportunity to shape and apply the principles of an inclusive economy toward sustainable development, which has become a world agreement to promote equitable and equitable regional economic growth [1]. Economic growth contributes to the progress of the region, but has an impact on economic inequality, environment deterioration, and excessive energy consumption. In particular, global warming worldwide, triggered by massive emissions of greenhouse gases, is now one of the major problems facing humanity due to an increase in pollutants originating from fossil energy [2,3]. Energy security as part of the availability of natural resources is basically oriented toward continuity, affordable prices, and sustainability in terms of use. Energy security is closely related to the distribution of services and the market segments served [4].
The world population is projected to increase by 1.3 billion by 2030, to a total of 8.3 billion; at the same time, total world GDP, compared to 2011, is predicted to double. The integration of renewable energy sources with conventional networks while meeting the energy needs for the various development activities engaged in currently is a challenge [5]. World energy consumption grows by an average of 1.6% per year and will increase by 36% by 2030. This means that an adequate and affordable energy supply for the needs of these various development activities is imperative to support economic growth and sustainable development. The Sustainable Energy for All (SE4All) Initiative, initiated by the United Nations, designated 2014–2024 as the Decade of Sustainable Energy for All in 2011. The Forum initiated the achievement of Goal 7 of the 17 Goals set out in the SDGs, namely to ensure access to affordable, reliable, sustainable, and modern energy for all [6]. The strategic targets to be achieved through the forum include (1) universal access to electricity, fuel, and clean technology for cooking, (2) an increased share of renewable energy in the world energy distribution, and (3) a doubled rate of improvement in world energy efficiency. Energy is very important for economic progress however the increasing population causes the demand for energy needs to continue to increase on the one hand, and on the other hand, limited resources and rising energy prices have a positive contribution to decreasing environmental quality and sustaining economic growth [7].
Energy consumption has drastically decreased due to the COVID-19 pandemic that has been experienced throughout the world since January 2020 [8]. World energy demand in the first quarter of 2020 fell by 3.8% compared to the first quarter of 2019, then decreased by 6% in the second quarter of 2020 [9]. Furthermore, in order to break the chain of spreading the COVID-19 virus, several countries then implemented total social restrictions (lockdown) and some chose to carry out partial restrictions, including Indonesia deciding to implement large-scale social restriction policies. The impact of large-scale lockdowns and social restrictions is one of the factors that has caused demand for the energy sector to decline. The industrial sector has reduced production, office activities have drastically reduced, and transportation, both private and mass transportation, is also in the same position.
Countries that impose full lockdown regulations have experienced a higher energy demand decline compared to countries with partial lockdown regulations. The report from the International Energy Agency [10], states that the decrease in demand for energy needs has decreased by 25% for countries implementing a full lockdown and 18% for countries with a partial lockdown. The reduction in the amount of demand for oil is one of the factors causing the decline in oil prices. This condition occurs due to the fixed amount of supply but the lack of clarity on sales. On the other hand, oil producers require additional costs to store excess production and maintain the sustainability of their companies. In 2020, as many as 100 companies in the world have cut more than US $ 85 billion for the oil and gas sector [11]. The Covid-19 pandemic represents the biggest shock to the global energy system in more than seven decades, with the drop in demand this year set to dwarf the impact of the 2008 financial crisis and result in a record annual decline in carbon emissions of almost 8% [10].
Indonesia is the largest country in energy consumption in Southeast Asia. Until the end of 2019, energy consumption in Indonesia had reached 44% of the total energy demand in the Southeast Asia region, with Malaysia in second place at 23% and Thailand in third place at 20%. Energy plays an important role in generating economic activities [11]. Demand for fossil energy in Southeast Asia is projected to reach 80% by 2030, compared with 76% in 2020. The industrial sector continues to dominate the demand for fossil energy, with an average increase of 2.7% per year until 2035 [12]. This figure confirms that energy security is important to support regional growth. Thus, a strategy is needed to support the process of producing goods and services toward regional economic growth and meeting community needs. Energy security will require a more stable financial system and government [13].
Energy demand in Indonesia until the end of 2035 is predicted to grow at an average rate of 5.6% per year. Demand for energy is attributed to the industry (49%), transportation (29%), household (15%), commercial (4%), agriculture, construction, and mining (3%) sectors [14]. Thus, energy demand to support regional economic growth will require considerable investment in energy security and supply factors. Global warming has a direct influence on the security of energy supplies and rising energy prices [15]. Estimated investment needs for energy infrastructure development in Indonesia in 2035 include: (1) investment in power plants an average of US $ 10 billion per year, (2) additional oil refinery capacity of around US $ 16 billion, (3) investment in material refineries liquid coal raw material of up to US $ 33 billion, (4) investment of 11.2 trillion in biofuel refineries, and (5) investment in the construction of a liquefied natural gas receiving terminal worth US $ 8 billion. Thus, the energy sector will need investment policy support from the government and investors. The Government of Indonesia has formulated and implemented several strategic programs, compiled under several binding frameworks, i.e., the National Energy Policy and the General Plan for National Energy [16].
Energy consumption in the Metropolitan Mamminasata area has a tendency to increase with an average growth of 12.8% per year of the total energy demand of the South Sulawesi Province during the 2012–2019 period. The amount of primary energy production used is smaller compared to the amount of final energy used. Primary energy demand in 2019 increased by 1929 thousand BOE: domestic needs amounted to 4998 thousand BOE, natural gas energy amounted to 1493 thousand BOE, solar energy amounted to two thousand BOE, and water energy amounted to 1503 thousand BOE. Imports or supplies from outside South Sulawesi amounted to 11,299 thousand BOE. The population growth, industrialization, and modernization of urban development have resulted in a fairly, high increase in energy demand. Expansion and energy security scenarios focus on increasing the capacity of energy generation and, where possible, adopting cleaner and greener energy in the development process [17,18]. The industrial revolution and consumption of fossil fuels increase levels of carbon dioxide (CO2) emissions and global warming [19,20].
The distribution and fulfillment of energy needs in the Metropolitan Mamminasata area still shows inequality. Of the total energy consumption of South Sulawesi, the largest energy consumption is dominated by Makassar City at 40%, followed by Gowa Regency with 25%, Maros Regency at 20%, and Takalar Regency at 15%. This illustrates that the availability of energy infrastructure in the Metropolitan Mamminasata area, for liquefied natural gas (LNG) Plants, fueling stations for transportation, and the development of gas pipelines for household and industrial consumption, is still limited. Another factor that causes disparity in the distribution of energy services in the Metropolitan Mamminasata area is the result of regional infrastructure systems that are not yet integrated with reserve locations, transportation routes, and service areas. The distribution of energy demand is highly dependent on load factors, location characteristics, industrial performance, commodity prices, and transportation routes [18,21]. The main challenge in the development of energy infrastructure in the Metropolitan Mamminasata area is that, apart from regulatory uncertainty, it is also necessary to organize and improve the business climate. The energy transition requires action from multiple levels of government [22].
The results of research that support this study include the following: (1) A study conducted by Vandevyvere, H and Stremke, S [23] examined urban planning for the future of renewable energy requires collaboration of various disciplines both in research and practice. The results of the study indicated that environmental assessment must be carried out complemented by socio-cultural, economic, juridical, aesthetic, and socio-cultural aspects that characterize the planning or decision-making process. Apart from that, practical designs that can help develop a viable built environment based on renewable energy sources. (2) Drysdale, D, et al., [24], the focus of this study is to examine From Carbon Calculators to Energy System Analysis in Cities. The study results illustrate that the energy system can be assessed using an analysis tool with various main sustainability factors for a smart energy system for sustainable use of renewable energy and its application in strategic energy planning. (3) A study conducted by Delponte, I and Schenone, C, [25] examined environmental degradation, depletion of fossil fuels, and regional imbalances caused by a centralized energy model that requires changes in the energy structure, establishes actions to invest in energy diversification, and a strong commitment to local renewable energy. The results of this study illustrate that the problems of energy supply and technology implementation, as well as the social development process toward improving the quality of life of citizens are important in the urban planning process. The three results of the study provide an understanding that the use of renewable energy through energy diversification will encourage the improvement of the quality of the urban environment and increase the quality of life of the people and become an important part of the urban planning process. Furthermore, this study is more directed at examining economic growth and optimization of the energy system through the use, of renewable energy toward sustainable urban development.
Energy security and optimization of energy systems is very important in supporting the sustainable development of the Mamminasata Metropolitan area. Thus, the focus of this study is aimed at answering the following research questions: (1) How do economic growth and energy security work as determinants of urban development in the Metropolitan Mamminasata area? (2) What is the effect of economic growth, energy consumption, availability of transportation infrastructure, and renewable energy on the quality of the environment and the sustainability of the Metropolitan Mamminasata system? (3) What kind of renewable energy management strategy toward the sustainable urban development of Metropolitan Mamminasata would be feasible?
2. Conceptual Framework
The use of renewable energy in ensuring the sustainability of urban development is important to maintain energy stability and security in the development of the Metropolitan Mamminasata system. Renewable energy will support urban growth in a sustainable manner and the welfare of the growing population [26]. Furthermore, the development of the Mamminasata Metropolitan urban area has a direct relationship with the fulfillment of the distribution of energy services based on the service range of developing city activities, i.e., the distribution of energy services refers to urban service activities based on developing land use and spatial functions [27]. The urban system will affect the service distribution system and energy security and cause environmental degradation. The resilience of cities in relation to energy refers to the ability of cities to manage the distribution of energy services in a sustainable manner [28]. Thus, the distribution pattern of settlements and urban service centers will be directly related to the pattern and distribution of the energy network system services being developed. Urban settlements that develop and tend to differ based on location in line with the increase in population will have an impact on differences in the distribution of energy services [29]. The conceptual framework of this study is presented in Figure 1.

Figure 1.
Conceptual framework for economic evaluation, use of renewable energy, and sustainable urban development Mamminasata Metropolitan. Source: Author’s elaboration.
2.1. Review Theory
The economic growth of the Metropolitan Mamminasata area is directly related to changes in the economic conditions of South Sulawesi and requires the urban system to be integrated with national strategic areas in Indonesia [30]. Therefore, the economic growth of the Metropolitan Mamminasata area implies that the inter-city relationships are a unitary regional development system. Optimizing the use of natural resources without developing human resources contributes to economic growth toward accelerated economic development [31]. Good urban governance and sustainable development are closely interlinked. As such, urban resilience is viewed as an important outcome of good urban governance [32]. The economic perspective conceptualized by Harris [33] and Salvadori [34] states that there are four factors that affect economic growth: (i) population, (ii) total stock of capital goods, (iii) land area and natural resources, and (iv) technological progress. Several factors influence economic growth: (a) advances in science and technology, (b) increased investment, (c) increased exports, (d) increased income from taxes, (e) controlled inflation rates, and (f) low interest rates. Thus, economic growth that tends to increase contributes to energy demand. Thus, there is a symmetrical relationship between electricity consumption, economic growth, and carbon emissions in the short and long term [35]. Furthermore, to support energy management and use of renewable energy, it will require support for the use of technology through optimizing the use of potential human resources (HR). This means that human resources, in terms of abilities, expertise, and skills, are very crucial in relation to the use of renewable energy. These experts in the field of renewable energy will carry out technological innovations so that equipment prices can be reached by the community, carry out maintenance on the investment applied, so that they become the driving force for companies in the provision of supporting tools for renewable energy. The ability, knowledge, and skills of human resources are an important part of supporting energy resource management and use of renewable energy [36,37].
Fulfilling energy needs to support urban development is directly linked to regional natural resource potentials. Energy strategy is a consideration in urban development for the implementation of energy policies that meet the needs of public services [38,39]. In the context of the development of the Metropolitan Mamminasata area, the energy sector plays an important role in realizing national resilience [40,41]. Thus, the objective of energy policies in the context of regional and urban development is to achieve energy independence and resilience toward sustainable development.
The energy security in the Mamminasata Metropolitan urban area in relation to the distribution of energy services is very important to pay attention to the preservation of natural resources and the carrying capacity of the environment. Sustainable ecosystems are considered a goal of society, so it is important to maintain the diversity of environmental characteristics when using renewable energy resources [42,43,44]. There are problems faced in the distribution and services of energy in this urban area. (1) There is an inadequate use of domestic energy due to the limited availability of regional infrastructure, (2) The added value of the economy from the renewable energy sector has not been optimized. (3) Energy resources have not become the basic capital in urban area development as a unit. These three factors have an impact on the disparities in energy services in the development of the Metropolitan Mamminasata area. Reducing industrial and household energy consumption, followed by renewable energy use, must be a priority for government policy [45].
Energy resources are part of the strategic economic sector in supporting regional and equitable development [46]. To facilitate the sustainable use of energy resources, various strategies and programs are needed [47]. Thus, energy resources have the potential to become a source of investment, supply industrial raw materials, fulfill the transportation sector’s fuel needs, and drive regional economic growth. One of the most effective ways to achieve sustainability targets, toward the use of renewable energy, is to reduce energy consumption [48,49]. The scarcity of non-renewable energy resources and the increasing demand require the use of renewable energy. Biomass resources have traditionally been used, and their use is becoming increasingly important because of their economic potential as a renewable energy source [27].
The decline in energy production in Indonesia is influenced by several factors, namely the volatility of oil and gas prices, less-than-optimal exploration of potential energy sources, and a lengthy licensing process. The industrial sector that explores fossil energy has not experienced significant development in Indonesia. This condition is influenced by the low interest of contractors to explore new energy sources due to regulatory instability, an uncertain investment climate, and fluctuations in energy prices on world markets [50]. Several factors influence scarcity in the distribution of energy services, including geographic location, limited infrastructure, and high energy prices. Factors such as greenhouse gases, gas emissions, gross domestic product, population, and workforce growth have a positive relationship with primary energy consumption [51]. Thus, dependence on imports, especially fuel oil and gas, needs to be addressed to meet the needs and distribution patterns of energy services. The distribution pattern of energy services for the development of new residential locations is also very important to consider [52]. Thus, in order, to reduce energy consumption, there are important factors that need to be considered, including energy distribution as well as socio-economic and demographic factors [53,54].
Demand for fuel energy in the Metropolitan Mamminasata area tends to increase every year, but the amount of production tends to decrease due to a limited supply, which has an impact on service disparities in relation to the existence of developing residential locations. The limited supply of energy has an impact on the high price of energy. Depleting fossil fuels, climate change, and energy security issues are prompting transformations in energy strategies worldwide [55]. The energy transition needs to adapt to the energy supply, especially to manage local peak loads and the entry of prosumer energy due to the, fact that most of the renewable energy has not been optimized in a sustainable manner [56]. Thus, the use and distribution of energy services in the Metropolitan Mamminasata area tend to be inefficient and ineffective because the infrastructure system is not yet optimal and the use of renewable energy is still limited due to price policies, constraints on land acquisition, and spatial planning. Therefore, subsidy and incentive programs are aimed at promoting the use of low-impact renewables and establishing mitigation obligations that raise costs for projects that have land impacts and increase public support for the use of renewable energy [57,58].
2.2. Energy Security and Urban System Sustainability
The population of the Metropolitan Mamminasata area tends to increase, and the scarcity of energy supplies causes ineffectiveness in economic enterprises in the private sector and the community. Inclusiveness, investment in infrastructure, effective decentralization, and financial inclusion were considered potential solutions [59,60]. Energy security requires the continuous availability of energy resources at prices affordable to the community [61]. Indicators are used to assess the energy security of a country or region, i.e., whether it has an energy supply that can last for 90 days, particularly in the oil category. Thus, government policy support is important for responding to and ensuring the transition to renewable energy to optimize the use of natural resources. The energy transition toward sustainable systems has prompted energy systems to shift from being fossil-fuel-based to being renewable [62,63,64]. Energy security is considered important to encourage increased production of goods and services and thus increased regional economic productivity. Thus, decisions in the field of energy security have consequences that can be positive, negative, or neutral [61]. All forms of disruption, therefore that hamper the availability of energy supplies, especially primary fuels (fuel oil, gas, and coal) and disturbed electrical energy, will decrease regional economic productivity. Five important aspects that need to be improved and considered to support energy availability and services, namely the availability of energy reserves, costs, environment, health, and labor [65]. Energy sources are the driving force for the progress of social and economic development, while energy security plays a strategic role in national resilience [66].
The availability and supply of energy that is in balance with consumption needs will lead to efficient and sustainable development. Production sites will increase energy efficiency and save costs by reducing gas emissions [67]. Energy security is very important to consider operational risks in relation to supporting infrastructure reliability [68]. This means that risk management is an important element in the energy supply chain between producers and consumers. Thus, energy security entails diversification, optimization, and stopping the supply of fuel oil. Diversification improves energy distribution if potential available energy reserves are considered. The energy subsidy policy through infrastructure preparation and renewable energy investment is aimed at reducing the intensity of fossil energy use and the resulting emissions, while energy diversification is aimed at reducing the use of fossil energy through the use, of renewable energy to increase economic growth [69,70,71].
The sustainable provision and distribution of energy services in the Mamminasata Metropolitan urban area will require several government policy actions, among others: (1) strategic zoning based on location to facilitate the distribution of energy services, (2) determining energy service centers based on distance, ease of accessibility, and benefit, (3) distribution of energy services refers to the hierarchy of service centers that have developed, and (4) prioritizing renewable energy services. Thus, energy security can be achieved with a system that is safe, sustainable, competitive, and affordable [72,73].
The development of the Metropolitan Mamminasata area, which is dominant in the concentration of socio-economic activities, has a direct impact on the distribution pattern of energy demand. This condition is marked by service centers for trade, industry, health facilities, and higher education. Large metropolitan cities have, a tendency to develop in all areas, and their spatial zoning gradually spreads out in all directions in a multi-layered circle, with the central area of activity as its core [74,75]. The development of new areas within a city gradually reproduces the characteristics of the other sectors due to similarities in land rent, transportation, communication, and other aspects [76,77]. The adaptation of the conceptualization of Burges and Hoyt’s theory, in relation to the dynamics of urban development, Metropolitan Mamminasata illustrates that in supporting the distribution of energy demand services, it will be directly related to spatial patterns, land values, transportation systems, and environmental characteristics.
3. Material and Method
This study uses an explanatory sequential approach. In this study, data was obtained through observation, surveys, and documentation. The study implementation strategy is divided into two stages: (i) quantitative data collection and analysis and (ii) qualitative data collection and analysis based on the initial results obtained in the quantitative study. This approach makes philosophical assumptions about the application of a qualitative-quantitative approach in a single study [78]. The sequential explanatory research design in this study is presented in Figure 2.
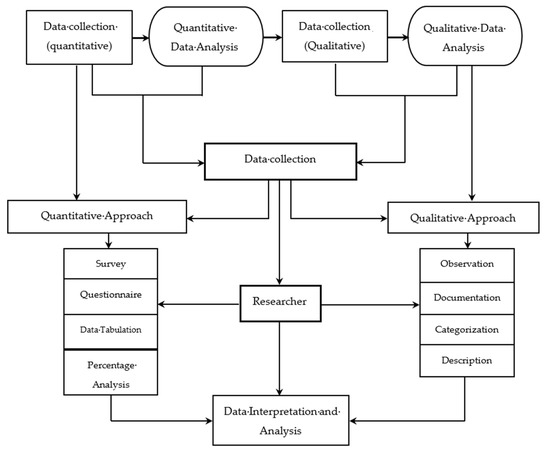
Figure 2.
Sequential explanatory research design. Source: Author’s elaboration.
Departing from the focus and purpose of this research it provides an illustration that the use of renewable energy has an urgent and strategic role to support the urban development of Metropolitan Mamminasata. Furthermore, this study is naturalistic and phenomenological. The research approach chosen in this study is a combination of sequential quantitative-qualitative approaches. Furthermore, the factors that trigger economic growth in the Mamminasata Metropolitan urban area include: (i) the population that continues to increase every year, (ii) an increase in industrial activities, trade, services, urban transportation, and community economic enterprises, and (iii) private consumption which tends to increase. These three things have an impact on increasing energy demand in the dynamics of the development of the Maminasata Metropolitan urban area. Thus, this study aims to analyze: (1) Economic growth and energy security as determinants of urban development in the Mamminasata Metropolitan Area. (2) The effect of economic growth, energy consumption, availability of transportation infrastructure, and renewable energy on improving environmental quality and sustainability of the Mamminasata Metropolitan urban system. (3) Renewable energy management strategy to support sustainable urban development in the Mamminasata Metropolitan urban area.
The case studies were selected in this study with the following considerations: (1) Optimizing the use of renewable energy resources to support the urban development of Metropolitan Mamminasata; (2) Use of non-renewable energy has an impact on decreasing the quality of the urban environment for Metropolitan Mamminasata; (3) Use of renewable energy is oriented toward optimizing the use of natural resources and economic growth toward the sustainability of the Mamminasata Metropolitan urban system.
3.1. Study Area
This study was carried out in the Metropolitan Mamminasata area, consisting of one main city and three supporting cities. (1) The urban area of Makassar City covers 15 sub-districts and has an area of 175,77 ha. (2) The urban area of Maros Regency includes the districts Maros Baru, Turikale, Marusu, Mandai, Moncongloe, Bontoa, Lau, Tanralili, Tompobulu, Bantimurung, Simbang, and Cenrana and has an area of 123,784 ha, (3) The urban area of Gowa Regency includes the districts Somba Opu, Bontomarannu, Pallangga, Bajeng, West Bajeng, Barombong, Manuju, Pattallassang, Parangloe, Bontonompo, and South Bontonompo and has an area of 68,648 ha, (4) The urban area of Takalar Regency includes the districts Mangarabombang, Mappakasunggu, Sanrobone, South Polombangkeng, Pattallassang, North Polombangkeng, South Galesong, Galesong, and North Galesong and has an area of 556,51 ha. Metropolitan Mamminasata’s urban growth is characterized by several dominant urban activities, i.e., (i) housing and settlements, covering an area of 6674 ha, (ii) industrial locations, covering an area of 622 ha, (iii) education, covering an area of 183 ha, and (iv) trade and services, covering an area of 308 ha. The sustainability of the Metropolitan Mamminasata system is directly related to the pattern and distribution of energy services. The population of the Metropolitan Mamminasata area is presented in Table 1, and the study locations are shown in Figure 3.

Table 1.
Population values for the Metropolitan Mamminasata area in 2019.
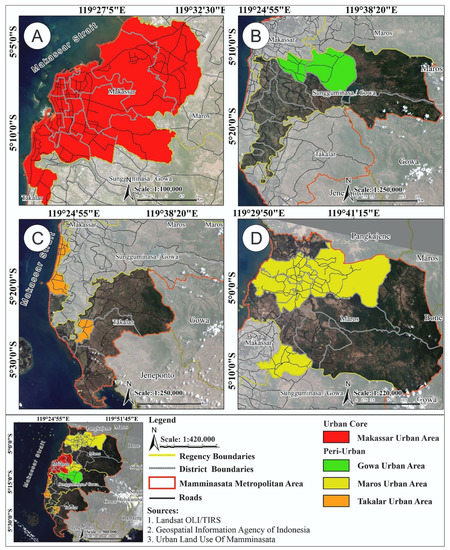
Figure 3.
Metropolitan Mamminasata: (A) Makassar City, (B) Urban of Gowa Regency (C) Urban of Takalar Regency, and (D) Urban of Maros Regency.
Table 1 confirms that total population has a direct relationship with the distribution of energy services in the Metropolitan Mamminasata area. An increasing population will increase the supply of energy. Urban activities that increase have an impact on the demand and supply of energy. An excessive use of energy will result in a scarcity of energy resources and a decrease in the quality of the urban environment of Metropolitan Mamminasata.
3.2. Method of Collecting Data
This study began with an identification stage. The identification results obtained were used as the basis for categorizing the data in terms of service patterns and the distribution of energy needs. The next step was to collect data on the characteristics, classification, and growth of the regional economic areas, and link that data to service levels and the distribution of energy needs. Data for each of the parameters used in this study are presented in Table 2.
Table 2.
Summary of research data and data collection methods.
Data collection in this study was obtained through field observations, surveys, and documentation. The measurement of energy distribution and services was assessed based on the following grouping of urban activities: (i) housing and settlement, (ii) trade and services, (iii) industry, (iv) education and health services, and (v) other urban socio-economic activities. Data grouping was based on the distance distribution of urban activities and then related to spatial zoning based on the Mamminasata Metropolitan spatial plan established by the government and developing conditions in the field.
3.2.1. Observation
The observations in this study used field notes, cameras, the Mamminasata Metropolitan urban base map, and checklists. The instrument is used to observe, types of activities that use energy, distribution of energy services, energy needs, types of renewable energy resources, and the availability of energy service infrastructure. The results of the data obtained through observation are used to describe economic growth and energy security as a determinant of the development of the Mamminasata Metropolitan urban area in a comprehensive manner. Furthermore, the data collected through observations in this study include: (i) types of socio-economic activities in the Mamminasata Metropolitan urban area that use energy, (ii) economic enterprises that require the use of renewable energy, (iii) accessibility and affordability of energy services, (iv) availability of energy service infrastructure, (v) energy consumption based on service scale, (v) potential renewable energy resources, (vi) urban environmental characteristics and conditions, (vii) renewable energy management, and (vi) hierarchy of Metropolitan Mamminasata urban centers. The results of the observations made are then linked to the theory according to the focus and study objectives to be achieved.
3.2.2. Questionnaire
The questionnaire in this study is used for two functions, namely: (1) Descriptive, namely efforts to optimize the use of the potential of renewable energy resources; and (2) Measurement, which refers to the characteristics of the data obtained in the field in relation to energy resources. The data obtained through questionnaires using ordinal scales, intervals, and ratios. Furthermore, the purpose of using the questionnaire is used to provide an overview of some of the characteristics of individuals, business actors and industry, as well as people who use energy resources in relation to the urban activity system Metropolitan Mamminasata. The questions submitted to respondents consisted of two categories, namely structured and unstructured based on predetermined guidelines. The use of a questionnaire in this study was used in data retrieval, among others; (a) the socio-economic conditions of the community, (b) the types of socio-economic activities that are developing, (c) the level of community income, (d) employment opportunities, (e) the role of community and government institutions, (f) marketing and distribution of energy services, (g) use of renewable energy potential, (h) energy availability, (i) energy needs, (j) public knowledge of renewable energy use, (k) energy infrastructure services, (l) land use, (m) environmental carrying capacity, and (n) energy service coverage.
Filling in the questionnaire in this study was not submitted by respondents, but was guided by the researcher. The selection of respondents was carried out by field workers who are enumerators. The enumerators were selected based on the following considerations: (i) residents located in the Mamminasata Metropolitan urban area who have the ability to collect data, (ii) understand the urban characteristics and the socio-economic situation of the community, and (iii) understand the situation and characteristics of the Mamminasata Metropolitan urban area. Furthermore, before carrying out their duties in the field, the enumerators were given instructions and practice in filling out the questionnaire and interviewing the respondents. The questionnaire was distributed to the Mamminasata Metropolitan urban area, covering; Makassar City urban area, Gowa Regency urban area, Maros Regency urban area, and Takalar Regency urban area. Furthermore, the criteria for actors who filled out the questionnaire (respondents), namely (i) people located in the Mamminasata Metropolitan urban area, (ii) industrial players and economic business activities, and (iii) local government.
3.2.3. Documentation
This study uses various documents related to economic growth and use of energy resources. The documents referred to include: (1) Data on population and economic growth for the Mamminasata Metropolitan, obtained through the Central Statistics Agency of South Sulawesi Province; (2) Types of industry, economic enterprises and actors related to energy use are obtained through the Mining and Energy Office of South Sulawesi Province; (3) The socio-economic profile of the community is obtained through the Government of Makassar City, Gowa Regency, Maros Regency, and Takalar Regency, and (4) the Mamminasata Metropolitan Urban Spatial Plan, obtained through the South Sulawesi Provincial Spatial Planning Office. The four documents are used to support the observation data and research questionnaires.
3.2.4. Research Respondents
Data grouping was done by comparing the results of field observations, surveys, and documentation data. Thus, the data in this study are divided into primary and secondary data. The qualitative data in this study used attributes and categorization, the aim was to facilitate measurement. Quantitative data was measured using an ordinal scale, i.e., intervals and ratios. Quantitative data is collected through respondents or research samples, in this case the research sample refers to the number of populations then the number of respondents who represent the population defined in this study is determined. The sample was determined using a simple random method, where samples are taken from members of the population randomly, without considering the strata in that population [80]. Each member of the population had an equal chance of being selected as a sample. Withdrawal of samples was based on Taherdoost, H, [81]. The formulations used in determining the sample are as follows:
where n is the required sample size, p is the percentage occurrence of state or condition, E is the percentage maximum error required, z is the value corresponding to level confidence required. Z is the statistical value corresponding to the level confidence is needed. The confidence level used was 95 percent (0.05: Z value equals 1.96) or 99 percent (0.01: Z = 2.57). The 95 percent confidence level implies that 95 out of 100 samples will have actual population values within the specified margin of error (E). The number of samples in this study was 450.
3.3. Data Analysis
The analytical methods are based on the research questions. The first question—how economic growth and energy security work as determinants of urban development for Metropolitan Mamminasata—involved (i) shift-share analysis, (ii) input-output analysis, (iii) per capita income analysis, (iv) scalogram analysis based on service centers, and (v) analysis of disparity in the urban area. Shift-share analysis uses the following formulations:
where Nij is the sector/subsector change in the Metropolitan Mamminasata area caused by the influence of economic growth in South Sulawesi, Mij is the change in sector/sub-sector Gross Regional Domestic Product (GRDP) i in the Metropolitan Mamminasata area due to the influence of sector i growth in South Sulawesi, Cij is the change in sector/subsector GRDP i in the Metropolitan Mamminasata area caused by the competitive advantage of sector i in the Metropolitan Mamminasata area, Eij is the GDP of sector/subsector i in the Metropolitan Mamminasata area in the early year, Ein is the GDP of sector/subsector i in the area of South Sulawesi, En is the total GRDP of South Sulawesi in the early year, Eij, t is the GRDP of sector/subsector i in the Metropolitan Mamminasata area, Ein, t is the GRDP sector/subsector i in South Sulawesi, En, and t is the total GRDP in South Sulawesi. If Mij + Cij > 0, then the growth of the i-th sector in the j-region is included in the progressive (advanced) group. If Mij + Cij < 0, the i-th sector in the j-region is included in the category slow growth. If Mij < 0, sector i in the Metropolitan Mamminasata area has a slow growth rate. If Mij > 0, sector i is growing fast, If Cij > 0, then sector i has high competitiveness compared to other areas. If Cij < 0, sector i has low competitiveness. If SNij > 0, the sectors studied have progressive growth. If SNij < 0, the sectors studied show growth that is not progressive.
Input-Output analysis was used to analyze the effect of the economic growth of the Metropolitan Mamminasata area on energy dependence. The results of the analysis obtained information about economic transactions and the interrelationships between units of economic activity. The formulations used in the Input-Output analysis are presented in Table 3 below.
where Xij is the number of outputs of sector i, used as the input of sector j, Fi is the final demand of sector i, Xi is the total output of sector i, and V represents household wages and salaries + business surplus + other primary inputs. I is an identity matrix whose elements contain 1 in one diagonal and 0 in the other, F is the final demand, X is the number of outputs, (I − A) is the Leontief matrix, and (I − A)−1 is the Leontief multiplying matrix. F (di) is the direct forward linkage of sector i, aij is the element of the technical matrix coefficient, and n is the number of sectors. B (di) is a direct backward linkage of sector i, aij is the element of the coefficient matrix, and n is the number of sectors. F (di + i) is the direct and indirect relationship to the forward sector i, aij is the inverse Leontief matrix of the open model, and n is the number of sectors. B (di + i) is the direct and indirect backward linkage of sector i, aij is the element of the open Leontief inverse matrix, and n is the number of sectors. Sdi is the distribution sensitivity of the sector i, aij is the Leontief matrix element, and n is the number of sectors. Pdi is the dispersion sensitivity, aij represents the Leontief matrix elements, and n is the number of sectors. Multiplier analysis was used to determine the impact of changes in endogenous variables, i.e., certain sectors, when there is a change in exogenous variables, i.e., the final demand. The multipliers of output and income are presented in Table 4 below.
Table 3.
Transactions in Input-Output analysis.
Table 4.
Multipliers of output and income.
aij is the coefficient of output, hi is the coefficient of household income, ei is the coefficient of labor, αij is the inverse Leontief matrix of the open model, and α*ij is the closed model Leontief inverse matrix. The per capita income analysis of the community is based on the following formulation:
where GRDP is the final expenditure component for sectors of economic activity, pk is the income received by each resident, and ∑p is the number of residents in, a given location. Scalogram analysis determined the distribution and hierarchy of energy service centers in relation to the Metropolitan Mamminasata system. The formulation used is as follows:
where C is the attribute weight of the function, x is the value of combined centrality, which is 100, and X is the number of attributes in the system. Regional development was assessed based on three important parameters: the availability of facilities and infrastructure, the distribution of energy services to housing, and the level of accessibility. The analytical formulations used are as follows.
where IPW is the regional development index, X1 … Xn is the urban development indicator (standardized), and α1 … n is the weight or coefficient of the regional development indicator, JPprs-p is the population within a standard radius of type i facilities and infrastructure, and JPrs is the number of residents within the radius of standard type i service facilities and infrastructure. Tij is the total accessibility from city i to city j, Pi is the resident of city i, Pj is the resident of city j, dij is the distance from area i to area j, b is the power of d, and F (Zi) is a function of Zi, where Z is a measure of the city’s attractiveness i. β is the connectivity index, e is the urban settlement unit in one area, and V is the number of transportation networks (roads) that connect urban settlement units.
To answer the questions of this study, namely the effect of economic growth, energy consumption savings, availability of transportation infrastructure, and renewable energy on environmental quality and sustainability of the Mamminasata Metropolitan system, multiple linear regression analysis is used. Multiple linear regression models involve more than one independent variable or predictor. The data scale in question is for all variables, especially the dependent variables, i.e., X1 (economic growth), X2 (energy consumption), X3 (transportation infrastructure), X4 (renewable energy), Y1 (environmental quality improvement), and Y2 (urban system sustainability). The model used is shown in Figure 4 below.
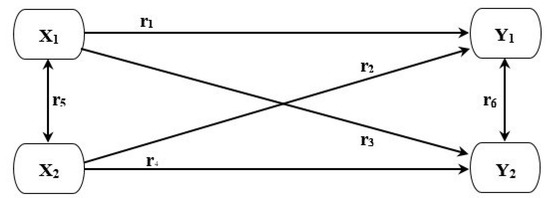
Figure 4.
Model of multiple regression.
The relationships between variables r1, r2, r3, r4, r5, and r6 were analyzed using simple correlation. The relationship between X1 together with X2 for Y1 and X1 and X2 together for Y2 can be analyzed by multiple correlation were analyzed using multiple correlations, and multiple regression models are used to analyze the effects of economic growth, energy consumption savings, the availability of transportation infrastructure, and renewable energy on environmental quality improvement and the sustainability of the Mamminasata Metropolitan urban system. The analytical formulations used are as follows.
where y is the dependent variable, X1, X2, X3 … Xk are the independent variables E(y) = is the deterministic portion of the model, βi determines the contribution of the independent variable Xi, ε is the disturbance term, i.e., the values of variables that are not included in the equation. Note: The symbols X1, X2, X3, …… Xk may represent higher-order term for quantitative predictor (e.g., X2 = X12) or terms for qualitative predictors. The correlation coefficient (r) is a measure of the linear relationship of the X and Y variables. The r value ranges from (+1) to (−1). The value of r that is (+) is indicated by the value of b that is (+), and the value of r that is (-) is indicated by the value of b that is (-). If the value of r approaches +1 or r approaches −1, then X and Y have a high linear correlation. If r = +1 or r = −1, then X and Y have a perfect linear correlation. If r = 0, then X and Y do not have a linear relationship. R2y.12 is the coefficient of determination for multiple linear regression, JKG is the sum of squares of errors, and s2y is the sum of squares of y (corrected).
To answer the third question of this study, a renewable energy management strategy toward sustainable development of the Mamminasata Metropolitan system was designed through a SWOT analysis. SWOT analysis considers the external and internal environment by systematically identifying factors. The analysis method will provide output in the form of a SWOT matrix by producing four cells or types. Possible alternative strategies are (i) the S-O strategy, (ii) the W-O strategy, (iii) the W-T strategy, and (iv) the S-T strategy. The SWOT analysis matrix is presented in Table 5.
Table 5.
SWOT matrix.
4. Result
4.1. Economic Growth and Energy Security as Determinants of City Development
Optimizing the use of energy resources is needed for the development of the Metropolitan Mamminasata area, both for consumption and the production process for various economic sectors. Energy needs to be considered a determinant factor in regional development for divergence in energy planning [83]. Modern cities must focus on achieving sustainable use of resources [84]. Thus, management of energy resources in the Metropolitan Mamminasata area will require effectiveness and efficiency in meeting energy needs. The smart city concept requires investment in renewable energy sources (RES), which is currently a popular direction in urban transformation [85].
The limited supply and the depletion of fossil energy reserves and the tendency of energy consumption to occasionally increase is a threat to the sustainability of the Metropolitan Mamminasata area. In other words, energy planning is important because of the high rate of economic growth and energy demand [86]. Efforts to encourage efficient use of energy resources along with intensive searches for new, renewable energy sources are needed. Years of inadequate renewable energy policies and implementation have resulted in slow progress toward human development and economic sustainability [87,88]. Use of renewable energy is a necessity to support environmental sustainability toward the effectiveness and efficiency of the use of natural resources [89,90]. Thus, the stability of economic growth in urban areas will require sustainable energy security. The potential for the urban economic growth of Metropolitan Mamminasata is presented in Table 6.
Table 6.
Urban economic growth of the Metropolitan Mamminasata.
Table 6 shows the economic growth of the Mamminasata Metropolitan area. The urban economic growth of Makassar City is predominantly influenced by (i) the processing industry, (ii) the wholesale, retail, and repair of cars and motorcycles, (iii) construction, and (iv) education services. The urban economic growth of Gowa Regency is dominantly influenced by (i) agriculture, forestry, and fisheries, (ii) the wholesale, retail, and repair of cars and motorcycles, (iii) construction, (iv) information and communication, and (v) real estate. The urban economic growth of Maros Regency is dominantly influenced by (i) transportation and warehousing, (ii) the processing industry, and (iii) agriculture, forestry, and fisheries. The urban area of Takalar Regency is predominantly influenced by (i) agriculture, forestry, and fisheries and (ii) the wholesale, retail, and repair of cars and motorcycles. Thus, the growth of the Metropolitan Mamminasata economy is predominantly influenced by the strategic economic activity sector, i.e., industry, trade, agriculture, transportation, and educational services. To achieve sustainable development, effective tools are needed to facilitate the sustainability management process and enable the implementation of various strategies and programs that promote the development of strategic economic sectors [91,92].
In the Mamminasata Metropolitan Area, energy resources are very important to support the development of residential areas related to the supply of household energy, which tends to increase due to population growth over time. Energy needs and energy consumption are influenced by income and household size [93]. Energy in households is currently predominantly used for lighting, cooking, heating, and air conditioning, as well as various other household activities. Thus, households consume fuel oil, gas, biomass, and electricity. To change household energy consumption patterns, it is necessary to formulate processed energy conservation and emission reduction policies [94]. Household size, proximity to cities, climate, and topography can influence current and future energy demand growth [95]. The Matrix of Metropolitan Mamminasata’s economic transactions in relation to energy demand distribution is presented in Table 7.
Table 7.
Economic transaction matrix for the Metropolitan Mamminasata area.
The total expenditure of the agricultural sector is 150—3 is used as input for the agricultural sector, 8 for the industrial sector, 18 for the service sector, and the remaining 121 for the final demand as a consumer good. The total input from the agricultural sector is also 150—3 is the input from the agricultural sector, 33 from the industrial sector, and 15 from the service sector, and the remaining 99 are primary inputs as the gross added value, which reflects the GDP of Metropolitan Mamminasata, remuneration for the use of production factors (labor, land, and capital). The element that appears twice shows the interdependency between sectors in the economy. In recent years, sustainable economy policies and strategies have allowed for a reduction in pressure on the environment [96,97]. The implementation of economic circulation policies contributes to the competitiveness of the regional economy [98].
The distribution of energy services in relation to the dynamics of urban development in the Metropolitan Mamminasata area shows three dominant sectors in energy use. First, the industrial sector is dominant in the Makassar industrial area (KIMA) in Makassar City, the largest industrial area in Eastern Indonesia, the KIMAMA industrial area in Maros Regency, the plantation industry (sugar factory) in Takalar Regency, and the paper industry in Regency Gowa. Second, the service sector is dominant in the urban centers of Makassar City, Gowa Regency, and Maros Regency. Third, the agricultural sector is dominant in the urban areas of Maros Regency, Gowa Regency, and Takalar Regency. The index of the linkage of the Metropolitan Mamminasata economic sector is presented in Figure 5.
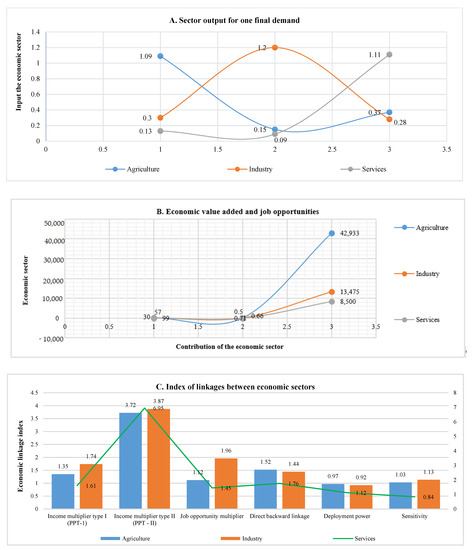
Figure 5.
(A–C) Linkage index of the urban economic activity sector of Metropolitan Mamminasata.
Each unit produced by the agricultural sector requires an input of 2% of the sector’s input itself, 22% of the industrial sector, and 66% of primary input. The Mamminasata Metropolitan GDP of these three sectors will increase by 225 units after final demand. Employment opportunities will increase per person by 42,933 in the agricultural sector, by 13,475 in the industrial sector, and by 8500 in the service sector. The job opportunity of each sector for the job opportunity multiplier shows: First, the type I income multiplier, among others: (i) the agricultural sector income multiplier is 0.50, (ii) the industrial sector income multiplier is 0.38, and (iii) service sector revenue multiplier by 0.20. The highest coefficient of income is in the industrial sector, with a value of 1.74%, meaning that each increase of one unit of final demand for sector output in the Metropolitan Mamminasata city will increase the industry sector’s income by 1.74, so it is a priority to increase job opportunities. Second, the type II income multiplier, obtained results, namely (i) the agricultural sector income multiplier of 3.72, (ii) the industrial sector income multiplier of 3.87, and (iii) the service sector income multiplier of 6.95. The dispersion power describes the effect that a unit increase in final demand has on the output of all sectors in the Metropolitan Mamminasata economy. The service certificate has the highest type II revenue multiplier coefficient of 6.95, so the development of the service sector will benefit Metropolitan Mamminasata.
Third, the work opportunity multiplier (output multiplier) obtained results, namely (i) agricultural employment opportunity multiplier of 1.12, (ii) industrial employment multiplier of 1.96, and (iii) service employment multiplier of 1.45. These results indicate that the industrial sector has the highest income multiplier of 1.97. Furthermore, direct forward linkages were obtained, namely (i) direct future linkages to agriculture of 0.42, (ii) direct forward linkages to the industrial sector of 0.50, and (iii) direct linkages to the future services sector of 0.21. A direct backward linkage is obtained, namely (i) a direct backward linkage of the agricultural sector of 0.32, (ii) a direct backward linkage of the industrial sector of 0.29, and (iii) a direct backward linkage of the service sector of 0.50. The dispersion power describes the effect that arises on an increase in one unit of the final demand output of a sector on the increase in the output of all sectors in the economy of the Mamminasata Metropolitan urban area.
The spreading power of the economic activity sectors can be described as follows: (i) the spreading power of the agricultural sector is 0.97, (ii) the spreading power of the industrial sector is 0.92 and the spreading power of the service sector is 1.12. Furthermore, the sensitivity of the results obtained, namely (i) the agricultural sector by 1.03, (ii) the industrial sector by 1.13, and (iii) the service sector by 0.84. The development trend between sectors varies greatly in the economic structure of Metropolitan Mamminasata. Therefore, the service sector and industry need priority to increase income, employment opportunities, and economic growth in the long term. Thus, the industrial and service sectors play a strategic role and are predicted to require high amounts of energy; these two sectors will dominate the future use of Metropolitan Mamminasata’s urban space and are closely related to the scarcity of the fossil energy currently used. The mitigation of climate change and the substitution of fossil energy sources present many technical, economic, and social challenges [99].
Urban transportation services in the Mamminasata Metropolitan Area that tend to increase will require support in the distribution of energy services. Development of a sustainable urban transportation system according to city size means that expansion flexibility, the adoption of travel modes, and environmental protection have an impact on the application of electromobility and on, air pollution [100,101]. Thus, energy for transportation facilities is needed to support the mobility of goods and people and to integrate urban systems. Sustainable mobility is one of the objectives of transportation policy focused on energy use, and sustainable development requires that urban development strategies be achieved through the cooperation of all stakeholders [102,103].
Field observations show that energy consumption in the transportation sector in the Metropolitan Mamminasata areas increases 12.6% per year in total energy demand. This confirms that the growth of transportation means has increased by an average of 5.6% per year. The increase in the flow of transportation movements is closely related to the increase in the per capita income in the community. The urban climate is closely related to urban development, human activities, and an increase in per capita income [104,105]. In the Metropolitan Mamminasata area, an increase in community income is closely related to the productivity of a growing business and relates to an increase in energy consumption. The per capita income of the Metropolitan Mamminasata community is presented in Figure 6.
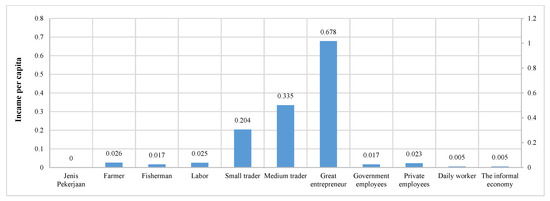
Figure 6.
Per capita income of the Metropolitan Mamminasata population. Source: Primary data and analysis results.
In Makassar City, 67.8% of per capita income is held by wholesalers, 33.5% by medium traders, 10.4% by small traders, 2.6% by farmers, 2.3% by private employees, 2.5% by daily workers, 1.7% by fishermen and civil servants each, and 0.5% by daily workers and the informal economy each. These results confirm that the Metropolitan Mamminasata area shows a differentiation in terms of community income in relation to energy consumption. Thus, differences in income levels are positively associated with differences in energy needs and consumption. Renewable energy resources are becoming increasingly important due to the depletion of energy resources and the damage these resources cause to the environment [106].
The increase in the population and urban activities of Metropolitan Mamminasata has increased the distribution of energy services, i.e., fuel oil (BBM), gas, and electrical energy. High reliance on fossil energy is positively associated with a decrease in the quality of the urban environment. This condition is characterized by an increase in the pollution load on soil, water, and air. Increased productivity is also accompanied by strategic space functions, i.e., industry, commercial activities, services, education, and health services, which meet the needs of housing and settlement facilities that tend to occasionally increase. These socio-economic activities directly affect the hierarchical formation of energy service centers. Digitalization will encourage an increase in energy consumption, since an increase in various activities means an increase in service centers, which will encourage excessive energy consumption [107,108]. The hierarchy of urban energy service centers for Metropolitan Mamminasata is presented in Table 8.
Table 8.
Centrality index and hierarchy of urban energy services for Metropolitan Mamminasata.
The service area of Makassar City has a complete service structure in relation to energy services. One location, functions as a primary service center, one functions as a secondary service, one functions as a tertiary service, (iv) two function as regional service centers, and six function as environmental unit services. In the service structure of Gowa Regency, three locations function as secondary services, two function as tertiary services, and six function as regional services. In the service structure of Maros Regency, three locations function as secondary services, one functions as a tertiary service, and eight function as regional services. In the service structure of Takalar Regency, one location functions as a primary service, two function as secondary services, five function as regional services, and one functions as an environmental unit service. This illustrates that the distribution of energy services is directly related to the hierarchy of urban service centers in the Mamminasata Metropolitan and is influenced by factors of accumulated activity, the transportation network system, and the presence of housing and settlements. Thus, a hierarchy of urban service centers accumulated in certain locations and easy accessibility are positively associated with the distribution of energy services. Harmony between regulations and the functional aspects of the city requires a spatial information system for monitoring planning as well as governance in spatial information management, including the distribution of energy services in a sustainable manner [109].
The development index of the Metropolitan Mamminasata area is not only influenced by population growth but also related to the availability of facilities and infrastructure, the functions of socio-economic activities, and the distribution of services for energy needs. These three categories are the basis for assessing the level of development of the Metropolitan Mamminasata area. The development index for the Metropolitan Mamminasata area is presented in Table 9.
Table 9.
Development index for the Metropolitan Mamminasata area.
In terms of the urban development index of Makassar City, two sub-districts are categorized as very fast, two as fast, four as moderate, two as slow, and five as very slow. Of Gowa Regency, one sub-district is categorized as fast, one as moderate, two as slow, and seven as very slow. Of Maros Regency, one area is categorized as fast, three as moderate, one as slow, and seven as very slow. Of Takalar Regency, three areas are categorized as moderate, three as slow, and two as very slow. Thus, the development of the Mamminasata Metropolitan area is characterized by an accumulation of socio-economic activities in line with population growth, and the developed areas are positively associated with service levels and energy distribution. City growth is accompanied by the development of infrastructure, and the power network is highly related to economic development [110].
Fulfilling the energy needs of the Metropolitan Mamminasata area is related to the area’s ability to provide service functions that are accessible to residents. Service coverage is measured based on distance, travel time, and costs. These service areas will provide information related to the effectiveness and efficiency of meeting energy service needs. The service area index in relation to meeting energy needs in the Metropolitan Mamminasata area is presented in Figure 7.
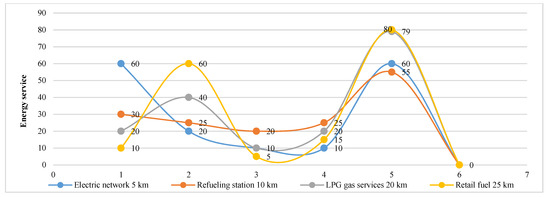
Figure 7.
Urban household energy service area index for Metropolitan Mamminasata. Source: Primary data and analysis results.
The index of services to meet the needs of household services for electric energy is categorized as very good and effective. The index of energy fulfillment services for households related to the availability of oil refueling stations is good. The LPG gas service index to meet household service needs is sufficient. The retail fuel service index for household services is poor. Thus, the energy service index in the Metropolitan Mamminasata area is influenced by distance, land use, and the level of accessibility, since the smaller the settlement distance is to energy services, the more effective and efficient they will be, and the economic costs incurred by the community will be lower.
4.2. Energy Security and Use of Renewable Energy
The previous section explains the dependence of the Metropolitan Mamminasata area on fossil energy sources in relation to the development of the Metropolitan Mamminasata area. The use of fuel oil is categorized as very high. The sustainability of petroleum-based fuel has gained broad attention from the global community due to the increase of its usage in various sectors, the depletion of petroleum resources, and the uncertainty around crude oil market prices [111]. The need for oil tends to increase occasionally, in line with economic growth and increasing urban activity and population. In macro terms, a decreasing oil production capacity has an impact on the adequacy of energy services when needed in the Metropolitan Mamminasata area. The crude oil price chain is affected by different types of interconnections in different time windows [112].
The Indonesian government has issued Presidential Decree No. 5/2006 on the National Energy Policy and Presidential Decree No. 1/2006 on Biofuels (BBN). This energy policy is the basis for local governments, businesses, and communities to develop potential new energy sources as an alternative to fuel oil, such as biomass. Biomass energy can be used for raw material, is easy to obtain, has abundant potential, and is more environmentally friendly. In order, to support sustainable development and economic growth, it will require support for the use of technology for the use of renewable energy in relation to the distribution of energy supplies [113]. Thus, biomass can be used as a substitute for oil in the Metropolitan Mamminasata area. The potential depletion of fossil fuel and climate change have globally accelerated the demand for renewable and alternative energy [114].
Biomass is organic material produced through photosynthetic processes, in the form of either products or waste. Thus, the potential for biomass from plants, agricultural waste, forest waste, feces, and livestock manure can easily be obtained from community activities. Biomass that can be used as an energy source is found in wood, sawdust, straw, seed waste, animal manure, paper waste, household waste, and wastewater [115]. In support of the urban development of Metropolitan Mamminasata, biomass potential can be obtained in the form of bioethanol as a substitute for gasoline to produce biodiesel. Sugarcane and maize production is quite abundant in the urban areas of Takalar Regency. Forest waste is plentiful in the urban areas of Gowa Regency and Maros District. Fecal waste is also dominant in the urban areas of Makassar City, and livestock manure is produced in urban areas of Gowa Regency and Maros Regency. These four energy sources are environmentally friendly and easy to obtain. The modern renewable energy share includes energy generated from biomass fuels, such as solid biomass and biogas for electricity and heat generation, using modern technologies [116]. Biogas is produced through anaerobic digestion using feedstock sources such as livestock manure, agro-industrial residues, and landfills [117].
Energy sources are related to potential natural resources that can be used to support the development of the Metropolitan Mamminasata area. Geographically, the location of the Jenneberang watershed encircles two urban areas, namely Gowa Regency and Makassar City which have the potential to be used as a hydroelectric power plant. The Jeneberang River is able to provide raw water of 3300 L/s, which is currently being used to irrigate agricultural areas with an area of 24,585 ha. In addition, it is also used for hydroelectric power plants (PLTA), with an installed capacity of 20.1 MW, The potential of the Maros watershed also has the potential for hydroelectric power generation, which is currently only used to irrigate an agricultural area of 50,000 ha and for drinking water for Maros Regency and Makassar City, with a total use of 4530 L/s The potential of wind resources in Takalar Regency with a speed of 5–8 knots can be used as much as 100 MW for wind power generation. These three energy sources have the potential to meet the needs of electrical energy and support energy security in Metropolitan Mamminasata.
The potential for renewable energy resources in Metropolitan Mamminasata has not been fully optimized to support the energy needs of various socio-economic activities and households in a sustainable manner. Field observations provide an overview of (1) the energy consumption of the community, (2) the support for the availability of infrastructure, and (3) the use of renewable energy. Data are presented in Figure 8.
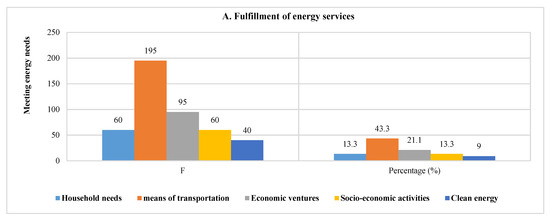
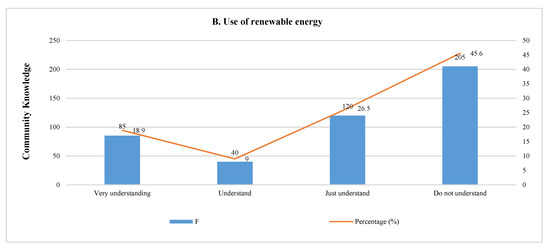
Figure 8.
(A,B) Energy use and public understanding of renewable energy. Source: Primary data.
Figure 8A,B shows the use of renewable energy and people’s understanding of renewable energy. 43.3% of energy is used for transportation, 21.1% for community economic business activities, 13.3% each for social activity services and for household needs. 72.1% of the community does not understand the use of renewable energy, and 27.9% does. These results illustrate that the implementation of policies on the use of renewable energy has not been used optimally due to the implementation of government policies that have not been optimal in involving the role of the private sector and public participation. The use of renewable energy sources can provide a path toward sustainable development and regional energy independence [118]. Urban infrastructure and residents meeting the energy needs of the community are presented in Figure 9.
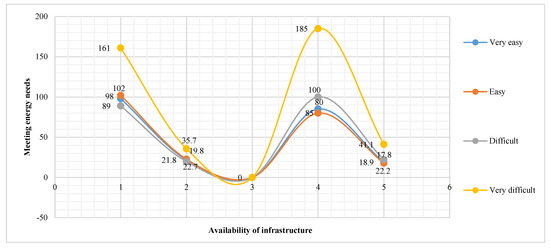
Figure 9.
Fulfillment of energy needs and availability of infrastructure. Source: Primary data.
Of respondents, 44.5% stated that it is easy to obtain services for energy needs, 55.5% stated that it is difficult to obtain services for energy needs, 36.7% stated that the availability of energy infrastructure is supportive of energy services, and 63.3% stated that the availability of energy infrastructure was limited. This confirms that the distribution of energy services in the Metropolitan Mamminasata area has not been supported by adequate infrastructure. Thus, the limited energy infrastructure causes a less-than-optimal distribution of energy services in the Mamminasata Metropolitan area. Thus, a strategy is required to guarantee affordable, reliable, and sustainable energy access to all people through the use, of modern energy systems [119]. The effect of economic growth, energy consumption savings, infrastructure availability, and renewable energy on the environmental quality of the Metropolitan Mamminasata city is presented in Table 10.
Table 10.
Summary of the results of the regression coefficient significance test.
Economic growth has a positive effect on environmental quality, with a coefficient value of 0.591, Saving energy has a positive effect, with a value of 0.905, The availability of infrastructure has a positive effect, with a value of 0.963, Renewable energy has a positive effect, with a value of 0.654. Thus, economic growth, energy consumption savings, infrastructure availability, and renewable energy all have a positive effect on the environmental quality of the Metropolitan Mamminasata area, with a coefficient of determination of 82.3%. The importance of renewable energy is increasing because certain energy sources and excessive use will damage the environment [120]. Thus, renewable energy is important for contemporary energy consumption and for future energy development [121].
The effects of economic growth, energy consumption savings, infrastructure availability, and renewable energy on the sustainability of the Metropolitan Mamminasata system are presented in Table 11.
Table 11.
Summary of the results of the regression coefficient significance test.
Economic growth has a positive effect on the sustainability of urban systems, with a coefficient value of 0.340; saving energy has a positive effect, with a value of 0.476; the availability of infrastructure has a positive effect, with a value of 0.873. Renewable energy has a positive effect, with a value of 0.677. Thus, economic growth, saving energy consumption, availability of infrastructure, and renewable energy positively affect the sustainability of the Metropolitan Mamminasata system, with a determination coefficient of 75.7%. Thus, it is important for the government to formulate policies that synergize urban land use and the availability of natural resources [122].
4.3. Renewable Energy Management Strategy and Urban System Sustainability
Economic growth that is oriented toward the excessive use of fossil energy in support of the development of the Metropolitan Mamminasata area will cause environmental degradation. The link between economic growth and environmental protection remains important for sustainable development, in the sense that environmental problems caused by economic activity are an integral part that needs to be addressed as a regional development system [123]. The use of fossil fuels as the main energy source has a negative impact on the environment, causing global warming and air pollution [124]. This condition is marked by an increase in urban productivity, i.e., industry, transportation systems, offices, education, health, trade, and services, as well as housing and settlement developments. These urban activities contribute to environmental degradation due to excessive energy use.
An increase in urban activity that runs parallel to an increase in population has an impact on changes in urban spatial use toward the exploitation of natural resources. Urban economies are responsible for more than half of global greenhouse gas emissions and substantially affect biodiversity and natural resource degradation [125]. Thus, it is necessary to make an optimal and wise use of natural resources toward the use of renewable energy. This means that the wise use of energy resources will not only encourage an increase in socio-economic productivity but will also help in restoring the quality of the urban environment in a sustainable manner. This means that strategic steps are needed in the management of renewable energy resources to support the sustainable development of the Metropolitan Mamminasata system. Thus, cooperation is needed in order, to accelerate access to clean energy by promoting renewable energy sources, energy efficiency, investment for energy infrastructure development, and sustainable energy technology [126]. The renewable energy management strategy in supporting urban development for Metropolitan Mamminasata is presented in Table 12.
Table 12.
Renewable energy management strategy and sustainability of the Metropolitan Mamminasata system.
This strategy will require government policy support to maximize energy use for a sustainable urban system. Implementing this policy will require adequate regional regulations and the involvement of actors in the management of renewable energy resources, i.e., the private sector and the community. The use of renewable energy sources will provide complementary opportunities between energy security, energy access, and climate change mitigation [127]. Sustainable ecosystems, as a community goal, will be related to local wisdom, autonomous, (independent), and according to community needs [128,129].
The use of renewable energy for urban development will require instruments for controlling space use: (1) zoning arrangements for space use, supported by the availability of adequate energy infrastructure, (2) the optimal use of land, in terms of providing energy facilities and infrastructure in a sustainable manner, (3) effective and efficient energy resource use based on changes in community behavior, and (4) use of energy resources effectively and efficiently, followed by government policies toward increasing the productivity of community businesses in a sustainable manner. The required government policy interventions are presented in Figure 10.
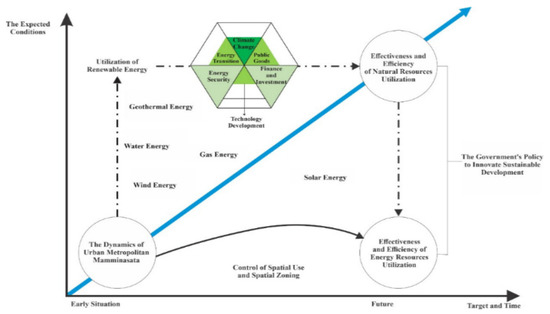
Figure 10.
Government policy interventions, renewable energy use, and the sustainable development of the Metropolitan Mamminasata system. Source: Author’s elaboration.
Use of renewable energy must be oriented toward the optimal use of new energy sources, namely air, wind, geothermal, gas and solar energy. The five energy resources have the potential to meet the use of electrical energy in the Mamminasata Metropolitan urban area in a sustainable manner. Energy security that supports development in Metropolitan Mamminasata must adapt to climate change and use environmentally friendly technology. Optimal renewable energy use needs to be supported by government policies through public and private participation (investors). Government policies on the use of renewable energy can translate into strategic programs according to targets set and mutually agreed upon by all stakeholders [130]. Bioenergy is a key strategy for climate change mitigation, and government plays an important role in developing renewable energy policies [131,132].
5. Discussion
5.1. Optimizing the Use of Renewable Energy
Fossil energy for the urban development of Metropolitan Mamminasata is quite dominant, especially petroleum fuels, used to increase the production of economic and transportation businesses. Economic growth and an increase in population that are not matched by the use, of renewable energy resources will cause environmental degradation. This means that the provision of new and renewable energy that has not been optimally used in the development of the Metropolitan Mamminasata area is influenced by its relatively high economic price and constraints on land availability. The limited availability of energy infrastructure has a direct effect on energy consumption services in relation to economic activities developed by the community. Thus, it is necessary to optimize the use of energy resources to support the development of the Metropolitan Mamminasata area. Renewable energy resources that have the potential to be used and developed include: (1) Water resources to be used as hydroelectric power. This energy source has the potential to support the centers of urban economic growth of the Metropolitan Mamminasata areas, especially for the urban areas of Makassar City, Maros Regency, and Gowa Regency, (2) Wind resource to be used as a Bayu power plant. This energy resource has the potential to support the development of the urban area of Takalar Regency, (3) The use of solar energy is used in locations and urban areas where accessibility is still low to meet small scale electricity needs and in new development areas, (4) Development of biofuels for diversification into fuels. This energy source is used to support the Metropolitan Mamminasata transportation system.
Use of biofuel energy sources for fuel needs obtained from biological sources, is easy to obtain for the purpose of meeting the needs of the urban community of Metropolitan Mamminasata in a sustainable manner. There are three categories of biofuels that can be used as a substitute for fuel, i.e., biodiesel, bioethanol, and biooil. This grouping refers to the types of conventional fuel oil from non-renewable energy sources and it is possible to substitute biofuel with biofuel. Biodiesel is intended as a substitute for diesel and industrial diesel oil. Bioethanol is ethanol produced from biomass to be used as a substitute for gasoline. Meanwhile, biooil is used as a substitute for kerosene and fuel oil. The use of this energy will require various steps and actions: (1) Enforcement of mandatory standards, in this case related to health, security, safety and the environment. These mandatory standards are related to the readiness of producers, the readiness of certification bodies, testing laboratories, and the procedures and mechanisms to be implemented. (2) Competency support for renewable energy technicians who have expertise in the provision and use of renewable energy by considering several aspects, i.e., competence, knowledge, skills, and work attitudes. (3) Government policy in terms of market intervention by means of incentives or disincentives toward the use of renewable energy. The goal is to reduce the cost of exploiting renewable energy toward increasing the variety and quantity of renewable energy reserves and being able to compete with fossil energy. Renewable energy sources will encourage regional independence and reduce the greenhouse effect, and gas emissions, and are used to meet the market share of renewable energy [133,134].
Optimizing the use of renewable energy to support the development of the Metropolitan Mamminasata area will require efforts and actions toward the integration of the urban system and determining program priority scales that are short term, medium term, and long term. This effort is carried out by setting prices for electrical and non-electric energy originating from renewable energy followed by special treatment, i.e., (i) subsidies for the price of electricity produced using renewable energy, and (ii) subsidies for the purchase price of fuel derived from renewable energy. The next step is to support incentives in the form of investment subsidies for the purpose of reducing investment costs. System integration will produce energy that is environmentally friendly, sustainable, and a stable production environment [135,136].
5.2. Sustainable Urban Development in Metropolitan Mamminasata
The sustainability of the development of the Metropolitan Mamminasata system is closely related to optimizing the use of natural resources and the use of renewable energy. The socio-economic activities that tend to develop in the Metropolitan Mamminasata area will increase production, consumption, and changes in people’s lifestyles. Increased production toward economic growth that is not matched by the use, of renewable energy will cause environmental degradation. The negative effect on the urban environment is marked by an increase in pollution in the soil, water, and air, lowering the sustainability of natural resources in the Metropolitan Mamminasata area. Thus, an integrative, ecological approach that optimizes natural resources in a renewable way is needed. The sustainability of Metropolitan Mamminasata must be (1) economically viable, ensuring dynamic and efficient economic development while increasing people’s welfare, (2) socially and politically acceptable and sensitive to the cultural values that lead to economic growth, and (3) environmentally friendly and supported by environmentally friendly technology.
Sustainable development in Metropolitan Mamminasata is oriented toward forming a structure of city services that effectively and efficiently uses space and distributes energy services, with an emphasis on three main pillars: (i) ensuring stable economic growth by restructuring production systems to save energy resources, (ii) social sustainability, i.e., ensuring social justice in the distribution of wealth and social services, and (iii) environmental sustainability, i.e., maintaining environmental sustainability while remaining comfortable and safe and emitting zero emissions through the use of renewable energy. The sustainability of the Metropolitan Mamminasata system and the distribution of renewable energy services is presented in Figure 11.

Figure 11.
Sustainability of the Metropolitan Mamminasata system and distribution of renewable energy services. Source: Author’s elaboration.
6. Conclusions
Optimizing the use of energy resources to support economic growth and the development of urban areas requires efficiency in their management and effectiveness in the distribution process. The industrial, trade, and service sectors will require considerable energy services in the dynamics of urban development and have a positive correlation with fossil energy scarcity. The increase in people’s income and the increasing mobility of goods and services also contributes positively to energy consumption and its impact on environmental quality. Population growth and increased urban activity have a positive correlation with the distribution of energy services and positively related to the establishment of a service center hierarchy based on distance, availability of infrastructure, and ease of accessibility. These three things are related to meeting the energy needs of the Mamminasata Metropolitan urban area.
The effectiveness and efficiency of energy services is strongly influenced by the ability of urban areas to provide service functions that are within the reach of the community, based on distance, travel time, and costs. Thus, the dynamics of regional development and economic growth contribute to energy demand, so it is important to use renewable energy resources so as, to use potential natural resources in a sustainable manner. The use of biofuel energy sources for fuel obtained from biological sources, i.e., biodiesel, bioethanol, and biooil, can sustainably support the needs of the Metropolitan Mamminasata community. Use of this energy will require various steps and actions, i.e., (i) the enforcement of health, security, safety, and environmental standards, (ii) employing renewable energy technicians with competence, knowledge, and skills, and (iii) government policy on market intervention through incentives and disincentives favoring the use of renewable energy.
Energy demand tends to increase occasionally in line with economic growth, increasing urban activity, and increasing population. Biomass can be used as a substitute for oil in the Metropolitan Mamminasata area. Water and wind resources can be used to support the fulfillment of energy needs in a sustainable manner for various socio-economic activities and households. The lack of public understanding of the use of renewable energy is due to energy use policies that are been optimal and signify the lack of a joint movement between the government, the private sector, and the community. Thus, optimizing the use of renewable energy for regional development will require efforts and actions to determine the priority of programs in the short term, medium term, and long term. This effort is carried out by setting prices for electric and non-electric energy originating from renewable energy, followed by (i) subsidies for the price of electricity produced using renewable energy, (ii) subsidies for the purchase price of fuel derived from renewable energy, and (iii) incentive support in the form of investment subsidies.
Renewable energy management supporting the sustainable development of the Metropolitan Mamminasata area will require government policy that maximizes sustainable energy use. Implementing this policy will require adequate regional regulations and the involvement of actors in the management of renewable energy resources, i.e., the private sector and the community. Sustainable development in urban areas is oriented toward forming a structure of city services that effectively and efficiently uses space and distributes energy services, with an emphasis on three main pillars: (i) ensuring stable economic growth by restructuring production systems to save energy resources, (ii) social sustainability, i.e., ensuring social justice in the distribution of wealth and social services, and (iii) environmental sustainability, i.e., maintaining environmental sustainability while remaining comfortable and safe and emitting zero emissions through the use of renewable energy.
Author Contributions
B.S. conceived the study; A.M. and S.S. compiled the research; B.S. and E.S.R. and B.B. complete the settlement; B.S. processed the data; A.T.F., A.M., and S.S. contributed materials/methods/analysis tools; B.S., B.B., A.M., S.S., and A.T.F. analyzed the data; E.S.R. and A.T.F. contributed to data checking; B.S., A.M., S.S., and B.B. wrote and revised concepts. H.A. contributed to writing—review and editing. All authors have read and agreed to the published version of the manuscript.
Funding
This research was funded by the Bosowa University through the Research Center for Urban and Regional Research LPPM, Bosowa University.
Institutional Review Board Statement
This study was carried out with the approval of the Institute for Research and Community Service (LPPM Bosowa Makassar University) through Cooperation Contract Number 8/LPPM/IV/2020 dated 6 April 2020. Furthermore, the funding for this study was funded through the University of Bosowa Makassar University Institute as a result of the study study. has been validated by the Chairperson of the Bosowa University LPPM.
Informed Consent Statement
The results of this study have been approved by the Research Agency for the Center for Research and Community Service at the University of Bosowa Makassar to be published as outlined with the approval of the Review Agency Number 68/LPPM/VI/2020.
Data Availability Statement
We fully support open scientific exchange through MDPI in sharing and archiving research data from this study. We fully comply with the provisions that have been set by referring to the established journal guidelines.
Acknowledgments
We are grateful for the participation of stakeholders in contributing ideas in carrying out this study. Thank you to the Bosowa Foundation for their support and financial assistance in carrying out this research.
Conflicts of Interest
The authors declare no conflict of interest.
References
- Van Niekerk, A.J. Inclusive economic sustainability: SDGs and Global Inequality. Sustainability 2020, 12, 5427. [Google Scholar] [CrossRef]
- Surya, B.; Syafri, S.; Sahban, H.; Sakti, H.H. Natural resource conservation based on community economic empowerment: Perspectives on watershed management and slum settlements in Makassar City, South Sulawesi, Indonesia. Land 2020, 9, 104. [Google Scholar] [CrossRef]
- Yang, B.; Ali, M.; Hashmi, S.H.; Shabir, M. Income inequality and CO2 emissions in developing countries: The moderating role of financial instability. Sustainability 2020, 12, 6810. [Google Scholar] [CrossRef]
- Łukaszewska, H.H.; Aruga, K.; Szlugaj, K.S. Energy security of poland and coal supply: Price analysis. Sustainability 2020, 12, 2541. [Google Scholar] [CrossRef]
- Singh, M.; Chandra Jha, R. Object-Oriented usability indices for multi-objective demand side management using teaching-learning based optimization. Energies 2019, 12, 370. [Google Scholar] [CrossRef]
- United Nation. Sustainable Energy for All Energy Powers Opportunity. It Transforms Lives, Economies, & Our Planet. 2011. Available online: https://www.un.org/millenniumgoals/pdf/SEFA.pdf (accessed on 5 July 2020).
- Armeanu, D.S.; Vintilă, G.; Gherghina, S.C. Does renewable energy drive sustainable economic growth? Multivariate panel data evidence for EU-28 countries. Energies 2017, 10, 381. [Google Scholar] [CrossRef]
- World Health Organization. COVID-19 Weekly Epidemiological Update. 2021. Available online: File:///C:/Users/L%20E%20N%20O%20V%20O/Downloads/Weekly_Epidemiological_Update_22.pdf (accessed on 10 January 2020).
- Widyastuti, N.L.; dan Nugroho, H. Dampak Covid-19 terhadap Industri Minyak dan gas bumi: Rekomendasi Kebijakan untuk Indonesia. Indones. J. Dev. Plan. 2020, 4, 166–175. [Google Scholar] [CrossRef]
- IEA. Global Energy Demand to Plunge this Year as a Result of the Biggest Shock Since the Second World War. 2020. Available online: https://www.iea.org/news/global-energy-demand-to-plunge-this-year-as-a-result-of-the-biggest-shock-since-the-second-world-war (accessed on 20 December 2020).
- Arif, R.; Dampak COVID-19 Terhadap Permintaan Energi Dunia. Coaction Indonesia. 2020. Available online: https://coaction.id/dampak-covid-19-terhadap-permintaan-energi-dunia (accessed on 18 December 2020).
- Shaari, M.S.; Karim, Z.A.; Abidin, N.Z. The effects of energy consumption and national output on CO2 Emissions: New evidence from OIC countries using a panel ARDL analysis. Sustainability 2020, 12, 3312. [Google Scholar] [CrossRef]
- Asean Center for Energy. Annual Report Asean Center for Energy. 2019. Available online: https://aseanenergy.sharepoint.com/PublicationLibrary/Forms/AllItems.aspx?id=%2FPublicationLibrary%2F2020%2FPublication%2FAnnual%20Report%202019%2Epdf&parent=%2FPublicationLibrary%2F2020%2FPublication&p=true&originalPath=aHR0cHM6Ly9hc2VhbmVuZXJneS5zaGFyZXBvaW50LmNvbS86YjovZy9FUlN0emhLYnlxOUxuQTMyN1Itbklfb0JZc3dqNzhjSkNDaVRVcVd5X3V5THp3P3J0aW1lPWVReW9FWC1IMkVn (accessed on 8 August 2020).
- Labandeira, X.; Labeaga, J.M.; Linares, P.; Otero, X.L. The impacts of energy efficiency policies: Meta-analysis. Energy Policy 2020, 147, 111790. [Google Scholar] [CrossRef]
- Kementerian Energi dan Sumber Daya Mineral. Indonesia Energi Outloook. 2010. Available online: https://www.esdm.go.id/assets/media/content/content-indonesia-energy-outlook-2010-484r1pu.pdf (accessed on 15 July 2020).
- Krikser, T.; Profeta, A.; Grimm, S.; Huther, H. Willingness-to-pay for district heating from renewables of private households in Germany. Sustainability 2020, 12, 4129. [Google Scholar] [CrossRef]
- Yudha, S.W.; Tjahjono, B. Stakeholder mapping and analysis of the renewable energy industry in Indonesia. Energies 2019, 12, 602. [Google Scholar] [CrossRef]
- Surya, B.; Hamsina, H.; Ridwan, R.; Baharuddin, B.; Menne, F.; Fitriyah, A.T.; Rasyidi, E.S. The complexity of space utilization and environmental pollution control in the main corridor of Makassar City, South Sulawesi, Indonesia. Sustainability 2020, 12, 9244. [Google Scholar] [CrossRef]
- Thema, M.; Bauer, F.; Sterner, M. Power-to-gas: Electrolysis and methanation status review. Renew. Sustain. Energy Rev. 2019, 112, 775–787. [Google Scholar] [CrossRef]
- Avtar, R.; Tripathi, S.; Aggarwal, A.K.; Kumar, P. Population–Urbanization–Energy Nexus: A Review. Resources 2019, 8, 136. [Google Scholar] [CrossRef]
- Anwar, A.; Younis, M.; Ullah, I. Impact of urbanization and economic growth on CO2 Emission: A case of far East Asian countries. Int. J. Environ. Res. Public Health 2020, 17, 2531. [Google Scholar] [CrossRef]
- Surya, B.; Ahmad, D.N.A.; Sakti, H.H.; Sahban, H. Land use change, spatial interaction, and sustainable development in the Metropolitan Urban Areas, South Sulawesi Province, Indonesia. Land 2020, 9, 95. [Google Scholar] [CrossRef]
- Hoppe, T.; Miedema, M. A governance approach to regional energy transition: Meaning, conceptualization and practice. Sustainability 2020, 12, 915. [Google Scholar] [CrossRef]
- Vandevyvere, H.; Stremke, S. Urban planning for a renewable energy future: Methodological challenges and opportunities from a design perspective. Sustainability 2012, 4, 1309–1328. [Google Scholar] [CrossRef]
- Drysdale, D.; Mathiesen, B.V.; Lund, H. From carbon calculators to energy system analysis in cities. Energies 2019, 12, 2307. [Google Scholar] [CrossRef]
- Delponte, I.; Schenone, C. RES implementation in urban areas: An updated Overview. Sustainability 2020, 12, 382. [Google Scholar] [CrossRef]
- Perea-Moreno, M.A.; Escobedo, Q.H.; Perea-Moreno, A.J. Renewable energy in urban areas: Worldwide research trends. Energies 2018, 11, 577. [Google Scholar] [CrossRef]
- Surya, B.; Syafri, S.; Hadijah, H.; Baharuddin, B.; Fitriyah, A.T.; Sakti, H.H. Management of slum-based urban farming and economic empowerment of the community of Makassar City, South Sulawesi, Indonesia. Sustainability 2020, 12, 7324. [Google Scholar] [CrossRef]
- Živanović, Z.; Tošić, B.; Nikolić, T.; Gatarić, D. Urban system in Serbia-the factor in the planning of balanced regional development. Sustainability 2019, 11, 4168. [Google Scholar] [CrossRef]
- Shi, L.; Zhong, T. The spatial pattern of urban settlement in China from the 1980s to 2010. Sustainability 2019, 11, 6704. [Google Scholar] [CrossRef]
- Surya, B.; Saleh, H.; Suriani, S.; Sakti, H.H.; Hadijah, H.; Idris, M. Environmental pollution control and sustainability management of slum settlements in Makassar City, South Sulawesi, Indonesia. Land 2020, 9, 279. [Google Scholar] [CrossRef]
- Saleh, H.; Surya, B.; Ahmad, D.N.A.; Manda, D. The role of natural and human resources on economic growth and regional development: With discussion of open innovation dynamics. J. Open Innov. Technol. Mark. Complex. 2020, 6, 103. [Google Scholar] [CrossRef]
- Meyer, N.; Auriacombe, C. Good urban governance and city resilience: An afrocentric approach to sustainable development. Sustainability 2019, 11, 5514. [Google Scholar] [CrossRef]
- Harris, D.J. The Classical Theory of Economic Growth. In The New Palgrave Dictionary of Economics, 2nd ed.; Macmillan: London, UK, 2007; Available online: https://web.stanford.edu/~dharris/papers/The%20Classical%20Theory%20of%20Economic%20Growth%20%5Bpre-print%5D.pdf. (accessed on 20 July 2020).
- Salvadori, N. Ricardo’s Theory of Growth and Accumulation: A Modern View (The Graz Schumpeter Lectures), 1st ed.; Essential Reading for Ricardo Scholars; Manchester Metropolitan University: Manchester, UK; London and New York Routledge: Abingdon, UK, 2020; 138p, ISBN 978-0367444105. Available online: https://www.amazon.com/Ricardos-Theory-Growth-Accumulation-Schumpeter/dp/0367444100 (accessed on 20 August 2020).
- Stofkova, Z.; Sukalova, V. Sustainable development of human resources in globalization period. Sustainability 2020, 12, 7681. [Google Scholar] [CrossRef]
- Pilipczuk, O. Sustainable smart cities and energy management: The labor market perspective. Energies 2020, 13, 6084. [Google Scholar] [CrossRef]
- Bosah, P.C.; Li, S.; Minua Ampofo, G.K.; Asante, D.A.; Wang, Z. The Nexus between electricity consumption, economic growth, and CO2 Emission: An asymmetric analysis using nonlinear ARDL and nonparametric causality approach. Energies 2020, 13, 1258. [Google Scholar] [CrossRef]
- Surya, B. Optimization of function and role of traditional markets in urban development system of ketapang city (A Case Study: Range Sentap Market, Delta Pawan Subdistrict, Ketapang City). World Appl. Sci. J. 2015, 33, 1457–1471. [Google Scholar] [CrossRef]
- Asarpota, K.; Nadin, V. Energy strategies, the urban dimension, and spatial planning. Energies 2020, 13, 3642. [Google Scholar] [CrossRef]
- Surya, B. Spatial interaction pattern and the process of city activity formation system (Case study, Ternate City, Tidore Archipelago City and Sofifi City of North Maluku, Indonesia). Res. J. Appl. Sci. 2015, 10, 880–892. Available online: https://medwelljournals.com/abstract/?doi=rjasci.2015.880.892 (accessed on 5 August 2020).
- Van Broekhoven, S.; Vernay, A.L. Integrating functions for a sustainable urban system: A Review of multifunctional land use and circular urban metabolism. Sustainability 2018, 10, 1875. [Google Scholar] [CrossRef]
- Chapin, F.S., III; Torn, M.S.; Tateno, M. Principles of ecosystem sustainability. Am. Nat. 1996, 148, 1016–1037. [Google Scholar] [CrossRef]
- Surya, B.; Ahmad, D.N.A.; Bahrun, R.S.; Saleh, H. Urban Farming as a Slum Settlement Solution (Study on Slum Settlements in Tanjung Merdeka Village, Makassar City); IOP Conference Series Earth and Environmental Science; IOP Publishing Ltd.: Bristol, Britania Raya, 2020; p. 562. [Google Scholar] [CrossRef]
- Forman, R.T.T. Urban ecology principles: Are urban ecology and naturalarea ecology really different? Landsc. Ecol. 2016, 31, 1653–1662. [Google Scholar] [CrossRef]
- Burgess, M.; Whitehead, M. Just transitions, poverty and energy consumption: Personal carbon accounts and households in poverty. Energies 2020, 13, 5953. [Google Scholar] [CrossRef]
- Saleh, H.; Surya, B.; Hamsina, H. Implementation of sustainable development goals to makassar zero waste and energy source. Int. J. Energy Econ. Policy. 2020, 10, 530–538. [Google Scholar] [CrossRef]
- Akkan, C.; Karadayi, M.A.; Ekinci, Y.; Ülengin, F.; Uray, N.; Karaosmanoğlu, E. Efficiency analysis of emergency departments in metropolitan areas. Socio-Econ. Plan. Sci. 2020, 69, 100679. [Google Scholar] [CrossRef]
- Garrido, S.; Sequeira, T.; Santos, M. Renewable energy and sustainability from the supply side: A critical review and analysis. Appl. Sci. 2020, 10, 5755. [Google Scholar] [CrossRef]
- Mancini, L.; Nuss, P. Responsible materials management for a resource-efficient and low-carbon society. Resources 2020, 9, 68. [Google Scholar] [CrossRef]
- PwC. Oil and Gas in Indonesia Investment and Taxation Guide. Available online: https://www.pwc.com/id/en/energy-utilities-mining/assets/oil-and-gas/oil-gas-guide-2019.pdf (accessed on 20 August 2020).
- Zaharia, A.; Diaconeasa, M.C.; Brad, L.; Raluca Lădaru, G.; Ioanăs, C. Factors influencing energy consumption in the context of sustainable development. Sustainability 2019, 11, 4147. [Google Scholar] [CrossRef]
- Surya, B. The dynamics of spatial structure and spatial pattern changes at the fringe area of Makassar City. Indones. J. Geogr. 2015, 47, 11–19. [Google Scholar] [CrossRef]
- Kurniawan, R.; Trencher, G.P.; Edianto, A.S.; Setiawan, I.E.; Matsubae, K. Understanding the multi-faceted drivers of increasing coal consumption in Indonesia. Energies 2020, 13, 3660. [Google Scholar] [CrossRef]
- Surya, B.; Saleh, H.; Hamsina, H.; Idris, M.; Ahmad, D.N.A. Rural agribusiness-based agropolitan area development and environmental management sustainability: Regional economic growth perspectives. Int. J. Energy Econ. Policy 2021, 11, 142–157. [Google Scholar] [CrossRef]
- Eveloy, V.; Gebreegziabher, T. A Review of projected power-to-gas deployment scenarios. Energies 2018, 11, 1824. [Google Scholar] [CrossRef]
- Van der Waal, E.C.; Das, A.M.; van der Schoor, T. Participatory experimentation with energy law: Digging in a ‘Regulatory Sandbox’ for local energy initiatives in the Netherlands. Energies 2020, 13, 458. [Google Scholar] [CrossRef]
- Surya, B. Change phenomena of spatial physical in the dynamics of development in Urban Fringe Area. Indones. J. Geogr. 2016, 48, 118–134. [Google Scholar] [CrossRef]
- Kiesecker, J.; Mordo, S.B.; Heiner, M.; Negandhi, D.; Oakleaf, J.; Kennedy, C.; Chauhan, P. Renewable energy and land use in India: A vision to facilitate sustainable development. Sustainability 2020, 12, 281. [Google Scholar] [CrossRef]
- Surya, B.; Saleh, H.; Remmang, H. Economic gentrification and socio-cultural transformation metropolitan suburban of mamminasata. J. Eng. Appl. Sci. 2018, 13, 6072–6084. Available online: https://medwelljournals.com/abstract/?doi=jeasci.2018.6072.6084 (accessed on 20 July 2020).
- Somanje, A.N.; Mohan, G.; Lopes, J.; Mensah, A.; Gordon, C.; Zhou, X.; Moinuddin, M.; Saito, O.; Takeuchi, K. Challenges and potential solutions for sustainable urban-rural linkages in a ghanaian context. Sustainability 2020, 12, 507. [Google Scholar] [CrossRef]
- Southeast Asia Energy Outlook. World Energy Outlook Special Report. 2013. Available online: https://www.iea.org/reports/southeast-asia-energy-outlook-2013 (accessed on 12 May 2020).
- Fuentes, S.; Robles, R.V.; Lerner, E. Composed index for the evaluation of the energy security of power systems: Application to the case of Argentina. Energies 2020, 13, 3998. [Google Scholar] [CrossRef]
- Podbregar, I.; Šimić, G.; Radovanović, M.; Filipović, S.; Šprajc, P. International energy security risk index-analysis of the methodological settings. Energies 2020, 13, 3234. [Google Scholar] [CrossRef]
- Azzuni, A.; Aghahosseini, A.; Ram, M.; Bogdanov, D.; Caldera, U.; Breyer, C. Energy security analysis for a 100% renewable energy transition in Jordan by 2050. Sustainability 2020, 12, 4921. [Google Scholar] [CrossRef]
- Löschel, A.; Moslener, U.; Rübbelke, D.T.G. Indicators of energy security in industrialized countries. Energy Policy 2010, 38, 1665–1671. [Google Scholar] [CrossRef]
- Fang, D.; Shi, S.; Yu, Q. Evaluation of sustainable energy security, and an empirical analysis of China. Sustainability 2018, 10, 1685. [Google Scholar] [CrossRef]
- Paun, D. Sustainability and financial performance of companies in the energy sector in Romania. Sustainability 2017, 9, 1722. [Google Scholar] [CrossRef]
- Bouznit, M.; Pablo-Romero, M.P.; Braza, A.S. Measures to promote renewable energy for electricity generation in Algeria. Sustainability 2020, 12, 1468. [Google Scholar] [CrossRef]
- Yserte, R.G.; Gallo-Rivera, M.T. The potential role of stakeholders in the energy efficiency of higher education institutions. Sustainability 2020, 12, 8908. [Google Scholar] [CrossRef]
- Chester, L. Conceptualising energy security and making explicit its polysemic nature. Energy Policy 2010, 38, 887–895. [Google Scholar] [CrossRef]
- Surya, B.; Ruslan, M.; Abubakar, H. Inequility of space reproduction control and urban slum area management sustainability (Case Study: Slum Area of Buloa Urban Village in Makassar City). J. Eng. Appl. Sci. 2018, 13, 6033–6042. Available online: https://medwelljournals.com/abstract/?doi=jeasci.2018.6033.6042 (accessed on 5 August 2020).
- Bogataj, D.; Hudoklin, D.; Bogataj, M.; Dimovski, V.; Colnar, S. Risk mitigation in a meat supply chain with options of redirection. Sustainability 2020, 12, 8690. [Google Scholar] [CrossRef]
- Hartono, D.; Komarulzaman, A.; Irawan, T.; Nugroho, A. Phasing out energy subsidies to improve energy mix: A dead end. Energies 2020, 13, 2281. [Google Scholar] [CrossRef]
- Mutani, G.; Todeschi, V.; Beltramino, S. Energy consumption models at urban scale to measure energy resilience. Sustainability 2020, 12, 5678. [Google Scholar] [CrossRef]
- Park, R.E.; Burgess, E.W. The City Suggestions for Investigation of Human Behavior in the Urban Environment; The University of Chicago Press and London: Chicago, IL, USA, 1952; Available online: http://shora.tabriz.ir/Uploads/83/cms/user/File/657/E_Book/Urban%20Studies/park%20burgess%20the%20city.pdf (accessed on 28 August 2020).
- Hoyt, H.; Millis, H.A. One Hundred Years of Land Values in Chicago: The Relationship of the Growth of Chicago to the Rise of Its Land Values, 1830–1933; The University of Chicago Press: Chicago, IL, USA, 1933; Available online: http://www.cooperative-individualism.org/hoyt-homer_one-hundred-years-of-land-values-in-chicago-1933.pdf (accessed on 20 August 2020).
- Creswell, J.W. Research Design. In Research Design: Qualitative, Quantitative, and Mixed Methods Approaches, 3rd ed.; 2017; Available online: https://www.amazon.com/Research-Design-Qualitative-Quantitative-Approaches/dp/1412965578 (accessed on 14 April 2020).
- Badan Pusat Statistik Sulawesi Selatan. Provinsi Sulawesi Selatan Dalam Angka. 2019. Available online: https://sulsel.bps.go.id/publication/2019/08/16/990caae13d6f4c5d743e852b/provinsi-sulawesi-selatan-dalam-angka-2019.html (accessed on 15 March 2020).
- Sugiyono. Metode Penelitian Kuantitatif, Kualitatif dan R&D. Bandung: PT. Alfabet. 2016. Available online: http://cvalfabeta.com/product/metode-penelitian-kuantitatif-kualitatif-dan-rd-mpkk/ (accessed on 2 April 2020).
- Taherdoost, H. Sampling methods in research methodology; how to choose a sampling technique for research. Int. J. Acad. Res. Manag. 2016, 5, 18–27. Available online: https://hal.archives-ouvertes.fr/hal-02546796/document (accessed on 5 April 2020). [CrossRef]
- Muta’Ali, L. Teknik Analisis Regional: Untuk Perencanaan Wilayah, Tata Ruang Dan Lingkungan; Badan Penerbit Fakultas Geografi (BPFG) UGM: Yogyakarta, Indonesia, 2015; ISBN 978-979-8786-53-2. Available online: http://opac.lib.ugm.ac.id/index.php?mod=book_detail&sub=BookDetail&act=view&typ=htmlext&buku_id=727641&obyek_id=1 (accessed on 12 April 2020).
- De Pascali, P.; Bagaini, A. Energy transition and urban planning for local development. A critical review of the evolution of integrated spatial and energy planning. Energies 2019, 12, 35. [Google Scholar] [CrossRef]
- Jarosz, A.S.; Cieplińska, J.R.; Jezierski, A. Assessing resources management for sharing economy in urban logistics. Resources 2020, 9, 113. [Google Scholar] [CrossRef]
- Lewandowska, A.; Miszczuk, J.C.; Rogatka, K.; Starczewski, T. Smart energy in a smart city: Utopia or reality? evidence from Poland. Energies 2020, 13, 5795. [Google Scholar] [CrossRef]
- Yeong Lee, H.; Jang, K.M.; Kim, Y. Energy consumption prediction in vietnam with an artificial neural network-based urban growth model. Energies 2020, 13, 4282. [Google Scholar] [CrossRef]
- Salam, R.A.; Amber, K.P.; Ratyal, N.I.; Alam, M.; Akram, N.; Muñoz, C.Q.G.; Márquez, F.P.G. An overview on energy and development of energy integration in major south asian countries: The building sector. Energies 2020, 13, 5776. [Google Scholar] [CrossRef]
- Arŏ ˘glu Akan, M.O.; Selam, A.A.; Fırat, S.U.O.; Er Kara, M.; Özel, S. A comparative analysis of renewable energy use and policies: Global and Turkish perspectives. Sustainability 2015, 7, 16379–16407. [Google Scholar] [CrossRef]
- Davidescu, A.M.; Apostu, S.A.; Pantilie, A.M.; Amzuica, B.F. Romania’s South-Muntenia region, towards sustainable regional development. implications for regional development strategies. Sustainability 2020, 12, 5799. [Google Scholar] [CrossRef]
- Mabhaudhi, T.; Mpandeli, S.; Madhlopa, A.; Modi, A.T.; Backeberg, G.; Nhamo, L. Southern Africa’s water–energy nexus: Towards regional integration and development. Water 2016, 8, 235. [Google Scholar] [CrossRef]
- Surya, B.; Saleh, H.; Ariyanto. Transformation of metropolitan suburban area (a study on new town development in Moncongloe-Pattalassang Metropolitan Mamminasata). IOP Conf. Ser. Earth Environ. Sci. 2018, 202, 012027. [Google Scholar] [CrossRef]
- Ashagidigbi, W.M.; Babatunde, B.A.; Ogunniyi, A.I.; Olagunju, K.O.; Omotayo, A.O. Estimation and determinants of multidimensional energy poverty among households in Nigeria. Sustainability 2020, 12, 7332. [Google Scholar] [CrossRef]
- Rahmani, O.; Rezania, S.; Pour, A.B.; Aminpour, S.M.; Soltani, M.; Ghaderpour, Y.; Oryani, B. An overview of household energy consumption and carbon dioxide emissions in Iran. Processes 2020, 8, 994. [Google Scholar] [CrossRef]
- Mao, S.; Qiu, S.; Li, T.; Tang, M.; Deng, H.; Zheng, H. Using characteristic energy to study rural ethnic minorities’ household energy consumption and its impact factors in Chongqing, China. Sustainability 2020, 12, 6898. [Google Scholar] [CrossRef]
- Pandyaswargo, A.H.; Ruan, M.; Htwe, E.; Hiratsuka, M.; Wibowo, A.D.; Nagai, Y.; Onoda, H. Estimating the energy demand and growth in off-grid villages: Case studies from Myanmar, Indonesia, and Laos. Energies 2020, 13, 5313. [Google Scholar] [CrossRef]
- Dolinsky, M.; Maier, S. Market-based approach in shift from linear economy towards circular economy supported by game theory analysis. Creat. Knowl. Soc. 2015, 5, 1–10. [Google Scholar] [CrossRef]
- Sørensen, P.B. From the linear economy to the circular economy: A basic model. Public Financ. Anal. 2018, 74, 71. [Google Scholar] [CrossRef]
- Segura, E.A.; de la Fuente, A.B.; González-Zamar, M.D.; Ureña, L.J.B. Effects of circular economy policies on the environment and sustainable growth: Worldwide research. Sustainability 2020, 12, 5792. [Google Scholar] [CrossRef]
- Wolf, S.; Korzynietz, R. Innovation needs for the integration of electric vehicles into the energy system. World Electr. Veh. J. 2019, 10, 76. [Google Scholar] [CrossRef]
- Pojani, D.; Stead, D. Sustainable urban transport in the developing world: Beyond megacities. Sustainability 2015, 7, 7784–7805. [Google Scholar] [CrossRef]
- Pietrzak, K.; Pietrzak, O. Environmental effects of electromobility in a sustainable urban public transport. Sustainability 2020, 12, 1052. [Google Scholar] [CrossRef]
- Gallo, M.; Marinelli, M. Sustainable mobility: A Review of possible actions and policies. Sustainability 2020, 12, 7499. [Google Scholar] [CrossRef]
- Szłapka, J.O.; Pawłyszyn, I.; Przybylska, J. Sustainable urban mobility in Poznan and Oslo-Actual State and development perspectives. Sustainability 2020, 12, 6510. [Google Scholar] [CrossRef]
- Surya, B. Social change, spatial articulation in the dynamics of boomtown construction and development (Case Study of Metro Tanjung Bunga Boomtown, Makassar). Mod. Appl. Sci. 2014, 8, 238–245. [Google Scholar] [CrossRef][Green Version]
- Jiang, Y.; Hou, L.; Shi, T.; Ning, Y. Spatial zoning strategy of urbanization based on urban climate co-movement: A Case Study in Shanghai Mainland Area. Sustainability 2018, 10, 2706. [Google Scholar] [CrossRef]
- Palomba, V.; Borri, E.; Charalampidis, A.; Frazzica, A.; Cabeza, L.F.; Karellas, S. Implementation of a solar-biomass system for multi-family houses: Towards 100% renewable energy utilization. Renew. Energy 2020, 166, 190–209. [Google Scholar] [CrossRef]
- Lange, S.; Pohl, J.; Santarius, T. Digitalization and energy consumption. Does ICT reduce energy demand? Ecol. Econ. 2020, 176, 106760. [Google Scholar] [CrossRef]
- Grazieschi, G.; Asdrubali, F.; Guattari, C. Neighbourhood sustainability: State of the art, critical review, and space-temporal analysis. Sustain. Cities Soc. 2020, 63, 102477. [Google Scholar] [CrossRef]
- Indrajit, A.; Van Loenen, B.; Van Oosterom, P. Assessing spatial information themes in the spatial information infrastructure for participatory urban planning monitoring: Indonesian cities. ISPRS Int. J. Geo-Inf. 2019, 8, 305. [Google Scholar] [CrossRef]
- Ayala, M.; Huaraca, D.; Aldás, J.V.; Ordóñez, A.; Riba, G. Anthropization and growth of the electricity grid as variables for the analysis of urban infrastructure. Sustainability 2020, 12, 1486. [Google Scholar] [CrossRef]
- Zahan, K.A.; Kano, M. Biodiesel production from palm oil, its by-products, and mill effluent: A Review. Energies 2018, 11, 2132. [Google Scholar] [CrossRef]
- Liao, G.; Li, Z.; Du, Z.; Liu, Y. The heterogeneous interconnections between supply or demand side and oil risks. Energies 2019, 12, 2226. [Google Scholar] [CrossRef]
- AlKhars, M.; Miah, F.; Ullah, H.Q.; Kayal, A. A systematic review of the relationship between energy consumption and economic growth in GCC countries. Sustainability 2020, 12, 3845. [Google Scholar] [CrossRef]
- Tun, M.M.; Juchelkova, D.; Win, M.M.; Thu, A.M.; Puchor, T. Biomass energy: An Overview of biomass sources, energy potential, and management in Southeast Asian Countries. Resources 2019, 8, 81. [Google Scholar] [CrossRef]
- Perea-Moreno, M.A.; Manzano, E.S.; Perea-Moreno, A.J. Biomass as RENEWABLE ENErgy: Worldwide research trends. Sustainability 2019, 11, 863. [Google Scholar] [CrossRef]
- Kemausuor, F.; Adaramola, M.S.; Morken, J. A review of commercial biogas systems and lessons for Africa. Energies 2018, 11, 2984. [Google Scholar] [CrossRef]
- Ahammad, S.Z.; Sreekrishnan, T.R. Biogas: An evolutionary perspective in the Indian context. In Green Fuels Technology; Green Energy and Technology; Springer: Cham, Switzerland, 2016; pp. 431–443. ISBN 978-3-319-30203-4. Available online: https://www.springer.com/gp/book/9783319302034 (accessed on 21 July 2020).
- Petrakopoulou, F. The social perspective on the renewable energy autonomy of geographically isolated communities: Evidence from a Mediterranean Island. Sustainability 2017, 9, 327. [Google Scholar] [CrossRef]
- Kumar, N.M.; Chopra, S.S.; Chand, A.A.; Elavarasan, R.M.; Shafiullah, G.M. Hybrid renewable energy microgrid for a residential community: A techno-economic and environmental perspective in the context of the SDG7. Sustainability 2020, 12, 3944. [Google Scholar] [CrossRef]
- Sasmaz, M.U.; Sakar, E.; Yayla, Y.E.; Akkucuk, U. The relationship between renewable energy and human development in OECD countries: A panel data analysis. Sustainability 2020, 12, 7450. [Google Scholar] [CrossRef]
- Dong, F.; Pan, Y. Evolution of renewable energy in BRI countries: A combined econometric and decomposition approach. Int. J. Environ. Res. Public Health 2020, 17, 8668. [Google Scholar] [CrossRef]
- Brouwer, F.; Lyroudia, L.V.; Alexandri, E.; Bremere, I.; Griffey, M.; Linderhof, V. The nexus concept integrating energy and resource efficiency for policy assessments: A comparative approach from three cases. Sustainability 2018, 10, 4860. [Google Scholar] [CrossRef]
- Bongers, A. The environmental kuznets curve and the energy mix: A structural estimation. Energies 2020, 13, 2641. [Google Scholar] [CrossRef]
- Martins, F.; Felgueiras, C.; Smitkova, M.; Caetano, N. Analysis of fossil fuel energy consumption and environmental impacts in European Countries. Energies 2019, 12, 964. [Google Scholar] [CrossRef]
- Fernández, J.E.; Angel, M. Ecological city-states in an era of environmental disaster: Security, climate change and biodiversity. Sustainability 2020, 12, 5532. [Google Scholar] [CrossRef]
- Szabó, S.; Kougias, l.; Girona, M.M.; Bódis, K. Sustainable energy portfolios for small island states. Sustainability 2015, 7, 12340–12358. [Google Scholar] [CrossRef]
- Setyowati, A.B. Mitigating energy poverty: Mobilizing climate finance to manage the energy trilemma in Indonesia. Sustainability 2020, 12, 1603. [Google Scholar] [CrossRef]
- Cepeliauskaite, G.; Stasiskiene, Z. The framework of the principles of sustainable urban ecosystems development and functioning. Sustainability 2020, 12, 720. [Google Scholar] [CrossRef]
- Surya, B.; Menne, F.; Sabhan, H.; Suriani, S.; Abubakar, H.; Idris, M. Economic growth, increasing productivity of SMEs, and open innovation. J. Open Innov. Technol. Mark. Complex. 2021, 7, 20. [Google Scholar] [CrossRef]
- Syafri, S.; Surya, B.; Ridwan, R.; Bahri, S.; Rasyidi, E.S.; Sudarman, S. Water Quality Pollution Control and Watershed Management Based on Community Participation in Maros City, South Sulawesi, Indonesia. Sustainability 2020, 12, 10260. [Google Scholar] [CrossRef]
- Cowie, A.L.; Brandão, M.; Soimakallio, S. 13-Quantifying the climate effects of forest-based bioenergy. Manag. Glob. Warm. 2019, 399–418. [Google Scholar] [CrossRef]
- Ilham, N.I.; Hasanuzzaman, M.; Mamun, M.A.A. Chapter 8-World energy policies. Energy Sustain. Dev. 2020, 179–198. [Google Scholar] [CrossRef]
- Robinson, S.; Papadopoulos, S.; Gago, E.J.; Muneer, T. Feasibility study of integrating renewable energy generation system in sark island to reduce energy generation cost and CO2 emissions. Energies 2019, 12, 4722. [Google Scholar] [CrossRef]
- Hilpert, S.; Dettner, F.; Al-Salaymeh, A. Analysis of cost-optimal renewable energy expansion for the near-term Jordanian electricity system. Sustainability 2020, 12, 9339. [Google Scholar] [CrossRef]
- Hosein, G.; Hosein, P.; Bahadoorsingh, S.; Martinez, R.; Sharma, C. Predicting renewable energy investment using machine learning. Energies 2020, 13, 4494. [Google Scholar] [CrossRef]
- Surya, B.; Hadijah, H.; Suriani, S.; Baharuddin, B.; Fitriyah, A.T.; Menne, F.; Rasyidi, E.S. Spatial transformation of a new city in 2006–2020: Perspectives on the spatial dynamics, environmental quality degradation, and socio-economic sustainability of local communities in Makassar City, Indonesia. Land 2020, 9, 324. [Google Scholar] [CrossRef]
Publisher’s Note: MDPI stays neutral with regard to jurisdictional claims in published maps and institutional affiliations. |
© 2021 by the authors. Licensee MDPI, Basel, Switzerland. This article is an open access article distributed under the terms and conditions of the Creative Commons Attribution (CC BY) license (http://creativecommons.org/licenses/by/4.0/).