Abstract
Increasing fragmentation of the construction industry makes it riskier and more competitive. Construction management researchers have become intrigued by the factors influencing performance differentials due to such fierce competition. This study examines the relationships between the business environment and customer relationship management and their effect on construction organisations sustainable performance. It develops a model to explain performance differential between construction organisations in New Zealand by using the linear regression technique. A questionnaire was administered to professionals within construction organisations. A total of 101 usable responses were analyzed for descriptive statistics and correlations. Following the balanced scorecard performance metric, the organisations’ sustainable performance was measured using customers, financials, internal processes, and growth and learning metrics. Results indicated that environmental dynamism had a significant regression with internal business processes and perspectives on learning and growth, with 0.259 and 0.607, respectively. CRM was significantly associated with financial (0.327), customer (0.373), and internal business process (0.451) perspectives. This study provides an integrative framework to construction enterprises, and determinants of organisational sustainable performance, which are substantial developments in the current literature on CRM practices. Given the significance of the construction sector to the global economy, ecology, and social well-being, its sustainable performance can lead to a sustainable future for communities
1. Introduction
In New Zealand, the construction industry is dynamic and often unpredictable. Such dynamic marketplaces, according to [1], boost the level of competition in the market. This may be used to describe the construction industry in New Zealand, which has a highly competitive market due to its massive infrastructure development programmes. As a result, the construction industry has become more fragmented, and profitability has shrunk [2]. That result was due to the high intensity of competition, which led the large organisations to control the market. A number of reasons have supported growth in New Zealand’s construction sector. While population increase has driven the growth in New Zealand’s north part residential sector, the majority of construction work in the south part has been related to post-earthquake reconstruction. Residential, non-residential, and infrastructure building permits were all issued in greater numbers year after year, increasing the number of jobs in these industries. Although it appears that New Zealand’s construction boom is never-ending, it has been established that the industry has reached its peak, as construction companies are unable to meet market demand. The construction sector will not be able to outperform itself [3]. A survey conducted from 2015 to 2020 showed that the survival record of organisations in all construction industry sectors does not exceed 50% [4]. According to the same survey, only 85% of the companies survive after the first year [4]. To maintain a competitive advantage and stay sustainable in both their dynamic as well as hypercompetitive markets, construction companies must strive to improve constantly [5].
In a dynamic market, strategic management has different aspects that explain performance differentials. Under the realm of strategic management, CRM (customer relationship management) is an important aspect that influences business success significantly [6]. It was posited as a primary factor of success in a competitive world. Essentially, CRM is about establishing and managing relationships with important customers. Theoretically, it has been argued to strike at the core of the marketing philosophy [7]. Numerous studies have demonstrated the positive impact of CRM on sustainable organisational performance. Effective CRM implementation has been linked to desirable business results such as improved customer satisfaction, retention, and company profitability [8].
It is commonly assumed that successful companies’ strategies and structures should be in sync with their business environment to achieve optimised performance [9]. Any organisation that operates in a dynamic and constantly changing environment, such as construction companies, finds it challenging. The construction industry is frequently perceived as uncertain and as riskier than any other industry [10]. The difficulties, threats, and constraints facing construction organisations have placed great pressure on them to employ measures to ensure their long-term viability. The nature of organisations is such that they work around threats simultaneously, either avoiding them or transforming them into organisational advantages to maximise efficiency.
This study provides a conceptual framework with two constructs to describe sustainable organisational performance. Several studies have determined the effect of CRM on performance [6]. Others have studied the business environment with organisational performance. A shortage of studies exists to examine how business environments and CRM impact sustainable organisational performance. Based on this trinity of knowledge, the strategy can be applied to generate sustainable performance at the construction organisation level in future research. Achieving sustainable performance for construction organisations will support sustainability, as the construction industry forms a significant share of the system.
This study starts with a literature review, developing a conceptual model and research hypotheses to be tested to address this gap. Before diving into the presentation and discussion of the research findings, the research methods and methodology are explained. A quantitative research approach using a questionnaire was used to collect data. Finally, the study presents the conclusions, discusses the limits of the research, and suggests areas for future research.
2. The Structure of the Proposed Framework and Its Related Hypotheses
The framework incorporates customer relationship management and the business environment as two main constructs (Figure 1). With these, organisations could achieve sustainable competitive advantage and superior performance. Accordingly, it involves two hypotheses about the relationship between each construct and organisational performance.
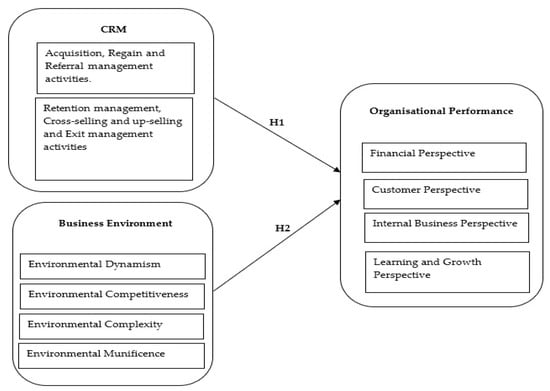
Figure 1.
Conceptual framework.
The following subsections address the key relationships in this theoretical framework.
2.1. Customer Relationship Management (CRM)
This study investigates CRM from a strategic point of view. In order to enhance partnerships, it is not as important to advertise and invest in traditional brand-related activities, as to develop systems that supplement the customer experience” [11] (p. 91). Companies and customers are supposed to benefit from CRM initiatives [12,13,14]. In turn, this enhances shareholder value by enabling strategically appropriate relationships with key customers [6].
Using relationship marketing strategies and information technologies, CRM recognises and co-creates consumer value. Information, technology, and applications are used to support cross-functional integration between systems, people, activities, and marketing capabilities [15] (p. 168). CRM from a business perspective involves the acquisition, retention, and collaboration with customers, among other tasks [7,11,14,15,16].
CRM activities include three primary characteristics at the customer-facing level [8]: relationship initiation, maintenance, and termination. During the relationship initiation stage, primary tasks were to acquire new customers (customer acquisition activities), retain lost customers (customer regain activities), and implement the necessary customer analysis to support the aforementioned two activities. During the maintenance stage of a relationship, customers are re-engaged, cross-sold, and upsold, and referrals are managed. Specific analysis of the customer (maintenance analysis) supports each of these tasks. The termination procedure incorporates customer exit management as well as the necessary analysis for its implementation.
It is not surprising that both practitioners and academics are interested in CRM’s contribution to organisational performance, given the ability to deliver value to customers and companies [8,17,18]. However, the verdict on CRM’s effect on organisational performance is still mixed. According to several studies conducted in the decade leading up to 2010, such as the Gartner Group, Butler Group, and AMR Research, CRM project performance was abysmal, with failure rates as high as 70%. Numerous academic studies have documented the positive impacts of CRM on performance, including increased customers’ awareness [19], a greater sense of loyalty [20], and a higher sense of satisfaction among customers [19,20,21,22].
Rather than measuring the effects of CRM on customer-related variables to measure performance, Reinartz et al. [8] adopted a strategy-based approach across firms that is more comprehensive in nature. An analysis of CRM’s impact on revenue, profitability, and business growth was conducted. Their study found that CRM implementation contributed to improved relationship formation and that relationship maintenance had the greatest effect. Furthermore, they found that CRM-compatible organisational alignment and termination and initiation of relationships have essential interactions, which suggest that organisations that develop incentives and schemes to promote CRM-compatible behaviour will be more effective. Consequently, a significant portion of the empirically supported academic literature suggests that CRM systems and their implementation positively impact business performance.
Hypothesis 1 (H1).
Customer relationship management (CRM) activities relate positively to organisational performance.
2.2. The Business Environment
Organisations engaged in the construction industry operate globally within a rapidly changing environment. They often struggle to survive in this turbulent environment when they cannot respond to environmental uncertainty [23]. This is because the business operates in a general environment similar to that of other industries, which can be volatile [24]. This view is supported by Harrison and Pelletier [25], who state that organisations do not operate in a vacuum; rather, they are shaped by their environment. An organisation’s environment is the means of survival. The relationship between internal and external influences of an organisation is what Harrison et al. [26] see as the business environment. It consists of specific physical and social factors inside and outside organisational boundaries. These factors directly affect individuals and groups’ decision-making behaviour.
Several studies have listed latent environmental variables in strategic management literature that jointly whittle the business environment. For example, Lenz and Engledow [27] use five models to evaluate and identify business environments: industry structure, cognitive, organisational field, reliance on ecology and resources, and the era model. In the current research, four environmental variables defined by Mintzberg et al., Dess and Beard, Ward et al., and Ray [28,29,30,31] are considered, including munificence, complexity, competitive intensity, and dynamism.
The concept of munificence describes how organisations function in a context of abundant resources and opportunities and how they compete for these opportunities and resources [31]. Dynamism is the increase or decrease in the rate of change in a particular industry or the degree of predictability or ambiguity in a business environment. Usually, a high degree of munificence shields organisations from environmental stresses because it provides financial and operational slack that can promote organisational stability and development if used effectively [32]. It is imaginable, however, that organisations may have “too much of a good thing”. On the one hand, organisational slack can be bad for efficiency because it causes managers to become complacent about effectively tracking performance enhancement. Small errors left unattended may lead to more severe problems in the organisation and in the atmosphere, which can negatively affect morale and productivity. In this way, the broken window hypothesis is supported. In contrast, it leads to overconfidence in their abilities to provide better and more services. Accordingly, environmental munificence either has a positive linear relationship with organisational performance or a negative U-shaped relationship [33].
A company’s market and service variability and dispersion are examples of its environmental complexity. A heterogeneous environment typically involves a wide range of customers, suppliers, and service users. It also works through an extensive range of geographical areas in a dispersed environment. Nevertheless, it may be possible for organisations to tailor the services they provide to the customer’s needs more effectively if they have a diverse customer base. Hence, environment complexity has a direct relationship with organisational performance.
A company’s competitive intensity refers to the degree to which it is threatened by environmental forces such as market and regulatory forces (hostility due to competition) while functioning within the construction industry.
Finally, dynamism is caused by the acts of industry competitors or customers, such as technological developments and variations in aggregate demand [34,35]. Whenever there is instability and turbulence of external circumstances (instability and turbulence) of that change, environmental dynamism results due to the pace of the change. For organisations to cope with environmental instability and turbulence, higher financial and human resources are usually required [36]. Nevertheless, it is conceivable that demonstrating increased sensitivity to an organisation’s external constraints will sharpen managerial reflexes and trigger enhanced creativity, thus producing better organisational performance, at least until environmental dynamism becomes strong enough to prevent any successful management response. Dynamic environments affect organisational performance [37]. Since the relationship between environment dynamics and organisational performance has many facets, it is conceivable that the disparities in the qualitative results achieved by firms could be impacted by their environment dynamics [38].
In each of these approaches, assumptions are made about how the environment functions and describes the nature and degree of environmental change and how managers adapt to these environments [39]. As a result, previous studies [40,41,42] have shown that an organisation’s environment can substantially impact the performance level of that organisation.
Hypothesis 2 (H2).
The business environment variables are significantly related to organisational performance.
3. Materials and Methods
3.1. Organisational Performance Measurement
Even though performance measurement is an important component of organisational decision making and judgement, the term is difficult to define and measure [43,44]. According to Kagioglou et al. [45], performance measures how effective and efficient an organisation’s mechanism/process achieves the targeted results. Organisations have traditionally measured their performance using financial terms such as return on investment, returns on assets, and turnover. However, according to Kagioglou et al. [46], organisations’ reliance on financial measurements can only help them recognise the past performance but not its contributors. Therefore, a comprehensive performance management system must consider non-financial as well as financial metrics [47]. Several studies confirm the value of financial and non-financial measures of business performance, which is illustrated in Table 1.
This study uses the balanced scorecard (BSC) tool. In corporate management, it is one of the most widely used methods of measuring performance by combining both financial and non-financial metrics [48]. Drs. Kaplan and Norton worked on the creation of the Balanced Scorecard (BSC). In the framework of evaluating construction performance, the BSC is a strategic management tool that many construction companies have used to evaluate and enhance their performances. The BSC explains performance in four proposed perspectives and allows decision-makers to generate potential value. The BSC structure helps companies customise a relevant set of indicators for their strategy, vision, and realistic work environments for each perspective. The BSC has included a strategy map that provides performance objectives and expectations. It outlines how the strategy can be effectively implemented. It also enables the relationships between indicators in the four BSC perspectives to be established in order to relate the different operations in relevant departments to the expected outcomes [49]. Business from four critical perspectives can be examined through BSC. The following questions can be answered through BSC [50]:
- Customer perception: How do customers view us?
- Internal perspective: Where does the business need to excel?
- Learning and growth perspective: Can the company keep improving and building value?
- A financial perspective: How does the company appear to shareholders?

Table 1.
Some performance measures used in the research modified and adapted from [51].
Table 1.
Some performance measures used in the research modified and adapted from [51].
| Author(s) and Year | Method | Industry-Focused | Country of Research | Measures of Performance | Subjective/Objective |
|---|---|---|---|---|---|
| Kale and Arditi, 2002,2003 | Survey | Construction | USA | Contract award and profit growth | Subjective |
| Goerzen, 2007 | Survey and secondary | Large MNEs | Japan | Operating return on sales, return on assets, operating return on capital | Objective |
| Elbanna & Child, 2007 | Survey | Textiles and clothing, chemicals, and food and beverage | Egypt | Relative financial performance, relative non-financial performance | Subjective |
| Crossland & Hambrick, 2007 | Secondary | manufacturing and service firms | Germany, Japan, and the USA | Return on assets, return on sales, sales growth, market-to-book value | Objective |
| Collis, Young, & Goold, 2007 | Survey and secondary | Corporate headquarters | Europe, the USA, Japan, &Chile | Return on capital employed, total shareholder return, growth in sales turnover, overall effectiveness and cost-effectiveness | Objective, quasi-objective |
| Chen & Miller, 2007 | Secondary | US manufacturing firms | USA | Return on assets, Altman’s Z | Objective |
| Ho, 2015 | Survey | Construction | Hong Kong | The profit margin on turnover | Subjective |
3.2. Sample Characteristics and Questionnaire Development
The data used in this research were obtained from 65,320 listed construction organisations involved in structural and general construction work in New Zealand. The sample consisted of 320 companies using a simple random sampling technique. The study estimated the minimum sample size using Equation (1) [52].
where ss (sample size), z (standardised variable, p (percentage picking a choice, expressed as a decimal), and c (confidence interval, expressed as a decimal).
The data were collected through a questionnaire sent by email. Qualtrics [53] was used as the data collection instrument. This simple web-based survey tool is used for conducting surveys, evaluating products, and collecting data. One hundred and one responses were received at the end of the survey period, close to a 30% response rate. This response rate is considered sufficient to generalise the results [52]. The questionnaire was constructed using closed questions and a five-point Likert scale to evaluate respondents’ answers to the dimensions under consideration. Table 2 presents the demographics of the participants. The survey questions have been carefully crafted to be free of wrong or right answers, using a measurement scale that has been thoroughly tested in other countries. The objective of the survey questions was to measure the business environment and CRM and their effects on organisational performance. The research was designed based on a post-positivism methodology. Accordingly, a quantitative approach was undertaken to obtain an interpretation of performance determinants (Business environment and CRM) for construction organisations in New Zealand. This method also provided a high level of anonymity for the respondents, who wished to hold their opinions in confidentiality. It could facilitate accuracy in responses.
Table 2.
Organisational demographics.
3.3. Variables and Their Measurement
The data collection involved variables representing the business environment and customers relationship management as the two independent variables and organisational performance as the product of the proposed framework. All variables are listed in Table 3.
3.3.1. Dependent Variable
Divergent perspectives exist on the significance of various approaches used to conceptualise and analyze organisational performance in strategy research [54]. Subjective assessment is considered to be preferable to objective assessment by some academics [55,56]. While Allen et al. [57] believe that these two measures have innate positives and negatives, this study uses both to investigate the relationship between determinants and performance [58].
With BSC, traditional financial indicators were augmented with non-financial factors based on three additional perspectives (the customer perspective, the internal business perspective, and the learning and growth perspective).
In this particular study, four items were used to assess financial and customer perspectives, three indicators to assess learning and growth, and five items to assess internal business processes [59,60].
Table 3.
Variables of the study.
Table 3.
Variables of the study.
| Variables | Measures | Source/s |
|---|---|---|
| Customer relationship management | Acquisition, regain, and referral management activities. Retention management, cross-selling, and up-selling and exit management activities | Mumuni & O’Reilly [6]. |
| Business environment | Environmental dynamism Environmental competitiveness Environmental complexity Environmental munificence | Kabadayi et al. [61]; Nandakumar et al. [35]; Auh & Menguc [61]. |
| Organisational performance | Financial perspective Customer perspective Internal business perspective Learning and growth perspective | Kaplan & Norton [59]; Chang [60]. |
3.3.2. Independent Variables
The business environment and customer relationship management were defined as the independent variables of the study. Table 3 describes the variables that are involved in this study’s conceptual model. The dimensions of the environment were utilised to measure the business environment. The study assessed these aspects through notions such as dynamism, munificence, complexity, and competitive intensity. In choosing these dimensions, the researchers followed the earlier studies [35,61,62]. The study used three items to determine munificence environment, environmental complexity, competitive intensity, and dynamic environment. On a five-point Likert scale from 1 (very low) to 5 (very high), participants were asked to describe any changes in their work environments and the impact of the variables.
Customer relationship management’s dimensions were included by acquisition, regain, and referral management activities and retention, cross-selling, and up-selling and exit management activities. The items to measure these dimensions were modified and adapted from Mumuni and O’Reilly [6] with four and six items to determine each of them, respectively. Respondents were asked to describe the effect of the practices on a five-point Likert scale ranging from 1 (strongly disagree) to 5 (strongly agree).
4. Analysis and Description of Results
The relationship between business environment dimensions, CRM dimensions, and organisational performance was assessed using multiple linear regression. It is a useful statistical tool that evaluates the relationships between a group of independent variables and one dependent variable [63]. A six-predictor multiple linear regression model was proposed in this research. The six predictor variables are environmental dynamism (X1); environmental competitiveness (X2); environmental complexity (X3); environmental munificence (X4); acquisition, regain, and referral management activities (X5); and retention management, cross-selling and up-selling, and exit management activities (X6).
The proposed multiple linear regression model’s equations are outlined below:
where, Y (D1) = dependent variable (financial perspective), Y (D2) = dependent variable (customers perspective), Y (D3) = dependent variable (internal business process perspective), Y (D4) = dependent variable (learning and growth perspective), β0 = constant, and ε = error.
Y (D1) = β0 + β1 (X1) + β2 (X2) + β3 (X3) + β4 (X4) + β5 (X5) + β6 (X6) + ε
Y (D2) = β0 + β1 (X1) + β2 (X2) + β3 (X3) + β4 (X4) + β5 (X5) + β6 (X6) + ε
Y (D3) = β0 + β1 (X1) + β2 (X2) + β3 (X3) + β4 (X4) + β5 (X5) + β6 (X6) + ε
Y (D4) = β0 + β1 (X1) + β2 (X2) + β3 (X3) + β4 (X4) + β5 (X5) + β6 (X6) + ε
4.1. Construct Reliability and Validity
To assess the reliability of measurement scales, the study employed the component factor analysis (CFA) technique [64]. The constructs were tested for reliability and validity using SPSS [65]. To construct reliability measures using the factor analysis technique, Cronbach’s alpha, percentages of variance, factor loadings, and eigenvalues were used. This conforms to the recommendations of prior studies such as Hair et al. [64]. The research ensured the items’ validity through a comprehensive literature review to distinguish the questionnaire items. The reliability of the scales used to measure the consistency of the multiple measurements has been discussed by Hair et al. [64]. As shown in Table 4 and Table 5, the Cronbach alpha coefficient was used to determine that some components returned a coefficient threshold greater than or lesser than 0.7. Previous researchers have advocated that Cronbach’s alpha value should be at least 0.7. However, Nandakumar [66] argues that 0.6 would suffice in exploratory research.
Table 4.
Principal component analysis result for the customer relationship management constructs.
Table 5.
Principal component analysis result for the business environment constructs.
Almost all the current study variables were adopted or adapted from the scales previously studied. Nonetheless, some of the measurement elements had different reliability aspects. They were refined and tested before the data analysis. Therefore, the scale items were purified and optimised using an exploratory principal component analysis (PCA) or a factor analysis of common scale generation and purification techniques described in previous studies [67]. PCA was also used to minimise the number of measures empirically while keeping as much original information as possible by taking into account the number of items that measured each variable. Unlike factor analysis, PCA assumes no particular variance and that the total variance is equal to the common variance. This assumption was necessary to simplify data by reducing the number of variables included in regression models. This view was endorsed by Ho [68], who stated there was a need to reduce the number of original variables to a smaller set of linear configurations that accounted for the majority of the variance.
However, Norušis [69] noted that more than one criterion is frequently employed to assess the number of factors to be retained by excluding components with eigenvalues less than one. For this criterion, all parameters must have a variance of one; therefore, all factors with a variance less than one were excluded. Cattell [70] suggested a scree test as an alternative solution. It searches for a position in which a reasonably large gap exists between values. Calculating the curve above the horizontal path from smaller eigenvalues would therefore reveal the total number of factors retained. In primary component analysis, variables are removed to minimise the magnitude, so the most important factors emerge first, followed by a number of minor factors, each making up a small fraction of the total variance. Visual judgment was used without regard to predictive value in this approach.
To assess the suitability of the data for further study, the Kaiser–Meyer–Olkin (KMO) method was used with the Bartlett sphericity test for each construct to determine data sampling adequacy (MSA).
where was the simple correlation coefficient between variables j and k, and was the partial correlation coefficient between variables j and k. The test established the minimum conditions that the data must meet to be deemed suitable for PCA. KMO values would range from 0 to 1, with a minimum of 0.50 suggested [71]. The KMO for the study constructs were all above 0.5, which was above the acceptable threshold. The Bartlett test [72], which tested whether the correlation matrix differed significantly from the identity matrix, indicates that the data are appropriate for analysis based on the significant relationship between the variables. The structure of the eigenvalues shown in Table 4 and Table 5 confirmed the validity and reliability of the constructs [73].
4.2. Correlation and Regression Analysis
Descriptions of the statistical results and results related to the correlations are provided in Table 6. Pearson’s analysis of the product–moment correlation coefficient between the variables examined in the study was used to test these hypotheses and further explore the relationship between the variables. The results of the correlations indicate that all business environment structures have significant correlations with organisational performance. It implies a strong link between environmental dynamism, competitiveness, complexity, and munificence and organisational performance measures. In absolute values, the correlation between latent variables was between 0.021 and 0.551.
Table 6.
A descriptive analysis of the variables employed in the study.
Financial, customer, and internal business process variables were strongly correlated with customer relationship management variables, while learning and growth variables were not. Customer acquisition, regain, and referral activities had the strongest correlation with customer perspective of the organisational performance (r = 0.552, p < 0.01).
The higher the coefficient of correlation, the stronger the connection between variables (Table 7). The highest correlation coefficient was found in the relationships between the customer relationship management activities (r = 0.807, p < 0.01). Significant, positive (r = 0.705, p < 0.01) relations between the customer perspective and financial perspective of the organisational performance were found.
Table 7.
Role of thump to correlation effect.
Table 8 indicates the relationships between business environment, customer relationship management, and organisational performance. Model 1 results show that only environmental munificence has a significant positive relationship with organisational performance’s financial measures out of the four environmental dimensions. In addition, customer acquisition, retention, and referral activities were found to be positively correlated with organisational financial performance. It also shows that a complex business environment acts negatively with financial performance but not significantly. In Model 2, the same variables (environmental munificence and customer acquisition, regain and referral activities) with environmental competitiveness have a significant positive link with customer perspective measures of organisational performance. The regressing the internal business process perspective shows a strong positive relationship with all variables except environmental complexity, which shows an insignificant negative effect, as reported in Model 3 in Table 8. Finally, Model 4 represents the regression relationships between the predictors above and organisational performance’s learning and growth perspective. Only environmental dynamism has a significant and positive relationship.
Table 8.
Regression analysis results between variables and performance measures.
5. Discussion
Modern competitive conditions require organisational performance to be improved via customer relationship management practices. This research aimed to uncover the link between customer relationship management practices, organisational performance, and the business environment.
The regression results indicate that Hypothesis 1 is supported. The business environment measures are significantly associated with all the measures of organisational performance. Environmental complexity was found to have negative but insignificant associated with organisational performance. It contradicts the findings of an earlier study by Oyewobi et al. [75] and McArthur and Nystrom [76], who found a significant relationships between subjective and objective performance measures with the above-mentioned variables.
The CRM practices construct was empirically examined, and it was discovered to have a positive impact on organisational performance. Thus, Hypothesis 2 can be accepted. The analysis results show that customer relationship management (customer acquisition, regain and referral activities) is significantly associated with organisational performance (financial, customer, and internal business process perspectives). As a result, CRM appears to deliver some of the benefits that organisations expect when they invest in CRM practices. However, the magnitude and direction of this relationship’s influence were smaller than expected. In other words, some practices are likely to improve performance, while others are unlikely. This study supports the findings of an earlier study that examined deconstructed measures of firm performance in connection with customer relationship management [6]. The low or no costs of referral management may contribute to the result. Using customer referral programs often necessitates a company providing positive experiences for its consumers and soliciting and streamlining the referral process. However, customer retention, cross-selling and upselling, and exit management have a significant yet negative relationship with the internal business process.
Based on financial and non-financial variables, these results reveal the relationship between CRM, environmental factors, and organisational performance. They show that customers will be more dedicated and loyal if they are valued, and as a result, organisational performance will be improved. Additionally, this study confirms that New Zealand’s environmental commitment impacts the performance of organisations in the construction sector. It implies that more resources can contribute to better organisational performance. Furthermore, it will ease the organisation’s burden of paying more attention to conserving the available resources and staying away from illegal actions, which could be costly and negatively impact their performance. These results are consistent with previous findings in different settings, such as those of [77].
The current study offers theoretical and managerial breakthroughs, as well as suggests many research applications. The theoretical contribution is that it provides an integrative framework to enterprises, which is a substantial development in the current literature of CRM practices and determinants of organisational performance. This study constructs and develops a conceptual model containing features such as CRM and the business environment. Even if some of the concepts described in this conceptual model may be familiar to practitioners, its usefulness lies in its ability to integrate these disparate ideas into a more comprehensive and holistic picture of organisational performance drivers.
This research has several important managerial implications. First and foremost, CRM practices can be clearly utilised to generate valuable customer information that can be used to improve organisational performance. Because traditional marketing methods for enhancing customer retention are expensive, the finest CRM practices provide organisations with a potential solution to address this essential issue. In different business environmental scenarios, CRM practitioners will adapt, design, and test integrative techniques. Second, measuring a company’s CRM regularly could aid managers in tracking improvements over time. Aside from the model’s applicability in the monitoring process, the CRM model’s components may help human resource managers build appropriate training programmes that can help increase the staff’s grasp of the tasks involved in CRM implementation. Finally, top management can use this framework to produce relevant and effective marketing plans and methods. Functional managers can also utilise the framework to establish explicit policies that promote CRM as a necessary and important company process rather than a burden on employees.
6. Conclusions
This study conducted a quantitative method to evaluate a framework that associated CRM and the business environment with sustainable organisational performance. The results showed that the business environment and customers’ acquisition, regain, and referral activities are critical determinants of sustainable organisational performance. Environmental dynamism, competitiveness, and munificence significantly affect organisational performance’s financial and non-financial perspectives. Customer acquisition, regain, and referral activities positively and significantly affect sustainable organisational financial, customer, and internal business process performance. Moreover, a significant negative effect was found between customer retention, cross- and upselling, and exit management activities and internal business processes. The impact of CRM activities may differ from the influence on specific components of a composite measure of business performance. In other words, interestingly, the significance of the variables differs based on the measurement of sustainable performance. The benefit of the findings to managers is that they must recognise that measuring organisational performance is a very complex construct. As a result, managers should be aware that the interaction between environmental variables and organisational design has varying effects on sustainable organisational performance, depending on which performance components are addressed.
The implications of the study for researchers and practitioners were discussed in a variety of ways. The analysis provided a foundation for future researchers interested in exploring the causes of organisations’ performance heterogeneity in the construction industry. This also has implications for construction management and practitioners when designing their work environment and customer relationship activities to achieve sustainable and superior results.
Nonetheless, the findings have limitations that could reduce the generalisability of the results. The first point to mention is that CRM processes change over time, and businesses may be at different stages of CRM deployment at different times. As a result, the organisations in the study’s sample were likely in different stages of their CRM development when the researchers conducted the cross-sectional study. Second, while the independent variables explain a significant variation in organisational performance, future research may include additional items in measuring organisational performance. It should consider efficiency variables, such as cost reductions in production, and effectiveness variables, such as the launch of new products, as components of organisational success. Third, despite the theoretical backing and empirical validity of the variables and constructs used, the analysis provides no guarantee that the measures used are faultless. Finally, the results’ generalisability could be limited due to sample size limitations, as a larger sample may have provided for more practical conclusions.
Author Contributions
Conceptualisation, H.E.A., M.P., and J.O.B.R.; methodology, H.E.A.; software, H.E.A.; validation, H.E.A., M.P., and L.O.; formal analysis, H.E.A. and L.O.; investigation, H.E.A.; resources, H.E.A.; data curation, H.E.A.; writing—original draft preparation, H.E.A.; writing—review and editing, M.P. and J.O.B.R.; visualisation, J.O.B.R.; supervision, M.P. and J.O.B.R.; project administration, J.T.; funding acquisition, J.O.B.R. All authors have read and agreed to the published version of the manuscript.
Funding
Not applicable.
Institutional Review Board Statement
The study was conducted according to the guidelines of the Declaration of Helsinki, and approved by the Ethics Committee of Auckland University of Technology (protocol code 20/104 and date of approval 10 June 2020).
Informed Consent Statement
Informed consent was obtained from all subjects involved in the study.
Data Availability Statement
The data presented in this study are available on request from the corresponding author.
Acknowledgments
The authors thank the respondents who participated in the data collection process for their time and efforts.
Conflicts of Interest
The authors declare no conflict of interest.
References
- Lee, F.H.; Lee, T.Z.; Wu, W.Y. The relationship between human resource management practices, business strategy and firm performance: Evidence from the steel industry in Taiwan. Int. J. Hum. Resour. Manag. 2012, 21, 1351–1372. [Google Scholar] [CrossRef]
- Oyewobi, L.O.; Windapo, A.O.; Jimoh, R.A.; Rotimi, J.O.B. Performance, resources and capabilities of construction organizations: The mediating role of competitive strategies. Int. J. Constr. Supply Chain. Manag. 2019, 9, 35–39. [Google Scholar] [CrossRef]
- ANZ. New Zealand construction Residential & Non-Residential Market Update. March 2017. Available online: https://comms.anz.co.nz/businsights/article/report.html?industry=Construction (accessed on 20 August 2021).
- NZ, S. New Zealand Business Demography Statistics. Available online: http://nzdotstat.stats.govt.nz/wbos/Index.aspx?_ga=2.200317870.1431429195.1630886987-1093434214.1620863696&_gac=1.254129786.1630889674.Cj0KCQjw1dGJBhD4ARIsANb6OdkcYsLLHN1dgNK3eQru31HTtpe9ihpIw8ngsrYwtXFd2S2c6EJ3-_saAlzzEALw_wcB (accessed on 20 August 2021).
- Rudd, J.M.; Greenley, G.E.; Beatson, A.T.; Lings, I.N. Strategic planning and performance: Extending the debate. J. Bus. Res. 2008, 61, 99–108. [Google Scholar] [CrossRef]
- Mumuni, A.G.; O’Reilly, K. Examining the impact of customer relationship management on deconstructed measures of firm performance. J. Relatsh. Mark. 2014, 13, 89–107. [Google Scholar] [CrossRef]
- Morgan, R.M.; Hunt, S.D. The commitment-trust theory of relationship marketing. J. Mark. 1994, 58, 20–38. [Google Scholar] [CrossRef]
- Reinartz, W.; Krafft, M.; Hoyer, W.D. The customer relationship management process: Its measurement and impact on performance. J. Mark. Res. 2004, 41, 293–305. [Google Scholar] [CrossRef]
- Dess, G.G.; Keats, B.W. Environmental Assessment and Organizational Performance: An Exploratory Field Study. In Academy of Management Proceedings; Academy of Management: Briarcliff Manor, NY, USA, 1987; pp. 21–25. [Google Scholar] [CrossRef]
- Balatbat, M.C.; Lin, C.Y.; Carmichael, D.G. Management efficiency performance of construction businesses: Australian data. Eng. Constr. Archit. Manag. 2011, 18, 140–158. [Google Scholar] [CrossRef]
- Frow, P.; Payne, A. Towards the ‘perfect’customer experience. J. Brand Manag. 2007, 15, 89–101. [Google Scholar] [CrossRef]
- Boulding, W.; Staelin, R.; Ehret, M.; Johnston, W.J. A customer relationship management roadmap: What is known, potential pitfalls, and where to go. J. Mark. 2005, 69, 155–166. [Google Scholar] [CrossRef]
- Osarenkhoe, A. Customer-centric strategy: A longitudinal study of implementation of a customer relationship management solution. Int. J. Technol. Mark. 2006, 1, 115–144. [Google Scholar] [CrossRef]
- Parvatiyar, A.; Sheth, J.N. Customer relationship management: Emerging practice, process, and discipline. J. Econ. Soc. Res. 2001, 3, 1–34. [Google Scholar]
- Payne, A.; Frow, P. A strategic framework for customer relationship management. J. Mark. 2005, 69, 167–176. [Google Scholar] [CrossRef]
- Verhoef, P.C.; Langerak, F. Eleven misconceptions about customer relationship management. Bus. Strategy Rev. 2002, 13, 70–76. [Google Scholar] [CrossRef]
- Ang, L.; Buttle, F. CRM software applications and business performance. J. Database Mark. Cust. Strategy Manag. 2006, 14, 4–16. [Google Scholar] [CrossRef]
- Camarero Izquierdo, C.; Gutiérrez Cillán, J.; San Martín Gutiérrez, S. The impact of customer relationship marketing on the firm performance: A Spanish case. J. Serv. Mark. 2005, 19, 234–244. [Google Scholar] [CrossRef]
- Mithas, S.; Krishnan, M.S.; Fornell, C. Why do customer relationship management applications affect customer satisfaction? J. Mark. 2005, 69, 201–209. [Google Scholar] [CrossRef]
- Jayachandran, S.; Sharma, S.; Kaufman, P.; Raman, P. The role of relational information processes and technology use in customer relationship management. J. Mark. 2005, 69, 177–192. [Google Scholar] [CrossRef] [Green Version]
- Srinivasan, R.; Moorman, C. Strategic firm commitments and rewards for customer relationship management in online retailing. J. Mark. 2005, 69, 193–200. [Google Scholar] [CrossRef]
- Ryals, L. Making customer relationship management work: The measurement and profitable management of customer relationships. J. Mark. 2005, 69, 252–261. [Google Scholar] [CrossRef]
- Enshassi, A.; Mohamed, S.; Abushaban, S. Factors affecting the performance of Construction projects in the Gaza Strip. J. Civ. Eng. Manag. 2009, 15, 269–280. [Google Scholar] [CrossRef]
- Dansoh, A. Strategic planning practice of construction firms in Ghana. Constr. Manag. Econ. 2005, 23, 163–168. [Google Scholar] [CrossRef]
- Harrison, E.F.; Pelletier, M.A. Foundations of strategic decision effectiveness. Manag. Decis. 1998, 36, 147–159. [Google Scholar] [CrossRef]
- Duncan, R.B. Characteristics of organizational environments and perceived environmental uncertainty. Adm. Sci. Q. 1972, 17, 313–327. [Google Scholar] [CrossRef] [Green Version]
- Lenz, R.T.; Engledow, J.L. Environmental analysis: The applicability of current theory. Strateg. Manag. J. 1986, 7, 329–346. [Google Scholar] [CrossRef]
- Mintzberg, H. An emerging strategy of “direct” research. Adm. Sci. Q. 1979, 24, 582–589. [Google Scholar] [CrossRef]
- Dess, G.G.; Beard, D.W. Dimensions of organizational task environments. Adm. Sci. Q. 1984, 24, 52–73. [Google Scholar] [CrossRef]
- Ward, P.T.; Bickford, D.J.; Leong, G.K. Configurations of manufacturing strategy, business strategy, environment and structure. J. Manag. 1996, 22, 597–626. [Google Scholar] [CrossRef]
- Ray, S. Environment-Strategy-Performance Linkages: A Study of Indian Firms during Economic Liberalization. Vikalpa 2004, 29, 9–24. [Google Scholar] [CrossRef] [Green Version]
- Cyert, R.M.; March, J.G. A Behavioral Theory of the Firm; Englewood Cliffs: Englewood, NJ, USA, 1963; Volume 2. [Google Scholar]
- Andrews, R.; Johansen, M. Organizational environments and performance: A linear or nonlinear relationship? Public Organ. Rev. 2012, 12, 175–189. [Google Scholar] [CrossRef]
- Chi, T.; Kilduff, P.P.D.; Gargeya, V.B. Alignment between business environment characteristics, competitive priorities, supply chain structures, and firm business performance. Int. J. Product. Perform. Manag. 2009, 58, 645–669. [Google Scholar] [CrossRef]
- Nandakumar, M.K.; Ghobadian, A.; O’Regan, N. Business-level strategy and performance: The moderating effects of environment and structure. Manag. Decis. 2010, 48, 907–939. [Google Scholar] [CrossRef]
- Dutton, J.E.; Fahey, L.; Narayanan, V.K. Toward understanding strategic issue diagnosis. Strateg. Manag. J. 1983, 4, 307–323. [Google Scholar] [CrossRef]
- Fayzollahi, S.; Shirmohammadi, A.; Latifian, B. The impact of environmental factors on total quality management and firm performance: Evidence from industrial enterprises in Iran. Int. Res. J. Appl. Basic Sci. 2013, 4, 3237–3245. [Google Scholar]
- Peteraf, M.; Di Stefano, G.; Verona, G. The elephant in the room of dynamic capabilities: Bringing two diverging conversations together. Strateg. Manag. J. 2013, 34, 1389–1410. [Google Scholar] [CrossRef]
- Ting, H.-F.; Wang, H.-B.; Wang, D.-S. The moderating role of environmental dynamism on the influence of innovation strategy and firm performance. Int. J. Innov. Manag. Technol. 2012, 3, 517. [Google Scholar] [CrossRef] [Green Version]
- Galbraith, J. Designing Complex Organizations; Addison-Wesley Longman Publishing Co: Boston, MA, USA, 1973. [Google Scholar]
- Lawrence, P.R.; Lorsch, J.W. Organization and Environment Managing Differentiation and Integration; Harvard Business School Press: Boston, MA, USA, 1967. [Google Scholar]
- Thompson, J.D. Organisations in Action: Social Science Bases of Administrative Theory; McGraw-Hill: New York, NY, USA, 1967. [Google Scholar]
- Oyewobi, L.O.; Windapo, A.O.; Bamidele James, R.O. An empirical analysis of construction organizations’ competitive strategies and performance. Built Environ. Proj. Asset Manag. 2015, 5, 417–431. [Google Scholar] [CrossRef] [Green Version]
- Keats, B.W.; Hitt, M.A. A causal model of linkages among environmental dimensions, macro organizational characteristics, and performance. Acad. Manag. J. 1988, 31, 570–598. [Google Scholar] [CrossRef]
- Wu, D. Measuring performance in small and medium enterprises in the information & communication technology industries. Ph.D. Thesis, RMIT University, Melbourne, Australia, February 2009. [Google Scholar]
- Kagioglou, M.; Cooper, R.; Aouad, G. Performance management in construction: A conceptual framework. Constr. Manag. Econ. 2001, 19, 85–95. [Google Scholar] [CrossRef]
- Bourne, M.; Mills, J.; Wilcox, M.; Neely, A.; Platts, K. Designing, implementing and updating performance measurement systems. Int. J. Oper. Prod. Manag. 2000, 20, 754–771. [Google Scholar] [CrossRef] [Green Version]
- Rigby, D.; Bilodeau, B. Management Tools & Trends; Bain & Company: Boston, MA, USA, 2013. [Google Scholar]
- Niven, P.R. Balanced Scorecard Step-By-Step: Maximizing Performance and Maintaining Results; John Wiley & Sons: Hoboken, NJ, USA, 2002. [Google Scholar]
- Kaplan, R.S.; Norton, D.P. The balanced scorecard: Measures that drive performance. Harv. Bus. Rev. 2005, 83, 172. [Google Scholar]
- Richard, P.J.; Devinney, T.M.; Yip, G.S.; Johnson, G. Measuring organizational performance: Towards methodological best practice. J. Manag. 2009, 35, 718–804. [Google Scholar] [CrossRef] [Green Version]
- Ankrah, N.A. An investigation into the impact of culture on construction project performance. Ph.D. Thesis, University of Wolverhampton, Wolverhampton, UK, 2007. [Google Scholar]
- Qualtrics Qualtrics; Qualtrics: Provo, UT, USA, 2020.
- Venkatraman, N.; Ramanujam, V. Measurement of business performance in strategy research: A comparison of approaches. Acad. Manag. Rev. 1986, 11, 801–814. [Google Scholar] [CrossRef] [Green Version]
- Lukas, B.A.; Tan, J.J.; Hult, G.T.M. Strategic fit in transitional economies: The case of China’s electronics industry. J. Manag. 2001, 27, 409–429. [Google Scholar] [CrossRef]
- Venkatraman, N.; Ramanujam, V. Planning system success: A conceptualization and an operational model. Manag. Sci. 1987, 33, 687–705. [Google Scholar] [CrossRef] [Green Version]
- Allen, R.S.; Dawson, G.; Wheatley, K.; White, C.S. Perceived diversity and organizational performance. Empl. Relat. 2008, 30, 20–33. [Google Scholar] [CrossRef] [Green Version]
- Parnell, J.A.; O’Regan, N.; Ghobadian, A. Measuring performance in competitive strategy research. Int. J. Manag. Decis. Mak. 2006, 7, 408–417. [Google Scholar] [CrossRef]
- Kaplan, R.S.; Norton, D.P. Using the balanced scorecard as a strategic management system. Harvard business review 1996. Available online: https://hbr.org/2007/07/using-the-balanced-scorecard-as-a-strategic-management-system. (accessed on 20 August 2021).
- Chang, H.-P. Relationships among Supply Chain Management, Strategic Alliances, and Organizational Performance with Implications for the Construction Industry. Ph.D. Thesis, Lynn University, Boca Raton, FL, USA, March 2010. [Google Scholar]
- Auh, S.; Menguc, B. Balancing exploration and exploitation: The moderating role of competitive intensity. J. Bus. Res. 2005, 58, 1652–1661. [Google Scholar] [CrossRef]
- Kabadayi, S.; Eyuboglu, N.; Thomas, G.P. The performance implications of designing multiple channels to fit with strategy and environment. J. Mark. 2007, 71, 195–211. [Google Scholar] [CrossRef] [Green Version]
- Marôco, J. Análise de Equações Estruturais: Fundamentos Teóricos, Software & Aplicações; Report Number, Lda: Pêro Pinheiro, Portugal, 2010. [Google Scholar]
- Hair, J.F.; Anderson, R.E.; Babin, B.J.; Black, W.C. Multivariate data analysis: A global perspective, 7th ed.; Pearson: Upper Saddle River, NJ, USA, 2010; Volume 7. [Google Scholar]
- IBM Corp. IBM SPSS Statistics for Windows, 27.0; IBM Corp.: Armonk, NY, USA, 2020. [Google Scholar]
- Nandakumar, M. Strategy Formulation and Implementation in Manufacturing Organizations-The Impact on Performance. Unpublished Thesis Submitted to Middlesex University in Partial Fulfilment of the Requirements for the Degree of Doctor of Philosophy. Ph.D. Thesis, Middlesex University Business School, London, UK, 2008. [Google Scholar]
- King, A.W.; Zeithaml, C.P. Competencies and firm performance: Examining the causal ambiguity paradox. Strateg. Manag. J. 2001, 22, 75–99. [Google Scholar] [CrossRef]
- Ho, P.H.K. Analysis of Competitive Environments, Business Strategies, and Performance in Hong Kong’s Construction Industry. J. Manag. Eng. 2016, 32, 04015044. [Google Scholar] [CrossRef]
- Norušis, M.J. IBM SPSS Statistics 19 Statistical Procedures Companion; Prentice Hall: Upper Saddle River, NJ, USA, 2012; Volume 496. [Google Scholar]
- Cattell, R.B. The scree test for the number of factors. Multivar. Behav. Res. 1966, 1, 245–276. [Google Scholar] [CrossRef] [PubMed]
- Field, A. Discovering Statistics Using IBM SPSS Statistics; Sage: London, UK, 2013. [Google Scholar]
- Tabachnick, B.G.; Fidell, L.S. Using Multivariate Statistics: International Edition; Pearson2012: London, UK, 2013. [Google Scholar]
- Haspeslagh, M.; Eeckloo, K.; Delesie, L.B. Validation of a new concept: Aptitudes of psychiatric nurses caring for depressed patients. J. Res. Nurs. 2012, 17, 438–452. [Google Scholar] [CrossRef]
- Dancey, C.P.; Reidy, J. Statistics without Maths for Psychology; Pearson Education: London, UK, 2007. [Google Scholar]
- Oyewobi, L.O.; Windapo, A.O.; Rotimi, J.O.B. Environment, competitive strategy, and organizational characteristics: A path analytic model of construction organizations’ performance in South Africa. Can. J. Adm. Sci. 2016, 33, 213–226. [Google Scholar] [CrossRef]
- McArthur, A.W.; Nystrom, P.C. Environmental dynamism, complexity, and munificence as moderators of strategy-performance relationships. J. Bus. Res. 1991, 23, 349–361. [Google Scholar] [CrossRef]
- Eisenhardt, K.M.; Schoonhoven, C.B. Organizational growth: Linking founding team, strategy, environment, and growth among US semiconductor ventures, 1978–1988. Adm. Sci. Q. 1990, 35, 504–529. [Google Scholar] [CrossRef]

Publisher’s Note: MDPI stays neutral with regard to jurisdictional claims in published maps and institutional affiliations. |
© 2021 by the authors. Licensee MDPI, Basel, Switzerland. This article is an open access article distributed under the terms and conditions of the Creative Commons Attribution (CC BY) license (https://creativecommons.org/licenses/by/4.0/).