Article

A Life-Cycle Approach to Integrate Environmental and Mechanical Properties of Blended Cements Containing Seashell Powder

by
Fatemeh Soltanzadeh
1,*,
Ali E. Behbahani
1,
Eduardo N. B. Pereira
1 and
Carlos A. Teixeira
2
1
Institute for Sustainability and Innovation in Structural Engineering, Department of Civil Engineering, School of Engineering, University of Minho, 4800-058 Guimarães, Portugal
2
Centre for the Research and Technology of Agro-Environmental and Biological Sciences (CITAB), Universidade de Trás-os-Montes e Alto Douro (UTAD), 5000-801 Vila Real, Portugal
*
Author to whom correspondence should be addressed.
Sustainability 2021, 13(23), 13120; https://doi.org/10.3390/su132313120
Submission received: 2 October 2021 / Revised: 5 November 2021 / Accepted: 17 November 2021 / Published: 26 November 2021
(This article belongs to the Special Issue Sustainable Approaches for Developing Concrete and Mortar)

Abstract

:
The adverse consequences of producing ordinary Portland cement (OPC) on the environment have introduced cement production as the fourth largest source of anthropogenic carbon emissions after petroleum, coal, and natural gas. Managing and reducing the environmental concerns regarding the impacts of cement production on the environment, namely the depletion of non-renewable fuel resources, consumption of natural raw materials, and releasing huge amounts of CO2 into the atmosphere should be, therefore, one of the key priorities of the cement industry. Application of locally available minerals and wastes that can be blended with OPC as a substitute could considerably reduce the environmental impact. The present study evaluates the potentiality of waste seashell to be used as an additive in the production of blended cement through a modified life cycle approach integrating environmental and mechanical performances. In this regard, 34 cements consisting of different blends of OPC, seashell powder (within the range of 4–30% by OPC mass), and natural pozzolan (up to 30% by OPC mass) were tested to identify the optimal dosage of OPC substitution. Environmental impacts of the cements were assessed through life-cycle analysis. The possibility of mitigating the carbon dioxide emissions in the production of cements, with similar mechanical performance compared to that of OPC, was evaluated by considering both the mechanical and environmental results. The outcome of this study introduced more environment-friendly and sustainable options for future cements.

1. Introduction

The current share of cement industry on global anthropogenic CO2 emissions is about 9% [1], which is considered as a significant threat to the global sustainability. In 2009, the International Energy Agency and World Business Council for Sustainable Development proposed four CO2 emissions and mitigation scenarios that cement industry can implement [2]: equipment efficiency, alternative fuels, carbon capture and storage (CCS) and clinker substitution. The first two scenarios may become possible at those countries levied tax on the carbon footprint [3], while the technology to implement CCS, at its current stage of development, is still very expensive [4]. Recent research (e.g., [4,5]) commissioned by the United Nations Environmental Program Sustainable Building and Climate Initiative (UNEP-SBCI) revealed that there exist two main strategic paths which can substantially contribute toward reductions in CO2 emissions related to cement production/utilization, eventually decreasing the demand for costly financing in CCS technology over the next 30 years: (i) utilizing low-CO2 supplements (i.e., Supplementary Cementitious Materials, SCM, and/or well-dispersed inert fillers) as partial clinker replacement, and (ii) more efficient concrete mixture proportioning.
The cement industry traditionally utilizes calcium carbonate (CaCO3) as a raw ingredient for producing the Portland cement, and as a source of SCM for formulating blended cements [6]. Currently the global demand of the calcium carbonate relies mainly on the stream of quarried limestone rocks, whose supply is not known to be sustainable (due to the depletion of natural resources and disruption of ecosystems upon inconsiderate quarrying activities). When limestone is used in cementitious materials, changes in the capillary porosity occur due to several physical effects such as the dilution effect, filler effect and heterogeneous nucleation. In addition, calcium carbonate (CaCO3) accelerates the hydration of C3S compound [7]. As an alternative for the limestone rock, waste seashells can be recycled as a type of renewable bio-minerals, owing to their chemical compositions including more than 90% (by mass) CaCO3 [8,9,10,11]. Utilizing seashell powder (SHP) as clinker replacement provides a means for the economic and ecological disposal of, at least, 10–20 million tons of post-consumer shell residues per year [12]. Apparently, the partial replacement of clinker by SHP in the mixture of binary cements is a strategy always associated with the reduction of CO2 emissions; the greater the replacement ratio, the lower the environmental burden of the produced cement. However, in the blended cements containing seashell powder, the filler and heterogeneous nucleation effects, provided by SHP, compete with the clinker dilution effects, which results in a decrease of the mechanical strength. For this reason, there exists an optimum SHP dosage that can potentially lead to better (or at least similar) mechanical strength properties in comparison to those of the pure ordinary Portland cement (OPC) [8,9,13,14,15,16]. Thus, to derive the optimum mixture of the blended cement, the dosage of SHP should be designed by means of consolidated approaches capable of exploiting/optimizing both the environmental and the mechanical performances.
Previous work in the domain of combined environmental and mechanical performances includes the work of [17], and later [18], who proposed two indexes for separate representing the efficiency of binder, and carbon dioxide emitted due the concrete mixture. Both types of indexes had mechanical performance, compressive strength, as a functional unit. Benchmark limit values were derived for these indexes, based on the literature review, to allow for the decision making amongst mixture alternatives. Habert and Roussel [19] argued that the mechanical performance and environmental burden of a generic concrete are inextricably linked. They showed that enhancing the mechanical strength of concrete, even if it is associated with an increase in CO2 emission per unit volume of concrete, resulted in reduction of the total CO2 emissions for the entire structure (due to lower volume of total concrete needed in the case of using high performance concrete).
Another category of methods is based on some eco-mechanical ratios (EMR), in which an environmental performance index (EPI) stands as the numerator, while an index of mechanical performance (MPI) represents the denominator (i.e., EMR = EPI/MPI). A simplified version of this approach [20,21] assumes CO2 pollution, and compressive strength as EPI and MPI, respectively. In the eco-mechanical ratio proposed by Fantilli and Chiaia [22], the work of fracture in compression (area under “compressive stress–Inelastic displacement” curve) was considered as MPI. Chiaia et al. [23] defined a logarithmic function to integrate works of fracture in both compression and flexure (the area under the flexural stress–crack mouth opening displacement from three point bending test according to RILEM TC 162-TDF [24] into a single MPI. Khodabakhshian et al. [25] incorporated a normalization/weighting technique to calculate a non-dimensional MPI (or EPI) based on the contribution of an arbitrary number of mechanical (or environmental) performance parameters.
Previous studies on the application of seashell powder as partial cement replacement concerned mainly on the environmental footprint of the formulated cement, overlooking the fact that lower mechanical properties may lead to increase the overall environmental impact of the entire structure (due to larger volume of concrete needed to deliver a certain mechanical performance target). Thus, finding proper blends of OPC and seashell powder, optimized in term of both environmental and mechanical considerations, is still a challenge. Furthermore, there is a lack of information regarding eco-mechanical efficiency (mechanical and environmental performance) of SHP (as cement additive) in comparison to that of the traditional SCMs, which are commonly used by the cement industry. This information seems crucial for identifying the most appropriate mitigation strategies that eventually brings both environmental and mechanical improvements. Responding to these two concerns were the main objectives of this study. In the present paper the potentiality of waste seashell to be used as an additive in the production of a more environmentally friendly blended cement is evaluated. To this aim, the optimal dosage of SHP for replacing the OPC were identified by testing number of 34 cements consisting of different blends of OPC, seashell powder (within the range of 4–30% by OPC mass) and natural pozzolan (up to 30% by OPC mass). Furthermore, this study introduced and validated a novel approach to evaluate the sustainability of the cement, by taking into account not only the environmental impact, but also the material performance.

2. Experimental Program

2.1. Introduction of the Developed Blended Cements

This section introduces 34 different types of blended cements whose data (mixture ingredients, processing followed for each ingredient, relevant transportation and mechanical behavior of the cements) are used as input for a modified life cycle approach integrating environmental and mechanical performances (MLCAiEM). These cements can be categorized, in terms of their mixture, into three distinctive groups: cements with binary blends of OPC and seashell powder (up to 30% by mass) (group G1), the ones with binary blends of OPC and natural pozzolan powder (up to 30% by mass) (group G2), as well as those with ternary blends of OPC, seashell powder (up to 7% by mass) and natural pozzolan powder (up to 30% by mass) (group G3). Relevant details of these cements are presented in Table 1, as well as [9]. The binary cements are addressed with either “G1-SHPi” or “G2-NPPi” designation form. The letters “G1” or “G2” in the introduced labels indicate the group whose cement is addressed. The index “i” shows the mass percentage of OPC substituted by either SHP or NPP. All the blended cements of the third group are introduced by a label “G3-NPPj-SHPi”, where “G3” refers to the third group, “NPPj” implies “j” percentage of OPC is replaced by NPP, and “SHPi” in this label shows “i” percentage of OPC is substituted by SHP.
The maximum dosage of seashell powder in the cement mixtures was 30% to respect the recommendation of EN 197-1 [26] for maximum limestone content of Portland-limestone cements (35% by mass). Relatively large numbers of cement replacement levels (10 different replacement dosages within the range of 4–30%) were tested in the group G1 to increase reliability of the MLCAiEM for finding the optimal SHP dosage. The natural pozzolan powder of volcanic origin (designated as NPP), used in groups G2 and G3, is a category of SCMs which usually requires relatively minor processing (mainly grinding) to be used as a cement additive. Thus, NPP is traditionally a SCM of choice for several cement industries [20]. Comparing cement of group G1 with those of G2 (through the information provided by MLCAiEM) would give an insight into future cements with higher eco-mechanical efficiency. The maximum replacement limit for the cement with binary blend of OPC and NPP, the group G2, was 30% to provide a comparison baseline between cements of groups G1 and G2. The cements of the group G3 are developed to find a suitable combination of seashell powder and natural pozzolan that would improve the properties of the ternary cement more than when these materials would be incorporated separately in binary blend with the OPC (i.e., groups G1, and G2).

2.2. Materials and Methods

Cockles in the family Cardiidae, available abundantly along coastal lines of Chabahar district (situated in south part of Sistan and Baluchestan province of Iran) were utilized in this study. The used seashell includes two symmetric valves with thickness of around 2.5–4 mm, prominent umbones, and strong radial ribs. The size of the seashell particles before grinding was about 25 to 50 mm (see Figure 1). The seashells (200 kg) were cleaned twice (with water in a tank of about 1000 L capacity), and then dried in a drying oven (Vinci Technologies SA) at a temperature of 90 ± 5 °C for 12 h. Later, the seashell sample was crushed using a steel drum rotating grinder (Tencan Roll Ball Mill with 12 steel balls inside) with rotational speed 40 rpm for 2 h, and further pulverized by a grinding mill (Retsch BB 500) until the seashell particles reach to the specific surface area of 3800 cm2/g (the processing time for the later phase was about 1 min for 1 kg of input materials). Cement used in this study is Type 1 Portland cement, in accordance with ASTM C150 [27], which is called as ordinary Portland cement (OPC) hereafter. The specific surface and density of the OPC sample used in the present study were 3118 cm2/g, and of 3.12 g/cm3, respectively. The compressive strength of this cement at 3 days; 7 days and 28 days was evaluated as 19.8, 22.6, and 32 MPa, respectively, using a total number of 12 cubic specimens with the side dimension of 50 mm (four specimens were tested at each age). Pumice-type natural (volcanic) pozzolan from Taftan Mountain, located at the southeast of Iran, was used in this study. Processing for this material includes preliminary crushing (with a jaw stone crusher), drying (Vinci Technologies SA) at a temperature of 90 ± 5 °C for 12 h, secondary crushing (using Tencan Roll Ball Mill for 2 h) and further pulverizing (Retsch BB 500) until the material attains the specific surface area of about 4700 cm2/g (the fineness level usually adopted by the Kash Cement Company, KCC, plant). Density of the natural pozzolan powder (NPP) was 2.5 g/cm3. Chemical compositions of SHP, NPP and OPC, used in this research, were investigated using X-ray fluorescence spectroscopic (XRF) analysis, as can be fined in [15].
The blended cements were studied in terms of density (in compliance with ASTM C188 [28]), fineness (according to ASTM C430 [29]), specific surface (as per ASTM C204 [30]), initial and final setting time (in accordance with ASTM C204 [30] chemical composition, and water demand. These cements were divided into three groups (namely G1, G2, and G3) according to the approach detailed in the Section 2.1.
Mortar samples were produced using the cements, and their mechanical strengths were investigated by executing compressive strength test, according to ASTM C109 [31] guideline. A total number of 140 cubic specimens with the side dimension of 50 mm were prepared to evaluate compressive strength of the mortars at the ages of 28 days. Limestone sand with maximum size of 2 mm was utilized as a fine aggregate for producing the mortars. For all the mortar samples the ratio of cement-to-sand was 1:2.75, as recommended by ASTM C348 [32]. The water content (water demand) for each mortar was obtained by attaining a flow of 110 ± 5% with 25 drops using the flow table (ASTM C109 [31]; ASTM C348 [32]).

3. Environmental Assessment

One of the well-established methodologies, implemented to measure the environmental performances of products and realize the environmental sustainability of the production chain, is Life Cycle Assessment (LCA). This method, which has proven to be a robust tool with significant potential for industrial process improvement, used to prevent sub-optimization in the manufacturing of more eco-friendly cement products [33,34]. The LCA is a structured, holistic and standardized method [35,36] which quantifies emissions, resource depletion, environmental and health impacts associated to a product along its life cycle (JRC 2016) [37]. Caution must be exercised in the use of LCA, as the exclusive decision support tool, since this method evaluates a product only from the environmental point of view. Being specific to the case of cementitious materials, the LCA can potentially compare several possible alternative solutions, which bring similar mechanical performance but differ in terms of environmental burdens associated to the life cycle of the product.
This section (Section 3) presents an LCA executed to evaluate the environmental impacts of manufacturing binary/ternary cements with additive of waste seashell powder. As a wide range of SHP dosages were applied to replace OPC in developing the blended cements, the LCA of these cements clearly demonstrated the effect of using recycled waste SHP (for developing cement) on environmental impacts. The results of this assessment are then combined, in Section 4, with the mechanical performance of the formulated cements to de-rive the main objectives of the study (already addressed in Section 1 and Section 2.1). The outcome of the study represented in Section 3 and Section 4, would answer how environment-friendly and sustainable are the formulated cements, compared to the OPC, in terms of both environmental and mechanical performances (to be considered as future cements).
LCA was divided into four phases, as follows: goal and scope definition of the LCA (objectives, system boundaries, and functional unit); life cycle inventory analysis (collecting the data necessary for quantifying pollutants, emissions or impacts associated to the manufacturing of the different solutions analyzed); life cycle impact assessment (inventory converted into environmental impact indicators); interpretation (critical review of the results).

3.1. Goal and Scope Definition of the LCA

The main goal of the LCA study was to evaluate the environmental impact of the various mortar compositions made of the proposed blended cements (also called as alternatives). The LCAs were performed in compliance with the international standards ISO 14040 [35], and ISO 14044 [36] using the GaBi 6.0 software. Cradle-to-gate was selected as the system boundary, for the life cycle assessment, considering all production phases including the extraction of raw materials (i.e., the cradle), processing (cement, natural pozzolan, seashell powder, sand), transportation of materials, and mixing of the mortar materials (i.e., the gate), as illustrated in Figure 2. Since this LCA study ends once the mortars are ready to be delivered for casting, the use (structural functionality) of the mortars are excluded from the boundary of the analyzed system. The functional unit for this analysis was defined as one cubic meter of ready-mixed mortar, which is the basis for comparison throughout the Section 4.

3.2. Life Cycle Inventory

In this context, a detailed life cycle inventory was created based on a combination of on-site-survey data and average data from one of the most internationally accredited generic environmental databases (Thinkstep, 2015) [38]. Production procedure, location-related details and calculations involved with life-cycle inventory of each mortar ingredient (OPC, SHP, NPP, sand and water) were allocated as follows:
Ordinary Portland cement (OPC) was delivered from KCC plant in Khash, Iran. The plant has installed production capacity of about 1 million tons of different types of cement per year. This plant in operation today has both energy and environmental management systems which are ISO 150001 (International Organization for Standardization, 2011) [39] and ISO 14001 (International Organization for Standardization, 2011) [40] certified. These ISO-compliant systems ensure that the plant follows a recognized framework for developing an effective energy reduction and environmental protection action plans. Furthermore, the integrated management system of the plant covers the specific requirements with regard to quality, ISO 9001 (International Organization for Standardization, 2011) [41], as well as occupational health and safety protection, OHSAS 18001 [42]. Since the plant follows a standardized framework for manufacturing the cements (as described before), it was assumed that the plant facility performs in terms of input (e.g., energy, and material) and output (e.g., emission and waste) similar to other certified plants worldwide, with marginal deviation. Based on the following argument and taking into account the lack of publicly available specific data for the input/output data of the KCC plant, the inventory data related to producing OPC was gathered from the generic data available at the Thinkstep GaBi life-cycle inventory datasets. Saudi Arabian (SA) Portland cement data was used for this LCA study, as this was the only available dataset for those regions with similar energy grid mix, processing technologies of cement plants, and the geographical variations, when compared to the ones applicable for the KCC plant. This data set is based on primary data from internationally adopted production processes, by taking into account the regional electricity grid mix (SA: Grid mix). The grid mix of electricity power in SA, for the year 2015, was based on fossil fuel combustion (55.8% natural gas, and 44.2% oil). For the same year, the grid mix of Iran consisted of 67% natural gas, 31% oil (98% based on fossil foil) and 2% from CO2 free resources [38,43]. From this information, it can be verified that the “SA: Grid mix” is a reasonable alternative for representing the Iranian energy grid mix. The distance between the KCC plant and the mortar production laboratory (MPL) is estimated to be 198 km, based on the Google Maps® application. This transportation was modeled using a diesel driven truck of 28–32 t payload capacity (GLO: Truck, Euro 5). The truck was fueled with diesel using the process “EU-28: Diesel mix at filling station ts”. The described choices for the electricity grid mix, fuel, and truck were set as default option for the SHP, and NPP as well.
Seashells powder (SHP) was produced according to the protocol described in Section 2.2 at the laboratory of KCC plant. Later SHP was transported to the MPL for fabrication of the mortar specimens. Raw seashells (RSH) were provided from the municipality of Iranshahr (Iran) that collected this waste from coastal lines of Chabahar district (without any cleaning and/or processing). The RSH was considered as a waste, without economic value, therefore no flows were allocated for its production. Due to lack of data about transporting RSH to the municipality, this process was excluded from the system boundaries. Two separate transportation processes (one from Iranshahr to KCC plant, 127 km, and the other from KCC to MPL, 198 km) were assigned as input for SHP. Electricity consumption for producing SHP was calculated based on nominal power of drying oven (2 kW), steel drum rotating grinder (0.75 kW) and the jaw grinder (7.5 kW), by taking to account their relevant time of processing (for detail see Section 2.1). The process of producing SHP is displayed in a simplified way in Figure 2 (within the boundary marked in red color). This process was included in the LCA analysis of the mortar made of the developed blended cements.
Natural pozzolan powder (NPP) of volcanic pumice nature, used in this study, was mined from a site (located in proximity of Taftan Mountain and about 70 km away from the KCC plant) by open mining process. Raw pumice was scraped loose, since most deposits were unconsolidated, then pushed to a jaw stone crusher unit (with 5.5 kW rated power) for preliminary crushing of rocks into maximum particle size of about 70 mm. The processing rate for this machine was 3 tons per hour. The pumice was then trucked to the KCC plant for additional drying, grinding and pulverizing processes. Electricity use for processing the NPP was determined in an approach similar to the one introduced for the SHP. Since the mining was carried from the surface (i.e., deposits have relatively low overburden), the equipment used for the quarrying activities was limited (mainly) to bulldozers. The emissions of these bulldozers were considered as those reported by Havukainen et al. [44]. For transportation purposes, it was assumed that the truck with 28–32 t payload capacity (GLO: Truck, Euro 5) has delivered the pumice to KCC plant and later the NPP was transported to the MPL over 268 km of driving distance in total. The production process of NPP, considered in the LCA analysis of the mortar, is schematically illustrated in Figure 2 (within the boundary marked in blue color).
Sand, with the maximum grain size of 2 mm, was used as a fine aggregate for fabricating the mortars. The specific gravity of the sand was evaluated as 2.65 in the present study. Application of the sand for developing the mortar was modeled using a crushed sand with a grain size of 0–2 mm (EU-28: Crushed sand grain 0–2 mm) in Gabi software. The sand transported by a truck of 28–32 t payload capacity (GLO: Truck, Euro 5), fueled with diesel (EU-28: Diesel mix at filling station ts) from a close sand quarry (17 km) to the MPL.
Water, used for all the mixtures, was potable tap water. The dataset related to the German tap water mix (DE: Drinking water mix) was considered to represent the Iranian tap water mix, since the second one was not available as background data. About 70% of the German tap water mix stems from groundwater, and the rest is (30%) from surface water. This proportion is 59.5% and 40.5% (groundwater and surface water shares, respectively) for tap water mix of Iran. This similarity justifies the choice made for representing the mortar water.

3.3. Impact Assessment

The impact assessment phase of the LCA study defines the contribution of emissions, quantified in the life-cycle inventory for producing one cubic meter (i.e., the functional unit) of each mortar, in a number of environmental impact categories (EICs). In this phase, the emissions are grouped into several environmental classifications and multiplied by characterization factors, whose values may change based on the adopted impact assessment method, to give a single indicator value representing the potential effect of the relevant environmental impact category (EIC) on the ecosystem. This process can be formulated as:
( E I C   i n d i c a t o r ) i = j ( E j × C F i , j )
where (EIC indicator)i stands for the indicator value (per functional unit) for i-th environmental impact category, Ej refers to the release of emission “j” (classified under the i-th environmental impact category) per functional unit, and CFi,j implies the characterization factor for emission “j” contributing to i-th environmental impact category. All the symbols introduced in the paper are also identified in Table A1 (Appendix A).
The GaBi Software allows users to select from several impact assessment methods, including the midpoint method “CML 2001” (Guinee et al. 2001a, b, and c) which was used for this study. This approach was chosen because of its sound scientific basis, relatively wide range of emission- and resource-related impact categories available, and its reputation within the scientific community. Six impact categories (EICs) from those of the CML 2001 approach, which are easily communicated and representative of the major environmental impact concerns [45,46,47,48], were chosen for this study: global warming potential (GWP); acidification potential (AP); eutrophication potential (EP); abiotic depletion potential for fossil resources (ADP); Ozone layer depletion (ODP); photochemical ozone creation potential (POCP). The GWP is related to the emission of greenhouse gases (mainly CO2) to the atmosphere. Fate and deposition of acidifying substances are represented by the AP indicator. The EP is defined as the potential to cause over-fertilization of water and soil, which can result in excessive growth of biomass. The ADP concerns with the depletion of non-renewable resources of energy such as fossil fuels. The potentiality of emitted substances to destroy ozone can be seen through the ODP indicator. The POCP indicates the potential of emitted substances to produce ground level ozone.

3.4. Interpretation

The results obtained for the environmental impacts for producing 1 kg of different types of binder, namely SHP, NPP, and OPC, are presented in Table 2. Comparison of the results shows that the development of SHP has led to the lowest environmental impact, whereas the highest environmental impact (except for ODP) was related to the manufacturing of OPC. The highest values of the environmental impacts associated to the production of all three binders were related to the impact categories ADP and GWP, respectively. Among all the three introduced binders, the OPC was responsible for the development of the highest proportion of GWP and ADP. This can be attributed to the emissions during the production of clinker, which forms about 93% to 97% of OPC composition, through calcination of the raw limestone at 1000 to 1450 °C temperature in a cement kiln [49]. In this process calcium carbonate decomposes and CaO and CO2 are produced [50]. From the greenhouse gas emission perspective calcination is highly important, since it typically causes more than 50% of total CO2 emissions formed by cement production. The large share of the remaining emissions originates from the combustion of the fuels in the kiln [34]. The production of OPC also requires the consumption of natural resources, such as limestone, iron ore, and gypsum, which leads to the increase of ADP impact. The environmental impacts resulting from the production of SHP and NPP were basically related to the consumption of fuel for transportation purposes and consumption of electricity by different machinery used in the process of the development of the materials. The ODP impact, mainly produced by consumption of electricity and fuel, for extraction and processing NPP has shown a higher value (in Table 2) compared to the ODP impact of producing SHP and OPC. However, the ODP value (ranged between 1.50E-16 to 4.87E-16 kg R11 eq) is relatively low in case of producing all the three binders. For development of SHP, the lowest environmental impact, produced due to the transportation, came from the POCP. The POCP impact was quantified as a negative value, due to the NO emissions which occur during transportation processes. According to CML 2001, the NO emissions have a negative characterization factor, which caused the transports to appear with negative POCP values. Some methods, likewise, ReCiPe, set this characterization factor to zero.
Addition to the quantification of the environmental impact of developing the binders, the impact of using each of the introduced binary and ternary cements (produced by SHP and NPP) for tailoring 1 m3 mortars is compared with that of produced by making 1 m3 mortar made of OPC in Table 3. As expected by considering the results of analyzing the emissions made by producing 1 kg OPC, NPP, and SHP, the development of the mortar solely by using OPC caused the highest environmental impacts in all the categories with exception of ODP compared to that of mortar made of the blended cements. The ODP impact has increased (in the range of 3.2% to 7.2%) by increasing the NPP dosage in developing the mortar. As it was already mentioned above, the high environmental impact of the reference mortar compared to the mortar made of the blended cements can be justified by the significant energy consumption and CO2 emissions produced during the process of calcination of limestone and fuel combustion in the kiln. Thus, by increasing the dosage of the OPC substitutions, regardless of the type of additive used (i.e., SHP and/or NPP), the potential environmental impacts of developing mortar (except ODP) have decreased. When comparing the mortar tailored using binary cements of the first group, G1-SHPi, with those produced using the second group of binary cements, G2-NPPi, it is observed that the replacement of the same dosage of OPC with SHP has provided a similar or marginally higher reduction in the environmental impacts. For instance, the application of G1-SHP10 and G2-NPP10 cements for developing mortar has similarly reduced 7% GWP impacts in comparison with that of the mortar made of OPC. The ADP impact has reduced up to 5% and 4.5% by means of replacing OPC with respectively G1-SHP10 and G2-NPP10 cements.
ADP and GWP were respectively the highest environmental impacts of developing all the mortars. Figure 3, Figure 4 and Figure 5 present the breakdown of these main two impact categories along the supply chain of mortar production. These figures indicate that the main source of emissions was associated to the OPC application (73% to 84%), followed by embodied emissions from sand quarrying (8% to 11%), electricity generation (7% to 12%) and road transport (1.8% to 2.7%). It is clear that the actual amount of greenhouse gas emissions (i.e., those produced by the development of the mortars made of OPC), can be avoided in a higher percentage by employing ternary cements, contained of both NPP and SHP substitutionary materials (for making mortars), compared to that of binary ones (with a similar dosage of NPP or SHP). As an example, a side-by-side comparison of GWP impact of developing mortars using OPC, G1-SHP6, G2-NPP10, and G3-NPP10-SHP6 is presented in Figure 6. In comparison with the GWP impact of the mortar made of OPC, application of the G3-NPP10-SHP6 cement has reduced GWP to 12%, whereas 7% and 4% reduction in GWP was found in the case of using respectively G2-NPP10 and G1-SHP6 cements. However, it is worth noting that application of G3-NPPj-SHPi cements produces marginally a higher ODP impact compared to that of produced using the binary ones, with a similar dosage of NPP or SHP (see Table 3), since in the development of the G3-NPPj-SHPi cements, a higher amount of energy was consumed to produce a higher dosage of OPC substitutionary materials (i.e., NPP and SHP).
The environmental impact assessment resulting from the previously reported LCA study has its own importance. However, it is obvious that a trade-of exists between a decreasing environmental impact associated to the reduction of OPC usage, and the consequent decreasing of the mechanical performance. These two competing factors have to be considered simultaneously, in order to allow the objective identification of the optimal solution. A material that generates greater environmental impacts per kg, or per m3, is not necessarily the less sustainable. If its performance is much greater and it allows to accomplish the same function with a much smaller quantity, it may lead to a final overall environmental impact that is lower than the alternative counterparts, as discussed previously in the introduction. For a systematic and quantitative comparison among the alternative cements, the environmental impacts are normalized in the next section with respect to the mechanical properties of the introduced cements.

4. Modified Life Cycle Approach Integrating Environmental and Mechanical Performances (MLCAiEM)

As per Eurocode 2 (CEN 2004) [51], fib Model Code (fib 2010) [52], and RILEM TC 162-TDF [24], the most relevant parameters, representing the mortal/concrete mechanical performance for the structural designing purposes, are compressive and tensile strength as well as ductility measures (e.g., post-cracking flexural capacity, compressive post-peak energy absorption). Conventional concretes and mortars, irrespective of their compressive strength, have relatively low energy dissipation capability [53,54,55], thus application of ductility-related measures as indicators of mechanical performance is more appropriate for fibrous concrete compositions which do not show brittle post-cracking residual strength [56,57,58,59]. On the other side, there are some limitations and difficulties in performing direct tension tests (as the most reliable to characterize tensile properties) [60,61], which usually leads to higher viability than the one of compressive testing, especially for cement quality control purposes. Due to above reasoning, compressive strength, characterized at the age of 28 days after casting as per ASTM C109 [31] was chosen in this study as the measure of mortar mechanical performance.
In the proposed approach environmental impacts of a mortar volume, able to deliver a reference level of performance translated into uniaxial compressive load (Fref), is calculated by adopting two concepts: original and fictitious specimens (OS and FS respectively). Applied uniaxial load corresponding to compressive strength of the reference mortar (the one made of pure OPC as cement) was considered as Fref (i.e., Fref = 80,075 N). OS is referred to the cubic specimen with the side dimension of 50 mm (i.e., the specimen size used for characterizing compressive strength of all the mortar mixes). Volume, cross-section, and height of this specimen geometry are respectively indicated by VOS, AOS, hOS. A generic alternative (mortar) whose compressive load based on OS configuration ( σ c , i k × AOS) is superior to Fref is known to have higher mechanical performance than the reference mortar (and vice versa). For each mortar mix a fictitious prismatic specimen (not subjected to experimental development) was defined whose cross-section (AFS) is a free parameter, varying with the type of alternative mortar. The value of hFS remains equal to hOS, thus it would not change for different mortar mixtures. The value of AFS is obtained individually for each mortar mix based on the following equation:
( A F S ) k = F r e f / σ c , 28 k
where ( A F S ) k is cross-section area of the fictitious specimen corresponding to the alternative mortar k, while σ c , 28 k is uniaxial compressive strength of alternative mortar k at the age of 28 days. It should be noted that Fref remains fixed for all the mortar compositions.
For an alternative mortar k, Equation (2) defines cross-section area of a fictitious prismatic specimen, made of the same mortar (mortar k with compressive strength of σ c , 28 k ), by assuming the reference compressive load (Fref) is sustained. This gives the volume of FS which is expressed by notation of VFS. Apparently VFS is higher than VOS if the compressive load based on OS configuration is lower than load of the reference mortar (Fref). By changing the functional unit of LCA study from 1 m3 of mortar (assumption of Section 3) to VFS, the environmental impact category indexes for each alternative can be related to the volume of mortar needed for delivering specific mechanical requirement (Fref). For better comparison of the data, the new set of environmental impact category indexes were weighed and normalized using the following equation:
E M S c o r e k = i = 1 6 W N I n d e x i k
where E M S c o r e k is the non-dimensional score integrating both environmental and mechanical performance of the mortar alternative k, i is the number of environmental impact category, and W N I n d e x i , V F S k is weighted and normalized score of environmental impact category of i for the alternative k:
W N I n d e x i , V F S k = E I C I n d e x i , V F S k × ω i m a x { E I C I n d e x i , V F S 1 , E I C I n d e x i , V F S 2 , E I C I n d e x i , V F S m , }
where E I C I n d e x i , V F S k is raw score of an environmental impact category as per functional unit of VFS, ω i is the importance weight for the impact category i, m = 34 is the number of mortar alternatives. The symbol m a x { . } denotes a function identifying the maximum value of the series.

4.1. Results and Discussion

The environmental impacts of the calculated volume of the mortars developed using the blended cements of the three groups, with the capability of carrying the Fref are presented in Table 4. Considering the results introduced in this table as well as the compressive strength of all the mortars presented in Table 1, the following observations can be mentioned: (i) the environmental footprint can be reduced by using all the binary cements of the first group, G1-SHPi, (rather than the OPC) with exception of G1-SHP5 and G1-SHP6 in developing the mortars capable of carrying an almost similar uniaxial compressive load to that of the reference mortar. Apart from the two mortars made of G1-SHP5 and G1-SH6, the compressive strength of all the mortars developed using G1-SHPi group of cements, was higher or negligibly lower (<3%) than that of OPC. This means that the mortars made by any of the above-mentioned cements of the first group, with an almost similar volume to that of the mortar made of OPC, were adequate for delivering a similar compressive performance, i.e., carrying the reference uniaxial compressive load, Fref. Thus, based on the discussion presented in Section 3.4, the application of these binary cements (all the members of G1-SHPi group except G1-SHP5 and G1-SHP6) for producing mortar, have contributed to the reduction of the environmental impacts. The mortars made of G1-SHP5 and G1-SHP6 have shown respectively 9.5% and 7.3% lower compressive strength than that of the reference. Thus, increasing the volume of these two mortars to respectively 10.5% and 8% (by the volume of reference mortar) for carrying the Fref load has resulted in the production of a relatively higher environmental impact, compared to those produced by making the reference mortar; (ii) application of only NPP for partially replacement of the OPC in developing the cements of the second group has not contributed for reducing the environmental impacts. The compressive strength of the mortars produced by G2-NPPi has reduced by increasing the replacement dosage of OPC by NPP, since the pozzolanic reaction of NPP has provided a delay in the process of strength development of the mortars up to 28 days. Replacing OPC with NPP up to 10% has not reduced significantly the compressive strength of the mortar compared to the reference mortar. Thus, by increasing the volume of the mortar made of G2-NPP10 to 9% (of that of the reference mortar) to be capable of carrying Fref load, an almost similar environmental impact was quantified for developing mortar made of G2-NPP10. In the case of the remaining members of G2-NPPi group, with the OPC replacement ratios higher than 10%, a significant reduction in the compressive strength was observed. Thus, by increasing the volume of the mortar made of G2-NPP15, G2-NPP20, and G2-NPP30, respectively to 21%, 28%, and 34% of the reference volume, i.e., the volume required to reach Fref load carrying capacity, a higher environmental impact was quantified; (iii) considering the mechanical properties and environmental impact of the mortars made of the third group of the cements, G3-NPPj-SHPi, it is clear that using both NPP and SHP have provided great potential for producing the cements with lower environmental impacts compared to the OPC. In G3-NPPj-SHPi group of the cements all the members were contained of a lower dosage of OPC in comparison with the binary cements with an equal dosage of either NPP or SHP. Apart from the 6 cements, namely G3-NPP10-SHP3, G3-NPP10-SHP4, G3-NPP10-SHP6, G3-NPP10-SHP7, G3-NPP15-SHP5 and G3-NPP20-SHP5 (with lower compressive strength than that of the reference), out of the 20 members of the third group, application of the ternary cements has reduced the environmental footprint. Although the mortar made by using some of the members in G3-NPPj-SHPi group has shown the lower compressive strength compared to that of the reference, after increasing the volume of the mortars to reach the load carrying capacity Fref, yet they have shown a lower environmental impact. For instance, the mortar made of G3-NPP15-SHP7 cement has provided 7.2% lower compressive strength compared to that of the reference mortar at 28 days. However, a high replacement dosage of OPC (22%), the highest source of emission in developing blended cements, by means of SHP and NPP has reduced the environmental impacts.
The E M S c o r e k calculated for the mortars made of the blended cements are comparable with that of mortar made of OPC in Table 4. Considering the E M S c o r e k of the mortars produced using the cements of group 1, 2, and 3, it is clear that the mortars with the capability of carrying the Fref and lower environmental impact compared to that of the reference mortar, has a lower E M S c o r e k . For instance, all the mortars made of the blended cement of the first group with exception of G1-SHP5 and G1-SHP6 has provided a lower E M S c o r e k (in the range of 0.899 to 0.734) in compared to that of the reference mortar (equal to 0.905). The lowest E M S c o r e k has calculated for the mortar made of G1-SHP30, G2-NPP10, and G3-NPP30-SHP7 respectively among all the members of the first, second and third group of cements. These cements can be introduced as the one with the highest eco-mechanical efficiency in their own group.

4.2. Consolidated Environmental and Mechanical Evaluation

Understanding the overall impact of producing and using mortar/concrete compositions on the environment is of paramount importance since it recommends the application of materials that feature a lower environmental footprint. However, it should be considered that the selection of a more environment-friendly cementitious material among several different alternatives by taking into account only the results of the LCA of the material can be misleading. As an example, a cement developed with alternative supplementary cementitious materials may show a lower environmental impact compared to OPC by considering the results of LCA. However, if it shows a lower mechanical performance (e.g., lower compressive strength), there is the necessity of using a higher volume of this cement in order to provide a similar level of mechanical performance compared to that of the OPC, and to meet the mechanical performance required for the specific goals in a construction. Hence, it is possible that, because a higher dosage of the developed cement needs to be used when compared to that of the OPC for the specific construction purpose, this ends up resulting in a higher environmental impact. Thus, the present study evaluated the possibility of introducing a more complete approach to assess the environmental impact of alternative cements through the combination of both mechanical and environmental variables in a performance-based assessment of the developed cements.
The environmental impacts quantified by tailoring the mortars made of the cements of G1 to G3 groups were compared to the environmental impacts of producing the reference mortar, calculated the ratios by considering only the environmental performance. These indicators were then compared with those calculated by taking into account both mechanical and environmental indicators, as shown in Figure 7, Figure 8 and Figure 9. Comparing the impact ratios calculated according to the LCA, the impact ratio of producing the mortars made of the blended cements with higher compressive strength have diminished when considering the integrated environmental and mechanical properties. On the contrary, the impact ratios of the mortars with lower compressive strength, calculated by means of LCA, have increased when both environmental and mechanical indicators were considered. For the mortars with an almost similar compressive strength to that of the reference mortar, the impact ratio evaluated using environmental indicators only have remained constant after the evaluation by accounting the results of both the mechanical and environmental performances. The reason is that the mortar volume was calculated, depending on its compressive strength, to be capable of carrying Fref. Thus, the requirement of a higher volume of mortar, in the case of the mortars with lower compressive strength than that of the reference, resulted in the increase in the values of the environmental impact and the impact ratio.
Among 34 introduced cements, 22 developed binary and ternary cements that can be successfully replaced by OPC for developing a mortar with a lower environmental impact and similar compressive strength (to that of the mortar made of OPC) are marked with the green arrows in Figure 7, Figure 8 and Figure 9. Application of these 22 cements for developing mortar, can reduce the GWP in the range of 1% to 25.5%, ADP in the range of 0.2% to 17.2% and POCP in the range of 1.5% to 29%. The AP could be reduced in the range of 1.2% to 25.4% and the range of EP reduction was between 1.1% to 26.6% by using the abovementioned cements. The ODP, however, has shown a tendency to reduce slightly, with maximum reduction of 6.4% compared to that of the reference mortar, since the SHP and NPP should be transported from a farther distance to MPL.
Among all the binary cements, application of G1-SHP30, G1-SHP20, and G1-SHP15, with marginally lower compressive strength than that of OPC, for developing the mortar respectively has provided the lowest impact ratio, since OPC was replaced with a relatively high dosage of SHP in these cements. Despite a relatively low replacement dosage of OPC by SHP in producing the G1-SHP8, and G1-SHP7 cements, the impact ratio of these two binary cements was lower than the unit value (see Figure 7). In the group of binary cements, G1-SHP8 and G1-SHP7 have provided the highest compressive strength for mortar, equal to 34.5MPa, and 33.1MPa, respectively, which implies 7.5%, and 3.4% enhancement in compressive strength with respect to the one of the reference mortar. Thus, for developing a mortar capable of carrying a uniaxial load equal to that of the one carried by the reference, using G1-SHP8 and G1-SHP7 cements, a lower volume of mortar is required. Then, adding to the fact that the substitution of OPC by SHP has already reduced the environmental impacts, the requirement of a lower volume of the mortar using G1-SHP8 and G1-SHP7 cements has collaborated in the further reduction of the impacts. Figure 7 shows that the impact ratio of these two cements is even lower than that of the G1-SHP9 and G1-SHP10, produced by substitution of a higher dosage of OPC with SHP.
When comparing the mortars made of binary cements with those that made using ternary cements, it seems that the ternary ones, belonging to the third group of cements, have generally produced the lower environmental impacts, since in the ternary cements the OPC was replaced in higher dosages. Considering the mechanical performance as well as the results of the LCA for the third group of cements, it can be noted that application of the four cements, namely: G3-NPP30-SHP7, G3-NPP30-SHP6, G3-NPP30-SHP4 and G3-NPP20-SHP6 for developing mortar has provided respectively the lowest environmental impacts. Among the abovementioned cements, G3-NPP30-SHP7 showed the highest level of OPC replacement (37% of OPC is replaced by both SHP and NP). The compressive strength of the mortar made of G3-NPP30-SHP7 was only 3.8% lower in strength than that of the mortar made of OPC. The relatively high compressive strength of G3-NPP30-SHP7, despite the replacement of OPC in a high dosage for developing the cement, can be attributed to the finer size of both the SHP and NPP when compared to OPC, which act as a filler material, and occupy the voids between the cement particles. Furthermore, the lower water requirement for developing the mortar using G3-NPP30-SHP7 has provided an enhancement in the compressive strength (see Table 1). The high replacement dosage of OPC by the more sustainable material (i.e., NPP and SHP) in the developed G3-NPP30-SHP7, as well as the almost similar compressive strength of the mortar made of G3-NPP30-SHP7 to that of the reference, made this cement the most environmentally friendly and sustainable alternative to OPC among all the developed blended cements in the three groups of the present study. Compared to the reference mortar, using G3-NPP30-SHP7 for making a mortar could reduce the main environmental impact indicators, namely ADP and GWP, 17.2% and 25.5%, respectively.
The E M S c o r e of all the mortars made of the three groups of blended cements are calculated according to Equation (3) and compared in Figure 10. In this figure the share of each weighted and normalized score of all the environmental impacts, W N I n d e x , in the calculated E M S c o r e is shown as well. The results illustrated in Figure 10 confirm the higher eco-mechanical efficiency of 22 cements out of the 34 developed ones compared to that of OPC for producing mortar. As it is already mentioned, the NPP30-SHP7 cements provided the lowest E M S c o r e among all the blended cements and can be selected as the most eco-mechanical efficient one.

5. Conclusions

The present paper contributes towards the preserving of natural resources and stabilization of the emissions generated in the manufacturing process of OPC by evaluating the possibility of recycling high contents of seashell waste as cement substitution.
In this regard, the mechanical and environmental performance of 34 mortars developed using the blended cements, i.e., binary blends of OPC and SHP, up to 30% by mass, as well as ternary blends of OPC and SHP, up to 7% by mass and NPP, up to 30% by mass, were compared with that of the reference mortar made of OPC. The results of mechanical and environmental assessments of the cements introduced in the present study can contribute to improve the process for the selection of more eco-efficient options. The key findings can be summarized as follow:
-
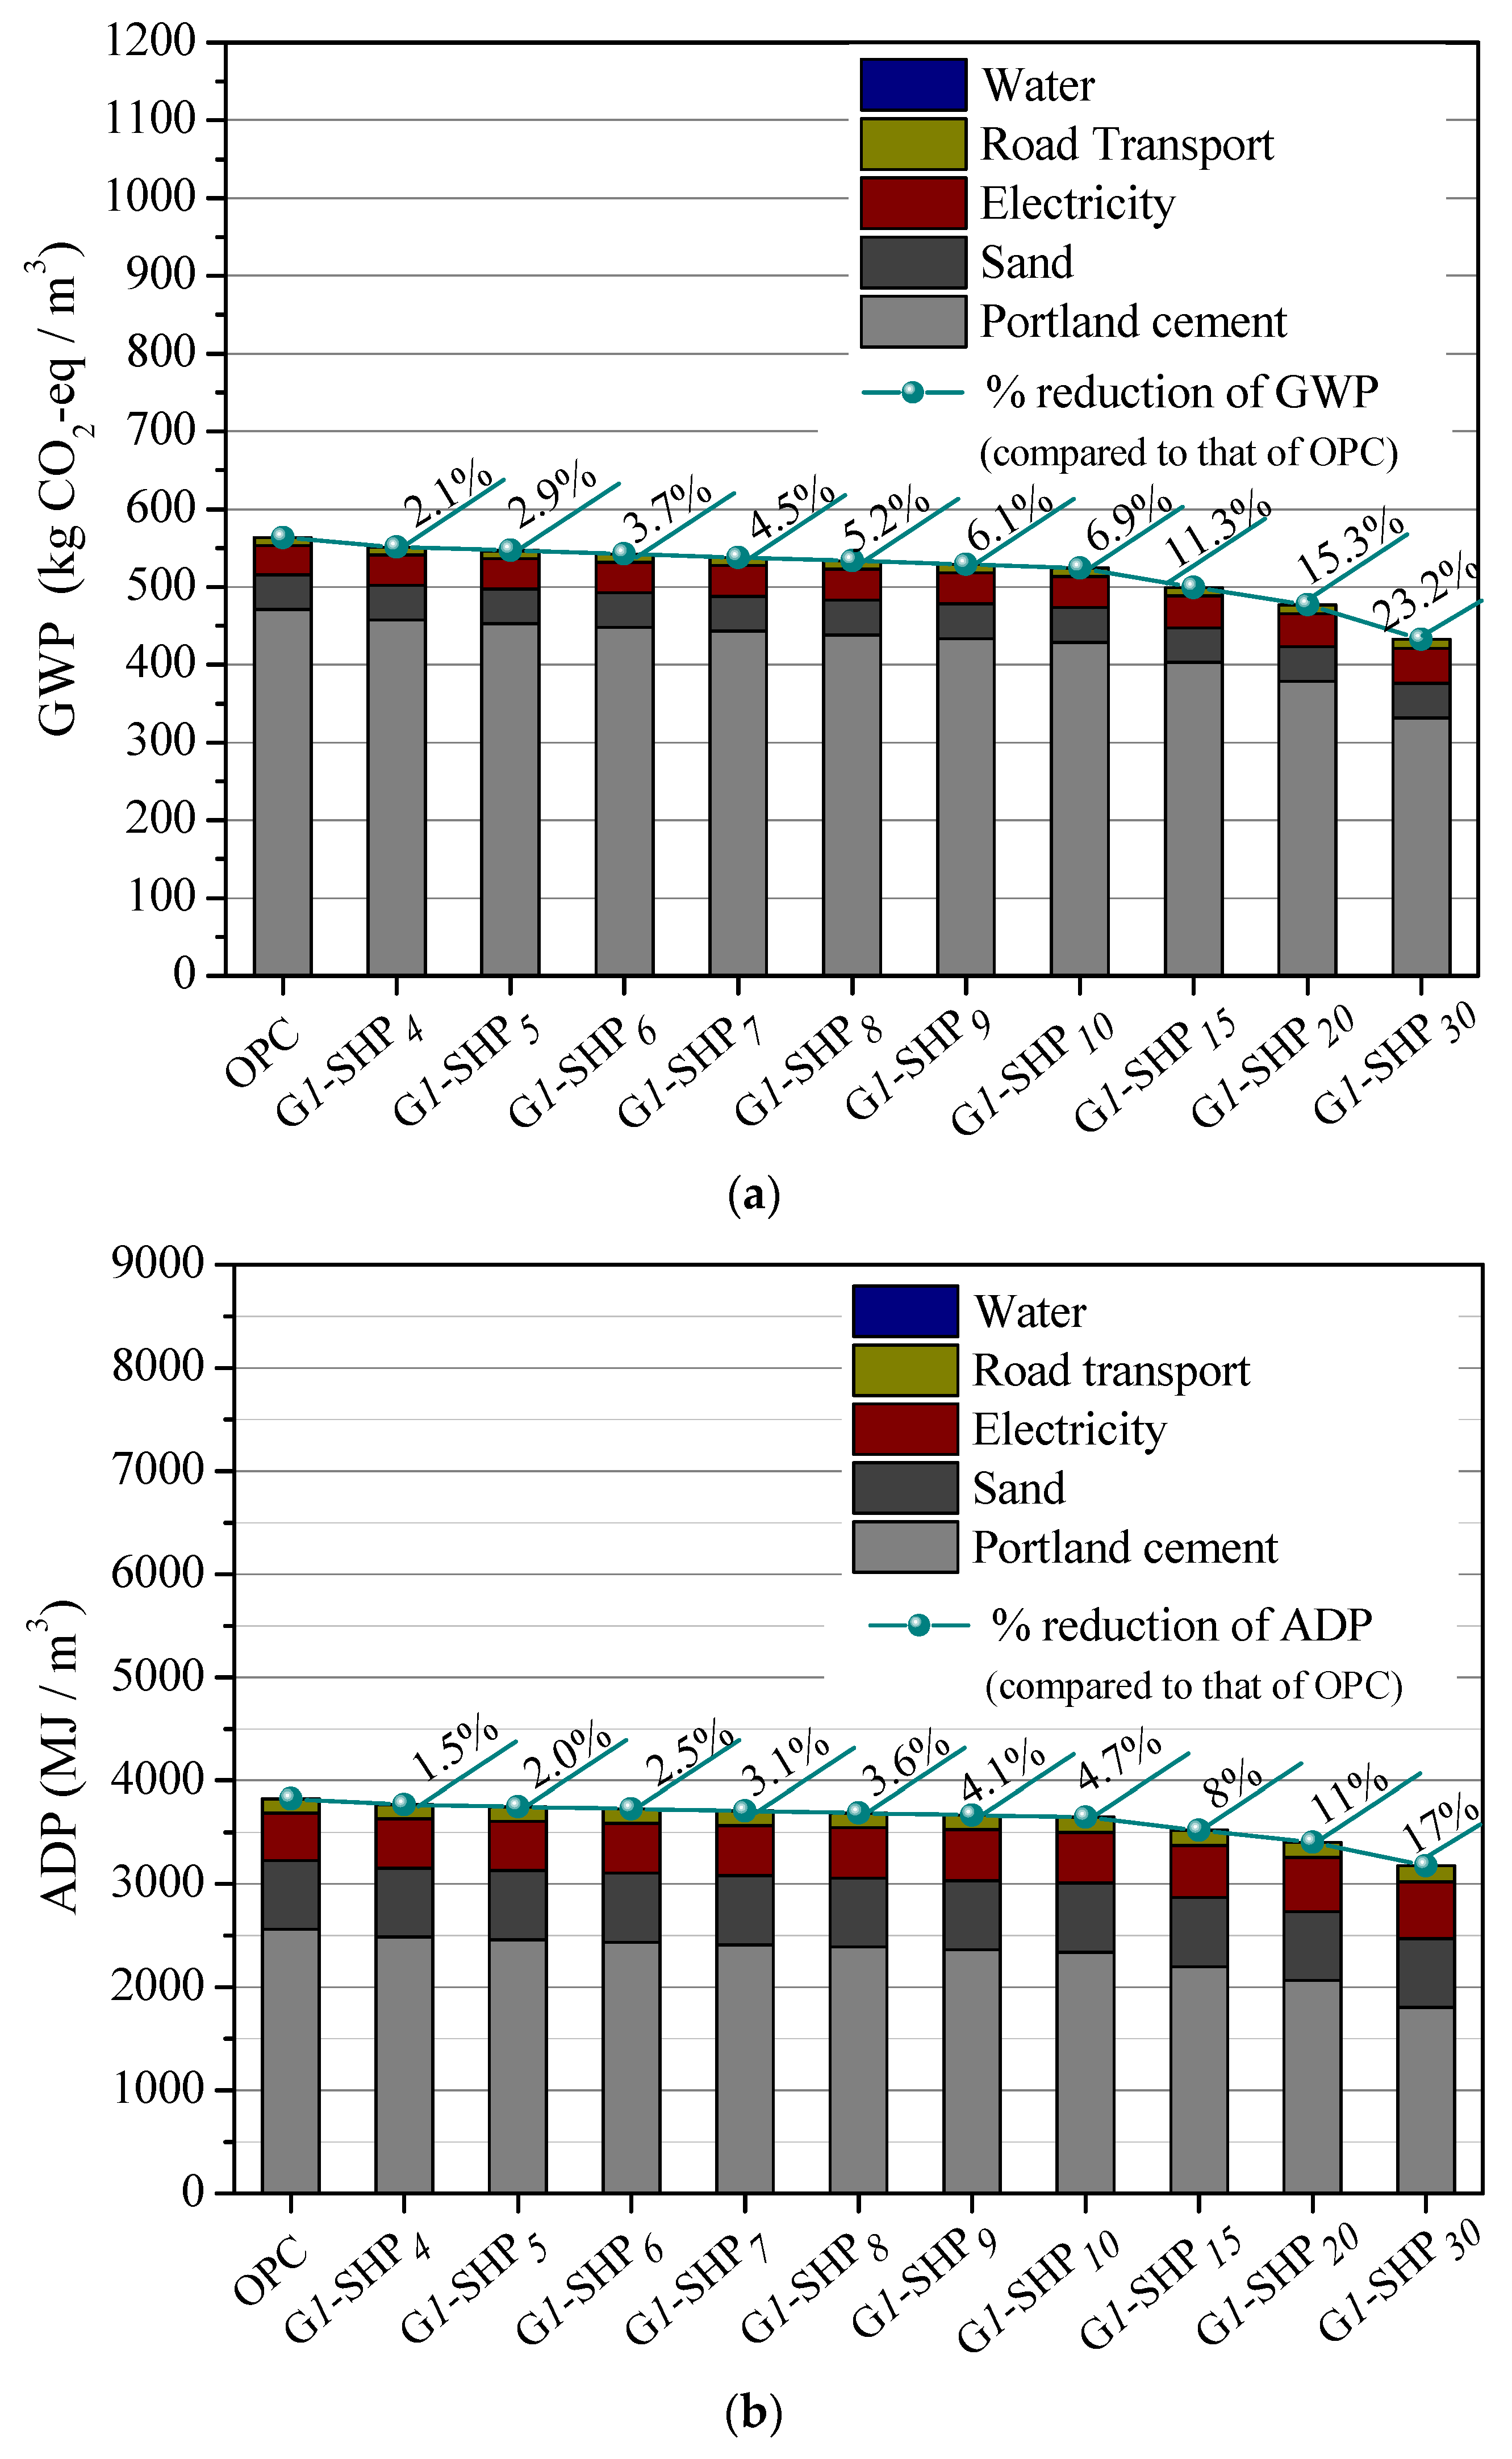
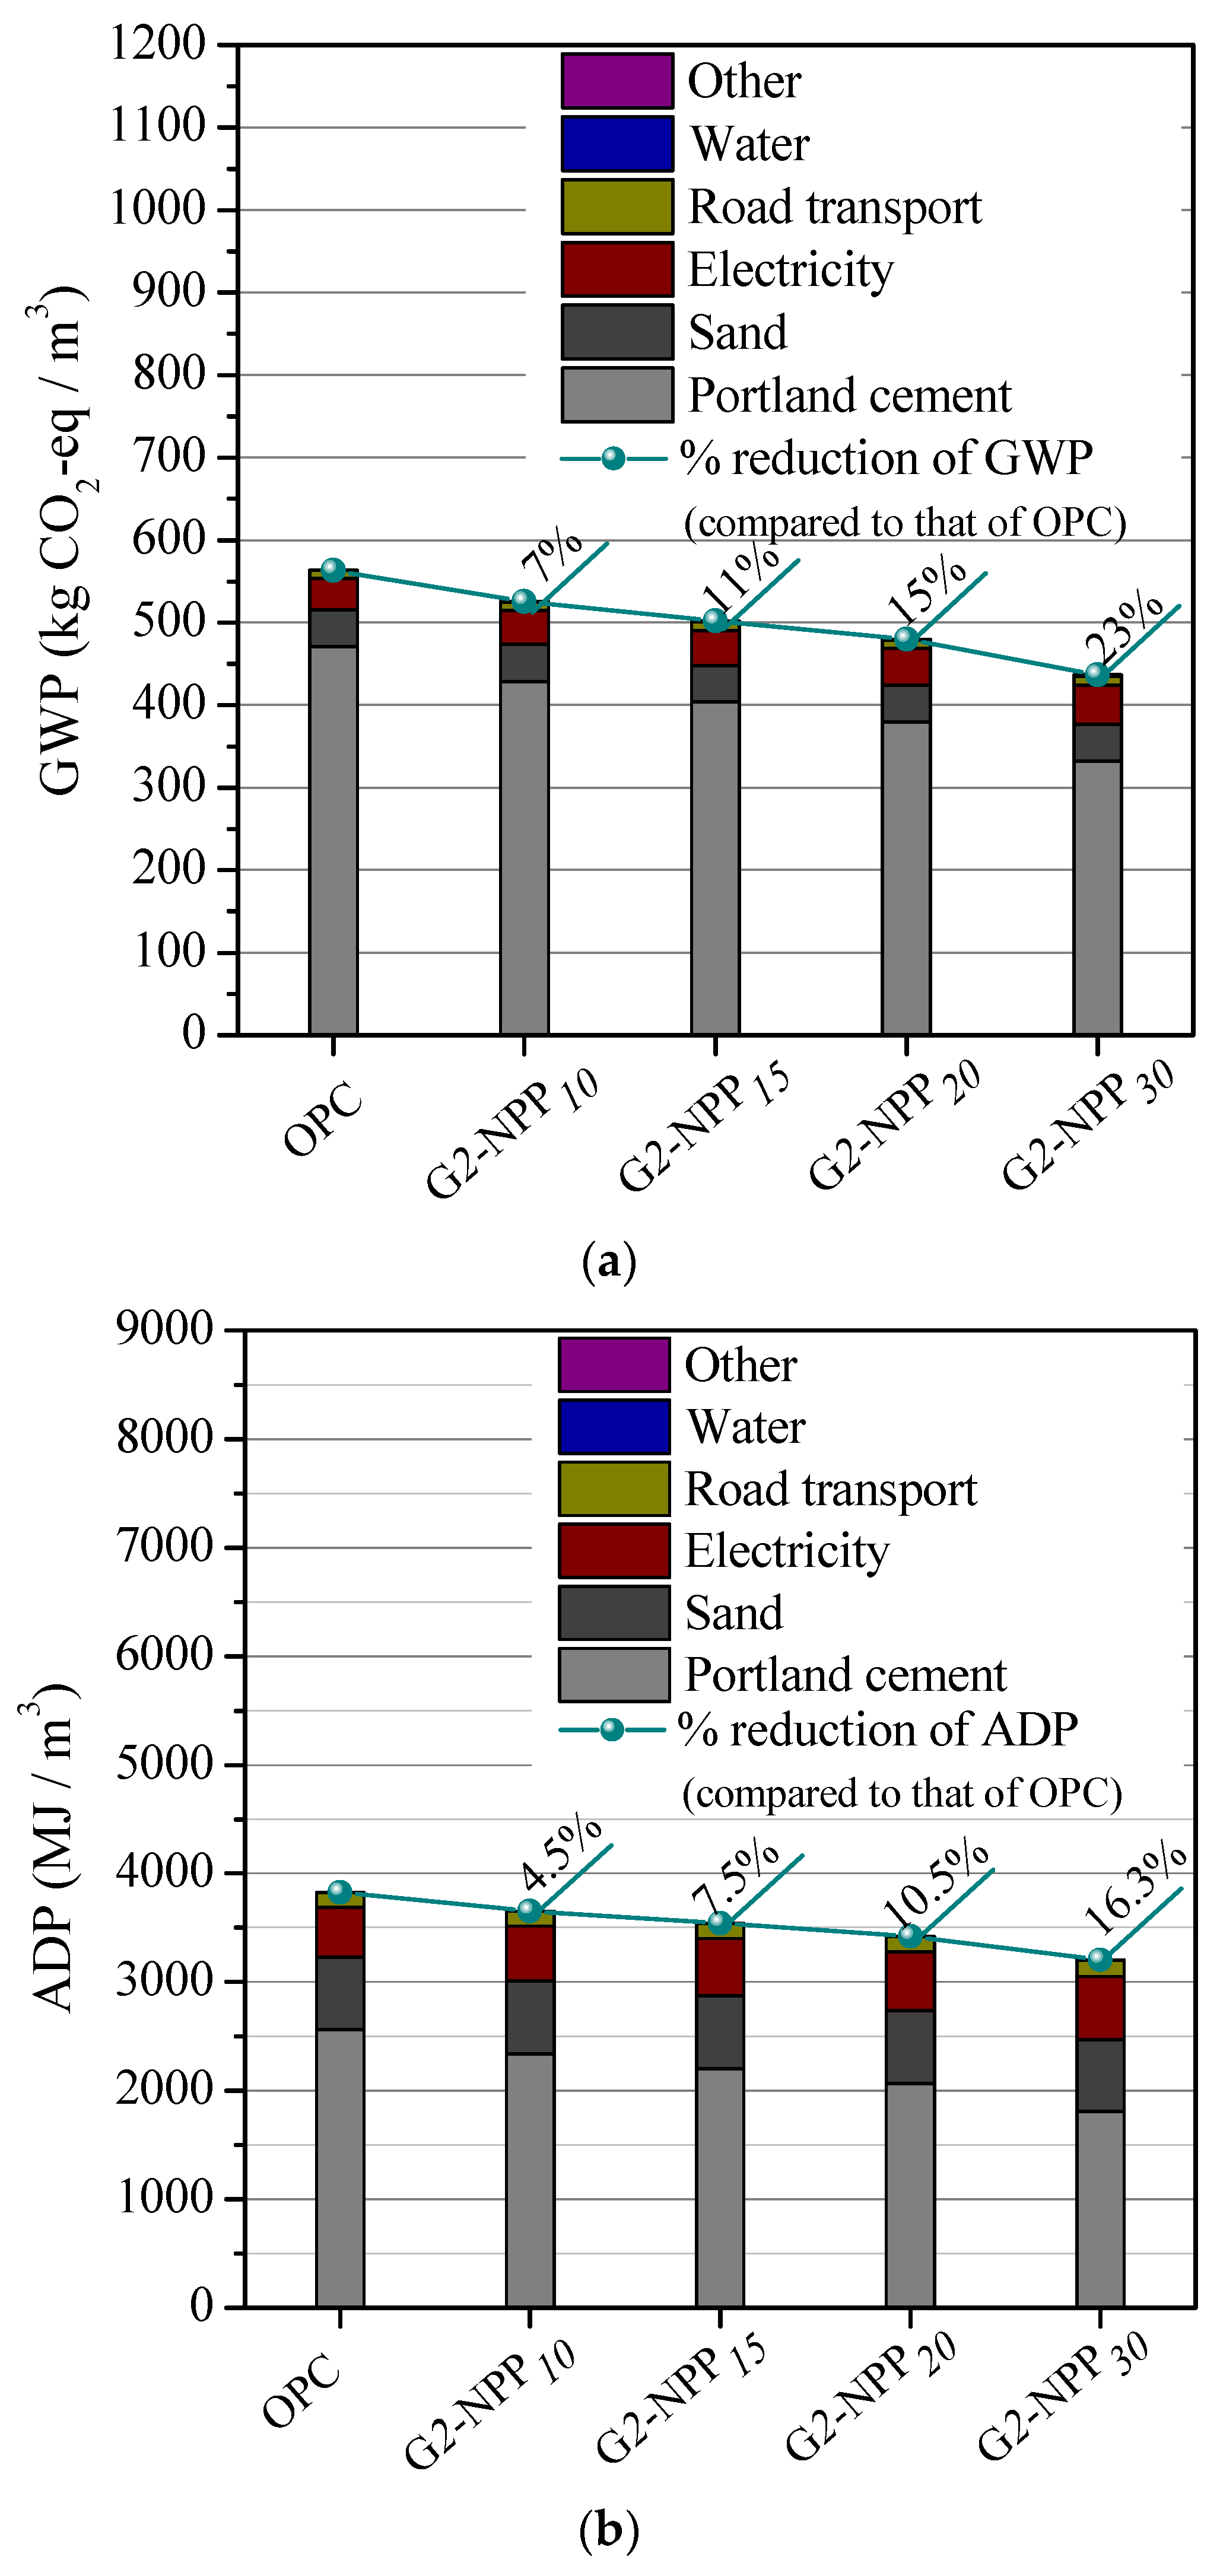
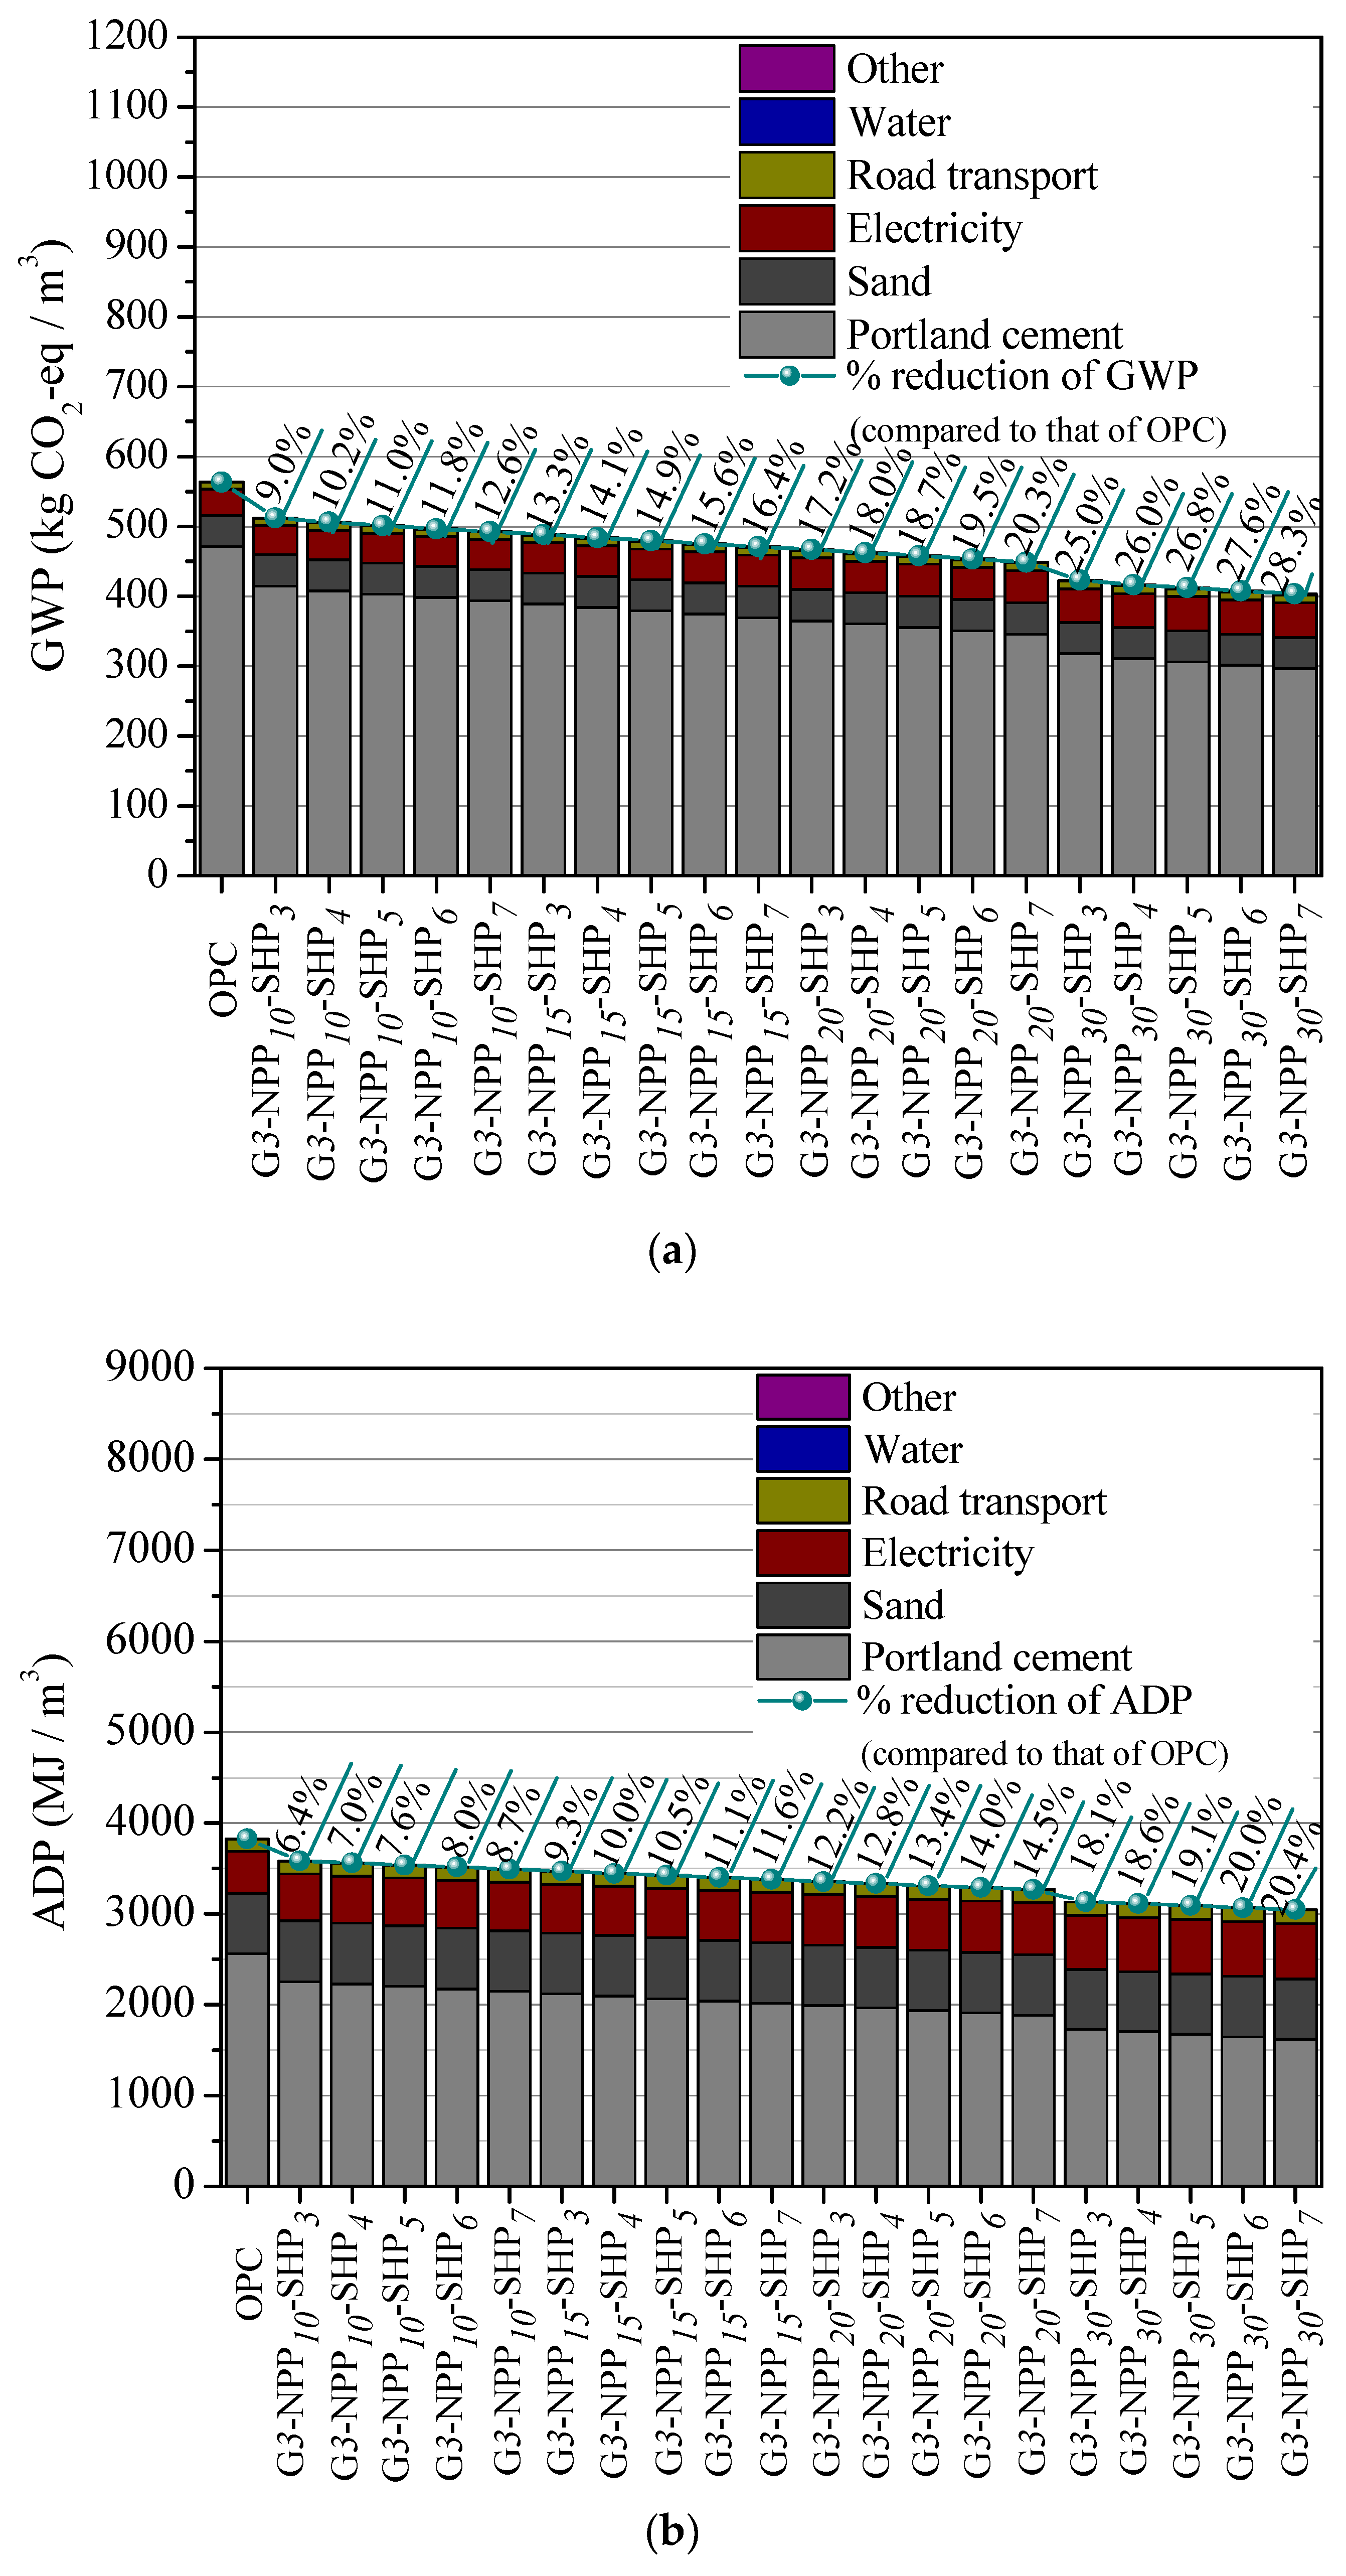
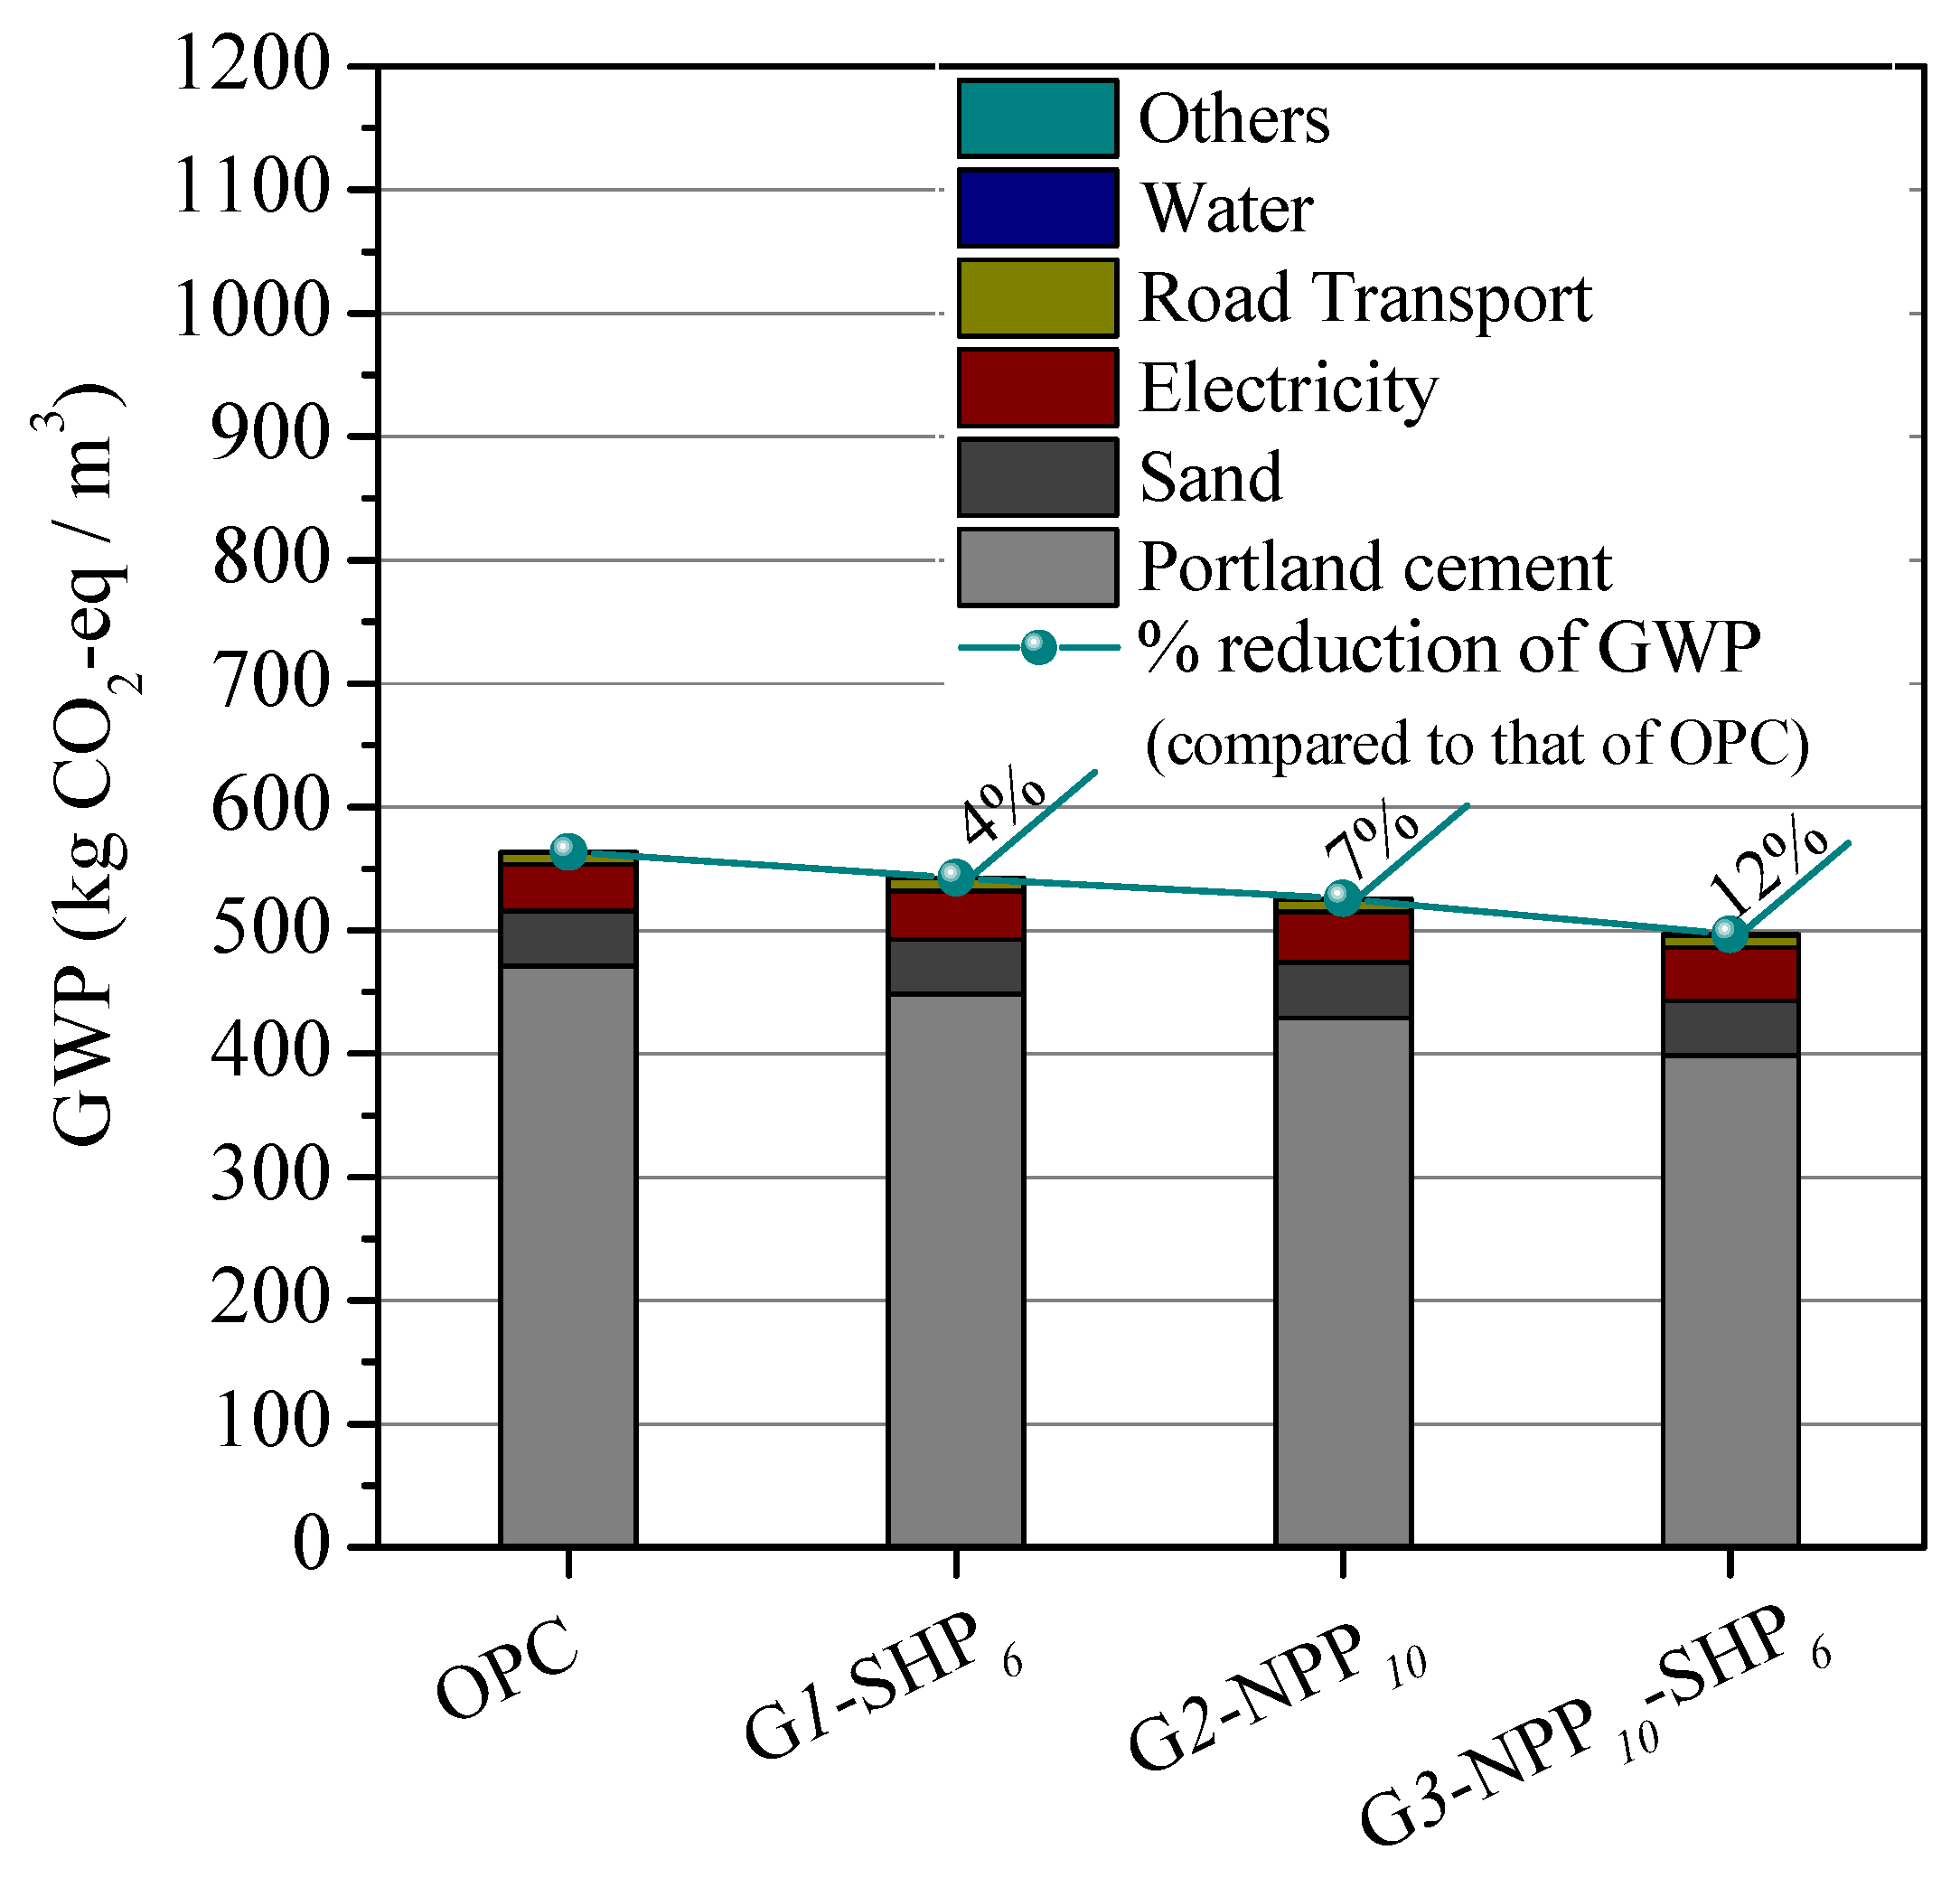
The production of SHP caused the lowest environmental impacts, whereas the highest environmental impacts were related to the development of OPC. The reason is that the OPC production consumes considerable quantities of resources and releases huge amounts of CO2 to the atmosphere. Thus, by increasing the dosage of the OPC substitution (using SHP) the potential environmental impacts of developing mortar have effectively decreased.
-
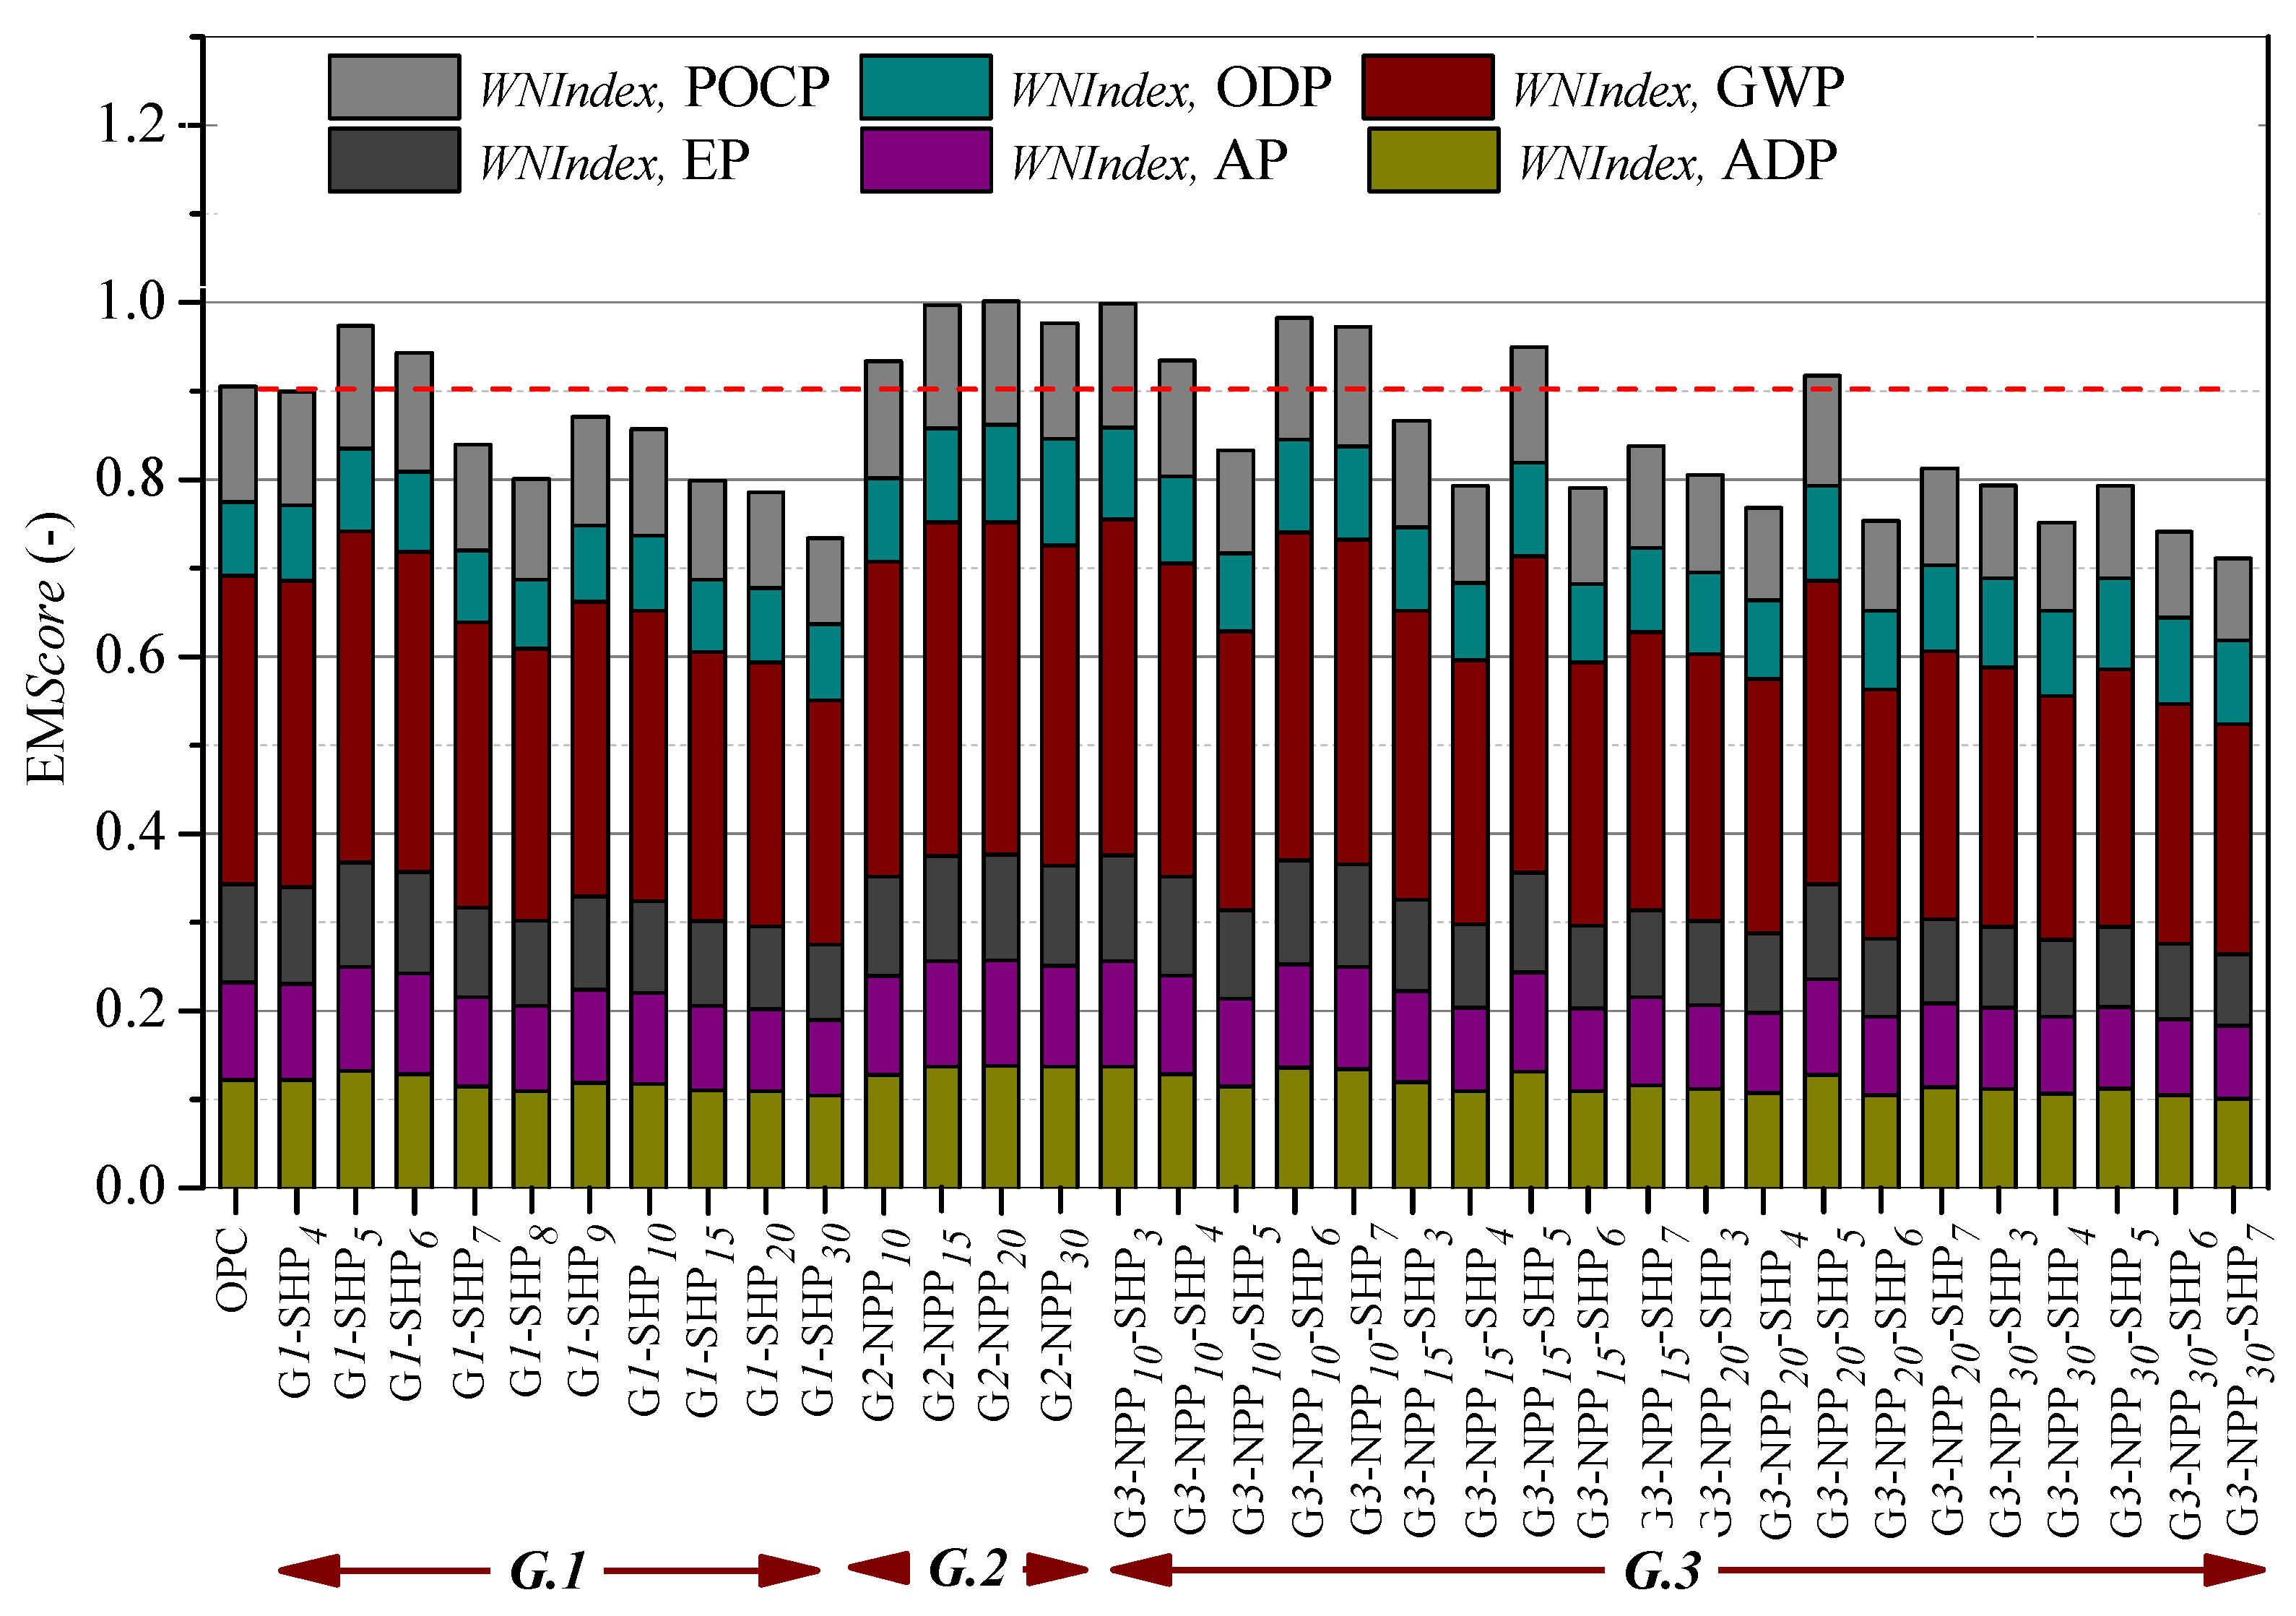
Among 34 introduced cements, 22 developed binary and ternary ones could be successfully replaced by OPC with a lower environmental impact and similar compressive strength. Application of these cements for developing mortar can reduce the GWP in the range of 1% to 25.5%, ADP in the range of 0.2% to 17.2% and POCP in the range of 1.5% to 29%. The AP could be reduced in the range of 1.2% to 25.4% and the range of reducing EP was between 1.1% and 26.6% by using the abovementioned cements. The maximum reduction of ODP was evaluated as 6.4% compared to that produced by the reference mortar.
-
Among all the binary cements, the application of respectively G1-SHP30, G1-SHP20, and G1-SHP15 for developing mortar provided the lowest impact ratios. Despite the marginally lower compressive strength of the mortar obtained with the introduced binary cements compared to that of the reference, these cements have contributed to reduce the environmental impacts, since these cements were produced by replacing a relatively high dosage of OPC with SHP.
-
Among all the binary and ternary cements, the application of G2-NPP30-SHP7 for developing mortar resulted in the lowest environmental impacts. Substituting a high dosage of OPC (37% by mass) by the more sustainable materials (i.e., NPP and SHP) in developing G2-NPP30-SHP7, as well as the compressive strength of the mortar made of G2-NPP30-SHP7 which have almost equaled that of the reference, made this cement the most environmentally friendly and sustainable alternative to OPC.
-
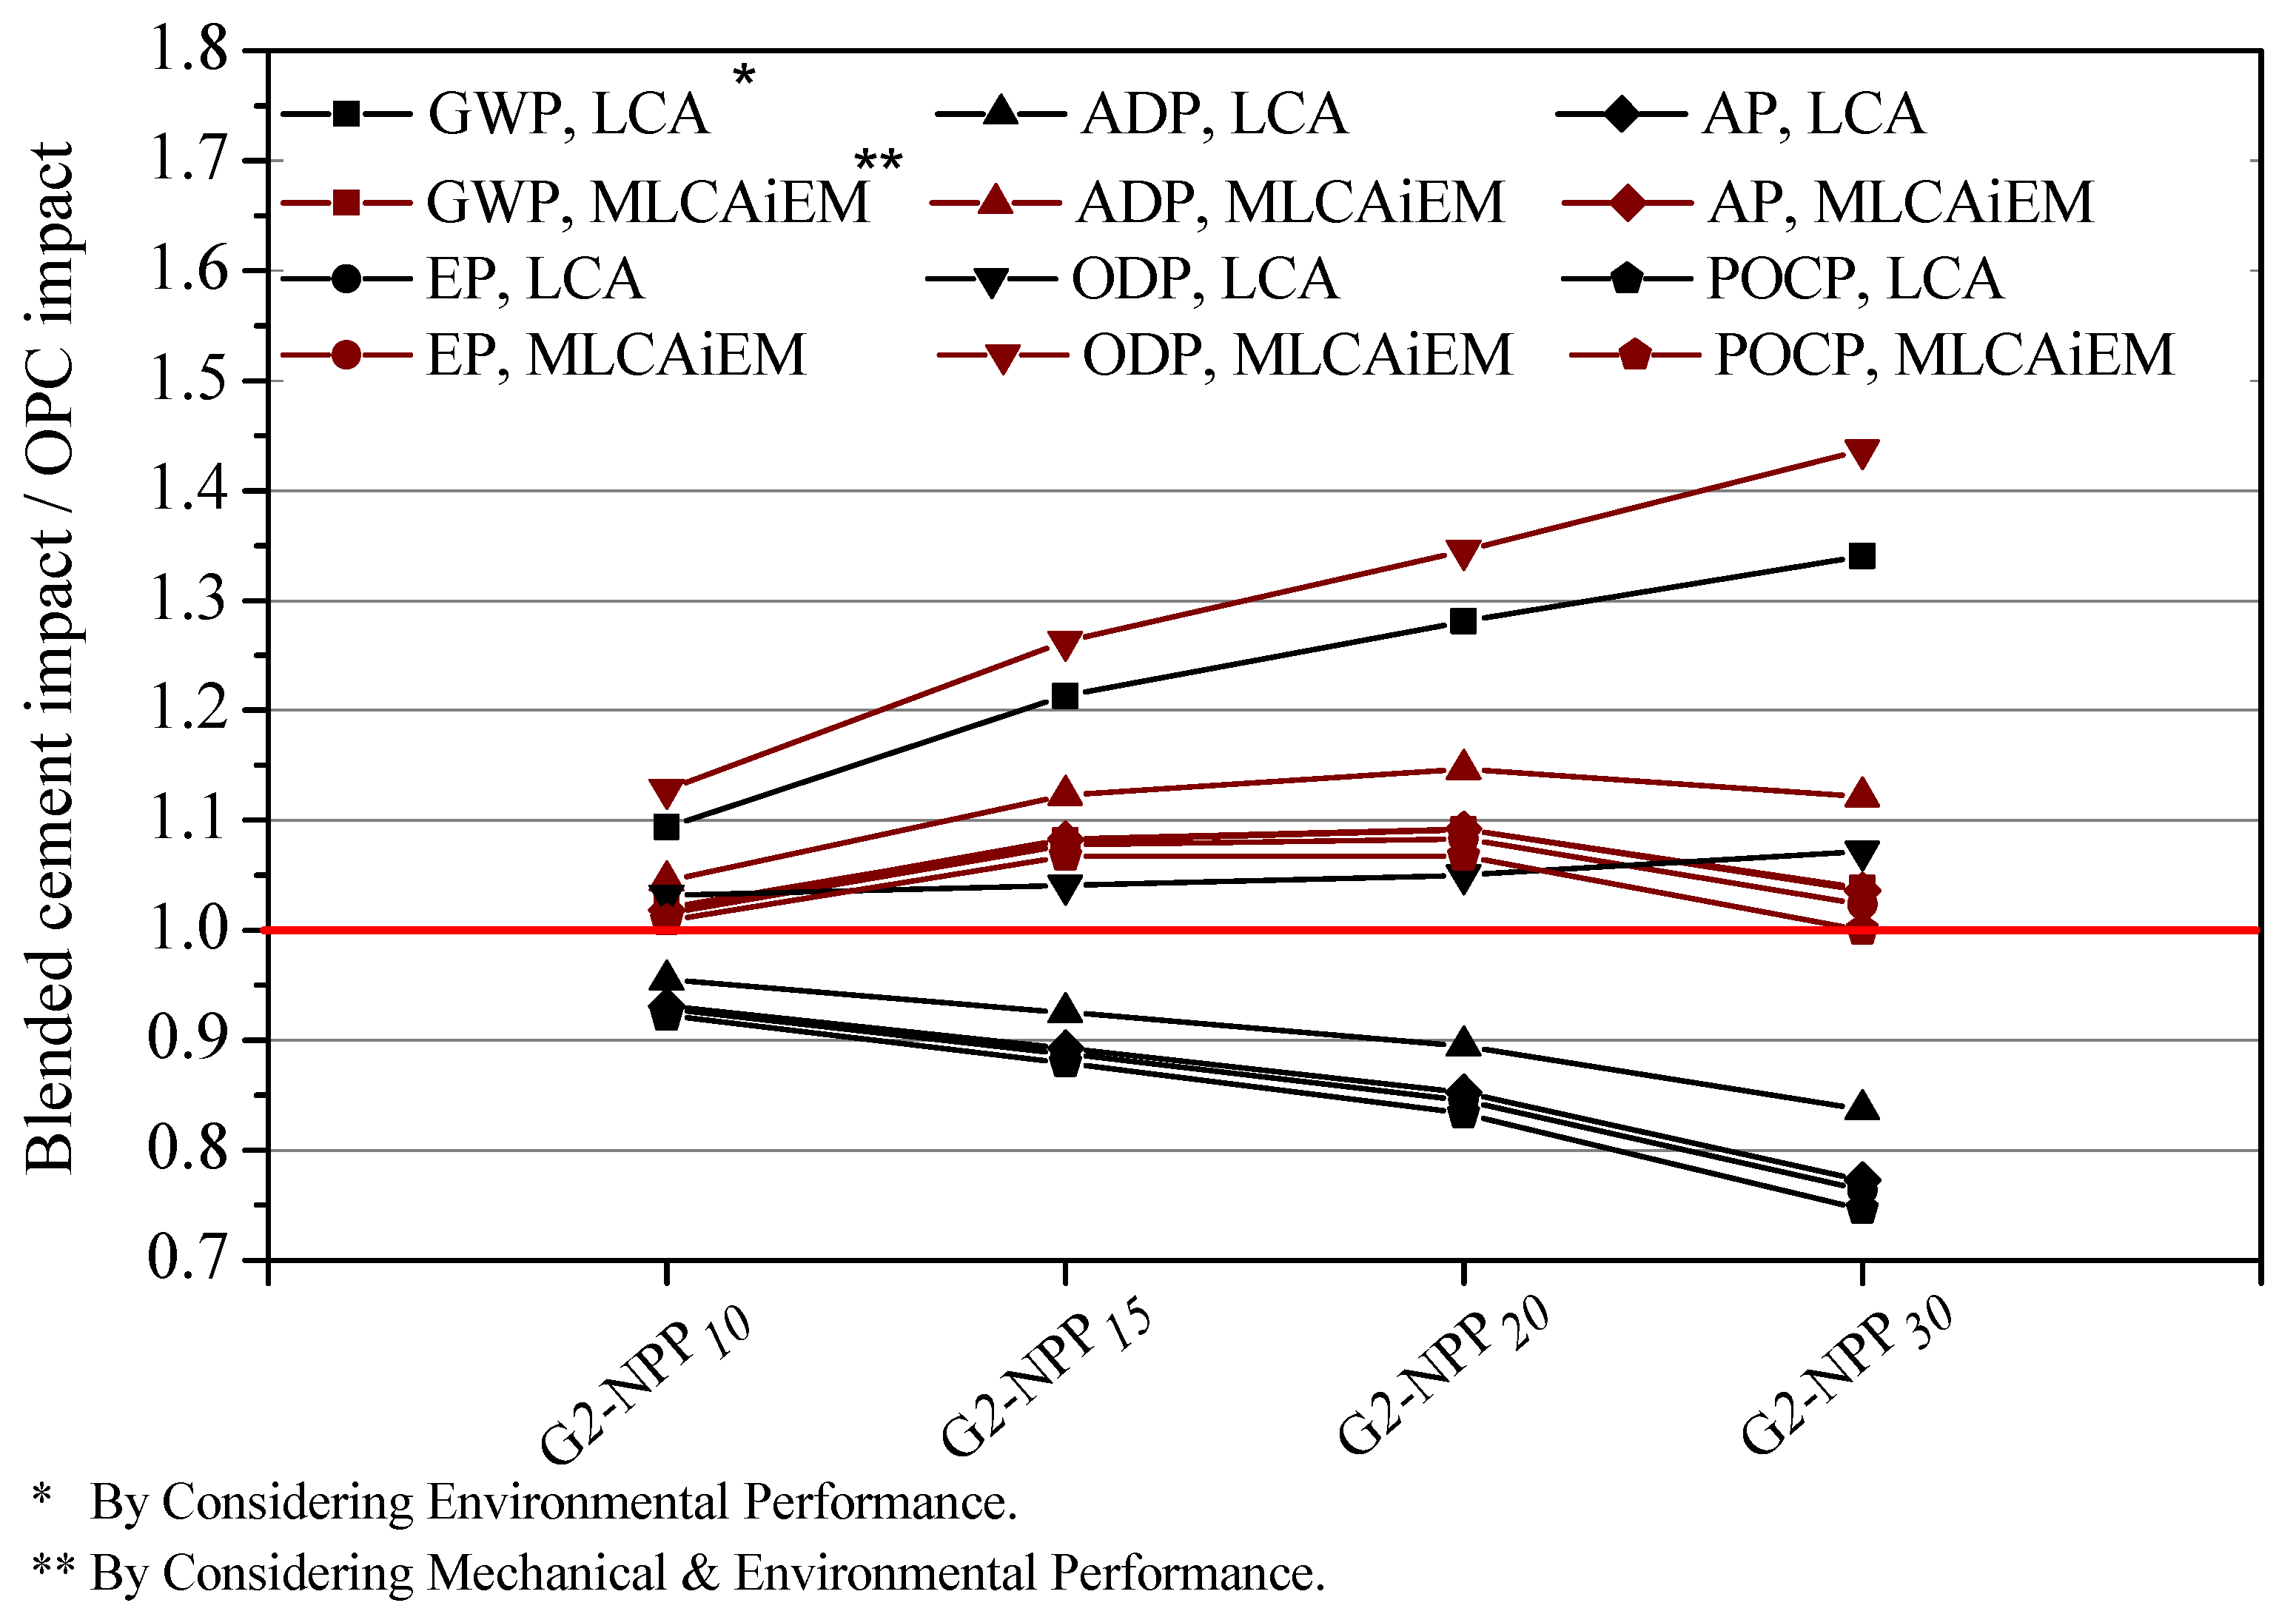
The objective decision process that leads to the optimal option should take into consideration both the environmental impact indicators and mechanical performance indicators; the use of either of these indicators isolated may be misleading and lead to less sustainable options. Further research is necessary to identify additional mechanical performance indicators to the overall sustainability equation of cements and concretes.

Author Contributions

Conceptualization, F.S., A.E.B. and E.N.B.P. Data curation, F.S. and A.E.B. Formal analysis, F.S. and A.E.B. Funding acquisition, A.E.B. Investigation, F.S. Methodology, F.S. and E.N.B.P. Project administration, F.S. Software, C.A.T.; Supervision, F.S. Validation, A.E.B. and C.A.T. Writing—original draft, F.S.; Writing—review & editing, A.E.B., E.N.B.P. and C.A.T. All authors have read and agreed to the published version of the manuscript.

Funding

The first three authors wish to acknowledge the funding provided by project FOATIDE, reference POCI-01-0145-FEDER-028112, co-financed by the European Regional Development Fund (ERDF), through the Operational Programme for Competitiveness and Internationalization (COMPETE 2020), under Portugal 2020, and by the Fundação para a Ciência e a Tecnologia—FCT I.P. (National Agency for Science and Technology). The first author also acknowledges the Scientific Employment funding, No. CEECIND/01627/2017, provided by FCT I.P. The financial support provided by FCT I.P. under the project UIDB/04033/2020 is kindly acknowledged by the last author.

Institutional Review Board Statement

Not applicable.

Informed Consent Statement

Not applicable.

Data Availability Statement

Not applicable.

Conflicts of Interest

The authors declare no conflict of interest.

Appendix A

Table A1. List of symbols presented in the paper.
SymbolRemark
AHPAnalytical hierarchy process
EMREco-mechanical ratios
EPIenvironmental performance index
MPIMechanical performance index
MLCAiEMModified life cycle approach integrating environmental and mechanical performances
EICEnvironmental impact categories
EjEmission “j” per functional unit
CFi,jCharacterization factor for emission “j” contributing to i-th environmental impact category.
FrefUniaxial load corresponding to compressive strength of the reference mortar
VOSVolume of original specimen
AOSCross-section of original specimen
hOSHeight of original specimen
( A F S ) k Cross-section area of the fictitious specimen corresponding to the alternative mortar k
σ c , k 28 Uniaxial compressive strength of alternative mortar k at the age of 28 days
VFSVolume of fictitious specimens
E M S c o r e k Non-dimensional score, integrating both environmental and mechanical performance of the mortar alternative k
W N I n d e x i , V F S k Weighted and normalized score of environmental impact category of i for the alternative k
E I C I n d e x i , V F S k Raw score of an environmental impact category as per functional unit of VFS
ω i Importance weight for the impact category i,
mNumber of mortar alternatives (equal to 34 in the present study)

References

  1. USGS (US Geological Survey). Cement Statistics and Information. 2019. Available online: https://www.usgs.gov/centers/nmic/cement-statistics-and-information (accessed on 2 October 2021).
  2. International Energy Agency (IEA); World Business Council for Sustainable Development (WBCSD). Cement Technology Roadmap 2009-Carbon Emissions Reductions Up to 2050. 2009. Available online: https://cement.mineralproducts.org/documents/wbcsd-iea%20cement%20roadmap%202009.pdf. (accessed on 2 October 2021).
  3. Black, L.; Purnell, P. Is carbon dioxide pricing a driver in concrete mix design? Mag. Concr. Res. 2016, 68, 561–567. [Google Scholar] [CrossRef] [Green Version]
  4. UN Environment; Scrivener, K.L.; John, V.M.; Gartner, E.M. Eco-efficient cements: Potential economically viable solutions for a low-CO2 cement-based materials industry. Cem. Concr. Res. 2018, 114, 2–26. [Google Scholar] [CrossRef]
  5. Miller, S.A.; John, V.M.; Pacca, S.A.; Horvath, A. Carbon dioxide reduction potential in the global cement industry by 2050. Cement. Concr. Res. 2018, 114, 115–124. [Google Scholar] [CrossRef]
  6. Taylor, H.F.W. Cement Chemistry, 2nd ed.; Thomas Telford: London, UK, 1997. [Google Scholar]
  7. Ramezanipour, A.A.; Ghiasvand, E.; Nickseresht, I.; Mahdikhani, M.; Moodi, F. Influence of various amounts of limestone powder on performance of Portland limestone cement concretes. Cem. Concr. Compos. 2009, 31, 715–720. [Google Scholar] [CrossRef]
  8. Lertwattanaruk, P.; Makul, N.; Siripattarapravat, C. Utilization of ground waste seashells in cement mortars for masonry and plastering. J. Environ. Manag. 2012, 111, 133–141. [Google Scholar] [CrossRef]
  9. Soltanzadeh, F.; Emamjomeh, M.; Edalat-Behbahani, A.; Soltanzadeh, Z. Development and characterization of blended cements containing seashell powder. J. Constr. Build. Mater. 2018, 161, 292–304. [Google Scholar] [CrossRef]
  10. Martínez-García, C.; González-Fonteboa, B.; Carro-López, D.; Martínez-Abella, F. Impact of mussel shell aggregates on air lime mortars. Pore structure and carbonation. J. Clean. Prod. 2019, 215, 650–668. [Google Scholar] [CrossRef]
  11. Martínez-García, C.; González-Fonteboa, B.; Carro-López, D.; Martínez-Abella, F. Design and properties of cement coating with mussel shell fine aggregate. Constr. Build. Mater. 2019, 215, 494–507. [Google Scholar] [CrossRef]
  12. FAO (Food and Agriculture Organization of the United Nations). The State of World Fisheries and Aquaculture. Contributing to Food Security and Nutrition for All; FAO: Rome, Italy, 2016; Available online: http://www.fao.org/publications/sofia/2016/en/ (accessed on 2 October 2021).
  13. Soltanzadeh, F.; Emamjomeh, M. Optimization of Cement and Concrete Using Oman Sea Chalky Conches. IRI-Iran Patent No. 35259, 6 June 2006. [Google Scholar]
  14. Wang, J.; Liu, E.; Li, L. Characterization on the recycling of waste seashells with Portland cement towards sustainable cementitious materials. J. Clean. Prod. 2019, 220, 235–252. [Google Scholar] [CrossRef]
  15. Edalat-Behbahani, A.; Soltanzadeh, F.; Emam-Jomeh, M.; Soltan-Zadeh, Z. Sustainable approaches for developing concrete and mortar using waste seashell. Eur. J. Environ. Civ. Eng. 2019, 25, 1874–1893. [Google Scholar] [CrossRef]
  16. Wang, J.; Liu, E.; Li, L. Upcycling waste seashells with cement: Rheology and early-age properties of Portland cement paste. Resour. Conserv. Recycl. 2020, 155, 104680. [Google Scholar] [CrossRef]
  17. Damineli, B.L.; Kemeid, F.M.; Aguiar, P.S.; John, V.M. Measuring the eco-efficiency of cement use. Cem. Concr. Compos. 2010, 32, 555–562. [Google Scholar] [CrossRef]
  18. Abrão, P.S.R.A.; Cardoso, F.A.; John, V.M. Efficiency of Portland-pozzolana cements: Water demand, chemical reactivity and environmental impact. Constr. Build. Mater. 2020, 247, 118546. [Google Scholar] [CrossRef]
  19. Habert, G.; Roussel, N. Study of two concrete mix design strategies to reach carbon mitigation objectives. Cem. Concr. Compos. 2009, 31, 397–402. [Google Scholar] [CrossRef]
  20. Celik, K.; Meral, C.; Petek Gursel, A.; Mehta, P.K.; Horvath, A.; Monteiro, P.J.M. Mechanical properties, durability, and life-cycle assessment of self-consolidating concrete mixtures made with blended Portland cements containing fly ash and limestone powder. Cem. Concr. Compos. 2015, 56, 59–72. [Google Scholar] [CrossRef] [Green Version]
  21. Gursel, A.P.; Maryman, H.; Ostertag, C. A life-cycle approach to environmental, mechanical, and durability properties of “green” concrete mixes with rice huskash. J. Clean. Prod. 2016, 112, 823–836. [Google Scholar] [CrossRef]
  22. Fantilli, A.P.; Chiaia, B. Eco-mechanical performances of cement-based materials: An application to self-consolidating concrete. Constr. Build. Mater. 2013, 40, 189–196. [Google Scholar] [CrossRef]
  23. Chiaia, B.; Fantilli, A.P.; Guerini, A.; Volpatti, G.; Zampini, D. Eco-mechanical index for structural concrete. Constr. Build. Mater. 2014, 67, 386–392. [Google Scholar] [CrossRef]
  24. Vandewalle, L. Vandewalle, L. RILEM TC 162-TDF, Test and design methods for steel fibre reinforced concrete σ ε design method–Final Recommendation. Mater. Struct. 2003, 36, 560–567. [Google Scholar] [CrossRef]
  25. Khodabakhshian, A.; Brito, J.D.; Ghalehnovi, M.; Shamsabadi, E.A. Mechanical, environmental and economic performance of structural concrete containing silica fume and marble industry waste powder. Constr. Build. Mater. 2018, 169, 237–251. [Google Scholar] [CrossRef]
  26. CEN, British Standard Institution, BS EN 197-1 Cement. Composition, Specifications Conformity Criteria for Common Cements; BSI: London, UK, 2004; Available online: http://www.rucem.ru/yabbfiles/Attachments/EN-197-1.pdf (accessed on 2 October 2021).
  27. ASTM. Standard Specification for Portland Cement (ASTM C150); ASTM: West Conshohocken, PA, USA, 2017. [Google Scholar]
  28. ASTM. Standard Test Method for Density of Hydraulic Cement (ASTM C188); ASTM: West Conshohocken, PA, USA, 2016. [Google Scholar]
  29. ASTM. Standard Test Method for Fineness of Hydraulic Cement by the 45-lm (No. 325) Sieve (ASTM C430); ASTM: West Conshohocken, PA, USA, 2015. [Google Scholar]
  30. ASTM. Standard Test Methods for Fineness of Hydraulic Cement by Air-Permeability Apparatus (ASTM C204); ASTM: West Conshohocken, PA, USA, 2016. [Google Scholar]
  31. ASTM. Standard Test Method for Compressive Strength of Hydraulic Cement Mortars (Using 2-in. or [50-mm] Cube Specimens) (ASTM C109); ASTM: West Conshohocken, PA, USA, 2016. [Google Scholar]
  32. ASTM. Standard Test Method for Flexural Strength of Hydraulic-Cement Mortars (ASTM C348); ASTM: West Conshohocken, PA, USA, 2014. [Google Scholar]
  33. Habert, G.; Billard, C.; Rossi, P.; Chen, C.; Roussel, N. Cement production technology improvement compared to factor 4 objectives. Cem. Concr. Res. 2010, 40, 820–826. [Google Scholar] [CrossRef]
  34. Huntzinger, D.N.; Eatmon, T.D. A life-cycle assessment of Portland cement manufacturing: Comparing the traditional process with alternative technologies. J. Clean. Prod. 2009, 17, 668–675. [Google Scholar] [CrossRef]
  35. ISO 14040. Environmental Management–Life Cycle Assessment–Principles and Framework; ISO: Geneva, Switzerland, 2006; Available online: https://www.iso.org/standard/37456.html (accessed on 2 October 2021).
  36. ISO 14044. Environmental Management–Life Cycle Assessment–Requirements and Guidelines; ISO: Geneva, Switzerland, 2006; Available online: https://www.iso.org/obp/ui/#iso:std:iso:14044:ed-1:v1:en (accessed on 2 October 2021).
  37. Sala, S.; Beylot, A.; Corrado, S.; Crenna, E.; Sanyé-Mengual, E.; Secchi, M. Indicators and Assessment of the Environmental Impact of EU Consumption, JRC 2016. Available online: https://eplca.jrc.ec.europa.eu/uploads/Science_for_policy_report_final_on_line.pdf (accessed on 2 October 2021).
  38. Thinkstep GaBi Software, Version 6.2. ThinkStep: Leinfelden-Echterdingen, Germany, 2017.
  39. ISO 15000. International Organization for Standardization, Energy Management Systems—Requirements with Guidance for Use; ISO: Geneva, Switzerland, 2011; Available online: https://www.iso.org/standard/51297.html (accessed on 2 October 2021).
  40. ISO 14001. International Organization for Standardizati, Environmental Management Systems—Requirements with Guidance for Use; ISO: Geneva, Switzerland, 2011; Available online: https://www.iso.org/standard/31807.html (accessed on 2 October 2021).
  41. ISO 9001. International Organization for Standardization, Quality Management Systems; ISO: Geneva, Switzerland, 2015; Available online: https://www.iso.org/standard/46486.html (accessed on 2 October 2021).
  42. Fernández-Muñiz, B.; Montes-Peón, J.M.; Vázquez-Ordás, C.J. Vázquez-Ordás, Safety climate in OHSAS 18001-certified organisations: Antecedents and consequences of safety behaviour. Accid. Anal. Prev. 2012, 45, 745–758. [Google Scholar] [CrossRef]
  43. Guinée, J.B. Handbook on LCA, Operational Guide to the ISO Standards; Kluwer Academic Publishers: Dordrecht, The Netherlands, 2002. [Google Scholar]
  44. Havukainen, J.; Zhan, M.; Dong, J.; Liikanen, M.; Deviatkin, I.; Li, X.; Horttanainen, M. Environmental impact assessment of municipal solid waste management incorporating mechanical treatment of waste and incineration in Hangzhou, China. J. Clean. Prod. 2017, 141, 453–461. [Google Scholar] [CrossRef]
  45. Strange, A.; Park, J.; Bennett, R.; Phipps, R. The use of life-cycle assessment to evaluate the environmental impacts of growing genetically modified, nitrogen use-efficient canola. Plant Biotechnol. J. 2008, 6, 337–345. [Google Scholar] [CrossRef]
  46. Siegl, S.; Laaber, M.; H, P. Green Electricity from Biomass, Part I: Environmental Impacts of Direct Life Cycle Emissions. Waste Biomass Valor. 2011, 2, 267–284. [Google Scholar] [CrossRef]
  47. Shi, J.; Li, T.; Zhang, H.; Peng, S.; Liu, Z.; Jiang, Q. Energy consummation and environmental emissions assessment of a refrigeration compressor based on life cycle assessment methodology. Int. J. Life Cycle Assess 2015, 20, 947–956. [Google Scholar] [CrossRef]
  48. Teixeira, E.R.; Mateus, R.; Camoes, A.F.; Bragança, L.; Branco, F.G. Comparative environmental life-cycle analysis of concretes using biomass and coal fly ashes as partial cement replacement material. J. Clean. Prod. 2016, 112, 2221–2230. [Google Scholar] [CrossRef] [Green Version]
  49. Taehyoung, K.; Sungho, T.; Chang, U.C. Analysis of Environmental Impact for Concrete Using LCA by Varying the Recycling Components, the Compressive Strength and the Admixture Material Mixing. J. Sustain. 2016, 8, 389. [Google Scholar] [CrossRef] [Green Version]
  50. Worrell, E.; Price, L.; Martin, N.; Hendriks, C.; Meida, L.O. Carbon dioxide emissions from the global cement industry. Annu. Rev. Energy Environ. 2001, 26, 303–329. [Google Scholar] [CrossRef]
  51. CEN 2004, Eurocod 2. Design of Concrete Structures -Part 1-1: General Rules and Rules for Buildings; UNI-ENV 1992-1-2; British-Adopted European Standard: London, UK, 2004.
  52. Fib–International Federation for Structural Concrete, Fib Model Code for Concrete Structures 2010; Verlag Ernst & Sohn: Berlin, Germany, 2013; Available online: https://onlinelibrary.wiley.com/doi/epdf/10.1002/suco.201200062 (accessed on 2 October 2021).
  53. Edalat Bahbahani, A.; Barros, J.A.O.; Ventura-Gouveia, A. Plastic-damage smeared crack model to simulate the behaviour of structures made by cement based materials. J Solid Struct. 2015, 73–74, 20–40. [Google Scholar] [CrossRef] [Green Version]
  54. Edalat-Behbahani, A.; Barros, J.A.O.; Ventura-Gouveia, A. Application of plastic-damage multidirectional fixed smeared crack model in analysis of RC structures. Eng. Struct. 2016, 125, 374–391. [Google Scholar] [CrossRef] [Green Version]
  55. Edalat-Behbahani, A.; Barros, J.A.O.; Ventura-Gouveia, A. Three dimensional plastic-damage multidirectional fixed smeared crack approach for modelling concrete structures. Int. J. Solids. 2017, 115–116, 104–125. [Google Scholar] [CrossRef]
  56. Soltanzadeh, F.; Edalat-Behbahani, A.; Mazaheripour, H.; Barros, J.A.O. Shear resistance of SFRSCC short-span beams without transversal reinforcements. J. Compos. Struct. 2016, 139, 42–61. [Google Scholar] [CrossRef] [Green Version]
  57. Soltanzadeh, F.; Edalat-Behbahani, A.; Barros, J.A.O.; Mazaheripour, H. Effect of fiber dosage and prestress level on shear behavior of hybrid GFRP-steel reinforced concrete I-shape beams without stirrups. J. Compos. Part B 2016, 102, 57–77. [Google Scholar] [CrossRef] [Green Version]
  58. Ranaivomanan, N.; Multon, S.; Turatsinze, A. Basic creep of concrete under compression, tension and bending. J. Constr. Build. Mater. 2013, 38, 173–180. [Google Scholar] [CrossRef] [Green Version]
  59. Abrishambaf, A.; Barros, J.A.O.; Cunha, V. Tensile stress-crack width law for steel fibre reinforced self-compacting concrete obtained from indirect (splitting) tensile tests. Cem. Concr. Compos. J. 2015, 57, 153–165. [Google Scholar] [CrossRef] [Green Version]
  60. Soltanzadeh, F.; Barros, J.A.O.; Santos, R.F.C. High performance fiber reinforced concrete for the shear reinforcement: Experimental and numerical research. J. Constr. Build. Mater. 2015, 77, 94–109. [Google Scholar] [CrossRef] [Green Version]
  61. Soltanzadeh, F.; Cunha, V.; Barros, J. Assessment of different methods for characterization and simulation of post-cracking behavior of self-compacting steel fiber reinforced concrete. J. Constr. Build. Mater. 2019, 227, 116704. [Google Scholar] [CrossRef]
Figure 1. Seashell sample used in the present study (before crushing), size and configuration. The * is explaining the dimensions of the applied seashell.
Sustainability 13 13120 g001
Figure 2. Processes considered in the environmental analysis of the mortars made of different blended cements developed in this study.
Sustainability 13 13120 g002
Figure 3. Comparison of (a) GWP and (b) ADP impacts of developing 1 m3 mortars using OPC with those of developed by G1-SHi.
Sustainability 13 13120 g003
Figure 4. Comparison of (a) GWP and (b) ADP impacts of developing 1 m3 mortars using OPC with those of developed by G2-NPPi.
Sustainability 13 13120 g004
Figure 5. Comparison of (a) GWP and (b) ADP impacts of developing 1 m3 mortars using OPC with those of developed by G3-NPPi-SHPi.
Sustainability 13 13120 g005
Figure 6. Comparison of GWP impact of developing 1 m3 mortars using different cements.
Sustainability 13 13120 g006
Figure 7. Ratio of GWP and ADP impacts produced by development of 1 m3 mortar using G1-SHPi cements to that of produced by 1 m3 mortar made of OPC.
Sustainability 13 13120 g007
Figure 8. Ratio of GWP and ADP impacts produced by development of 1 m3 mortar using G2-NPPi cements to that of produced by 1 m3 mortar made of OPC.
Sustainability 13 13120 g008
Figure 9. Ratio of GWP and ADP impacts produced by development of 1 m3 mortar using G3-NPPj-SHPi cements to that of produced by 1 m3 mortar made of OPC.
Sustainability 13 13120 g009
Figure 10. Comparison of the E M S c o r e calculated for 1 m3 of the mortars made of the developed cements.
Sustainability 13 13120 g010
Table 1. Details of the produced cements.
GroupIDSH PZOPCDensityBlaineSetting Time FinenessW/cComp. Str. Flex. Str.
(%)(%)(%)(gr/cm3)(cm2/gr)Initial
(Min)
Final
(Min)
(%) (MPa)(MPa)
Ref.OPC0-1003.1203118609094.500.4632.039.88
Group 1G1-SHP44-963.09931187510594.500.4431.618.62
G1-SHP55-953.0943172759094.600.4428.978.70
G1-SHP66-943.0883172759094.600.4329.688.26
G1-SHP77-933.08431727510594.600.4333.128.75
G1-SHP88-923.07831999010594.640.4334.469.56
G1-SHP99-913.073322510513594.690.4331.428.91
G1-SHP1010-903.068327810512094.780.4331.678.68
G1-SHP1515-853.042333010513594.870.4332.598.55
G1-SHP2020-803.016335512013594.920.4331.768.00
G1-SHP3030-702.964343112013595.050.4331.107.81
Group 2G2-NPP10-10903.073333010512094.630.4429.288.95
G2-NPP15-15853.050343013515094.700.4426.398.24
G2-NPP20-20803.026348013516594.770.4425.008.75
G2-NPP30-30702.979369413516594.900.4423.899.14
Group 3G3-NPP10-SHP3310873.05733819010594.730.4326.758.31
G3-NPP10-SHP4410863.052340610512094.770.4328.338.38
G3-NPP10-SHP5510853.047340610512094.770.4331.539.03
G3-NPP10-SHP6610843.042343110512094.820.4326.538.86
G3-NPP10-SHP7710833.037345510512094.860.4326.609.58
G3-NPP15-SHP3315823.03434559010594.740.4329.647.74
G3-NPP15-SHP4415813.029345510512094.740.4332.178.44
G3-NPP15-SHP5515803.024348010512094.790.4326.628.00
G3-NPP15-SHP6615793.018358212015094.870.4331.739.59
G3-NPP15-SHP7715783.013352912015094.880.4329.706.91
G3-NPP20-SHP3320773.010352913516594.850.4330.688.62
G3-NPP20-SHP4420763.005362412013595.020.4331.888.84
G3-NPP20-SHP5520753.000364812015095.060.4326.499.14
G3-NPP20-SHP6620742.995369410513595.140.4331.988.17
G3-NPP20-SHP7720732.990371710515095.180.4329.419.33
G3-NPP30-SHP3330672.963378512013595.070.4328.668.58
G3-NPP30-SHP4430662.958383012013595.150.4329.949.62
G3-NPP30-SHP5530652.953385212013595.190.4328.139.14
G3-NPP30-SHP6630642.948387412015095.230.4329.829.60
G3-NPP30-SHP7730632.943394012015095.350.4330.819.39
Table 2. Quantification of the environmental impact categories related to the production of 1 kg binder.
BinderGWP (100 Years)ODPAPEPPOCPADP (Fossil Fuels)
kg CO2 eqkg R11 eqkg SO2 eqkg PO4 eqkg C2H4 eqMJ eq
SHP0.0681.50 × 10−160.000192.14 × 10−5−1.07 × 10−50.872
NPP0.0894.87 × 10−160.000453.63 × 10−57.57 × 10−50.999
OPC0.8751.63 × 10−160.003600.000310.000214.890
Table 3. Environmental impacts of developing 1 m3 mortars using OPC and blended cements.
BinderGWP
(100 Years)
ODPAPEPPOCPADP
(Fossil Fuels)
kg CO2 eqkg R11 eqkg SO2 eqkg PO4 eqkg C2H4 eqMJ eq
OPC563.2067.48 × 10−132.2730.1880.1313825.740
G1-SHiG1-SHP4551.2647.54 × 10−132.2170.1830.1273770. 098
G1-SHP5546.8197.54 × 10−132.1980.1820.1263750.111
G1-SHP6542.2827.54 × 10−132.1780.1800.1253729.226
G1-SHP7537.8207.54 × 10−132.1600.1790.1233709. 025
G1-SHP8533.5317.54 × 10−132.1400.1770.1223688.304
G1-SHP9528.8077.53 × 10−132.1210.1750.1213667.790
G1-SHP10524.3367.53 × 10−132.1020.1740.1203647.262
G1-SHP15499.4937.50 × 10−132.0040.1650.1133523.461
G1-SHP20477.0387.48 × 10−131.9060.1570.1073407.089
G1-SHP30432.4657.46 × 10−131.7130.1410.0953178.080
G2-NPPiG2-NPP10525.6257.72 × 10−132.1160.1750.1213655.065
G2-NPP15502.1897.79 × 10−132.0280.1670.1153540.556
G2-NPP20479.7497.86 × 10−131.9370.1590.1093423.592
G2-NPP30436.4208.02 × 10−131.7560.1440.0983201.841
G3-SHPi-NPPjG3-NPP10-SHP3512.2597.76 × 10−132.0610.1700.1173582.536
G3-NPP10-SHP4505.6847.78 × 10−132.0420.1680.1163560.777
G3-NPP10-SHP5501.2197.78 × 10−132.0250.1660.1153536.715
G3-NPP10-SHP6496.7587.80 × 10−132.0060.1650.1143514.961
G3-NPP10-SHP7492.4157.82 × 10−131.9890.1630.1123492.830
G3-NPP15-SHP3488.3707.84 × 10−131.9700.1620.1113470.052
G3-NPP15-SHP4483.9357.86 × 10−131.9540.1600.1103448.896
G3-NPP15-SHP5479.4327.86 × 10−131.9350.1590.1093424.708
G3-NPP15-SHP6475.1727.88 × 10−131.9180.1570.1083402.977
G3-NPP15-SHP7470.7517.90 × 10−131.8990.1560.1073380.912
G3-NPP20-SHP3466.6037.92 × 10−131.8820.1540.1063357.903
G3-NPP20-SHP4462.1537.92 × 10−131.8630.1530.1043336.383
G3-NPP20-SHP5457.8807.94 × 10−131.8460.1510.1033312.325
G3-NPP20-SHP6453.4167.96 × 10−131.8270.1490.1023290.828
G3-NPP20-SHP7448.9887.98 × 10−131.8080.1480.1013269.190
G3-NPP30-SHP3423.3148.06 × 10−131.7020.1390.0943134.316
G3-NPP30-SHP4416.5928.08 × 10−131.6850.1370.0933113.022
G3-NPP30-SHP5412.3598.10 × 10−131.6660.1360.0923091.509
G3-NPP30-SHP6407.9088.12 × 10−131.6490.1340.0913067.497
G3-NPP30-SHP7403.6808.12 × 10−131.6310.1330.0893046.147
Table 4. Normalized environmental impacts of developing mortars using OPC and blended cements, and its corresponding EMScore.
BinderGWP
(100 Years)
ODPAPEPPOCPADP
(Fossil Fuels)
E M S c o r e k
kg CO2 eqkg R11 eqkg SO2 eqkg PO4 eqkg C2H4 eqMJ eq-
OPC563.2067.48 × 10−132.2730.1880.1313825.7400.905
G1-SHiG1-SHP4558.5237.64 × 10−132.2460.1860.1293819.7440.899
G1-SHP5604.4588.34 × 10−132.4300.2010.1394145.4060.974
G1-SHP6585.0688.13 × 10−132.3500.1940.1344023.4590.943
G1-SHP7520.0137.29 × 10−132.0880.1730.1193586.2160.839
G1-SHP8495.9007.00 × 10−131.9890.1640.1143428.1610.801
G1-SHP9538.9477.68 × 10−132.1620.1790.1233738.1210.871
G1-SHP10530.1557.62 × 10−132.1250.1760.1213687.7410.857
G1-SHP15490.8447.37 × 10−131.9690.1630.1113462.4540.798
G1-SHP20480.9477.55 × 10−131.9210.1590.1083435.0130.785
G1-SHP30445.3787.68 × 10−131.7640.1450.0973272.9710.734
G2-NPiG2-NPP10574.9408.44 × 10−132.3150.1910.1323997.9880.934
G2-NPP15609.2969.45 × 10−132.4610.2020.1404295.6880.997
G2-NPP20614.6551.01 × 10−122.4820.2040.1404386.3061.000
G2-NPP30584.9051.08 × 10−122.3540.1920.1314291.2170.976
G3-SHi-NPjG3-NPP10-SHP3613.1999.29 × 10−132.4670.2030.1404288.4760.999
G3-NPP10-SHP4571.6018.79 × 10−132.3080.1900.1314024.9290.934
G3-NPP10-SHP5509.0357.9 × 10−132.0570.1690.1173591.8670.833
G3-NPP10-SHP6599.5889.41 × 10−132.4210.1990.1374242.5710.982
G3-NPP10-SHP7592.7489.41 × 10−132.3940.1970.1354204.5150.972
G3-NPP15-SHP3527.6518.47 × 10−132.1290.1750.1203749.1620.867
G3-NPP15-SHP4481.8037.83 × 10−131.9450.1600.1103433.7060.793
G3-NPP15-SHP5576.7589.45 × 10−132.3270.1910.1314119.9320.950
G3-NPP15-SHP6479.6007.95 × 10−131.9360.1590.1093434.6830.791
G3-NPP15-SHP7507.5238.52 × 10−132.0470.1680.1153645.0130.838
G3-NPP20-SHP3486.9778.27 × 10−131.9640.1610.1103504.5270.805
G3-NPP20-SHP4464.2357.95 × 10−131.8710.1530.1053351.4170.768
G3-NPP20-SHP5553.5839.6 × 10−132.2320.1830.1254004.6480.917
G3-NPP20-SHP6454.0637.97 × 10−131.8300.1500.1023295.5210.753
G3-NPP20-SHP7488.9848.69 × 10−131.9690.1610.1103560.4100.813
G3-NPP30-SHP3473.0099.01 × 10−131.9010.1550.1053502.2740.793
G3-NPP30-SHP4445.6048.64 × 10−131.8020.1470.0993329.8180.751
G3-NPP30-SHP5469.4419.22 × 10−131.8970.1550.1053519.4620.793
G3-NPP30-SHP6438.1088.72 × 10−131.7720.1440.0973294.6100.741
G3-NPP30-SHP7419.6578.44 × 10−131.6950.1380.0933166.7130.711
Publisher’s Note: MDPI stays neutral with regard to jurisdictional claims in published maps and institutional affiliations.

