Abstract
Green stormwater infrastructure (GSI) has emerged as a promising decentralized management approach to urban stormwater challenges. A lack of data about GSI performance interferes with widespread adoption of GSI. A citizen science program that benefits researchers, lay scientists, and municipalities offers a way to provide these lacking data. We have developed an open-source, transferable green infrastructure rapid assessment (GIRA) protocol for studying the performance of GSI with citizen scientists. This protocol has been tested in six North American cities (New York City, Toronto, Vancouver, Chicago, San Francisco, and Buffalo). In this research we define the performance of GSI in varying geographic, climatic, and maintenance conditions with the intent to create technological, institutional, and management solutions to urban stormwater problems. The GIRA protocol was used by citizen scientists to assess the physical properties and capabilities of bioswales, while small, affordable Green Infrastructure Sensors Boxes (GIBoxes) were used to determine longer-term function across several rain events. Our results indicate that teams of citizen scientists can be effective for collecting and archiving widespread information on the post-installation function of GSI. The effort also showed that citizen scientists had changes in understanding of urban stormwater challenges and the role that GSI can play in solving these problems. We explore the multiple benefits to knowledge, participants, and municipal partners as a result of this research.
1. Introduction
Altered hydrologic flows associated with urbanization and changing land use practices result in significantly increased runoff and contaminant loading to adjacent and downstream watersheds [1,2,3]. For example, natural landscape runoff volumes range between 10% and 30% of a rain event, however, in urbanized areas these volumes can exceed 50% [4] causing wide-spread flooding [5]. Additionally, the combined sewer systems found in many older major cities such as New York City (NYC), Chicago, and Toronto were built in the late nineteenth century and were designed to direct both domestic sewage and stormwater to wastewater treatment plants for processing before being discharged into receiving waters [6,7,8]. As these cities became more densely populated and their impervious cover increased, the volume of both domestic sewage and stormwater grew. These increased inflow volumes can exceed the capacity of wastewater treatment plants during intense rainfall events and release diluted raw sewage into waterways as combined sewer overflows (CSO) [9,10].
There are many strategies to mitigate the effects of urban stormwater challenges including high-cost capital outlays for upgrades to their ‘grey’ infrastructure flood detention and retention structures [11]. Since the early 1990’s, however, the use of green stormwater infrastructure (GSI) [12] has gained attention as a promising on-site low impact development (LID) approach for intercepting and treating stormwater before it enters city sewer systems [12,13]. GSI can take many forms from large scale greenbelts and parks to more focused design efforts such as rain gardens, bioswales and green plazas. GSI has many additional environmental benefits such as local groundwater recharge, water conservation, and habitat creation [12,14]. Green Infrastructure has the advantage of being decentralized, so it decreases disturbance of the built environment, requires lower short-term capital investment, and brings numerous ancillary benefits to enhance urban livability (i.e., offsets urban heat island effects, creates green spaces for gathering) [15]. Because of all these reasons, GSI is increasingly being used in urban areas to offset stormwater related flooding as well as CSO and surface runoff water quality degradation [16]. For example, as of early 2020 NYC has committed to invest over $410 million for green infrastructure projects since 2012 as of March 2017, with an additional $850 million budgeted over the next decade with the intent to spend an additional $1 billion in the next decade [17]. Other older North. American cities with aging combined sewer systems, such as Chicago, Washington DC, San Francisco, and Toronto, with aging stormwater infrastructure and combined sewer systems are similarly investing in GSI to address urban runoff challenges [18].
Despite the large GSI investments in many urban areas and while GSI systems are often designed and implemented according to engineering, hydrologic, or other design and performance metrics, how these systems evolve and function across time and space is relatively unknown [19]. To date, relatively few observational studies [20] of GSI performance have been completed. Where studies have been done, the available results have shown that the effectiveness of GSI for water interception [21] and contaminant removal is variable [14,22,23] and GSI functionality is dependent on the system location, soil composition, and hydraulic conductivity [20,24]. Furthermore, the implementation and design of GSI varies and is quite diverse across cities and the rapid uptake and heterogeneous nature of cities has led to problems understanding GSI performance [19,25,26,27] This challenge is so fundamental that the scientific literature struggles for a common naming structure and system for GSI [12]. Furthermore, the variation and diversity of designs and the differences in hydrology, climate, and culture across cities make it challenging to understand the success or failure of these systems for intercepting and storing stormwater. Additionally, the “functions” of GSI include more than just infiltration of water as GSI is expected to: improve appearance, maintain plant health, reduce urban heat island temperatures, reduce aesthetic concerns about appearance, provide for plant health, and improve overall hydrologic function in cities [28,29,30]. A persistent challenge that interferes with more widespread adoption of GSI by many municipalities, however, has been the paucity of consistent data regarding performance. This paucity of data is due, in part, to the logistical limitations of scientific research teams to be able to mount the large-scale sampling efforts needed to collect data.
Considering the number of small, highly diverse GSI installations in North American cities, we pursued the idea that citizen science could be an effective approach for assessing the performance of bioswales using a GI Rapid Assessment (GIRA) protocol. The involvement of citizen scientists—members of the public for the collection of scientific data—is seen as an effective approach to collecting environmental data that yields multiple benefits [31,32,33]. In assessing GSI, citizen scientists with training and simple materials might provide the kind of repeated, fine-scale measurements and observations needed to complement more intensive and expensive methods. Furthermore, benefits to the others involved in a citizen science program—in our case, both the citizen participants themselves, and city partners—hold the promise of win-win outcomes. Citizen science programs can provide a combination of benefits for citizens and scientists (Figure 1) and achieve at least complementarity (where aggregate benefits exceed non-partnership program outcomes) if not actual synergy (where benefits to both scientists and citizens exceed non-partnership outcomes [34]. In this paper we elaborate on three sets of benefits: (1) scientific benefits of the GIRA protocol and approach as a one-time assessment of GSI with the potential for collecting data that would otherwise be more difficult and/or expensive to collect; (2) citizen participant benefits, including learning, engagement in the issue under investigation, a sense of connection to scientists and local managers involved in addressing issues of importance in their local community, and development of self-efficacy or agency in their own ability to address the issue [35,36,37]; and (3) benefits for local organizations and agencies from partnering with the local public with the potential for using the protocol and approach to monitor (one-off or regular) GSI in their cities, thus expanding data collection both in space and time beyond their capacity [37,38].
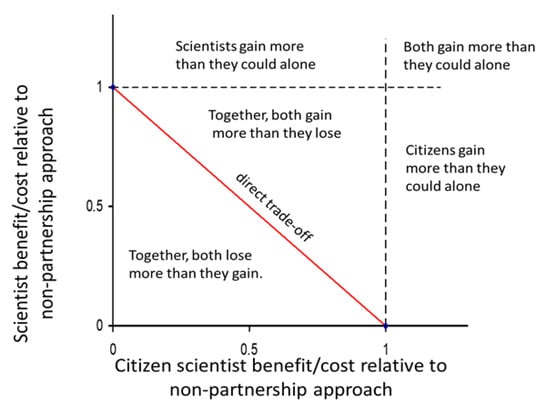
Figure 1.
Aggregate benefits of Citizen Science (CS) programs can be visualized as above. Synergy, where citizens and/or researchers gain more than they could on their own is the gold standard for CS programs but not always obtained. Complementarity, where the benefit to both exceeds the direct 1:1 trade-offline, might be more common [34].
The problem of how GSI systems work across a diverse set of cities, design standards, and maintenance protocols provides a unique opportunity to investigate how professional researchers and citizen scientists can work together to understand environmental systems and human interventions in those systems. This opportunity led us to investigate GSI function across a diverse set of North American cities. In this process we engaged citizen scientists to train them in sustainability challenges, urban hydrology, and the function of GSI systems. In this study we addressed these questions:
- (1)
- What were the learning and other benefits of a campaign style snapshot citizen science experience for participants, and how effective were the training and protocols at engaging and preparing citizen scientists?
- (2)
- What were the benefits of the campaign style citizen science program for scientists and city partners, and how did the citizens’ measurements compare to laboratory and sensor based scientific measurements?
- (3)
- What were the aggregate benefits/costs of the GIRA approach for citizens, scientists and city partners together, and how can these be maximized in future citizen science approaches to studying GSI?
To address these questions, we assessed the performance of the GIRA protocol and our citizen science (CS) training program in studying GSI in six North American Cities—San Francisco, Vancouver, Chicago, Toronto, Buffalo, and New York. The protocol and CS program were implemented in one-day sampling campaigns with citizen scientists followed by automated sensor monitoring over the ensuing months. The short duration of the program places it on one end of the CS spectrum, with the expectation that it might result in more limited benefits to all participants than longer, more intensive programs [39], but with the potential to be highly adaptable and transferable for broad application in both short and long program contexts.
2. Materials and Methods
2.1. Study Sites
We studied GSI basins in six North American Cities—San Francisco, Vancouver, Chicago, Toronto, Buffalo, and New York. Each of these study cities have been grappling with similar stormwater challenges due to a high degree of impervious area and the presence of combined sewer systems in at least part of each city. Additionally, all had specific plans for implementing GSI, and the plans for each city relied heavily on the implementation of bioswales. Study sites in each city varied from locations in residential neighborhoods, commercial districts, and dense downtown mixed-use areas of the studied cities. Across the cities we focused on studying systems that are known as bioswales while they might go by different names depending on the city. A total of 71 bioswales were studied using a Green Infrastructure Rapid Assessment (GIRA) approach with the scientific goal of assessing how the design, the environment, and the climate affected their functionality.
2.2. Citizen Science Program
The citizen scientists in our program were employees of HSBC Bank, a retail banking company, who were participating in one-day events across the US and Canada called the Sustainability Training Programme (STP) organized by Earthwatch Institute. The STP follows a partnership model similar to that described in Barker et al. [40] and blends classroom climate change and sustainability education with hands-on citizen science research. The engagement activities are structured around the ‘4As’ in the learning model [41] (namely Awareness, Agency, Association and Action). STP goals included increasing awareness of urban sustainability and green infrastructure, direct networking and partnering with local city partners who implement and manage GSI and building agency and identifying pathways to act—both on a personal and professional level. Over the course of two years (2018, 2019) we held 18 citizen science events in 6 cities. Each STP event had approximately 20 citizen science participants and overall the program involved 334 participants.
It was within this larger, full day STP event that the GSI Citizen Science Program took place. This program was designed by the science team, in collaboration with HSBC and Earthwatch staff, and input from city managers and community organizations in each city. In each STP event, the citizen science component comprised approximately 3 ½ h. In the first 30 min, participants were oriented to sustainability challenges in built or urban environments and then given specific background on how and why GSI is deployed in cities. This specific background focused on how GSI is used as a nature-based solution to minimize flooding, improve water quality, and reduce heat hazards in cities. Background and initial training for each protocol was included at the end of the presentation. Team scientists developed a common slidedeck for use in the orientation session which was modified with specific information about each city from city partners. Feedback from participants and the project team was used to revise and fine tune the orientation such that by the end of the 18 events it was highly effective. Once this general orientation was completed the citizen scientist teams were divided into two groups: ‘diggers’ and ‘drawers,’ with several teams of 3–4 participants comprising each group. Each team received clipboards with the requisite data sheets and detailed instructions, a backpack with all the requisite supplies and water jugs containing 2–3 gallons of water for the infiltration studies. Additional measures for safety, such as a first aid kit, neon safety vests, and gloves were distributed through backpacks, and a group safety briefing was given before traveling to the sites to manage the risks associated with working in a built and busy urban environment. Prior to the teams being deployed to make measurements and observations independent of the lead scientists, they were guided through the GIRA approach by scientists and Earthwatch team members on (a) how to make discrete measurements and observations and record data at a sample GSI site using the GIRA protocols and (b) how install the real-time GSI monitoring sensor systems.
The ‘diggers’ carried out discrete measurements for assessing the GSI function while the ‘drawers’ focused on spatial observations related to bioswale features and conditions. Field data collection was limited to 2 ½ h, during which each team studied 2 or 3 bioswales, ending with submission of datasheets to the project scientists. Very quick data review, entry and summary was performed by the scientists while the citizen participants were engaged in a different facet of the STP event, after which preliminary analyzes were presented to the group. This final 30-min session provided for important validation of the citizen participants and for discussion of the strengths and limitations of the protocols which helped us revise our methods before the next event. Review of data sheets before the end of the event was a critical component in addressing any hard to read handwriting, or possibly mislabeled information on the data sheets.
To assess the effectiveness of the program at engaging citizen scientists and achieving our intended learning and other outcomes, we used a survey administered in the last minutes of the STP event. Participants were asked to rate their current (post-participation) and pre-participation level of understanding, confidence and motivation for the constructs shown in Table 1, using a scale from 0 (extremely low) to 10 (extremely high). Retrospective pretest-posttest surveys are both efficient and can be quite reliable for gauging both end-of-program attainment and gains [42], though some have noted the possibility of bias in the results (e.g., [43]). The survey used with STP participants may suffer from relatively lower bias as (a) the time between pre and post is short (<1 day), (b) the questions were more generic rather than specific—reducing cognitive effort and potential for confusion. Furthermore, the expected learning is socially positive (from the perspective of the program and participants, i.e., understanding how to make society more sustainable is a good thing)—which may in fact underestimate the magnitude of the gain in learning outcomes [43]. Results were analyzed with a paired-samples t-test using IBM SPSS Statistics (ver. 28.0.0.0).

Table 1.
Questions in the Post-event survey assessing level of knowledge, confidence or motivation. Participants were first asked to Rate your current level of each item, and then were asked Thinking back to before the program, what was your level of each item?
2.3. Green Infrastructure Rapid Assessment Protocol
The Green Infrastructure Rapid Assessment (GIRA) protocol was designed so that citizen scientists with only very limited training (ca. 1 h), simple supplies and limited or no supervision could collect useful data about the function, components, and status of GSI bioswales. Parameters were selected that we believed would be valuable scientifically and both accessible and engaging to the citizens. The GIRA protocol and associated supplies and supporting materials evolved between each event and most significantly between the first and second year of the project.
2.4. Functional Measurements of Bioswales
The diggers group measured infiltration rates and soil texture at two representative locations, took an intact soil sample for subsequent lab analysis and installed a GI Sensor Box in each swale. Infiltration rates were measured using a 10 cm diameter, 25 cm long clear plexiglass cylinder as an infiltrometer with the bottom edge beveled for easier insertion into the soil. A 10 cm ruled scale was taped inside the cylinder with “0” at 2 cm above the bottom, the depth to which the cylinder was inserted in order to prevent leakage around the bottom of the cylinder. As is standard practice [44], the infiltrometer was first filled with 100 mm of water and allowed to drain one time to saturate the soil and enhance the consistency of subsequent measurements. Once this water was drained the infiltrometer was refilled to 100 mm and then times were recorded for each 20 mm of decline. Measurements of infiltration were made for a maximum of 4 min. If the initial ‘saturation’ water did not drain, a result of “very slow” was recorded for the location. Infiltration measurements were made at two locations in each bioswale, one that was obviously impacted by water flow (typically the inlet), and the other a location not impacted by flowing water (typically the center of each basin). Two measurements were taken at each location, for a total of 4 measurements per bioswale. The digger group used the USDA Soil Texture Field Guide [45] to determine soil texture by feel at each of the two locations where infiltration was measured. The digger group installed the GI Sensor Box as described below. Finally, the digger group collected a single, intact soil core using a 50 mm long 50 mm diameter stainless steel cylinder. This core was carefully removed and sealed tightly in a plastic bag without disturbing the sample and then shipped (by the research team) to the University of Arizona for further analysis of hydraulic conductivity. The soil core samples were analyzed at the University of Arizona in a Reynolds tank using a falling head permeameter test to quantify hydraulic conductivity [46]. Hydraulic conductivity values were compared to observed infiltration rates at each bioswale to assess the consistency of the citizen scientists’ measurements.
2.5. Spatial Observations of Swale Components and Status
The drawers group developed spatial information about each bioswale. We were interested in parameters that are critical in determining the hydrological, ecological, and aesthetic functions and benefits of the GSI, and where on-the-ground observations would complement remote- and aerial imagery. We focused on parameters that citizen scientists would find interesting and accessible. The list of parameters for the diggers group included: (1) fine-tuned mapping and measurement of bioswale size and shape (including the locations of the soil sampling, infiltration measurements and sensor placement), (2) amount and pattern of cover types, (3) qualitative rating of key features (plant status, maintenance condition, aesthetic appearance, inlet and outlet status), and (4) size, configuration and special features (e.g., inputs of water from roof runoff, etc.) of the drainage area feeding the bioswale. Participants used meter tapes to measure the borders of the swale and created a to-scale drawing of the bioswale’s dimensions using a grid diagram provided in their backpack. Using their cell phones, they took photos of the whole bioswale, and close-ups of the outlets and inlets, which they shared with the research team for subsequent use. They identified the different cover types on the bioswale (e.g., bare soil, rocks, trees, and trash) and used different shading to classify each grid on their drawing of the swale. These data were used to determine the percentage of each cover type on the swale. The locations of the diggers’ sample, infiltration measurement and Sensor Box locations were recorded on their map. The drawers assessed the bioswale for aesthetic condition, plant status, maintenance and inlet/outlet condition using simple scales. Finally, drawers walked and mapped the drainage area that they estimated drained into the examined bioswale, using a preliminary map for each swale provided to them that was based on aerial imagery and a high-resolution elevation map. Rudimentary estimates of the drainage area, and comments on specific features of potential importance to the bioswale (e.g., block street gutters up gradient from the swale) were recorded.
2.6. Real-Time GSI Monitoring: Green Infrastructure Sensor Boxes
Low-cost Green Infrastructure Sensors Boxes (GIBoxes) were constructed to monitor bioswale stormwater infiltration and retention in real-time. GIBoxes were built out of a waterproof rigid-shell container that could withstand various environmental conditions for long durations. Each GIBox was equipped with an arduino powered Particle Electron Microcontroller (vendor info) and sensor array consisting of 3 components:
- a surface moisture sensor (Vegetronix, Riverton, UT, USA) to detect rain or any inflow for activating the system
- two in-soil moisture sensors (Vegetronix, Riverton, UT, USA) placed at specified depths, one at 4-inches depth and the other at 8-inches depth for monitoring infiltration and retention
- a thermistor (vendor info) for recording bioswale surface temperatures
Once the GIBox system was activated by the surface moisture sensor, the soil-moisture sensors were programed to record data in 20-min intervals until the soil moisture conditions fell below a pre-programmed soil moisture threshold level (350) at which time the system would be deactivated to save power and reduce data overload. System data recorded during the period of activation was transmitted in real time via the cloud-based Electron Network (Particle, San Francisco, CA, USA). The Electron Network temporarily stored the sensor data and then the data was transferred from the platform using a webhook method to a Google Spreadsheet.
One GI Sensor Box was installed by the digger citizen science group in each bioswale in a location at the corner farthest from the inlet. The id name of the individual sensor and the time the installation began were recorded on the datasheet and then the box was place at the bottom of a hole dug using gloves approximately 30 cm long × 15 cm wide × 20 cm deep. The GI Sensor Box was positioned in the hole with its components arranged as shown in the diagram (Figure 2), with soil placed back into the hole as each sensor component was installed, beginning with the bottom-most component at 20 cm deep and working up to the surface level. The location of the sensor box in the bioswale was then marked on the map with an ‘S’, and we were able to retrieve most of the sensors using this information.
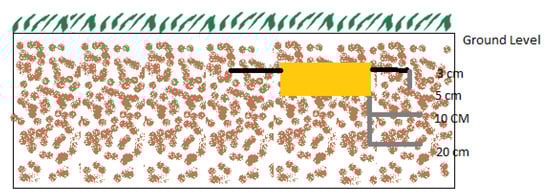
Figure 2.
Conceptual diagram depicting GIBox installation with location soil moisture sensors at 10 and 20 cm below the soil surface.
3. Results
3.1. Citizen Scientist Outcomes
The results of the retrospective surveys of participants’ self-assessment of their learning during the STP event indicate that the combined workshop and field science experience impacted their understanding of environmental challenges particularly those related to stormwater and hydrologic alterations of the environment due to urbanization. A total of 328 out of a total of 334 program participants completed the surveys from both field seasons in 2018 and 2019 (a 98.2% survey completion rate!). Mean scores across all eight questions increased significantly from pre- to post-participation (p < 0.001, one-sided t-test, across all pairs; Figure 3 and Figure 4). While participants rated their current level of understanding of the different questions similarly, the main difference across questions was in the participant’s sense of understanding before participating in the program. Participants rated their prior understanding about climate change relatively higher (compared to the other questions)—and their self-assessed gain in knowledge over the course of the program was relatively low. Several of the largest increases in confidence in understanding were for the participants’ understanding of the function of GSI in cities and how the research they participated in would be successful. For questions pertaining to the participants motivation to act (Figure 3), the self-assessed gains from participating in the program were also significant and similar across the questions surveyed. Participants rated they had a 25–30% increase in motivation and/confidence after participating in the program to act around sustainability issues (Figure 3). Twenty-two participants provided open-ended comments. Seventeen shared positive comments such as that the experience was “worthwhile to take a step back for one day to reflect and understand from both a classroom and practical perspective [on] how to apply sustainability everyday”. Five people shared neutral or critical comments such as “While I think this is a great format for the program, walking around Brooklyn for a half hour won’t bring me closer to nature”.
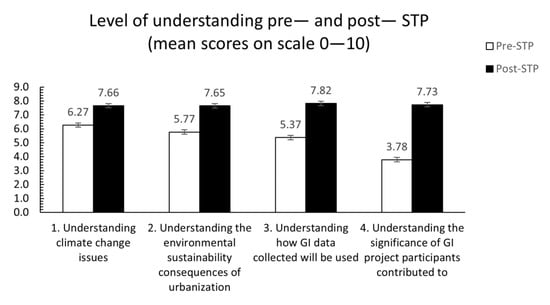
Figure 3.
Mean scores (± standard errors) of pre- and post-STP survey responses to questions focusing on the participants’ understanding of focal issues (climate change, urbanization), and the significance of the green infrastructure field research activities that they participated in. (Q1 pair: t = 17.600, df = 322, p < 0.001; Q2 pair: t = 20.373, df = 327, p < 0.001; Q3 pair: t = 20.907, df = 326, p < 0.001; Q4 pair: t = 27.201, df = 325, p < 0.001).
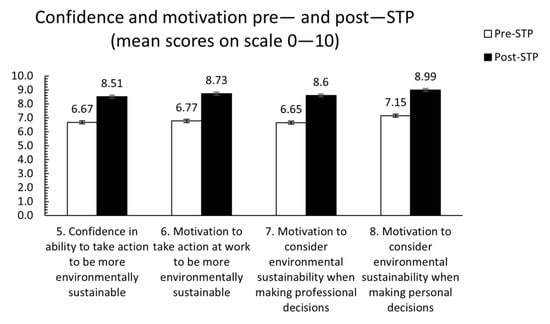
Figure 4.
Mean scores (± standard errors) of pre- and post-STP survey responses to questions focusing on the participant’s confidence to take environmentally sustainable actions, motivation to act at work, and to consider environmental sustainability when making professional and personal decisions. (Q5 pair: t = 16.372, df = 327, p < 0.001; Q6 pair: t = 18.858, df = 327, p < 0.001; Q7 pair: t = 18.015, df = 326, p < 0.001; Q8 pair: t = 18.496, df = 326, p < 0.001).
3.2. Bioswale Functional Measurements and Spatial Observations
3.2.1. Functional Measurements
The results of the study showed that hydrological functionality of bioswales was strongly influenced by their management, age, size, and initial soil type. These results have important implications on how new bioswales should be designed as well as how they should be maintained to ensure long-term functionality.
Our infiltration and laboratory data on the relative permeability of soils across the various cities show differences and similarities across the cities. First, across all cities, the field infiltration rate is significantly higher than the lab measured hydraulic conductivity (Figure 5). This result is reasonable, given that the time course of the field infiltration rate was, at most, 30 min—a time that may not have been sufficient to ensure total soil saturation. Additionally, the relatively narrow diameter of the infiltration ring used in this project may have increased the edge effect on the infiltration measurements thus skewing measurements higher overall. Second, the laboratory hydraulic conductivity measurements show general agreement within cities, indicating relatively consistent soil conditions and measurement ability in each city. Third, Toronto has noticeably higher field infiltration rates and lab measured hydraulic conductivity than the other cities. Fourth, New York City and Buffalo similarly have high field measured infiltration rates, but lower lab measured hydraulic conductivity values compared to other cities.
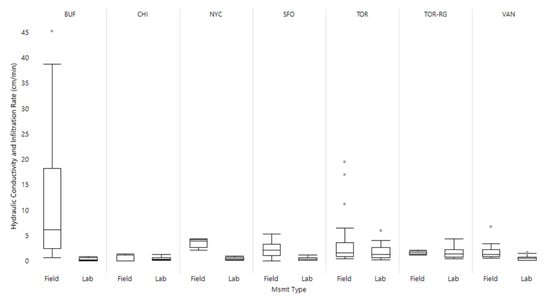
Figure 5.
Field and laboratory infiltration rates and hydraulic conductivity values across the cities studied displayed as a box and whisker plot showing the median, 25% and 75% quartiles the full range of the data and extreme values.
In general, the results are expected and reasonable, since these GI systems were all installed to design specifications and were generally constructed with coarse grained (“engineered”) soils. The laboratory measurements are consistent with a sand-rich soil, which was further confirmed by the field textures that resulted from the USDA Field texture approach, mostly loamy sands, and sandy loams. The experience in the field does give cause for some caution, however. Our soil cores were generally collected at very shallow depths (2 inches of surface soil), and in some cities this only consisted of installed soil materials. Deeper soil layers may have lower conductivity consistent with local geology and may result in reduced performance of some bioswales.
3.2.2. Spatial Observations
Bioswale size differed significantly across cities but also between the direct measurement and shaded box techniques that were developed as part of the GIRA protocol (Table 2). Bioswales were largest at over 50 square meters each in San Francisco and Toronto while New York came in with the smallest sized bioswales at 8 square meters each. These differences likely reflect the cost of land as well as design preferences and the study locations within each of these cities. For example, the Buffalo sites were in the city’s central business district while Vancouver, Toronto, and San Francisco sites were in more outlying lower density regions of each city.
Table 2.
Area of swales as estimated by perimeter measurement versus filled boxes in to-scale maps of the swales.
Across the studied cities there were significant differences in maintenance status and aesthetic ratings for the various bioswales that were being studied. In general participants rated the bioswales to be in an aesthetically pleasing status (Figure 6). With San Francisco and Chicago having lower ratings than the other cities. In Chicago, New York, San Francisco, and Toronto the inlets to the basins were observed to be partially or fully blocked for some basins implying an impact of maintenance on the design function of these bioswales (Figure 6). Plants were generally regarded as healthy across all cities except Chicago (Figure 6). Buffalo and Chicago were both sites with well-trimmed plants while San Francisco has completely untrimmed plants. The other cities had some locations with trimmed and some with untrimmed plants (Figure 6). Similarly, the cities diverged when it came with respect to trash with New York bioswales beset by observable trash while San Francisco, Toronto, and Vancouver had no trash with Chicago and Buffalo falling into a mixed category with respect to the presence of trash (Figure 6).
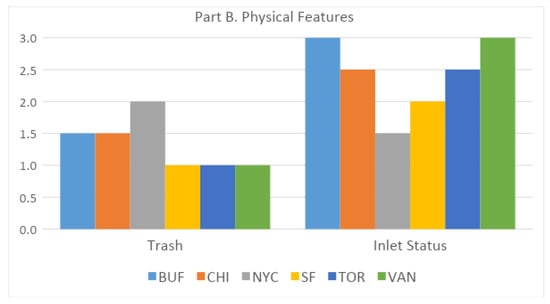
Figure 6.
Mean ratings of aesthetic and vegetation features (Part A, top panel) and physical features (Part B, bottom panel) of bioswales in 6 North American cities assessed by citizen scientists using the GIRA protocol in 2019. Scales were as follows. Aesthetic rating: 1 = ugly to 5 = beautiful. Plant Health rating: 1 = dead, 2 = poor, 3 = fair, 4 = good. Untrimmed Plants rating: 1 = no, 2 = yes. Trash rating: 1 = none, 1.5 = some, 2 = a lot. Inlet Status rating: 1 = blocked, 2 = partially blocked, 3 = open.
3.2.3. Vegetation Differences
The cities had observable differences in vegetative cover (Figure 7). The observed Chicago basins had a large amount of bare ground as did basins in Buffalo. New York also had a notable amount of bare ground along with rocks presumably placed as surface mulch. The other three cities had robust ground coverage but different mixes of plants. In Toronto grasses and shrubs dominated bioswale ground cover. In Vancouver herb coverage dominated the surface of bioswales. Finally, San Francisco basins were roughly equally covered by shrubs, grasses, and herbs.
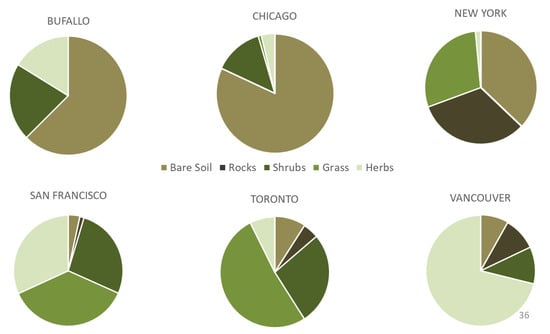
Figure 7.
Average % cover estimates in bioswales in 6 North American cities as measured by citizen scientists using the GIRA protocol in 2019.
3.2.4. Real-Time GSI Monitoring: Green Infrastructure Sensor Boxes
While GIBoxes were deployed in multiple bioswales across the many cities we worked in, here, we present the 2019 sensor data for one bioswale in two of the study cities: Buffalo, New York-USA and Vancouver, British Columbia-Canada (Figure 8). The soil moisture sensor data from 10 cm and 20 cm below the soil surface, is compared against daily precipitation records in each city as recorded by the local meteorological agency (Figure 9). The Buffalo bioswale was one of many similarly designed bioswales along a main roadway. These bioswales generally featured a combination of bare soil, herbaceous plants, and woody shrubs, with some canopy over from adjacent street trees and hanging planters attached to streetlamps and were maintained by the city. The bioswale where BUF-Y was located (Figure 8A) contained roughly 50% bare soil, 50% shrubby vegetation, plus one tree. The Vancouver bioswale was in a residential area, with tree-lined streets. The bioswale where VAN-X was located (Figure 8B) contained approximately 25% bare soil with rocks and 75% herbaceous perennials.
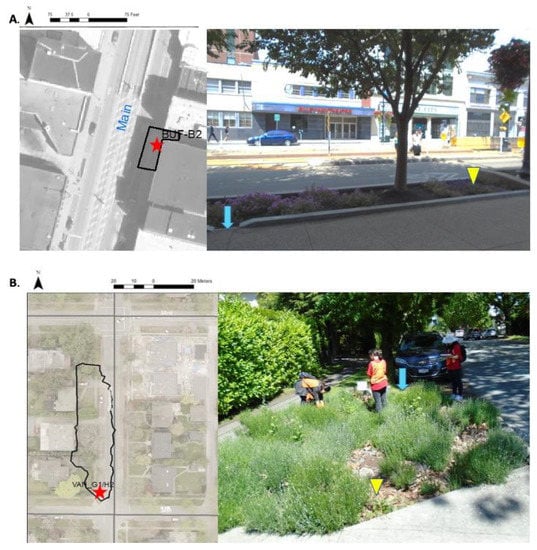
Figure 8.
Aerial Images and photos of A. Buffalo, NY (A) and B. Vancouver, BC (B) bioswales where BUF-Y and VAN-X, respectively, sensor data was collected. Aerial images to the left of each photo, provided to citizen scientists with their GIRA protocol packets, show an outline of estimated drainage area for each bioswale with location of bioswale depicted by red star. Photos to the right of aerial images depict the approximate location of bioswale inlets (blue arrows) and areas where the sensor GIBox were installed (yellow triangles).
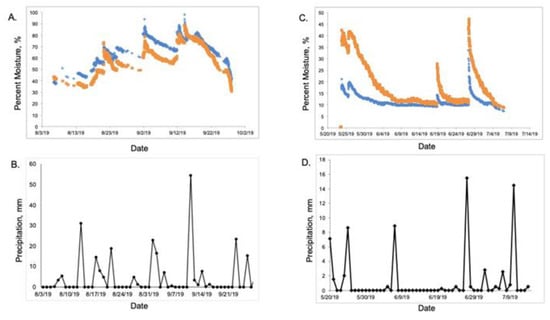
Figure 9.
GIBox soil moisture sensor and local local meteorological agency precipitation data for the Buffalo, NY bioswale (BUF-Y; A,B) and the Vancouver, BCbioswale (VAN-X; C,D). Soil moisture data is recorded as percent moisture for sensors located at 10 cm (blue) and 20 cm (orange) below the soil surface. Precipitation data (black) is recorded in millimeters. The VAN-X (C) GIBox 10 cm and 20 cm moisture sensors were inadvertently switched when installed by the citizen scientists.
The sensors installed in the Buffalo, NY bioswale (sensor BUF-Y) reflected a steadily increasing trend in soil moisture over the approximately 2 months of operation (6 August 2019 to 27 September 2019; Figure 9A). The sensor results do not directly correlate with precipitation data gathered from the first three large rain events between 08/15 and 08/22, but the soil at both depths does gain and retain moisture during this period. The sensor results do, however, correlate well with the larger rain events in September 2019, particularly the large storm on 12 September. In all cases, the bioswale appears to accumulate soil moisture over time, perhaps pointing to drainage issues in conjunction with steady precipitation during the sensor’s period of operation. The sensors installed in the Vancouver bioswale (sensor VAN-X) showed a correlation between the 10 cm and 20 cm soil moisture sensor depths and reflects the rain events recorded during the sensor’s approximate 2 months of operation (23 May 2019 to 16 July 2019; Figure 9B). Rises in soil moisture are seen in the sensor data on 5/24/–5/26, 6/18/, and 6/27. Based on daily precipitation data, Vancouver saw notable rain events on 5/24–5/25, 6/7, and 6/27, aligning with the sensor readings for the first and third rain events; the increase on 6/18 is somewhat anomalous, and may be caused by other local runoff unrelated to weather events, such water from a car being washed, or from a local community member watering the bioswale vegetation.
Collectively, the preliminary findings in these two bioswales as well as across all cities (not shown) show that where there is a strong correlation in soil moisture between the two depths of soil monitored, we also find less evidence of compaction in the top horizons of the soil as well as better rates of drainage. For the sensors that show spikes in soil moisture correlating with rain events recorded for that city, there is an initial jump in soil moisture as the bioswale is inundated with runoff followed by a slower decrease in soil moisture over time as the water drains out of the system. Based on the evidence provided by our experimental sensors, it is possible to track the length of time a bioswale takes to drain after a rain event and return to pre-rain levels of soil moisture.
4. Discussion
One of the persistent challenges that interferes with the widespread adoption of GSI by many municipalities has been the perceived paucity of consistent data regarding its performance [19,25,26,47]. Here we offer one solution to these data gaps via engagement with citizen scientists. In addition to the benefits to scientists, such engagement is beneficial to participants and municipalities. For participants, this engagement fosters a deeper understanding of urban stormwater challenges and various solutions for addressing the challenges. For municipalities, it creates a reproducible and consistent approach for data collection as well the development of an informed public that can better partner with cities in the implementation of solutions that reduce public risks to stormwater-related flooding and runoff pollution [48]. Critical to this engagement, however, is ensuring both (a) the integrity and reproducibility of the data collected so that it can be used in GSI performance analyses and (b) that citizen scientists benefit from the experience and go away with targeted and specific knowledge gains [49]. Here, our citizen science program design with GIRA approach implementation as a model, we discuss the details of interactions between researchers, citizen scientists, and municipal and local actors.
4.1. Learning and Other Benefits to Participants
The science team developed a very condensed introduction to the GSI-CS program and protocols to engage and motivate as well as teach and train participants, comprising only a 30-min indoor presentation and a short orientation in the field. We felt that it was critical to introduce urban stormwater challenges in general and specific issues facing each city so that participants understood the context of why GSI in general and bioswales are important. It was important to contextualize what GSI programs their cities had in place (e.g., investments, etc.) by learning from city partners. The orientation also needed to clearly articulate how the sampling campaign was organized and who was doing what and why. Finally, we felt that it was critical to present preliminary results after completing data collection, even though this was demanding and often could not be accomplished to the scientists’ satisfaction. Over the course of the two years of the GSI-CS program, we expanded and improved our presentations, leading to better experiential outcomes for the citizen scientists as well as better outcomes for the data collection.
The survey results showed that citizen scientists benefited from participation despite the short (3 ½ h) duration of the GSI-CS program, with positive and significant gains in all knowledge, motivation and confidence parameters measured in the post-program survey (Figure 3 and Figure 4). In fact, participants reported the greatest growth in understanding for the questions about the significance of GSI. Anecdotal comments by participants were consistent with the low self-reported score for prior knowledge of bioswale function and purpose before this event, with many participants remarking that they never knew bioswales existed in their city.
One of the main goals of engaging participants in hands-on research about urban bioswales as part of the Sustainability Training Program was to give them first-hand experience with a nature-based mitigation strategy for urban centers in dealing with the long-term impacts of climate change [50,51]. We wanted to go beyond lecturing about or touring nature-based solutions to participating in science that can help inform future action [52,53,54]. The significant gains in participants’ knowledge of climate change issues, how urbanization impacts environmental sustainability and how urban bioswales are a nature-based solution (Figure 3) suggest that this was successful. Increases in confidence and motivation to act (Figure 4) are encouraging. However, given the very limited nature of the post-program survey we cannot attribute the observed outcomes to any specific facet of the GSI-CS program or broader STP event. The enthusiasm and dedication with which participants completed the field research and associated datasheets, the quality of the data collected, and anecdotal comments during the program all suggest that the research engagement was valued and influential. Any such short duration programs and campaign-style events likely face similar challenges in finding adequate time to assess all the important outcomes and to be able to attribute these to specific program features.
Confidence/motivation questions showed smaller differences between pre- and post-fielding scores, and lower variation in those means than the questions that focused on “understanding”. Why? What might this suggest about the program, and/or participants? Change in the increased understanding of climate change issues compared to confidence in acting to be more environmentally sustainable could suggest more questions about concepts learned in this one-day event and what actions are most effective.
Participants of this program come from a wide range of positions within the banking industry. One challenge from this group of participants was relating environmentally sustainable actions to each participant’s job not knowing the full details, challenges or influences of that position. The one-day event’s educational materials focused primarily on a more basic level of understanding behind climate change and environmental sustainability. A lack of motivational materials specifically geared towards participants’ ability to act at work or when making a professional decision. For a multi-day program or a more specific audience, where more specific motivational materials could be presented, could result in a higher score. A high pre- and post-STP confidence score in motivation to act in their personal life suggests that many participants already believed they took action in their personal life.
4.2. Benefits for Scientists
The GIRA protocol as developed over the course of our project was used successfully by citizen scientists to determine the status of GSI systems across our cities and importantly, field measurements by the citizen scientists were similar to laboratory measurements (Figure 5). When working with citizen scientists for a short duration project, preparation of materials, team assignments and very clear guidance was required to achieve quality data collection. Through trial and error, we found that, in addition to the initial hands-on training done at the selected ‘training’ bioswale, participants needed very clear and consistent written methodologies and parameters to keep engaged and to collect data consistently across all locations and conditions. Tasks had to be divided among groups or teams of 3–5 people per bioswale, giving each participant a role in the data collection. It was a balance of having enough work for the time period (2.5 h) but not too much work so that each participant was able to finish in time for the next scheduled activity in the STP event. The written guide for the citizen scientists was reassessed between years one and two resulting in a more cohesive, well organized, and comprehensive procedure with clear step by step instructions for the various tasks. For best results it is recommended that the research protocols first go through a pilot phase before deployment [55,56]. Working with non-scientists or someone removed from the project will give the best insight into what a team of citizen scientists will experience and can accomplish.
Some differences were noted between the citizen science and laboratory measurements; however, these differences were generally small and were expected due to the differences in underlying methodology [57]. For example, field infiltration tests often had more variability and higher mean values from soil core hydraulic conductivity values for similar locations. These differences are likely due to the difference in size of the infiltrometers (100 mm diameter) versus the soil cores (50 mm diameter). Also, the field measurements were made for an abbreviated period of time only 30 min total and often only 10 min per individual infiltrometer reading. This short observation period likely leads to the soils being observed not being completely saturated. Unsaturated soil conditions would lead to higher infiltration rates than assumed for steady state conditions. The soil core observations in the lab were made under fully saturated conditions after at least 24 h of submersion in a tank of water for the falling head permeameter test approach used to observe and calculate saturated hydraulic conductivity for the soils. Also, the relatively small diameter of the infiltrometers used in the field observations means that the edge effect of unsaturated soil around the infiltration location would be relatively large compared to if a larger diameter infiltrometer were used [58,59]. Despite these limitations, protocols like the one used here could be valuable in assessing the diverse set of GSI systems that have been deployed nationwide [18]. Furthermore, the preliminary GIBox moisture sensor data (Figure 9) suggests that having the combined approach of both discrete infiltrometer measurements coupled with the real-time sensor data can be of benefit to scientists. The combination fills data gaps as it applies to GSI performance across the wide range of GSI system design and implementation approaches as well as the heterogeneous geographic and climatic nature of urban systems.
In addition to the observations made in each city and the ability to compare across cities, the interaction with local scientists and city officials was valuable to the scientists engaged with this project. The motivation for and implementation of GSI differs widely across North American cities. While the researchers who participated in this project benefitted from observing and using the data collected across the cities, understanding the local context of how and why GSI was being implemented in each city provides important local context for interpreting our results. The conversations with local partners and scientists helped the investigators understand why the designs and approaches were being used in each of the cities and served to build important bridges between the investigators, partners and academic scientists working on local stormwater issues and GSI applications [60]. Since GSI is necessarily a practice that needs to be designed for local, political, social, cultural, climatic, and hydrologic conditions, this local context is important both to understand local implementation but also to enable comparisons across regions [12,18,60].
4.3. Aggregate Benefits and Costs of GIRA Approach
A key goal of any citizen science effort should be to maximize the benefits to citizen science participants as well as researchers. Citizen science programs can range in structure and format from shorter duration campaigns (typically from a few hours to a few days) to longer duration programs with participants continuing to contribute for lengthy periods of time—even many years [61]. Shorter duration campaign-style events are quite common for inventorying nature (e.g., biodiversity blitzes such as the City Nature Challenge https://citynaturechallenge.org/ accessed on 3 November 2021 [62]) and can engage many people (dozens to hundreds or more) with a range of interests and abilities. The application of real-time sensors such as the GIBox moisture sensors used in this work, provides an additional opportunity for further amplifying engagement and interest of other citizen science events via the posting of findings on publicly accessible data dashboards. Other areas of earth and environmental science feature longer duration programs that engage participants for months to years [63]. For example, monitoring programs for river or watershed understanding build long term relationships with community members for extended and regular monitoring has been shown to be highly effective (i.e., [49]) Our program sought to exploit the benefits of engaging new participants in a very short experience and was successful at doing so, with both citizens and scientists benefit (Figure 1). Participants were quickly taught the salient issues related to urban stormwater (e.g., flooding, combined sewer overflows, water quality impacts) and trained on how to use the GIRA protocol to observe and document the aesthetic, hydrologic, and biological functions of GSI systems in the cities examined. This same protocol could be easily adapted for similar campaign style events as well as longer term training of volunteers to observe distributed GSI systems in an individual city or network of cities.
An additional aspect of our GIRA approach on GSI performance is the integration of scientists with community members and local partners, thus suggesting the need to consider a third axis in assessing the aggregate outcomes of a CS program (Figure 1). If urban sustainability science is going to have an impact on the actual decision making in cities at the individual, community and municipal scales, several distinct types of communication and relationships must be developed [26,48]. This project developed several of these relationships and enabled multi-lateral communication between researchers, community members, and municipal and NGO partners. As a result, researchers gained an understanding of what gaps in knowledge exist in community members and among municipal and NGO partners. The researchers also learned what strategies community members and other partners find useful and valuable for solving the problems present in an individual community. Meanwhile the community members learned both about natural processes in their community’s environment and about the potential solutions that are available to solve those problems. Some of those solutions might involve individual action while others might involve the need for collective action at the community or municipal scale [41,54]. This individual and collective action aspect is common in sustainability challenges where both individual and collective action is needed [64]. Finally, an important element of our GIRA protocol and GSI observational program is the incorporation of NGO and municipal partners. Here again the partners learned about relevant science to the problems of urban stormwater and GSI implementation but also had the opportunity to communicate to citizens and sciences about rationale for the specific strategies being used in their city. Benefits from the GSI-CS program to city partners was quite clear from the Stakeholder Event organized by EarthWatch early in 2020. City partners both from government and community-based organizations, from four out of the six locations joined this voluntary discussion of our results and presented details about their city’s green infrastructure programs. This suggests an ongoing interest in urban bioswales and this research project. This element of engaging in a multi-lateral communication strategy with community members, municipal and NGO partners, and researchers is a robust strategy for understanding and solving the problems of sustainability that cities face.
Elements of our program are likely applicable to any citizen science effort that lies at the boundary between researchers, community members, and municipal and NGO partners. The citizen scientists need a global context and how it relates to their local context. Here, the global context was supplied by EarthWatch and HSBC staff in their portion of the STP event, highlighting the UN Sustainable Development Goals and the HSBC Bank sustainability strategy. The science team then presented the local context, drawing the global and bank goals down into the problems of urban water flooding, water quality, and water resources and the potential for nature-based solutions such as GSI. Being engaged in taking actual measurement makes the challenges of sustainability a physical, sensory, and material reality for the participants. Critically, the connection to the bigger picture science of the researchers, GSI in cities generally and the 6 participating cities helped the participants understand the larger context of their work and envision their connection to that broader effort and impact. The participants learned about the significance of the research project, the significance of GSI systems in built environments. There were benefits for the group learning about how science works beyond just collecting data on the GSI systems. This context of the larger data collection and the value it would have scientifically helped the citizen scientists understand the importance of their underlying work.
5. Conclusions
Our experience in this project shows the value of campaign style one day events to pioneer and test protocols and research approaches that can then be used in similar circumstances or in longer term, relationship building citizen science efforts. While we developed training materials, protocols, and tools for this one-day citizen scientist event, colleagues and partners across a wide range of urban areas have been interested in these protocols and tools for longer term efforts in their cities or in their research aimed at observing and understanding how GSI systems behave in a variety of places and over time. These requests indicate the value of the underlying protocols and the value of the mutual learning process that resulted in the development of the GIRA approach.
In this work we were able to demonstrate that citizen scientists can complete a rapid assessment of the structure and function of GSI systems in a variety of settings across a range of cities, providing valuable benefits to scientists. The participants gained valuable real-world experience and learned about the fundamental nature of sustainability challenges in cities and one promising solution. As a result, we view the GSI-CS as a win-win program with both scientists and citizens benefiting (Figure 1). In addition, the GIRA protocol as developed coupled with the use of low-cost sensors such as the GIBoxs presented here, meet many of the needs of the stakeholder agencies and NGOs in cities to understand how GSI systems function once they are deployed in the real world. Thus, a third dimension of benefits—to city partners—emerged as a valuable outcome of the program. The project overall was relatively successful at training citizen scientists about sustainability challenges, urban water management, and development of a useful rapid assessment protocol with discrete and real-time monitoring tools for understanding how GSI systems perform during a significant time period post installation.
Author Contributions
T.M. took the lead on writing and editing the manuscript. A.R.B. led the analysis and theory of citizen science engagement. A.E.D. led field data collection and analysis. J.P. led development of GI boxes and data analysis. R.L. assisted with field and lab work. B.K.S. led original project design and implementation and assisted with writing. M.C. led citizen science efforts, workshop development and project design. N.G. assisted with lab analysis of cores, figure creation and data quality assurance and control. S.R. helped with writing and project design. A.W. led citizen efforts in the field and helped with analysis of surveys and writing of results. J.C. led the overall project and was crucial in the writing of this manuscript. All authors have read and agreed to the published version of the manuscript.
Funding
We acknowledge both HSBC and Earthwatch which provided financial and logistical support for this project. Meixner’s and Gupta’s participation in this project was supported by NSF DEB proposal #1518376 and NSF CBET-1444758.
Institutional Review Board Statement
Ethical review and approval were waived for this study, due to the completely anonymous nature of the post-program survey which was used primarily as an evaluation instrument. No identifying information was collected about the participants; only their retrospective pre- and post-participation scores and comments about the program and their experience were collected.
Informed Consent Statement
Since ethical review and approval were waived for this study, informed consent was not required.
Data Availability Statement
The underlying data is available upon request to the lead author.
Acknowledgments
We acknowledge both HSBC and Earthwatch which provided financial and logistical support for this project. John. F. Marra at Brooklyn College-CUNY provided assistance in downloading and collating the sensor data. We also thank municipal and non-governmental organization partners in the cities of San Francisco, New York, Buffalo, Toronto, Chicago, and Vancouver, BC. Meixner’s and Gupta’s participation in this project was supported by NSF DEB proposal #1518376 and NSF CBET-1444758.
Conflicts of Interest
The authors declare no conflict of interest.
References
- Coutu, G.W.; Vega, C. Impacts of Land Use Changes on Runoff Generation in the East Branch of the Brandywine Creek Watershed Using a Gis-Based Hydrologic Model. Available online: http://msaag.aag.org/wp-content/uploads/2013/04/17_Coutu_Vega.pdf (accessed on 18 October 2021).
- Walsh, C.J.; Roy, A.H.; Feminella, J.W.; Cottingham, P.D.; Groffman, P.M.; Morgan, R.P. The Urban Stream Syndrome: Current Knowledge and the Search for a Cure. J. N. Am. Benthol. Soc. 2005, 24, 706–723. [Google Scholar] [CrossRef]
- Berry, B.J.L. Urbanization. In Urban Ecology: An International Perspective on the Interaction Between Humans and Nature; Marzluff, J.M., Shulenberger, E., Endlicher, W., Alberti, M., Bradley, G., Ryan, C., Simon, U., Zum Brunnen, C., Eds.; Springer: Boston, MA, USA, 2008; pp. 25–48. ISBN 9780387734125. [Google Scholar]
- Manual, B. Environmental Servcies Division Bioretention Manual. In Department of Environmental Resources, Prince George’s County; The Department: Largo, MD, USA, 2007. [Google Scholar]
- Tang, Z.; Engel, B.A.; Lim, K.J.; Pijanowski, B.C.; Harbor, J. Minimizing the Impact of Urbanization on Long Term Runoff. J. Am. Water Resour. Assoc. 2005, 41, 1347–1359. [Google Scholar] [CrossRef]
- Field, R.; Struzeski, E.J. Management and Control of Combined Sewer Overflows. J. Water Pollut. Control Fed. 1972, 44, 1393–1415. [Google Scholar]
- Moffa, P.E. The Control and Treatment of Combined Sewer Overflows; John Wiley & Sons: Hoboken, NJ, USA, 1997; ISBN 9780471292104. [Google Scholar]
- Even, S.; Mouchel, J.-M.; Servais, P.; Flipo, N.; Poulin, M.; Blanc, S.; Chabanel, M.; Paffoni, C. Modelling the impacts of Combined Sewer Overflows on the river Seine water quality. Sci. Total Environ. 2007, 375, 140–151. [Google Scholar] [CrossRef]
- New York Department of Environmental Conservation. Modified CSO Order of Consent White Paper; New York Department of Environmental Conservation: New York, NY, USA, 2011.
- Mulliss, R.; Revitt, D.M.; Shutes, R.B.E. The impacts of discharges from two combined sewer overflows on the water quality of an urban watercourse. Water Sci. Technol. 1997, 36, 195–199. [Google Scholar] [CrossRef]
- Dolowitz, D.P.; Bell, S.; Keeley, M. Retrofitting urban drainage infrastructure: Green or grey? Urban Water J. 2018, 15, 83–91. [Google Scholar] [CrossRef]
- Prudencio, L.; Null, S. Stormwater management and ecosystem services: A review. Environ. Res. Lett. 2018, 13, 033002. [Google Scholar] [CrossRef]
- Dong, X.; Guo, H.; Zeng, S. Enhancing future resilience in urban drainage system: Green versus grey infrastructure. Water Res. 2017, 124, 280–289. [Google Scholar] [CrossRef]
- Roy-Poirier, A.; Champagne, P.; Filion, Y. Review of Bioretention System Research and Design: Past, Present, and Future. J. Environ. Eng. 2010, 136, 878–889. [Google Scholar] [CrossRef]
- Chini, C.M.; Canning, J.F.; Schreiber, K.L.; Peschel, J.M.; Stillwell, A.S. The Green Experiment: Cities, Green Stormwater Infrastructure, and Sustainability. Sustainability 2017, 9, 105. [Google Scholar] [CrossRef] [Green Version]
- McPhillips, L.E.; Matsler, A.M. Temporal Evolution of Green Stormwater Infrastructure Strategies in Three US Cities. Front. Built Environ. 2018, 4, 26. [Google Scholar] [CrossRef] [Green Version]
- New York City Department of Environmental Protection. 2016 NYC Green Infrastructure Annual Report; New York City Department of Environmental Protection: New York, NY, USA, 2017.
- Choat, B.; Pulido, A.; Bhaskar, A.S.; Hale, R.; Zhang, H.; Meixner, T.; McPhillips, L.; Hopkins, K.; Cherrier, J.; Cheng, C. A Call to Record Stormwater Control Functions and to Share Network Data. J. Sustain. Water Built Environ. 2021; in press. [Google Scholar]
- Pataki, D.E.; Carreiro, M.M.; Cherrier, J.; Grulke, N.E.; Jennings, V.; Pincetl, S.; Pouyat, R.V.; Whitlow, T.H.; Zipperer, W.C. Coupling biogeochemical cycles in urban environments: Ecosystem services, green solutions, and misconceptions. Front. Ecol. Environ. 2011, 9, 27–36. [Google Scholar] [CrossRef]
- Dietz, M.E.; Clausen, J.C. A Field Evaluation of Rain Garden Flow and Pollutant Treatment. Water Air Soil Pollut. 2005, 167, 123–138. [Google Scholar] [CrossRef]
- Feng, Y.; Burian, S.; Pomeroy, C. Potential of green infrastructure to restore predevelopment water budget of a semi-arid urban catchment. J. Hydrol. 2016, 542, 744–755. [Google Scholar] [CrossRef]
- Hunt, W.F. Designing Rain Gardens (Bio-Retention Areas); N.C. Cooperative Extension Service: Raleigh, NC, USA, 2001. [Google Scholar]
- Jiang, Y.; Yuan, Y.; Piza, H. A Review of Applicability and Effectiveness of Low Impact Development/Green Infrastructure Practices in Arid/Semi-Arid United States. Environments 2015, 2, 221–249. [Google Scholar] [CrossRef]
- Tornes, L.H. Effects of Rain Gardens on the Quality of Water in the Minneapolis-St. Paul Metropolitan Area of Minnesota, 2002–2004; US Geological Survey: Reston, VA, USA, 2005.
- Copeland, C. Green Infrastructure and Issues in Managing Urban Stormwater. Available online: https://nationalaglawcenter.org/wp-content/uploads/assets/crs/R43131.pdf (accessed on 26 October 2021).
- Dhakal, K.P.; Chevalier, L.R. Managing urban stormwater for urban sustainability: Barriers and policy solutions for green infrastructure application. J. Environ. Manag. 2017, 203, 171–181. [Google Scholar] [CrossRef]
- Pudifoot, B.; Cárdenas, M.L.; Buytaert, W.; Paul, J.D.; Narraway, C.L.; Loiselle, S. When It Rains, It Pours: Integrating Citizen Science Methods to Understand Resilience of Urban Green Spaces. Front. Water 2021, 3, 33. [Google Scholar] [CrossRef]
- Maes, J.; Barbosa, A.; Baranzelli, C.; Zulian, G.; e Silva, F.B.; Vandecasteele, I.; Hiederer, R.; Liquete, C.; Paracchini, M.L.; Mubareka, S.; et al. More Green Infrastructure Is Required to Maintain Ecosystem Services under Current Trends in Land-Use Change in Europe. Landsc. Ecol. 2015, 30, 517–534. [Google Scholar] [CrossRef] [PubMed] [Green Version]
- Dagenais, D.; Thomas, I.; Paquette, S. Siting green stormwater infrastructure in a neighbourhood to maximise secondary benefits: Lessons learned from a pilot project. Landsc. Res. 2017, 42, 195–210. [Google Scholar] [CrossRef]
- Christman, Z.; Meenar, M.; Mandarano, L.; Hearing, K. Prioritizing Suitable Locations for Green Stormwater Infrastructure Based on Social Factors in Philadelphia. Land 2018, 7, 145. [Google Scholar] [CrossRef] [Green Version]
- Dickinson, J.L.; Zuckerberg, B.; Bonter, D.N. Citizen Science as an Ecological Research Tool: Challenges and Benefits. Annu. Rev. Ecol. Evol. Syst. 2010, 41, 149–172. [Google Scholar] [CrossRef] [Green Version]
- Shirk, J.L.; Ballard, H.L.; Wilderman, C.C.; Phillips, T.; Wiggins, A.; Jordan, R.; McCallie, E.; Minarchek, M.; Lewenstein, B.; Krasny, M.E.; et al. Public Participation in Scientific Research: A Framework for Deliberate Design. Ecol. Soc. 2012, 17. [Google Scholar] [CrossRef] [Green Version]
- McKinley, D.C.; Miller-Rushing, A.J.; Ballard, H.L.; Bonney, R.; Brown, H.; Cook-Patton, S.C.; Evans, D.M.; French, R.A.; Parrish, J.K.; Phillips, T.B.; et al. Citizen science can improve conservation science, natural resource management, and environmental protection. Biol. Conserv. 2017, 208, 15–28. [Google Scholar] [CrossRef] [Green Version]
- Berkowitz, A.R. A Simple Framework for Considering the Benefits of Student Scientist Partnerships. In Proceedings of the National Conference on Student & Scientist Partnerships, Cambridge MA, USA, June 1997; Conference Report; TERC and Concord Consortium: Cambridge, MA, USA, 1997; pp. 38–41. [Google Scholar]
- Phillips, T.; Porticella, N.; Constas, M.; Bonney, R. A Framework for Articulating and Measuring Individual Learning Outcomes from Participation in Citizen Science. Citiz. Sci. Theory Pract. 2018, 3. [Google Scholar] [CrossRef] [Green Version]
- Edwards, R.; Kirn, S.; Hillman, T.; Kloetzer, L.; Mathieson, K.; McDonnell, D.; Phillips, T. Learning and developing science capital through citizen science. In Citzen Science; UCL Press: London, UK, 2018; pp. 381–390. [Google Scholar]
- Jordan, R.C.; Ballard, H.L.; Phillips, T.B. Key issues and new approaches for evaluating citizen-science learning outcomes. Front. Ecol. Environ. 2012, 10, 307–309. [Google Scholar] [CrossRef]
- Fernandez-Gimenez, M.; Ballard, H.L.; Sturtevant, V.E. Adaptive Management and Social Learning in Collaborative and Community-Based Monitoring: A Study of Five Community-Based Forestry Organizations in the western USA. Ecol. Soc. 2008, 13. [Google Scholar] [CrossRef]
- Edelson, D.C.; Kirn, S.L. Designing Citizen Science for Both Science and Education: A Workshop Report; BSCS Science Learning: Colorado Springs, CO, USA, 2018. [Google Scholar]
- Barker, E.; Phillips, R.; Kusek, K.; Thomas, B. Earthwatch and HSBC: Embedding sustainability into the DNA of HSBC’s business. People Strategy 2011, 34, 24–32. [Google Scholar]
- Ballard, D. Using learning processes to promote change for sustainable development. Action Res. 2005, 3, 135–156. [Google Scholar] [CrossRef]
- Little, T.D.; Chang, R.; Gorrall, B.K.; Waggenspack, L.; Fukuda, E.; Allen, P.; Noam, G.G. The retrospective pretest–posttest design redux: On its validity as an alternative to traditional pretest–posttest measurement. Int. J. Behav. Dev. 2019, 44, 175–183. [Google Scholar] [CrossRef]
- Hipp, L.; Bünning, M.; Munnes, S.; Sauermann, A. Problems and Pitfalls of Retrospective Survey Questions in COVID-19 Studies. Surv. Res. Methods 2020, 14, 109–1145. [Google Scholar]
- Bouwer, H. Intake Rate: Cylinder Infiltrometer. In SSSA Book Series; Soil Science Society of America, American Society of Agronomy: Madison, WI, USA, 2018; pp. 825–844. ISBN 9780891188643. [Google Scholar]
- Thien, S.J. A flow diagram for teaching texture-by-feel analysis. J. Agron. Educ. 1979, 8, 54–55. [Google Scholar] [CrossRef]
- Reynolds, W.D.; Elrick, D.E.; Youngs, E.G.; Booltink, H.W.G.; Bouma, J. 3.4.2 Laboratory Methods. In SSSA Book Series; Soil Sciencce Society of America: Madison, WI, USA, 2018; pp. 802–816. [Google Scholar]
- Danielsen, F.; Pirhofer-Walzl, K.; Adrian, T.P.; Kapijimpanga, D.R.; Burgess, N.D.; Jensen, P.; Bonney, R.; Funder, M.; Landa, A.; Levermann, N.; et al. Linking Public Participation in Scientific Research to the Indicators and Needs of International Environmental Agreements. Conserv. Lett. 2014, 7, 12–24. [Google Scholar] [CrossRef]
- Usón, T.J.; Klonner, C.; Höfle, B. Using participatory geographic approaches for urban flood risk in Santiago de Chile: Insights from a governance analysis. Environ. Sci. Policy 2016, 66, 62–72. [Google Scholar] [CrossRef]
- Buytaert, W.; Zulkafli, Z.; Grainger, S.; Acosta, L.; Alemie, T.C.; Bastiaensen, J.; De Bièvre, B.; Bhusal, J.; Clark, J.; Dewulf, A.; et al. Citizen science in hydrology and water resources: Opportunities for knowledge generation, ecosystem service management, and sustainable development. Front. Earth Sci. 2014, 2, 26. [Google Scholar] [CrossRef] [Green Version]
- Cohen-Shacham, E.; Walters, G.; Janzen, C. Nature-Based Solutions to Address Global Societal Challenges; IUCN: Gland, Switzerland, 2016; Volume 97. [Google Scholar]
- Klein, J.; Araos, M.; Karimo, A.; Heikkinen, M.; Ylä-Anttila, T.; Juhola, S. The role of the private sector and citizens in urban climate change adaptation: Evidence from a global assessment of large cities. Glob. Environ. Chang. 2018, 53, 127–136. [Google Scholar] [CrossRef]
- Groulx, M.; Brisbois, M.C.; Lemieux, C.J.; Winegardner, A.; Fishback, L. A Role for Nature-Based Citizen Science in Promoting Individual and Collective Climate Change Action? A Systematic Review of Learning Outcomes. Sci. Commun. 2017, 39, 45–76. [Google Scholar] [CrossRef]
- Bela, G.; Peltola, T.; Young, J.; Balázs, B.; Arpin, I.; Pataki, G.; Hauck, J.; Kelemen, E.; Kopperoinen, L.; Van Herzele, A.; et al. Learning and the transformative potential of citizen science. Conserv. Biol. 2016, 30, 990–999. [Google Scholar] [CrossRef] [PubMed] [Green Version]
- Ballard, H.L.; Dixon, C.G.; Harris, E.M. Youth-focused citizen science: Examining the role of environmental science learning and agency for conservation. Biol. Conserv. 2017, 208, 65–75. [Google Scholar] [CrossRef] [Green Version]
- Rambonnet, L.; Vink, S.C.; Land-Zandstra, A.M.; Bosker, T. Making citizen science count: Best practices and challenges of citizen science projects on plastics in aquatic environments. Mar. Pollut. Bull. 2019, 145, 271–277. [Google Scholar] [CrossRef] [PubMed]
- National Academies of Sciences, Engineering, and Medicine; Division of Behavioral and Social Sciences and Education; Board on Science Education; Committee on Designing Citizen Science to Support Science Learning. Learning Through Citizen Science: Enhancing Opportunities by Design; National Academies Press: Washington, DC, USA, 2019; ISBN 9780309479165. [Google Scholar]
- Flynn, K.M.; Traver, R. Green infrastructure life cycle assessment: A bio-infiltration case study. Ecol. Eng. 2013, 55, 9–22. [Google Scholar] [CrossRef]
- Pons, V.; Muthanna, T.; Sivertsen, E.; Bertrand-Krajewski, J.-L. A Tool to Forecast Future Performance of Green Infrastructure. In Proceedings of the 15th ICUD—International Conference on Urban Drainage, Melbourne, Australia, 25–28 October 2021; p. 3. [Google Scholar]
- Sihag, P.; Tiwari, N.; Ranjan, S. Estimation and inter-comparison of infiltration models. Water Sci. 2017, 31, 34–43. [Google Scholar] [CrossRef] [Green Version]
- Chaffin, B.C.; Shuster, W.D.; Garmestani, A.S.; Furio, B.; Albro, S.L.; Gardiner, M.; Spring, M.; Green, O.O. A tale of two rain gardens: Barriers and bridges to adaptive management of urban stormwater in Cleveland, Ohio. J. Environ. Manag. 2016, 183, 431–441. [Google Scholar] [CrossRef] [PubMed]
- Pocock, M.J.O.; Tweddle, J.C.; Savage, J.; Robinson, L.; Roy, H.E. The diversity and evolution of ecological and environmental citizen science. PLoS ONE 2017, 12, e0172579. [Google Scholar] [CrossRef]
- Parker, S.S.; Pauly, G.B.; Moore, J.; Fraga, N.S.; Knapp, J.J.; Principe, Z.; Brown, B.V.; Randall, J.M.; Cohen, B.S.; Wake, T.A. Adapting the bioblitz to meet conservation needs. Conserv. Biol. 2018, 32, 1007–1019. [Google Scholar] [CrossRef] [PubMed] [Green Version]
- Nardi, F.; Cudennec, C.; Abrate, T.; Allouch, C.; Annis, A.; Assumpção, T.; Aubert, A.H.; Bérod, D.; Braccini, A.M.; Buytaert, W.; et al. Citizens AND HYdrology (CANDHY): Conceptualizing a transdisciplinary framework for citizen science addressing hydrological challenges. Hydrol. Sci. J. 2021, 1–18. [Google Scholar] [CrossRef]
- Atkinson, R.; Dörfler, T.; Hasanov, M.; Rothfuß, E.; Smith, I. Making the Case for Self-Organisation: Understanding How Communities Make Sense of Sustainability and Climate Change through Collective Action. Int. J. Sustain. Soc. 2017, 9, 193–209. [Google Scholar] [CrossRef] [Green Version]
Publisher’s Note: MDPI stays neutral with regard to jurisdictional claims in published maps and institutional affiliations. |
© 2021 by the authors. Licensee MDPI, Basel, Switzerland. This article is an open access article distributed under the terms and conditions of the Creative Commons Attribution (CC BY) license (https://creativecommons.org/licenses/by/4.0/).