Article

Environmental Regulation, Technological Innovation, and Industrial Transformation: An Empirical Study Based on City Function in China

1
School of Agriculture and Forestry Economics and Management, Lanzhou University of Finance and Economics, Lanzhou 730020, China
2
School of Economics, Lanzhou University, Lanzhou 730000, China
3
School of Economics, Lanzhou University of Finance and Economics, Lanzhou 730020, China
*
Author to whom correspondence should be addressed.
Co-first author.
Sustainability 2021, 13(22), 12512; https://doi.org/10.3390/su132212512
Submission received: 29 September 2021 / Revised: 3 November 2021 / Accepted: 9 November 2021 / Published: 12 November 2021

Abstract

:
The Chinese economy has now transitioned from rapid expansion to high-quality growth. The issue of achieving synergy between environmental conservation and economic growth has become a serious concern. Based on the panel data of 120 prefecture-level cities in China from 2008 to 2017, we used the panel threshold regression model to investigate the influences of environmental regulation (ER) and technological innovation (TI) on urban industrial transformation. Further, we examined the threshold characteristics of four types of functional cities—resource-based, industry-oriented, comprehensive regional, and other types of cities. Our results show that ER and TI have varied effects on the industrial transformation of the four categories of functional cities. Both ER and TI have significant nonlinear threshold impacts on industrial transformation in resource-based cities. The inhibitory effect of ER on industrial structure rationalization decreases as the severity of ER increases. There is a shift from the promotion to the restriction of industrial structure rationalization due to TI increase. In contrast, TI strengthens the optimization of industrial structure. The promotion effects of ER and TI on industrial structure optimization improve as the former and latter increase in comprehensive regional cities. The influence of TI on the industrial transformation of industry-oriented cities is consistent with its impact on resource-based cities. These findings provide theoretical guidance and inspiration for urban industrial transformation in response to ER and TI based on their functional roles.

1. Introduction

Industrialization has harmed the natural environment and human existence by causing pollution, ecological degradation, and resource depletion [1]. The growing severity of ecological and environmental challenges have hindered the human economy and society [2]. As the world’s largest developing country [3], China’s economic growth in the past four decades has been unprecedented [4]. However, overcapacity [5,6] and environmental pollution [7,8] pose serious challenges to China’s economy. Due to the serious destruction of the environmental system and the degradation of ecological services, the realization of industrial transformation—making industries more environmentally friendly and more innovative—has become vital in China [9]. Environmental regulation (ER) is a set of pollution control policies designed to reduce carbon dioxide emissions, minimize environmental pollution, and promote the long-term development of the ecological environment [10,11].
Moreover, environmental problems are linked to a lack of technological innovation (TI) [12], which can effectively reduce environmental pollution and promote the healthy development of the ecological environment by utilizing green products, processes, and terminal management throughout the product life cycle [13]. Presently, China’s economy is transitioning from rapid expansion growth to qualitative development [14,15]. With a rising labor force, capital input, and technological advance driving the Chinese economy [16], transforming economic development and optimizing the economic structure is vital to ensuring the healthy and sustainable growth of China’s economy and society [5,17].
Environmental regulation, technological innovation, and industrial transformation are all concerns of global interest [3,18,19]. The research in these areas can be divided into three categories:
Impact of environmental regulation on technological innovation. (a) The “compliance costs hypothesis” states that environmental regulations reduce enterprise technical innovation levels. Previous research has shown that rising environmental regulation intensity increases the environmental treatment costs incurred by firms, crowding out investment in technological innovation and reducing enterprise competitiveness [20,21]. Environmental regulation impedes the development of green technology innovation capabilities [22]; (b) Environmental regulation promotes the improvement of enterprise technological innovation level—“Porter Hypothesis” [23]. Reasonable environmental regulatory policies could allocate resources scientifically and encourage companies to improve their innovation capabilities, thereby increasing competitiveness [24]. It could also improve the technological innovation capabilities of enterprises and improve their production efficiency in the long term [25]; (c) Environmental regulation has no significant positive or negative impact on technological innovation [26].
Impact of environmental regulation on industrial transformation. (a) Environmental regulation may promote industrial restructuring or industrial upgrading. Environmental policy can incentivize enterprises to improve resource utilization and promote a green ecological industry [27]. It can effectively reduce the reliance of economic development on resources and promote industrial structure of resource-based countries to diversify and reverse the Dutch disease problem [28]; (b) Improved environmental regulations are not conducive to industrial structure transformation. Strict environmental regulation increases the ensuing cost of enterprise pollution reduction, which is not conducive to industrial structure transformation [29,30]; (c) The relationship between environmental regulation and industrial transformation is non-linear, with a J-shaped characteristic [31], a positive U-shaped relationship [14], or other uncertain types of relationship [32].
Impact of technological innovation on industrial transformation. Existing studies suggest that technological innovation can boost industrial upgrading [33]. However, the promotion varies concerning specific mechanisms, time, and space scale [5,29]. Overall, this topic has received much research attention. However, there are still a lot of gaps in the literature. This study contributes to the literature in three aspects:
Firstly, due to differences in the city functions, productivity levels, and resource endowments, the intensity of environmental regulation, the degree of technological innovation, and the level of the industrial structure of different cities varies [34]. Investigating the impact of ER and TI on the industrial transformation of different functional cities can help to improve the ER policy and harmonize the relationship between economic development and environmental protection [35]. However, most previous studies used provincial or industry panel data [36], and very few studies focused on the city scale. To our knowledge, this study is the first to conduct such micro-level research based on cities’ functions because they play a significant role in national innovation systems.
Secondly, the sharing of government environmental information is critical to establishing a positive relationship between the government, businesses, and the public in quantifying environmental regulations [37]. However, most previous studies used single or comprehensive indicators to measure environmental regulations without government environmental information disclosure. In addition, technological innovation is mostly measured by the number of scientific research or technical service personnel, patent applications, and internal R&D expenditures [38], which do not adequately reflect the level of technological innovation in a given region.
Therefore, the PITI index is used to measure ER in this study. This indicator includes pollutant discharge data, the government’s oversight of corporate activities, and the government’s and society’s engagement in environmental protection [39]. Moreover, the TI is measured by the city innovation index, a stock index adjusted by patent value, which can comprehensively and scientifically reflect the TI level of a particular city [40].
Thirdly, given the importance of ER on TI in driving industrial transformation, studies exploring the relationship between the three are required to inform policy formulation for sustainable urban development [7]. Most previous studies have separately studied the effects of ER on industrial transformation [11], or investigated the impacts of ER on TI [6], or analyzed the influences of TI on industrial transformation [41].
However, only a few studies have focused on the complex relationship between ER, TI and industrial transformation [42]. We examined the linear and nonlinear links between environmental regulation, technological innovation, and industrial transformation using the same analytical framework.
Although the previous studies have provided some background and motivation for our paper, ours is the first to investigate the regulatory function of environmental legislation and technological innovation on urban industrial transformation in China based on city functional roles. The empirical novelty of this paper is the disaggregation of cities based on their functional roles to investigate how ER and TI affect industrial transformation and to provide suggestions for formulating more precise environmental regulations for cities with different functions.
The remainder of this paper is organized as follows: Section 2 reviews the literature and develops the hypotheses. The data and methods used to conduct the analysis are explained in Section 3. The empirical results and discussion are presented in Section 4 and Section 5, respectively. Finally, Section 6 proposes the major conclusion, policy implications, and limitations.

2. Literature Review

The urban industrial transformation has become one of China’s industrial development requirements in the new era [8], given the growing challenges of world resource consumption and pollution. In recent years, China’s regional economic development pattern has evolved considerably. Different cities face various economic challenges, resource endowment, and social-ecological environments, while the Chinese government emphasizes the development of an ecological civilization [21]. In this regard, the Chinese government has successively issued environmental protection laws and regulations, such as “Environmental Protection Law”, “Action Plan for Prevention and Control of Water Pollution”, “Action Plan for Prevention and Control of Soil Pollution”, and “Rules for Implementation of the Law on the Prevention and Control of Air Pollution”. The establishment of these environmental laws has significantly intensified China’s environmental regulation.
Consequently, enterprises’ inappropriate production behavior has been regulated and restricted [43]. In addition, this has promoted the internalization of the social cost of environmental pollution emissions [44], guided the flow and distribution of resources among industries, and transformed industrial development from resource-driven to technological-driven, thereby promoting industrial structure transformation [45]. Moreover, strict environmental regulations may encourage enterprises to adapt their product and management structures, improve their independent innovation capacity, and create societal excitement for innovation, resulting in industrial structure transformation [17,23].

2.1. Analysis of the Mechanism of Environmental Regulation and Technological Innovation on Industrial Transformation

2.1.1. Effect of Environmental Regulation on Industrial Transformation

Environmental regulation can influence industrial transformation through the mechanisms of industrial transfer effect and industrial transformation effect.
The “pollution haven hypothesis” states that the degree of environmental control directly impacts enterprise production costs. Environmental regulations are less effective in boosting ecological efficiency and reducing resource dependence in non-resource cities [21]. As a result, polluters prefer places with relatively lax environmental policies to lower the cost of pollution treatment; they influence the regional industrial transformation through the industrial transfer effect. In addition, undeveloped cities may design relatively liberal environmental policies to attract investment and promote regional economic development. Due to the industrial transfer effect, inadequate implementation and quality of environmental legislation can negatively impact industrial transformation [46].
On the other hand, according to the “Porter hypothesis,” acceptable ER can help enterprises improve production efficiency and optimize their structure, thus promoting the transformation of a society’s industrial structure. Simultaneously, the public’s awareness of environmental protection will increase as society advances [7] and enhance the demand for green products, prompting enterprises to adjust and optimize their product and management structure to meet shifting market demands. Changes in the demand side cause this industrial structure transformation. In addition, since most enterprises in resource-based cities are pollution-intensive [3,47], the intensity of pollutant emission is high. When the intensity of ER increases, a corresponding improvement in production technology and pollution control can be achieved by increasing investment in technological research and development [19,47]. This will have a significant short-term impact on enterprise development and will be detrimental to regional economic development. However, it will lead to industrial transformation in the long term by adopting environmental-friendly technology while increasing enterprise competitiveness at the local and international levels [8].
Besides, environmental regulation can be classified into traditional command-and-control, voluntary or public participation, and market-based environmental regulations [48]. Different types of ER have inconsistent impacts on industrial transformation. For example, Ren et al. [49] used the 2000–2013 panel dataset to evaluate how these three environmental rules affected eco-efficiency in 30 Chinese provinces. Regional differences in voluntary and market-based environmental regulations favored eco-efficiency in the eastern region; command-and-control and market-based environmental regulations favored the central region; only command-and-control environmental regulation favored the western region, while the other types of regulations had no significant effect. In addition, even the same type of ER may have different impacts on industrial transformation. Zhao et al. [50] reported that command-and-control ER would not affect industrial transformation. In contrast, Liu et al. [51] argued that the command-and-control ER influenced industrial transformation positively.
Cities are critical turning points in creating long-term system changes that affect local and global environments [52]. Earlier reports have indicated the positive influence of ER on industrial transformation in resource-based cities [8]. Yasmeen et al. [3] found that severe environmental regulations, rather than voluntary environmental rules, negatively influenced ecological efficiency in places with low resource reliance. Deng et al. [44] indicated that ER influenced the transformation of cities with a large population and high pollution levels. Similarly, ER can promote industrial transformation in cities with high and low economic development but may not affect cities with medium economic growth. This suggests that industrial transformation is driven by the level of economic development in cities. However, studies reporting the industrial transformation of cities due to environmental regulations are limited [53], especially based on cities’ functional roles, and our study sought to fill this gap.

2.1.2. Effect of Technological Innovation on Industrial Transformation

Technological innovation can influence industrial transformation through innovation compensation effect and technology diffusion effect.
Empirical studies have shown that TI is an essential driver of industrial transformation [8,54], supported by the porter hypothesis [23]. The Porter hypothesis states that TI aims to improve resource use efficiency through advancements in technology, thereby encouraging industrial transformation. This leads to an innovation compensation effect, which aligns with the innovation compensation theory. For example, sophisticated technology can facilitate the efficient and clean utilization of energy sources [55], and TI can help existing and developing industries maximize resource utilization efficiency [56]. In addition, ER can effectively promote the transformation of labour-intensive or resource-intensive industries to technology-intensive industries by stimulating the introduction and adoption of advanced technology [8] and the optimal allocation of resources. Similarly, “creative destruction” considers that the key to obtaining a new competitive advantage is transforming through TI [57]. Nevertheless, the current status of technological innovation and industrial transformation in China still needs to be improved [16], suggesting the requirement for more research in this regard.
The diffusion effect of TI indirectly impacts industrial structure transformation through the supply structure and international trade. For example, implementing strict ERs shifts the negative externalities of enterprise environmental pollution. Consequently, enterprise investment in technological research and development is crowded out, hindering industrial transformation [8,19]. Zhao and Jing [58] reported that the crowding-out impact of TI might cause firms to downsize, diminishing resource use efficiency. According to Jin et al. [46], TI is an obvious impediment to the green development of industrial water resources in western China. As indicated in the analysis above, the technology diffusion effect negatively impacts societal incentives for TI, severely impacting industrial transformation. Given that creating a smart city requires TI [18], the analysis presented in this section demonstrates that TI may support or obstruct industrial transformation.

2.2. Research Hypothesis

According to the literature review in the previous sections, ERs induce enterprises to invest in pollution control to meet regulatory standards. This results in increased production costs, which does not promote enterprise competitiveness [18,59]. In this situation, the adoption of green innovation is critical for enterprises profit growth [60]. Furthermore, according to the “Pollution Haven Hypothesis” [61], developed economies have a greater tendency to transfer pollution-intensive enterprises to the less developed economies due to labor availability [62] and less stringent ER, especially in resource-based regions [8,63]. Consequently, pollution level intensifies, and industrial structure transformation is impaired [64]. The opposing view is the porter hypothesis. This hypothesis implies that ER has a positive relationship with TI, induces increased short-term cost, encourages long-term innovation, and ultimately enhances local companies’ competitiveness in the international market [23]. The hypothesis is supported by empirical studies [9,43,47].
Given that the industries’, local governments, and cities’ responses to environmental regulation can be heterogeneous [3,65,66], we believe that city response to comparable legislation may differ depending on their functional responsibilities. Hypotheses are stated in this context as follows:
Hypothesis 1 (H1).
The impact of environmental regulation on the industrial transformation of cities with different functions is inconsistent.
Hypothesis 2 (H2).
The influence of environmental regulation on industrial transformation is nonlinear.
TI is crucial to improving industry performance through efficient resource utilization, declined environmental pollution [59], and increased production efficiency [67], all of which are conducive to urban industrial transformation. Several studies have reported the positive effect of TI on industrial structure optimization [16,68]. For example, Magat [69] emphasized that green TI could simultaneously address economic development and environmental conservation. Liu and Dong [59] used the perception of natural resource utilization and urbanization to reveal the positive effect of TI on the industrialization of 278 cities in China. Meng et al. [19] argued that a higher level of TI is beneficial to China’s green industrial transformation of resource-based cities. In contrast, Xie et al. [8] noted that technological innovation’s input and output aspect might not enhance the green industrial transformation of resource-based cities [6]. Increased TI has the potential to minimize capital invested in production, resulting in lower output. Given the diversity of urban development, the impacts of technological innovation on industrial development may not be uniform [59]. Based on the analysis mentioned above, the hypotheses are stated as follows:
Hypothesis 3 (H3).
The influence of technological innovation on the industrial transformation differs depending on city function.
Hypothesis 4 (H4).
There is a nonlinear relationship between technical innovation and industrial transformation.

3. Methodology and Data

3.1. Model

This study used an econometric model to evaluate the effect of ER and TI on urban industrial transformation. The econometric model was constructed as follows:
TIS i t = α 0 + α 1 ER i t + α 2 TI i t + α 3 IL i t + α 4 EDU i t + α 5 PD i t + α 6 FEL i t + ε i t
where i represents 120 Chinese cities, and t stands for the sample year (2008–2017). The dependent variable denotes transformation of industrial structure. ER represents environmental regulation, TI represents technological innovation, IL represents investment level, EDU represents education level, PD represents population density, FEL represents fiscal expenditure level. α1, α2, α3, α4, α5 and α6 are the estimated coefficients for each independent variable, εit is the error.
Environmental regulation (ER) and technological innovation (TI) may have a multi-dimensional impact on urban industrial transformation [15]. We aim to assess if the intensity of ER and the level of TI will have a dynamic impact on TIS (i.e., whether there is a nonlinear relationship between the variables). Thus, we adopted Hansen’s [70] threshold regression model for empirical testing. Threshold regression is a nonlinear econometric model that evaluates one or more threshold variables between two variables that are causally related. Further, it performs a significance test using the sample parameters divided by the evaluated variables [71]. In this paper, the threshold regression of the econometric model is set as follows:
l n TIS = β 0 + β 1 l n ER I q γ + β 2 l n ER I q > γ + α l n X + μ 1
where I(•) represents an indicator function. When the expression in the brackets is false, the value is 0, otherwise the value is 1. The sample interval is partitioned into two districts with slopes β1 and β2 by comparing threshold variables q with threshold quantity γ. In this study, q refers to ER and TI. X represents the control variables, including investment level (IL), education level (EDU), the population density (PD) and fiscal expenditure level (FEL).
When testing the double threshold effect, the first threshold value is assumed to be known. The double threshold model is set as follows:
l n TIS = β 0 + β 1 l n ER I q γ 1 + β 2 l n ER I γ 1 < q γ 2 + β 3 l n ER I q > γ 2 + α l n X + μ 1
where, γ1 < γ2, the method of fitting the double threshold model is to estimate the second threshold value after the first threshold value is fixed.
Correspondingly, the multi-threshold model is set as follows:
l n TIS = β 0 + β 1 l n ER I q γ 1 + β 2 l n ER I γ 1 < q γ 2 + + β n + 1 l n ER I q > γ n + α l n X + μ 1
The abbreviations in the model have the same meaning as in previous equations.
We used Stata 13 to test the threshold effect of ER and TI on TIS. The threshold estimation and parameter value with the minimum sum of squared residuals were determined using the threshold regression. Then, the significance of the threshold effect was verified by the p value constructed by the bootstrap method. Finally, LR statistics ( L R = 2 l n 1 1 α ) were used to determine whether the threshold estimation value equals the true value, and the confidence interval of the threshold estimation value was examined.

3.2. Variable Selection

3.2.1. Dependent Variables

The transformation of industrial structure (TIS) is the coordinated development of inter-industry, and the scientific synergy among various departments within an industry [16]. It is broadly categorized into two dimensions, namely, rationalization of industrial structure (RIS) and optimization of industrial structure (OIS) [72]. Therefore, we consider RIS and OIS as dependent variables in this study.
The RIS characterizes the degree of coordinated development across industries and the rational utilization of resources, that is, the level of industrial structure. In many studies, the deviation coefficient of industrial structure or Theil index is used to measure the rationalization of industrial structure [73,74]. However, the former cannot properly account for the weight of each industry’s output value in the economy, while the latter cannot offset variations between industries. Therefore, we combined the deviation coefficient of industrial structure and Theil index to reflect RIS, and the expression is as follows:
RIS = 100 / i = 1 n Y i t Y t Y i t / L i t Y t / L t 1 2
where i (i = 1, 2, 3) is agriculture, manufacturing and services, respectively. t represents the year, L represents the number of employees, Y represents the gross national product. Yit/Yt and Lit/Lt represent the industrial structure and employment structure in the Year t, respectively. The higher the RIS, the higher the level of rationalization of industrial structure.
The OIS refers to how the primary industry turns to the secondary industry and then to the tertiary industry. One of the essential criteria for judging the OIS is whether the development direction of the industrial structure is shifting towards “service-oriented”, which can be reflected by the ratio of the output value of the tertiary industry to the output value of the secondary industry [75].

3.2.2. Independent Variables

Environmental Regulation (ER). Indirect ER includes the total investment in industrial pollution control, meeting the standard discharge rate of pollutants such as industrial wastewater, industrial waste gas, or general industrial solid waste, and the treatment cost per unit of industrial wastewater discharge [76,77]. Few studies consider the government’s disclosure of environmental information as an indicator. Therefore, we used the PITI index to measure the intensity of ER in this study, jointly issued by the Institute of Public & Environmental Affairs (IPE) and the Natural Resources Defense Council (NRDC). This index quantitatively measures daily supervision, self-monitoring, social interaction, specific data, environmental impact assessment information, and the disclosure status of other environmental information related to pollutant discharge in 120 key cities [39]. The aforelisted are sufficient for the scientific and comprehensive measurement of the environmental regulation intensity of a city.
Technological Innovation (TI). Enterprises with a high level of TI emit low pollutants, reducing environmental damage. Many studies use the patent applications (authorizations), internal R&D funds, and R&D personnel to determine the level of TI [78,79]. However, the above data can only reflect the level of TI in a specific region, missing out some information. Therefore, we used the Urban Innovation Index released by the Industrial Development Research Center team of Fudan University to measure the degree of TI. The Urban Innovation Index is a stock index adjusted by patent value that scientifically and rationally reflects the TI level of a particular city [40].

3.2.3. Control Variables

Investment level (IL). Investment is one of the “troika” driving economic growth and the only source of physical capital. In the current stage of China’s development, a large amount of financial support is needed to transform industrial structure, technological innovation, infrastructure construction, and improve people’s lives. Industrial transformation can be considerably aided by optimizing investment structures and playing a key role in investment. In this study, we calculated the scale of investment using the ratio of fixed asset investment to GDP.
Education (EDU). In the process of industrial transformation, education plays a key role. The population is more sensitive and concerned about environmental pollution in areas with a higher education level. They participate more in environmental protection, which can improve the city’s environmental quality [21,80]. Education promotes not only current economic progress but also guides future social transformations. The proportion of students enrolled in regular colleges and universities to the overall population was used to calculate each city’s education level in this study.
Population density (PD). Population density is one of the most important factors affecting industrial structure transformation [81,82]. When the population of a region is dense, the labor supply becomes sufficient, and the market potential is large, which can greatly promote the transformation of the industrial structure.
Fiscal expenditure level (FEL). The scale of government fiscal expenditure reflects the government’s initiative in economic development and the government’s emphasis on ER. As the degree of economic development increases, so will regional fiscal expenditures and fiscal decentralization indicators [83], and government fiscal expenditure will affect the intensity of environmental protection in this region [84]. Considering the data availability, fiscal expenditure has not been classified into different types. We used the ratio of fiscal expenditure to GDP, that is, “fiscal expenditure/GDP”, to measure the level of fiscal expenditure.

3.3. Data Sources

The data reported in this study are obtained from China City Statistical Yearbook, China Regional Economic Statistical Yearbook and the Statistical Yearbook of Provinces (Cities). The PITI index is jointly issued by Institute of Public & Environmental Affairs (IPE) and The Natural Resources Defense Council (NRDC) [39], and “China Urban and Industrial Innovation Capacity Report 2017” (hereinafter referred to as the “Report 2017”) is released by the Industrial Development Research Center of Fudan University [40]. In this study, we used panel data from 120 prefecture-level cities in China as the research object (According to “Administrative Divisions of China (2020)” and the “Statistics of Administrative Divisions of the People’s Republic of China (2020)”, there are 293 prefecture-level cities in China). Further, we divided the cities into four types: resource-based cities (type I), industry-oriented cities (type II), comprehensive regional cities (type III), and other cities (type IV), according to Nie and Guo [85]. The details of the cities and their classification are presented in Table A1 of Appendix A.

4. Results

4.1. Results of Panel Regression

4.1.1. Model Selection

The LM test and Hausman test were used to select the mixed model (OLS), fixed effect model (FE), and random effect model (RE) to examine the quantitative relationship between the variables. Taking the resource-based city as an example, when lnRIS was the dependent variable, the LM test returned a probability of 0.000. Therefore, RE was selected in preference to OLS. Hausman’s test returned a probability of 0.2255 (less than 0.5), leading to FE selection over RE. In summary, FE was used for analysis. Variables were transformed to natural logarithms before regression analysis to reduce heteroscedasticity.

4.1.2. Regression Results

With lnRIS as the dependent variable, ER benefits industrial structure rationalization in industry-oriented cities and other city types, but not in the resource-based and comprehensive regional cities (Table 1). TI showed a negative impact on RIS in all four types of cities (Table 1). In addition, fiscal expenditure level (lnFEL) hindered industrial structure rationalization in industry-oriented cities and had no significant impact on the other three types of cities. We found that investment level (lnIL), education level (lnEDU) and population density (lnPD) had no impact on the rationalization of the industrial structure across the four city types (Table 1).
Except for resource-based cities, the regression result indicated that ER optimized industrial structure in the three other city types when lnOIS was designated as the dependent variable (Table 1). We also found that TI positively drove industrial transformation, implying that the higher the level of TI, the more favorable the optimization of industrial structure (Table 1). The regression coefficients of fiscal expenditure level (FEL) were positive across the four city types, demonstrating that the FEL can optimize industrial structure (Table 1).

4.2. Results of the Panel Threshold Regression

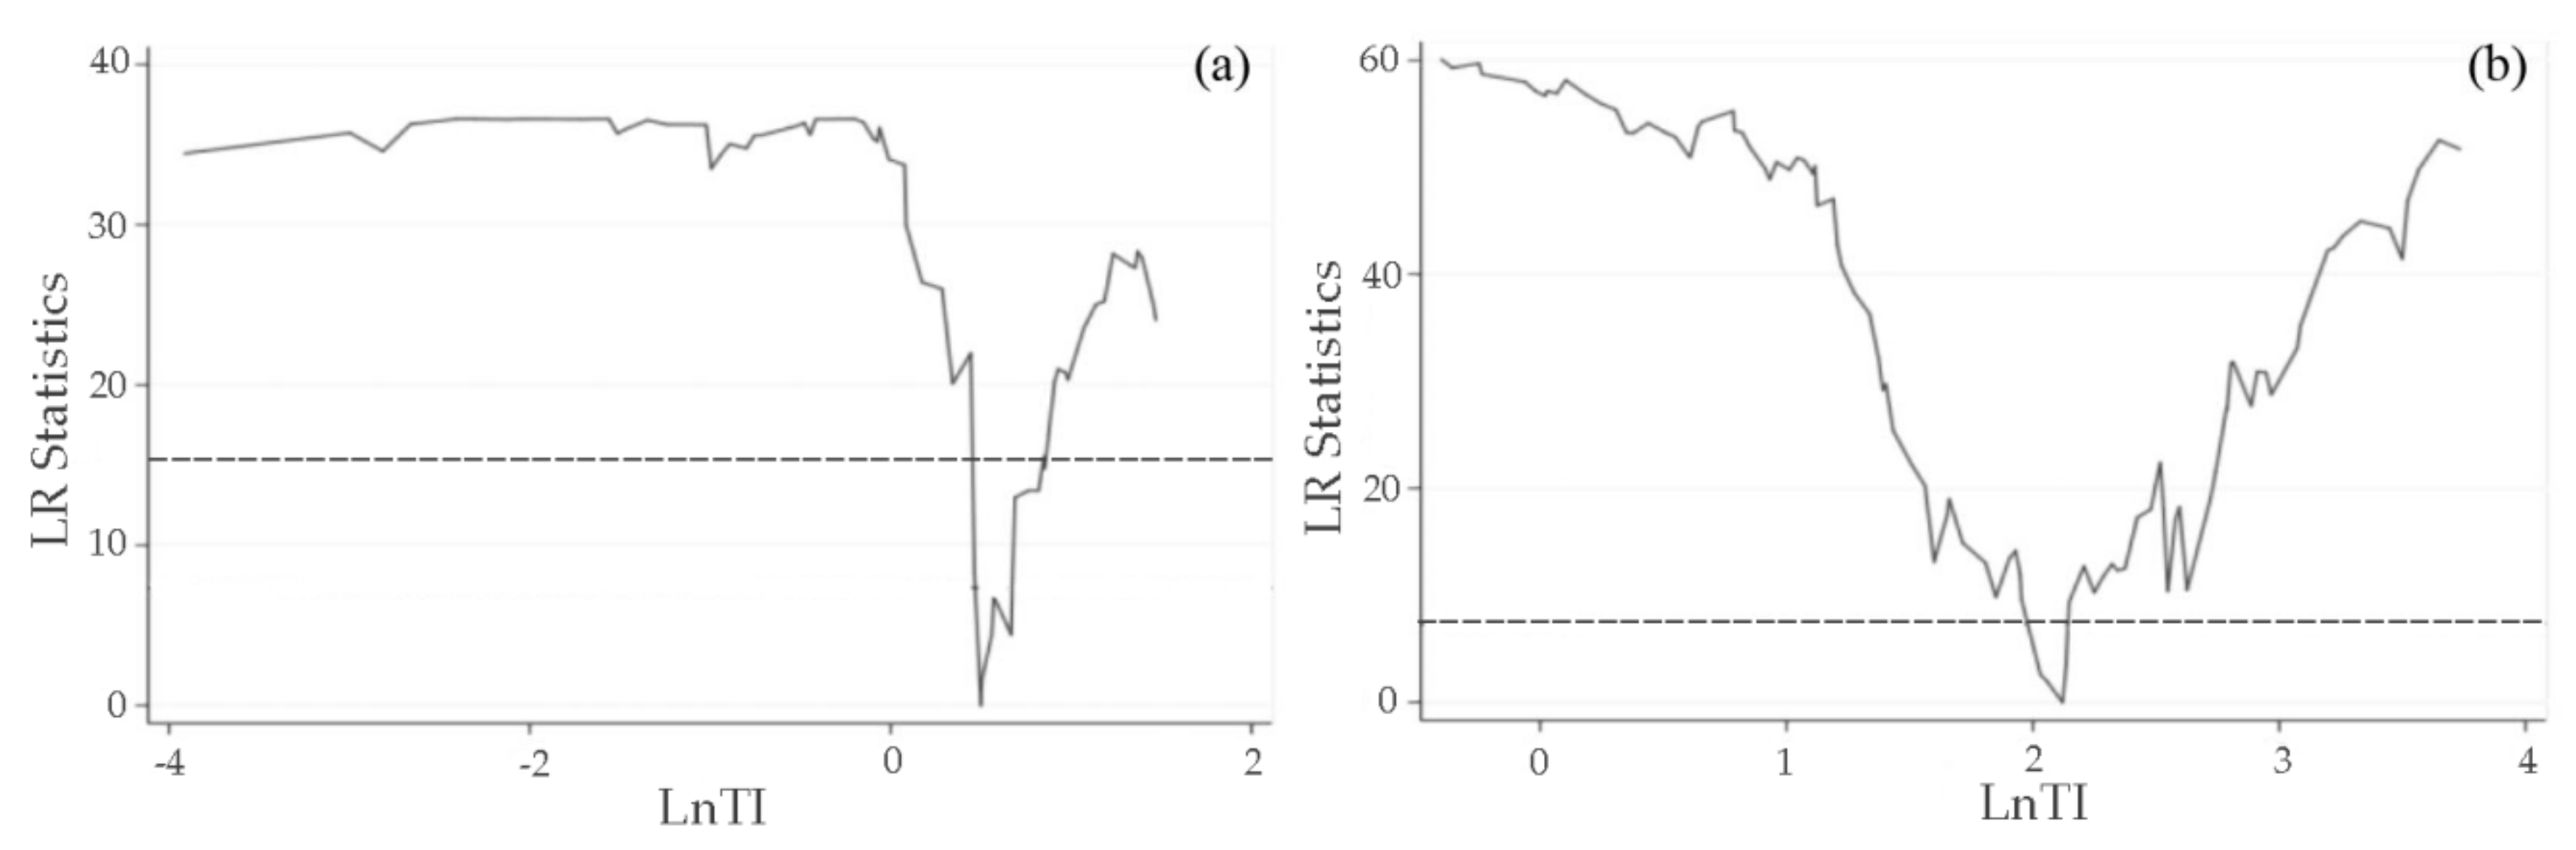
4.2.1. Results of the Panel Threshold Regression with RIS as the Dependent Variable and ER as the Threshold Variable

We used Hansen’s [70] bootstrap method to evaluate the threshold effects of environmental regulation (lnER) in the four types of cities (i.e., setting the number of sampling times to 1000). The threshold effect and number of thresholds were determined by examining the p-value corresponding to the statistics (Table 2).
We found a threshold effect in the models constructed for resource-based cities when ER was designated as the threshold variable (Table 2). As is shown in Table 2, the F statistic of resource-based cities in the single threshold model was significant at 1% level, with a p-value less than 0.01. Therefore, a detailed analysis of the single threshold model was conducted, revealing that the threshold value was 2.9497, the corresponding ER value was 19.10, and the 95% confidence interval was 2.8459–2.9549 (Table 3).
According to the principle of the panel threshold regression model, the threshold estimate is the value returned when the likelihood ratio statistic LR is close to 0. Figure 1 shows the likelihood ratio function graph under the 95% confidence interval when the threshold value is 2.9497. The lowest point of the LR statistic represents the threshold value, and the dotted line represents the critical value of 7.35. The critical value of 7.35 is much higher than the threshold value of 2.9497, indicating that the single threshold value is accurate and effective.
Table 4 shows the results of the panel threshold regression. The influence of ER on RIS in resource-based cities is related to its range. When the lnER level does not exceed 2.9497, the coefficient value was −0.7968, significant at a 0.05 level. That is, RIS is significantly restricted by ER in resources-based cities. When the intensity of lnER increases by one unit, lnRIS decreases by 0.7968 units, provided lnER does not exceed 2.9497. When the intensity of lnER is higher than 2.9497, the coefficient is −0.4568, which is significant at a level of 0.10. In other words, every unit rise in lnER causes a 0.4568 unit decrease in lnRIS. Thus, ER still has an inhibitory effect on RIS, but the inhibition reduces as environmental management improves.

4.2.2. Results of the Panel Threshold Regression with RIS as the Dependent Variable and TI as the Threshold Variable

The threshold effect of technological innovation (lnTI) in the four types of cities reveals that a threshold value exists in both resource-based and industry-oriented cities (Table 2). The threshold values are 0.5008 and 2.1211, respectively (Table 3).
Figure 2 depicts the likelihood ratio function of the single threshold estimate for resource-based and industry-oriented cities within the 95% confidence interval from the panel threshold regression findings.
The panel threshold regression shows that the impact of TI on OIS is proportional to the degree of TI in resource-based and industry-oriented cities (Table 4).
When lnTI does not exceed 0.5008, the regression coefficient is 0.1776 in resource-based cities. When lnTI is greater than 0.5008, the regression coefficient decreases to −0.1676 (Table 4). This finding suggests that when TI increases in resource-based cities, the encouragement of industrial structure rationalization decreases. For industry-oriented cities, the regression coefficient returned for a low level of TI was 0.1116 (lnTI ≤ 2.1211), and −0.0476 was returned for a high level of TI (lnTI > 2.1211).

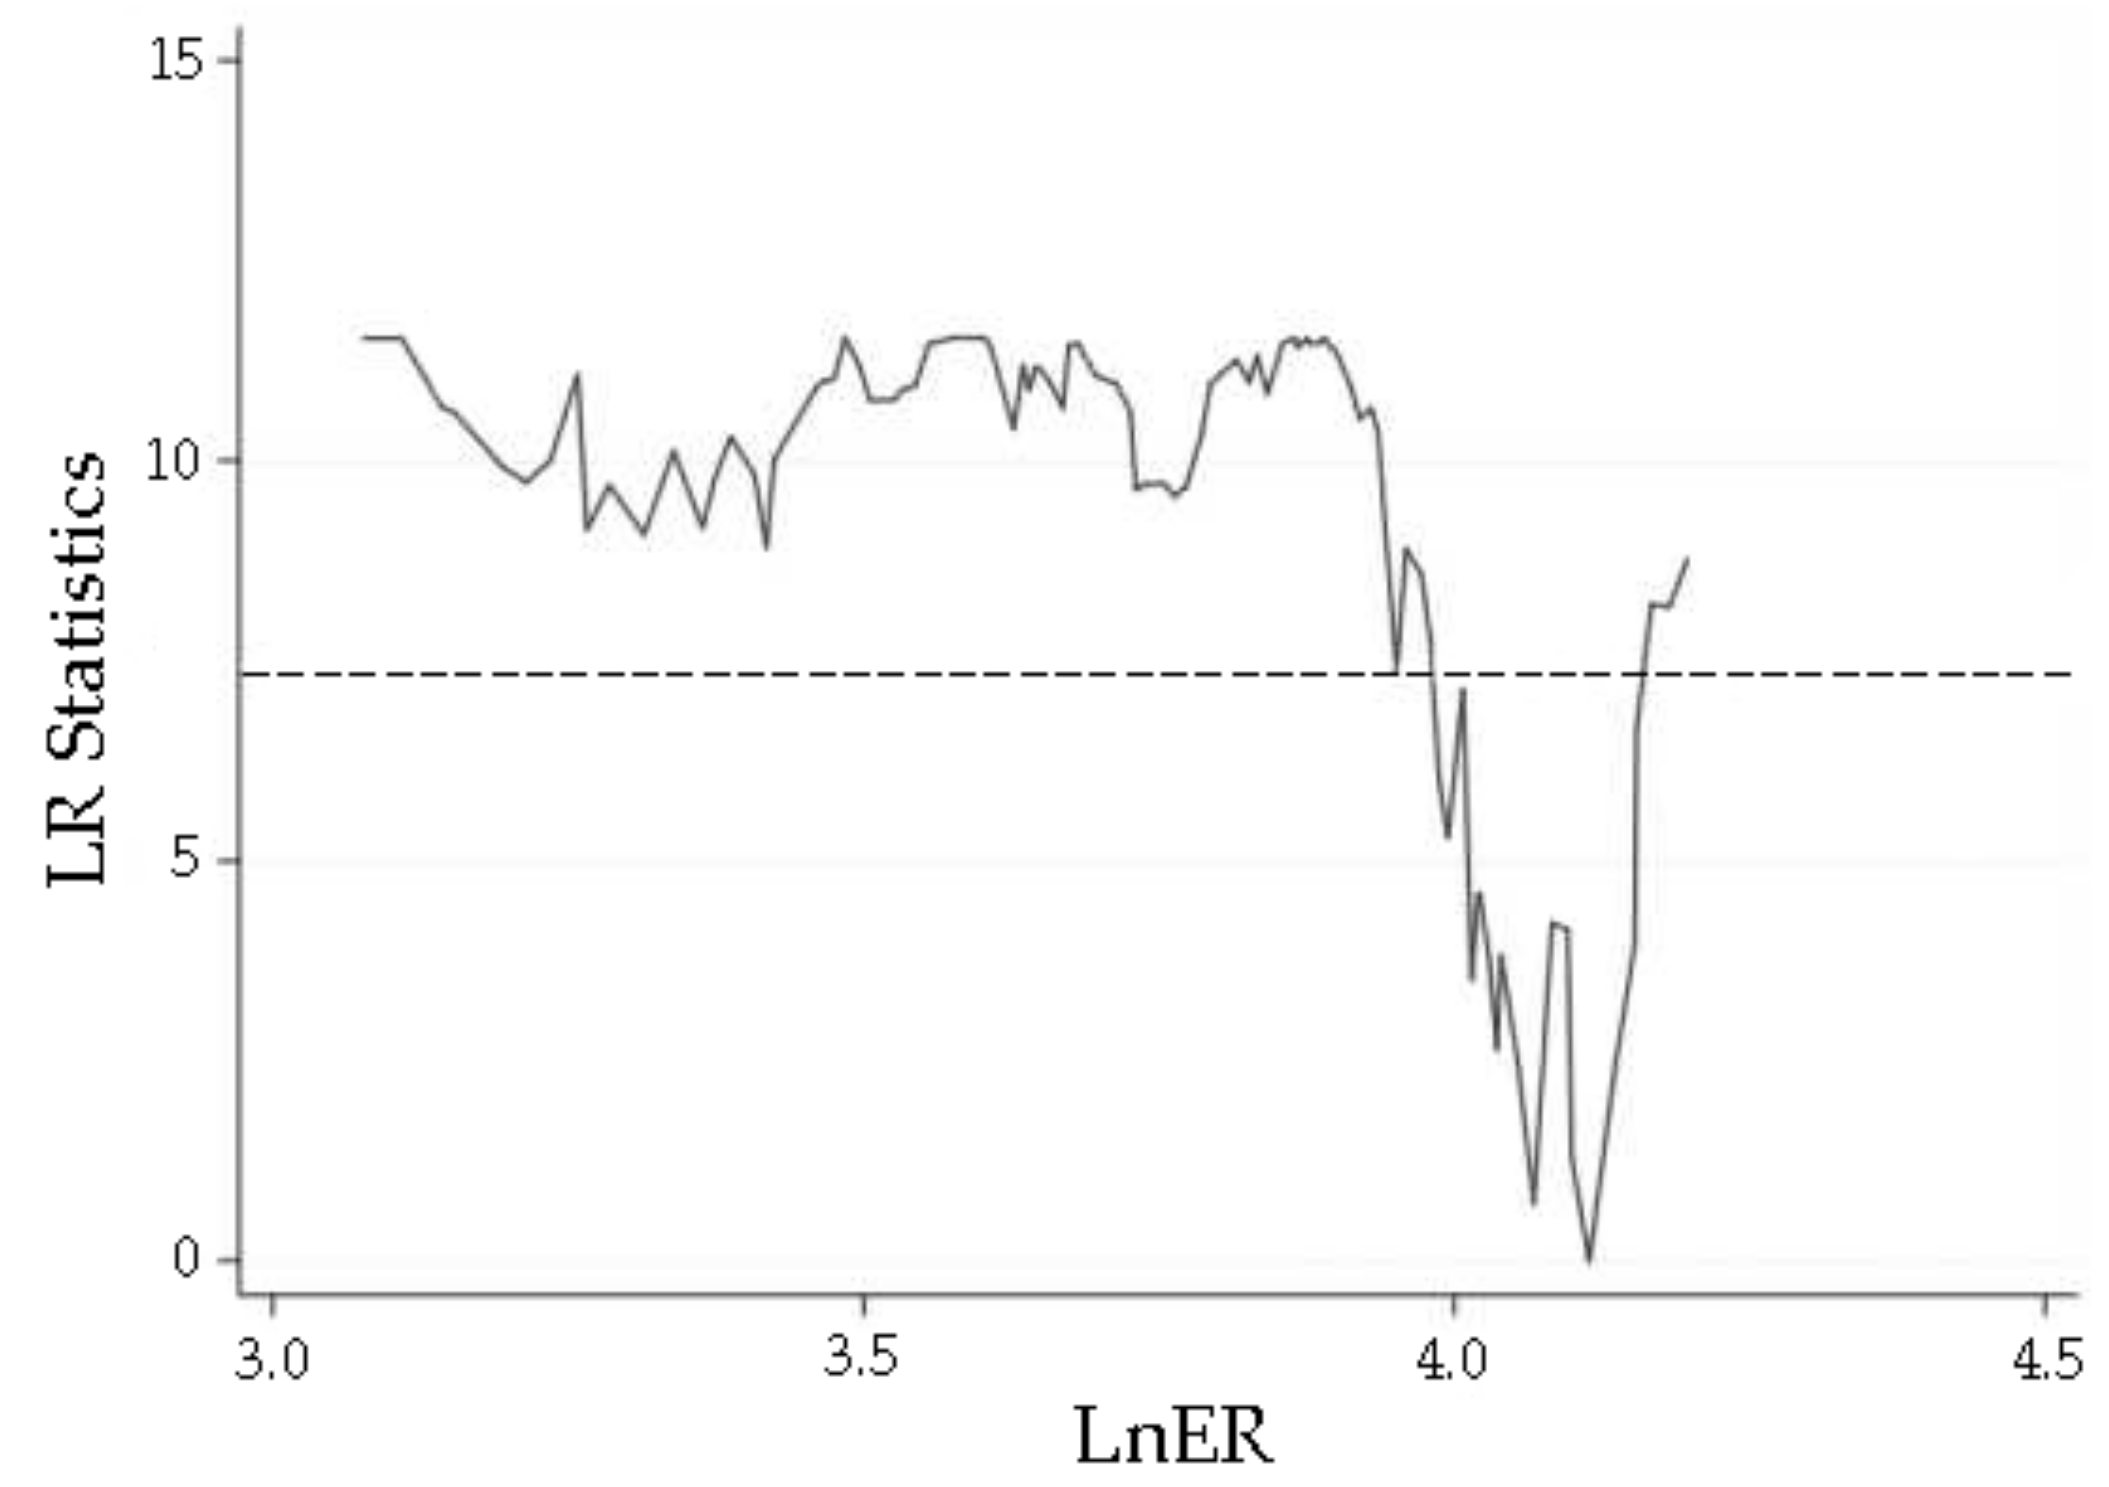
4.2.3. Results of the Panel Threshold Regression with OIS as the Dependent Variable and ER as the Threshold Variable

Only the F statistic in the single threshold model for the comprehensive regional city was significant at 0.05 level, when ER is designated as the threshold variable (Table 2). The threshold value was 4.1141, the corresponding ER value is 61.20, and the 95% confidence interval is 4.0395–4.1352 (Table 3).
Figure 3 shows the likelihood ratio function with a 95% confidence interval and a threshold value of 4.1141. The lowest point of the LR statistic represents the threshold value, and the dotted line represents the critical value of 7.35. The critical value of 7.35 is higher than the threshold value, indicating that the single threshold value is accurate and effective.
The panel threshold regression results show that when the intensity of ER is lower than 4.1141, the regression coefficient of ER on OIS was 0.0802 (Table 5). When the ER intensity exceeds 4.1141, the regression coefficient increases to 0.0982. Both regression coefficients passed the significance test (Table 5). Therefore, higher ER intensity favours optimizing the industrial structure in comprehensive regional cities.

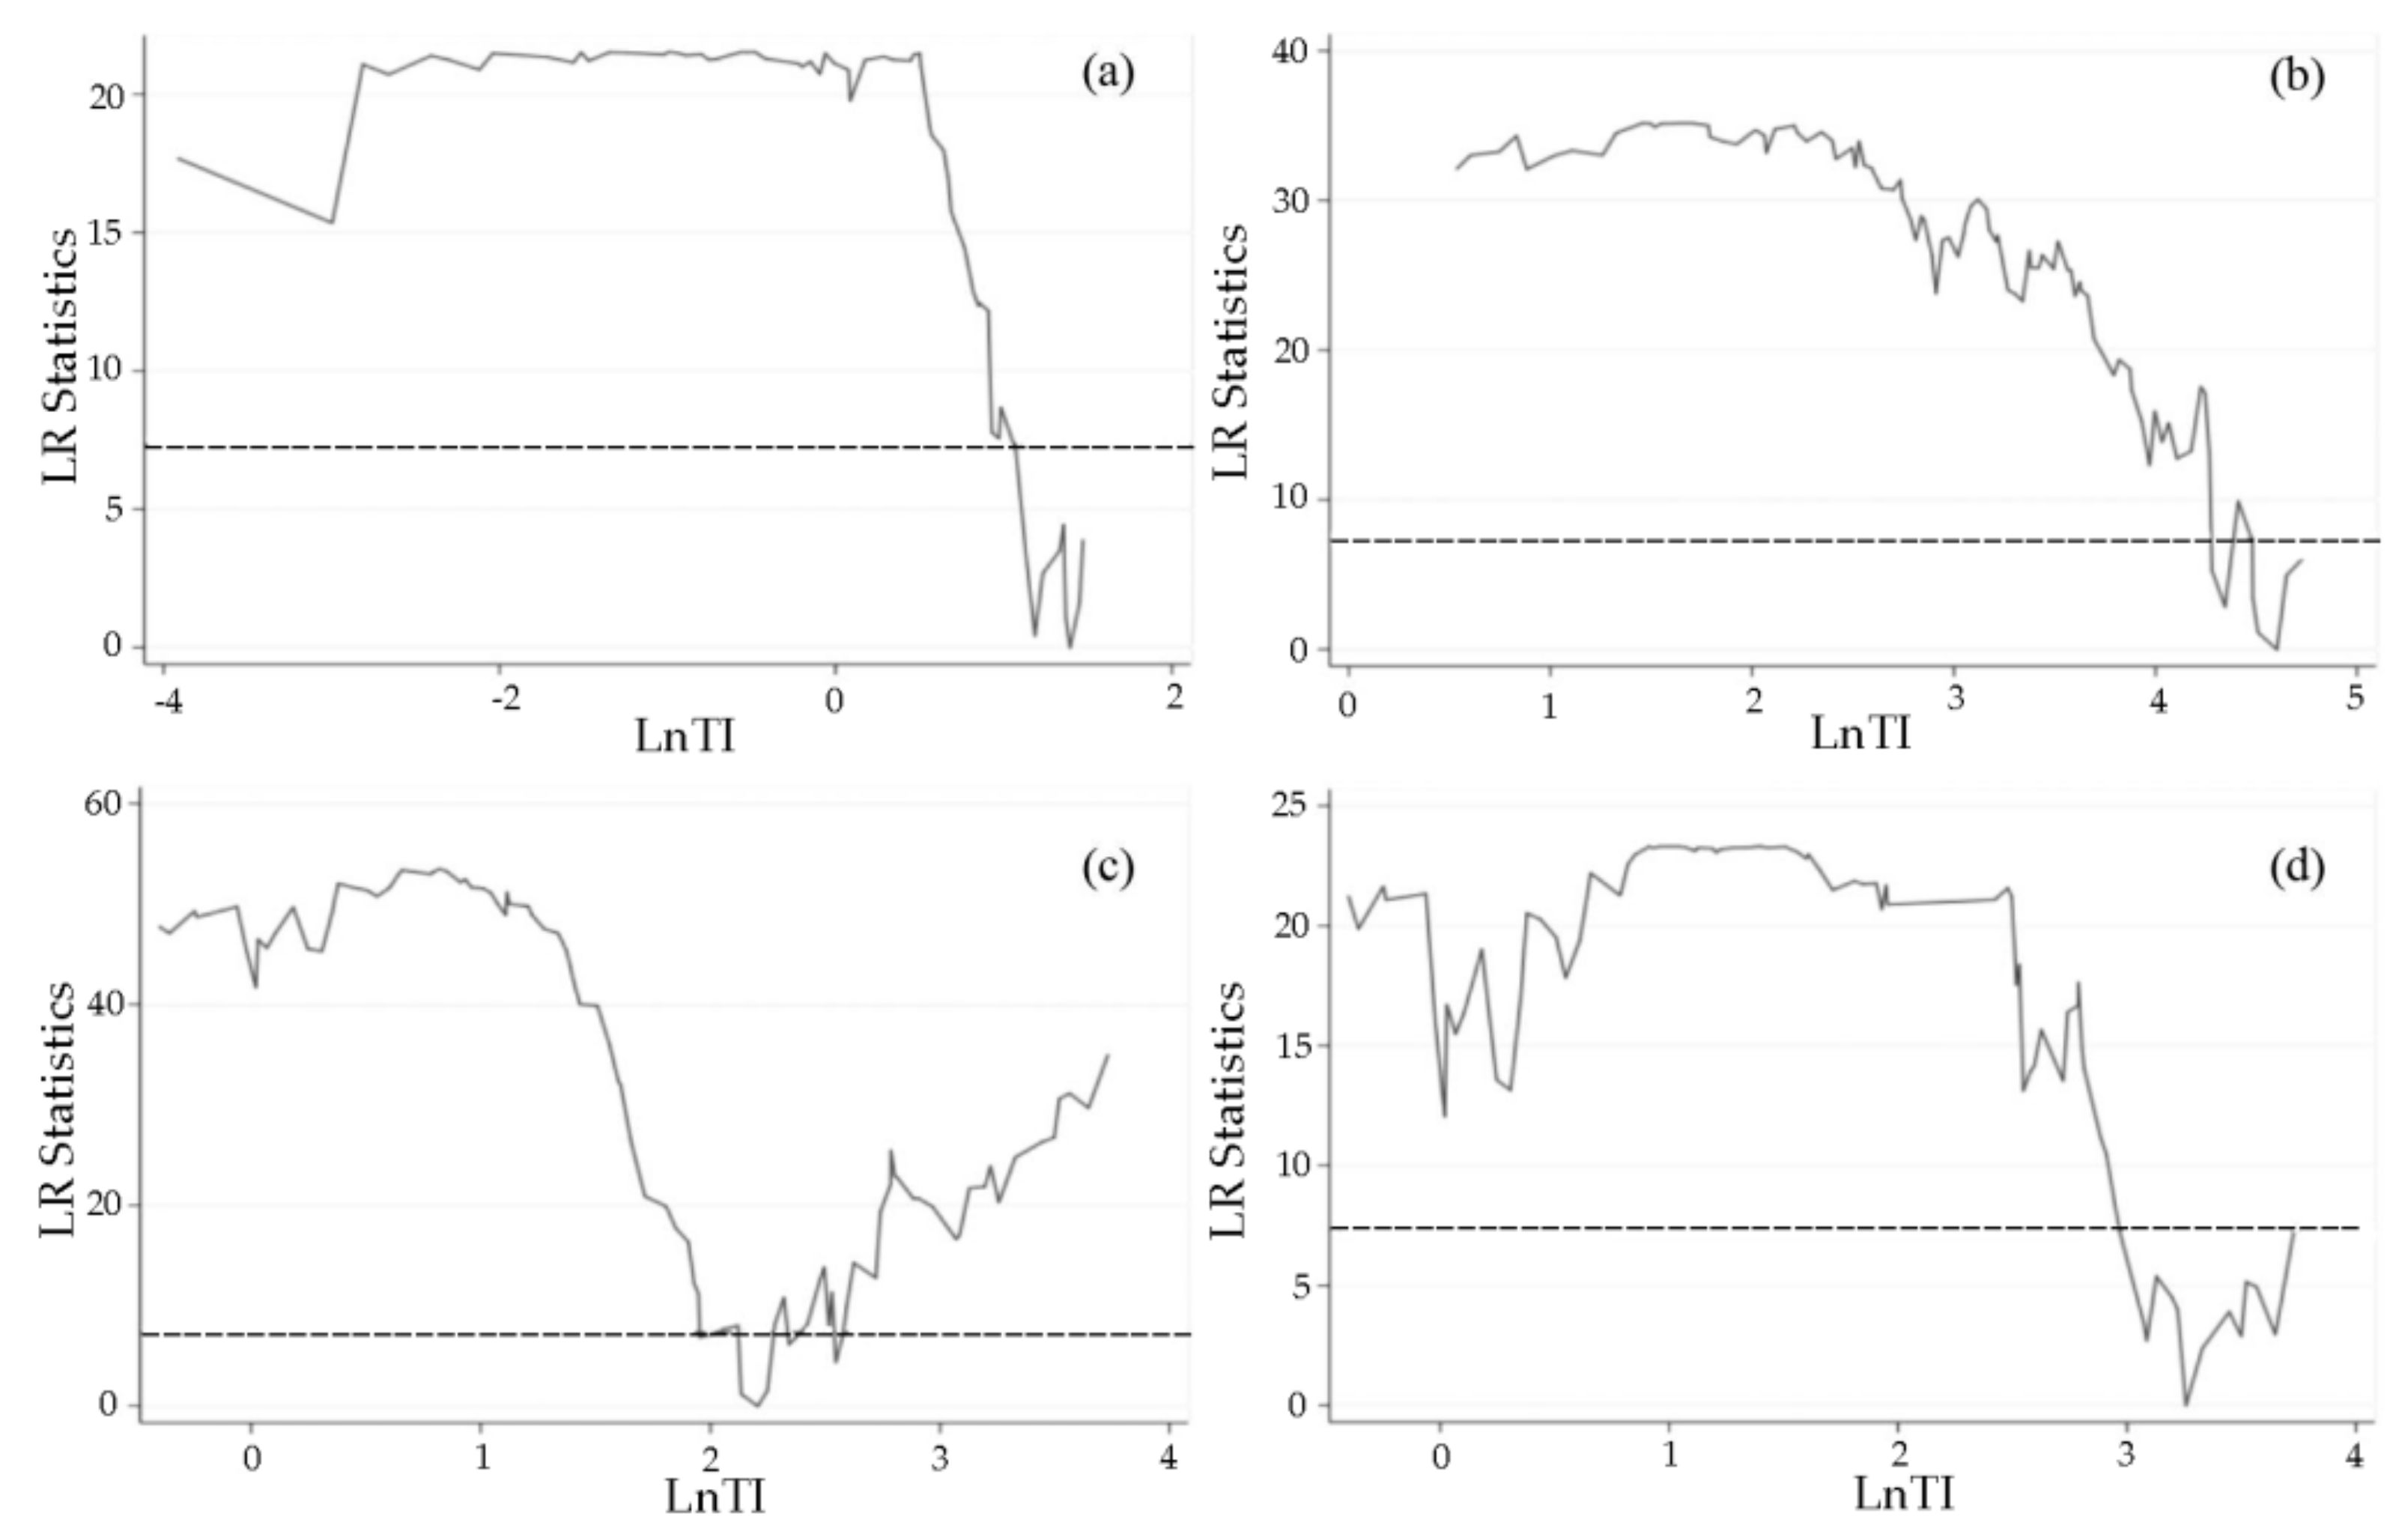
4.2.4. Results of the Panel Threshold Regression with OIS as the Dependent Variable and TI as the Threshold Variable

When technological innovation (lnTI) was designated as the threshold variable, we found a threshold effect in the models constructed for resource-based and comprehensive regional cities (Table 2). Moreover, there are two thresholds in the industry-oriented cities model. The results of the panel threshold estimation are presented in Table 3.
According to the likelihood ratio function test results, the threshold values of resource-based, industry-oriented, and comprehensive regional cities are accurate and effective. Figure 4 shows the likelihood ratio function of the three types of cities.
A relatively low degree of TI (lnTI ≤ 1.3938) yields a regression coefficient of 0.0856 in resource-based cities. High TI (lnTI > 1.3938) results in a regression coefficient of 0.1761. Notably, both coefficients passed the significance test (Table 6). These findings imply that advancing TI promotes the optimization of industrial structure in these cities.
For industry-oriented cities, the trend of regression coefficient is consistent with that of resource-based cities. At low (lnTI ≤ 2.2072), medium (2.2072 < lnTI ≤ 3.2581), and high (lnTI > 3.2581) levels of TI, the regression coefficients were 0.1425, 0.1797, and 0.2144, respectively (Table 6). The role of TI in promoting the optimization of the industrial structure will be strengthened as the degree of TI increases. The outcomes for comprehensive regional cities are consistent with those obtained for resource-based and industry-oriented cities. The regression coefficients at low (lnTI ≤ 4.6023) and high (lnTI > 4.6023) levels of TI were 0.0971 and 0.1380, respectively (Table 6). Both of them passed the significance test.

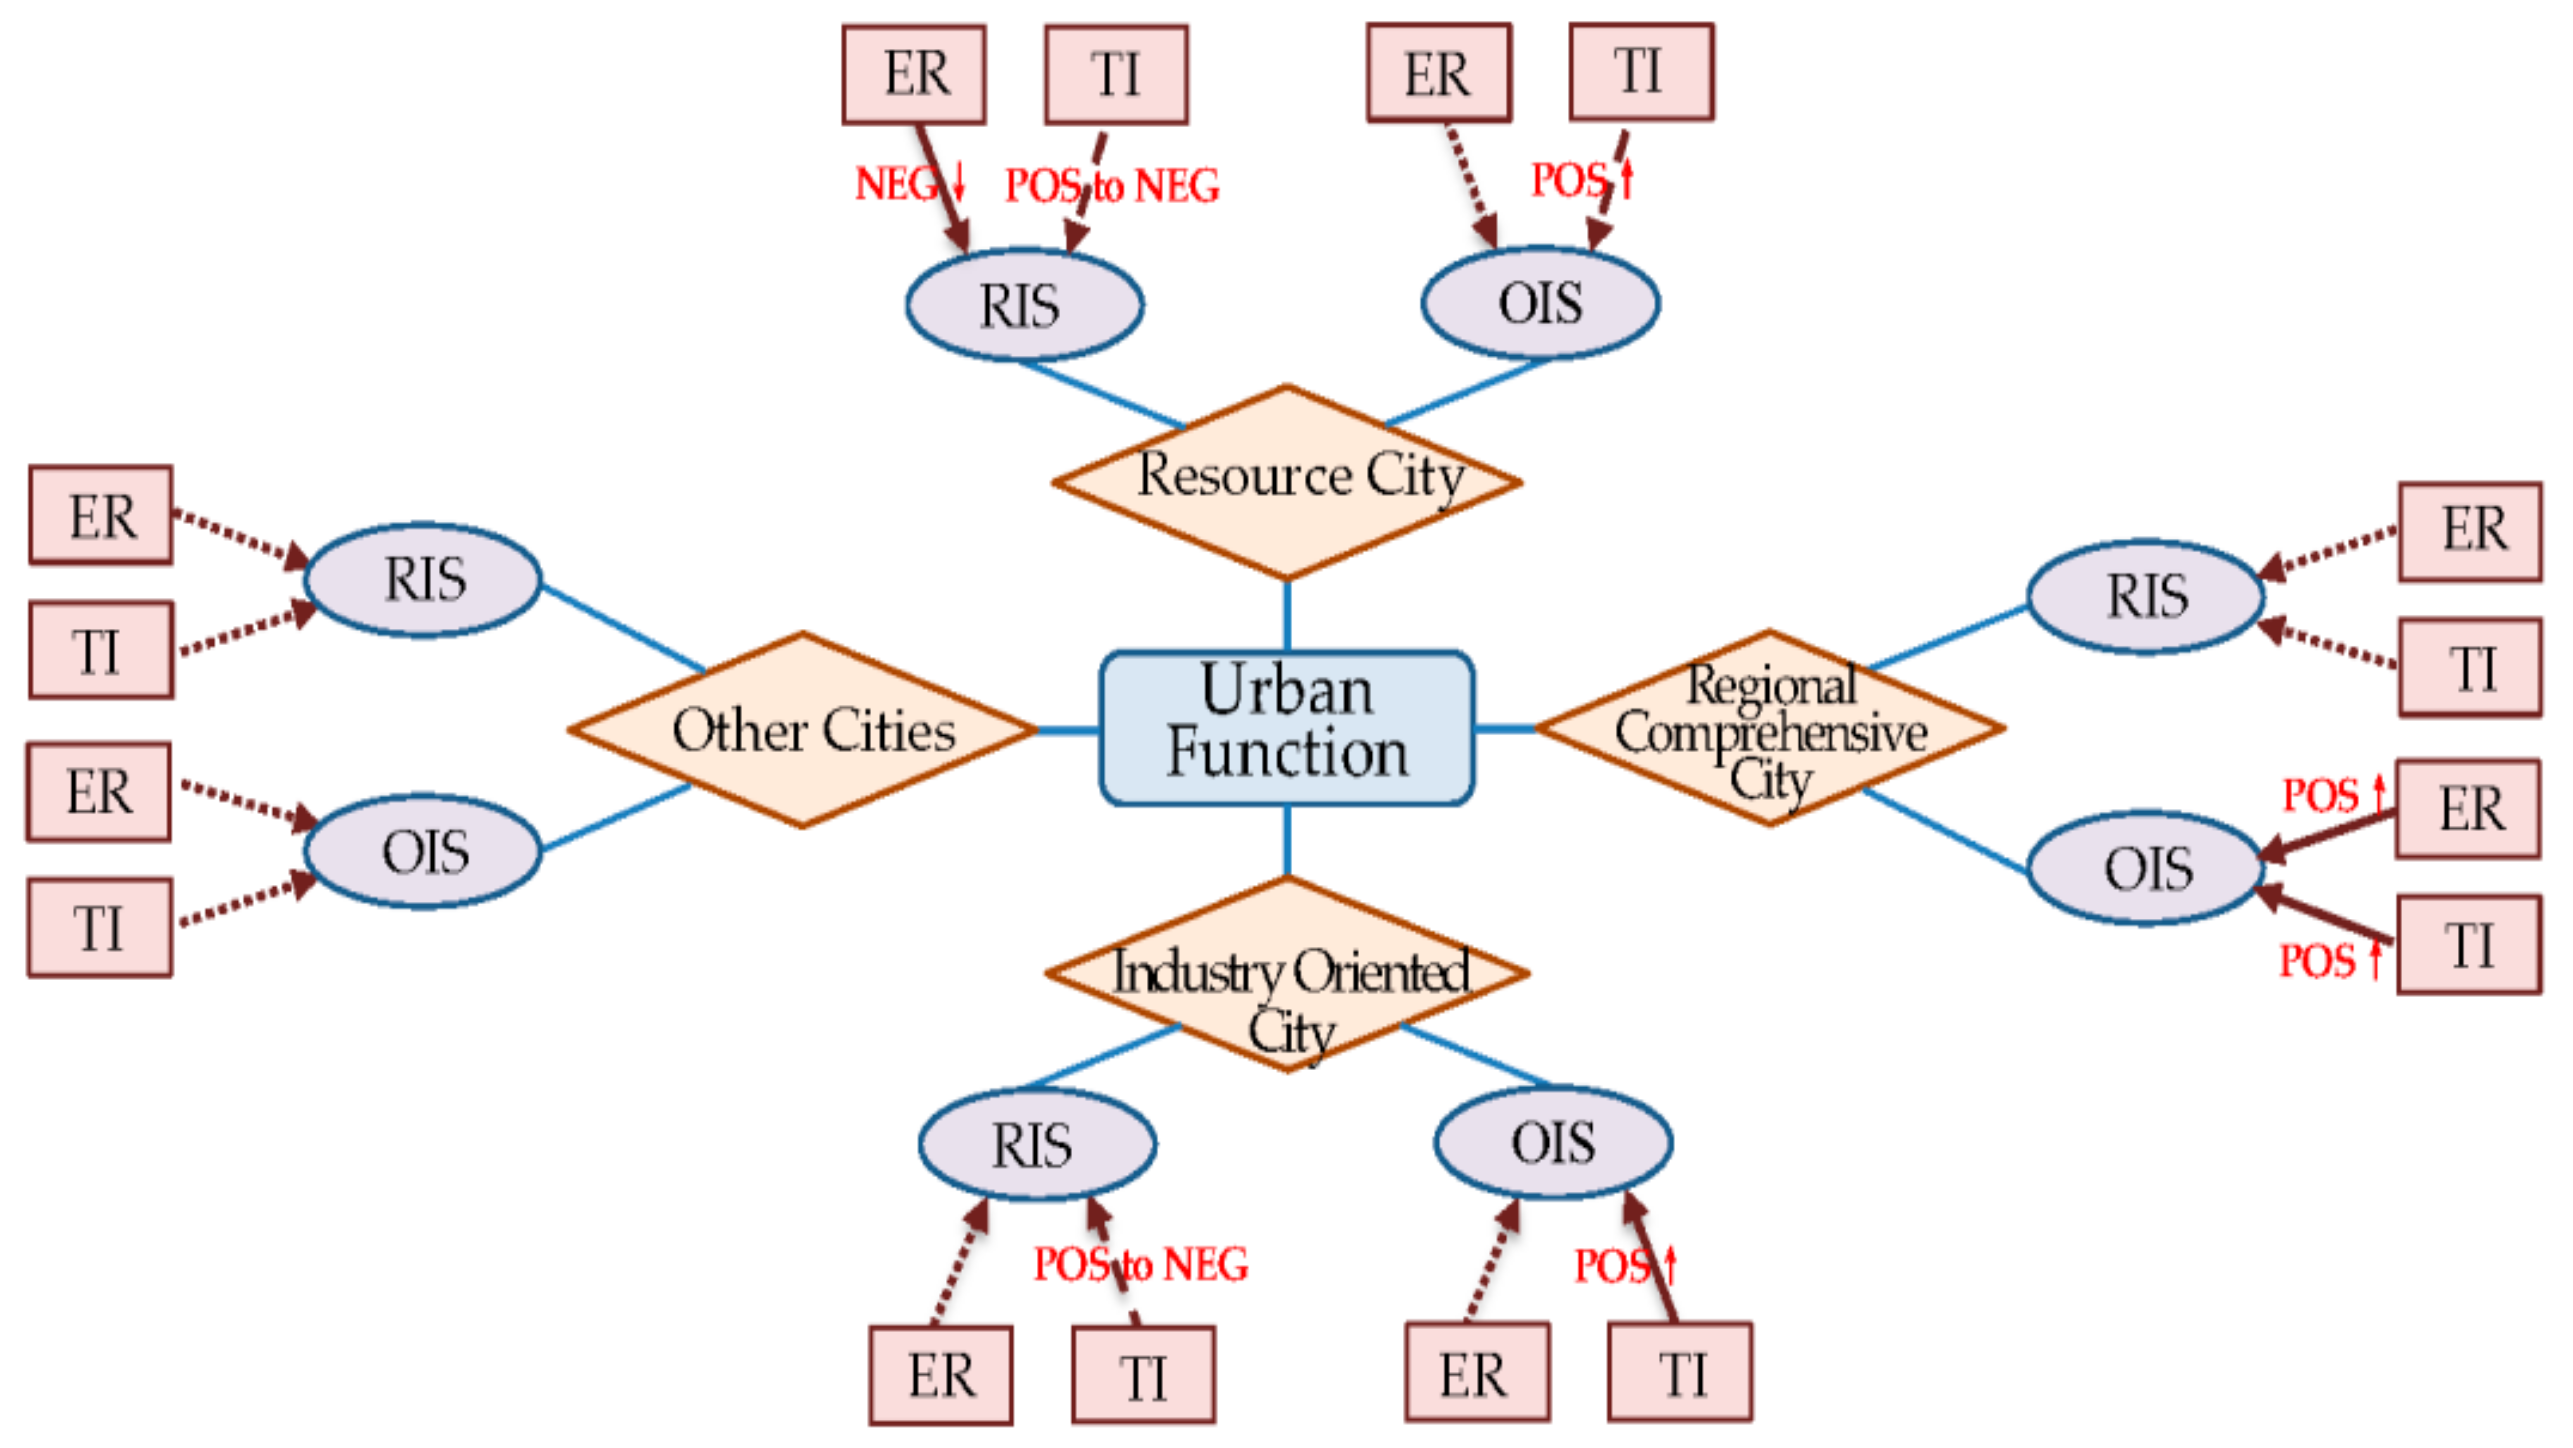
4.3. Summary of the Panel Threshold Regression

Environmental regulation has different impacts on industrial transformation in the four types of cities. When ER was designated as the threshold variable for resource-based cities, the negative impact of ER on RIS weakens with the increasing intensity of ER. The promotion of ER on OIS increases as the intensity of ER rises in comprehensive regional cities. Similarly, the impacts of TI on industrial transformation of the different types of cities varied. Surprisingly, for resource-based and industry-oriented cities, increasing the degree of TI shifts the influence of TI on RIS from positive to negative. For resource-based cities, industry-oriented cities, and comprehensive regional cities, increasing the degree of TI strengthens the promotion of TI on OIS (Figure 5).

5. Discussion

A current and general challenge, especially in developing nations, is achieving integrated social economy and ecological environment development. Promoting industrial transformation through effective ER policies and TI is important to solving this problem [86]. However, there are no consistent results about the effects of ER on industrial transformation [14]. Cities with distinct functions, in particular, have varying development goals, resources endowments and environmental protective tendencies. It is important to consider how environmental legislation and technological innovation influence industrial transformation [87]. Therefore, this study uses the panel threshold model to investigate the impact of ER and TI on transformation of industrial structure.
We found that ER has different impacts on the industrial transformation of the four types of cities. In other words, hypothesis H1 is assumed to be established. In detail, ER restricts the rationalization of industrial structure in resources-based cities, and this negative impact weakens when the intensity of ER increases. This result supports the “compliance costs hypothesis” to some extent [88]. Similarly, Qian et al. [86] analyzed the panel data from 30 typical coal mining cities from 2005 to 2015 and noted a resource curse effect in China’s coal mining cities. The negative effect gradually weakened from 2011 to 2015, shifting the impact of ER from the “compliance costs hypothesis” to the “innovation compensation” [86].
Generally, industry is the main contributor to the economic development of China’s resource-based cities and the primary source of environmental pollution. Resource-based cities face more severe industrial transformation problems than others [89] due to the high unemployment rates, lack of growth potential, weak alternative industries, and other problems [87]. The reasons above may explain why ER restricts the RIS of resource-based cities, and this negative impact weakens when the intensity of ER increases. At the initial stage of implementing ER, eliminating the inherent externalities and meeting production and operation standards are important. The increased internal production costs of enterprises may crowd out investment in TI [19,90]. With the continuous improvement of ER, enterprises may choose to maximize their profit through industrial upgrading to meet the pollution discharge standards. Thus, the increased severity of ERs reduces the negative impact of industrial structure rationalization. In contrast, ER promotes industrial structure optimization in comprehensive regional cities, and this positive effect strengthens with the increase in ER, consistent with the “Porter Hypothesis” [23]. Therefore, hypothesis H2 is verified.
On the other hand, the nonlinear impacts of TI on industrial transformation differ between cities with various functions, confirming our hypothesis H3 and H4. Technological innovation specifically supports the OIS in resource-based cities, industry-oriented cities, and comprehensive regional cities. This favorable influence is strengthened with the increase in TI level, supporting “Porter Hypothesis”. In line with our findings, most existing studies generally propose that, as the source of the contemporary economy’s sustainable development, TI plays a significant role in improving resource use efficiency and upgrading the industrial structure [54,91]. For instance, Xie et al. [8] analyzed the impact of TI on industrial transformation of 115 resource-based cities using panel data from 2003 to 2016. The authors found that TI has a favorable impact on the green industrial transformation of resource-based cities. Besides, when TI advances, the new industrial sector separates from the original industrial sector. Moreover, new technology promotes the emergence of new sectors [92], which benefits economic growth and industrial structure optimization.
Surprisingly, as the degree of TI increases in resource-based and industry-oriented cities, the influence of TI on industrial structure rationalization shifts from positive to negative. Similarly, some researchers argue that TI has a negative influence on the promotion of industrial transformation. For example, Jin et al. [46] reported that TI hindered the green growth of industrial water resources in central China based on the panel data from 30 provinces from 2000 to 2016.
Conversely, Li and Lin [93] employed the panel data from 30 provinces in China from1997 to 2012 to show that TI can boost resource utilization through technological progress, thereby propelling the industrial transformation of resource-based cities. According to previous research [8,87], the change in the impact of TI on the industrial structure rationalization in resource-based cities may be related to the cities’ reliance on local resources, low technological capacity, strategic technology introduction, and weak absorption and utilization of advanced or imported technology.
This transition may be related to the cities’ current stage of industrial development in the case of industry-oriented cities [59]. However, rapid industrialization can endanger environmental and public health if the government fails to take substantial measures to promote novel industrial transformation technologies [43].

6. Conclusions and Implications for Policy

6.1. Conclusions

This study used the panel data of 120 prefecture-level cities in China from 2008 to 2017, categorizing them into four groups: resource-based cities, industry-oriented cities, comprehensive regional cities and other types of cities. The study used panel regression and threshold regression models to verify the effects of environmental regulation (ER) and technological innovation (TI) on the industrial transformation of cities with different functions. Further, the quantitative nonlinear relationships between variables are established. Our findings pave the way for the industrial transformation of various city types in China and other developing countries worldwide. The main conclusions are as follows:
Both ER and TI had varied impacts on the industrial transformation of the different functional cities. The restriction of ER on RIS declines as ER becomes more stringent in resource-based cities. Improved TI is critical in supporting the optimization of resource-based cities’ industrial structures. The OIS is positively associated with improved TI in industry-oriented cities. With the increase in ER and TI, their favorable influences on optimizing the industrial structure are strengthened in comprehensive regional cities. Finally, there is no nonlinear relationship between ER, TI and industrial structure transformation in other types of cities.

6.2. Policy Implications

Comparing and analyzing the impact of environmental regulation (ER) and technological innovation (TI) on transforming the industrial structure of different functional cities is significant. In this regard, we put forward the following policy recommendations:
Firstly, considering the diversity of urban function types, “one size fits all” environmental policy should be abandoned to establish a flexible environmental governance policy framework. The government should implement different environmental regulation policies to ensure that ER promotes industrial transformation. The reverse effect of ERs should be effectively considered to strengthen industrial transformation in industry-oriented and comprehensive regional cities.
Secondly, the government should pay more attention to the intensity of ER for improvement and fully exploit its benefits for industrial transformation. For example, strict ERs are not conducive to rationalizing the industrial structure in resource-based cities. We suggest that the policymakers in resource-based cities should reasonably maintain the current ER and invest massively in public awareness because increased public participation in environmental regulation is critical for achieving desirable industrial transformation [7,94].
Finally, it is necessary to consider the differences between cities’ functions when promoting industrial transformation. The government should not only rely on ER to compel enterprises to engage in innovative R&D activities. For instance, the government can strengthen the R&D capabilities of scientific and technological enterprises by increasing fiscal expenditures and ensuring that R&D activities are adequately funded. It is worth noting that policy instruments may have different consequences depending on whether they are designed to enhance or hinder [95].
This study has some limitations that could be addressed in future research. First, heterogeneous ER policies, such as voluntary or public participation, command-controlled, and market-oriented, have diverse impacts on the industrial transformation. This study makes no distinction between these forms of environmental legislation but views environmental control broadly. Second, there are substantial variances in the level of economic growth between China’s eastern, western and central regions. Even cities of the same type in various regions have major differences in their development levels, affecting the generation of TI. Future research could focus on how heterogeneous ER affects the industrial transformation of cities with different functions. Furthermore, spatial interdependencies should also be considered in future research by using a spatial panel model to further investigate the relationship between ER, TI, and industrial transformation of cities with various functions in different regions of China and globally.

Author Contributions

Conceptualization, J.X.; methodology, J.X. and D.C.; software, D.C.; validation, J.X., D.C. and M.Z.; formal analysis, J.X. and M.Z.; investigation, R.L. and D.C.; data analysis, J.X. and Y.K.; writing—original draft preparation, J.X. and D.C.; writing—review and editing, J.X. and D.C.; supervision, J.X., D.C. and M.Z.; project administration, J.X. and D.C.; funding acquisition, J.X. and D.C. All authors have read and agreed to the published version of the manuscript.

Funding

This study was supported by the Soft Science Project of Gansu Province, China (Grant No.20CX9ZA060), the University Innovation Ability Improvement Project of Gansu Province (Grant No.2020A-063) and Key Educational Reform Program of Lanzhou University of Finance and Economics (Grant No.2020-02).

Institutional Review Board Statement

Not applicable.

Informed Consent Statement

Not applicable.

Data Availability Statement

Data were obtained from China City Statistical Yearbook, China Regional Economic Statistical Yearbook, the Statistical Yearbook of Provinces in China, “PITI Index Report” and “China Urban and Industrial Innovation Capacity Report 2017”.

Conflicts of Interest

The authors declare no conflict of interest.

Appendix A

Table A1. Cities and their respective provinces.
CityProvinceCity TypeCityProvinceCity Type
DatongShanxiresource- based cityKunmingYunnanregional comprehensive city
YangquanShanxiresource-based cityXi’anShaanxiregional comprehensive city
DaqingHeilongjiangresource-based cityLanzhouGansuregional comprehensive city
ZaozhuangShandongresource-based cityXiningQinghairegional comprehensive city
PingdingshanHenanresource-based cityYinchuanNingxiaregional comprehensive city
JiaozuoHenanresource-based cityUrumqiXinjiangregional comprehensive city
TongchuanShaanxiresource-based cityTangshanHebeiother city
KramayXinjiangresource-based cityQinhuangdaoHebeiother city
Tianjin industry-oriented cityHandanHebeiother city
BaodingHebeiindustry-oriented cityChangzhiShanxiother city
BaotouInner Mongoliaindustry-oriented cityLinfenShanxiother city
DalianLiaoningindustry-oriented cityChifengInner Mongoliaother city
AnshanLiaoningindustry-oriented cityErdosInner Mongoliaother city
FushunLiaoningindustry-oriented cityBenxiLiaoningother city
QiqiharHeilongjiangindustry-oriented cityJinzhouLiaoningother city
ChangzhouJiangsuindustry-oriented cityJilinJilinother city
SuzhouJiangsuindustry-oriented cityMudanjiangHeilongjiangother city
ZhenjiangJiangsuindustry-oriented cityShanghai other city
NingboZhejiangindustry-oriented cityXuzhouJiangsuother city
JiaxingZhejiangindustry-oriented cityNantongJiangsuother city
WuhuAnhuiindustry-oriented cityLianyungangJiangsuother city
Ma’anshanAnhuiindustry-oriented cityYanchengJiangsuother city
XiamenFujianindustry-oriented cityYangzhouJiangsuother city
QuanzhouFujianindustry-oriented cityWenzhouZhejiangother city
QingdaoShandongindustry-oriented cityHuzhouZhejiangother city
ZiboShandongindustry-oriented cityShaoxingZhejiangother city
YantaiShandongindustry-oriented cityTaizhouZhejiangother city
WeifangShandongindustry-oriented cityJiujiangJiangxiother city
WeihaiShandongindustry-oriented cityJiningShandongother city
JingzhouHubeiindustry-oriented cityTai’anShandongother city
ZhuzhouHunanindustry-oriented cityRizhaoShandongother city
ZhongshanGuangdongindustry-oriented cityKaifengHenanother city
PanzhihuaSichuanindustry-oriented cityLuoyangHenanother city
MianyangSichuanindustry-oriented cityAnyangHenanother city
YibinSichuanindustry-oriented citySanmenxiaHenanother city
BaojiShaanxiindustry-oriented cityYichangHubeiother city
JinchangGansuindustry-oriented cityXiangtanHunanother city
Beijing regional comprehensive cityYueyangHunanother city
ShijiazhuangHebeiregional comprehensive cityChangdeHunanother city
TaiyuanShanxiregional comprehensive cityZhangjiajieHunanother city
HohhotInner Mongoliaregional comprehensive cityShaoguanGuangdongother city
ShenyangLiaoningregional comprehensive cityShenzhenGuangdongother city
ChangchunJilinregional comprehensive cityZhuhaiGuangdongother city
HarbinHeilongjiangregional comprehensive cityShantouGuangdongother city
NanjingJiangsuregional comprehensive cityFoshanGuangdongother city
WuxiJiangsuregional comprehensive cityZhanjiangGuangdongother city
HangzhouZhejiangregional comprehensive cityLiuzhouGuangxiother city
HefeiAnhuiregional comprehensive cityGuilinGuangxiother city
FuzhouFujianregional comprehensive cityBeihaiGuangxiother city
NanchangJiangxiregional comprehensive cityZigongSichuanother city
JinanShandongregional comprehensive cityLuzhouSichuanother city
ZhengzhouHenanregional comprehensive cityDeyangSichuanother city
WuhanHubeiregional comprehensive cityNanchongSichuanother city
ChangshaHunanregional comprehensive cityZunyiGuizhouother city
GuangzhouGuangdongregional comprehensive cityQujingYunnanother city
DongguanGuangdongregional comprehensive cityYuxiYunnanother city
NanningGuangxiregional comprehensive cityXianyangShaanxiother city
Chongqing regional comprehensive cityWeinanShaanxiother city
ChengduSichuanregional comprehensive cityYan’anShaanxiother city
GuiyangGuizhouregional comprehensive cityShizuishanNingxiaother city

References

  1. Awan, U.; Kraslawski, A.; Huiskonen, J. Governing interfirm relationships for social sustainability: The relationship between governance mechanisms, sustainable collaboration, and cultural intelligence. Sustainability 2018, 10, 4473. [Google Scholar] [CrossRef] [Green Version]
  2. Giuseppe, M. Environmental economics, ecological economics, and the concept of sustainable development. Environ. Value 1997, 6, 213–233. [Google Scholar] [CrossRef] [Green Version]
  3. Yasmeen, H.; Tan, Q.M.; Zameer, H.; Tan, J.L.; Nawaz, K. Exploring the impact of technological innovation, environmental regulations and urbanization on ecological efficiency of China in the context of COP21. J. Environ. Manag. 2020, 274, 111210. [Google Scholar] [CrossRef] [PubMed]
  4. Li, F.Y.; Wang, Z.; Huang, L.X. Economic growth target and environmental regulation intensity: Evidence from 284 cities in China. Environ. Sci. Pollut. Res. 2021, 28, 1–15. [Google Scholar] [CrossRef] [PubMed]
  5. Yu, B.B.; Shen, C. Environmental regulation and industrial capacity utilization: An empirical study of China. J. Clean. Prod. 2020, 246, 118986. [Google Scholar] [CrossRef]
  6. Peng, H.; Shen, N.; Ying, H.Q.; Wang, Q.W. Can environmental regulation directly promote green innovation behavior?-based on situation of industrial agglomeration. J. Clean. Prod. 2021, 314, 128044. [Google Scholar] [CrossRef]
  7. Feng, Z.J.; Chen, W. Environmental regulation, green innovation, and industrial green development: An empirical analysis based on the spatial Durbin model. Sustainability 2018, 10, 223. [Google Scholar] [CrossRef] [Green Version]
  8. Xie, W.C.; Yan, T.H.; Xia, S.M.; Chen, F.Z. Innovation or introduction? The impact of technological progress sources on industrial green transformation of resource-based cities in China. Front. Energy Res. 2020, 8, 598141. [Google Scholar] [CrossRef]
  9. Fan, Q.Q.; Qiao, Y.B.; Zhang, T.B.; Huang, K.N. Environmental regulation policy, corporate pollution control and economic growth effect: Evidence from China. Environ. Chall. 2021, 5, 100244. [Google Scholar] [CrossRef]
  10. Hussain, C.M.; Hoque, R.R.; Balachandran, S. Handbook of Environmental Materials Management; Springer: Cham, Switzerland, 2019. [Google Scholar] [CrossRef]
  11. Liu, J.Y.; Xie, J. Environmental regulation, technological innovation, and export competitiveness: An empirical study based on China’s manufacturing industry. Int. J. Environ. Res. Public Health 2020, 17, 1427. [Google Scholar] [CrossRef] [Green Version]
  12. Borsatto, J.M.L.S.; Amui, L.B.L. Green innovation: Unfolding the relation with environmental regulations and competitiveness. Resour. Conserv. Recycl. 2019, 149, 445–454. [Google Scholar] [CrossRef]
  13. Zhang, Y.; Xue, Y.J.; Yang, J. Impact of environmental regulations on green technological innovative behavior: An empirical study in China. J. Clean. Prod. 2018, 188, 763–773. [Google Scholar] [CrossRef]
  14. Chen, X.; Qian, W.W. Effect of marine environmental regulation on the industrial structure adjustment of manufacturing Industry: An empirical analysis of China’s eleven coastal provinces. Mar. Policy 2020, 113, 103797. [Google Scholar] [CrossRef]
  15. Hu, Y.C.; Ren, S.G.; Wang, Y.J.; Chen, X.H. Can carbon emission trading scheme achieve energy conservation and emission reduction? Evidence from the industrial sector in China. Energy. Econ. 2020, 85, 104590. [Google Scholar] [CrossRef]
  16. Wu, N.; Liu, Z.K. Higher education development, technological innovation and industrial structure upgrade. Technol. Forecast. Soc. Chang. 2021, 162, 120400. [Google Scholar] [CrossRef]
  17. Zhang, G.X.; Zhang, P.D.; Zhang, Z.G.; Li, J.X. Impact of environmental regulations on industrial structure upgrading: An empirical study on Beijing-Tianjin-Hebei region in China. J. Clean. Prod. 2019, 238, 117848. [Google Scholar] [CrossRef]
  18. Appio, F.P.; Lima, M.; Paroutis, S. Understanding smart cities: Innovation ecosystems, technological advancements, and societal challenges. Technol. Forecast. Soc. Chang. 2019, 142, 1–14. [Google Scholar] [CrossRef]
  19. Meng, F.S.; Xu, Y.X.; Zhao, G. Environmental regulations, green innovation and intelligent upgrading of manufacturing enterprises: Evidence from China. Sci. Rep. 2020, 10, 1–17. [Google Scholar] [CrossRef]
  20. Gray, W.B. The impact of OSHA and EPA regulation on productivity. Am. Econ. Rev. 1987, 77, 998–1006. [Google Scholar] [CrossRef]
  21. Song, Y.; Yang, T.T.; Li, Z.R.; Zhang, X.; Zhang, M. Research on the direct and indirect effects of environmental regulation on environmental pollution: Empirical evidence from 253 prefecture-level cities in China. J. Clean. Prod. 2020, 269, 122425. [Google Scholar] [CrossRef]
  22. Teeter, P.; Jrgen, S. Constraining or enabling green capability development? How policy uncertainty affects organizational responses to flexible environmental regulations. Br. J. Manag. 2017, 28, 649–665. [Google Scholar] [CrossRef] [Green Version]
  23. Porter, M.E. American’s green strategy. Sci. Am. 1991, 264, 168–246. [Google Scholar] [CrossRef]
  24. Porter, M.E.; van Der Linde, C. Toward a new conception of the environment-competitiveness relationship. J. Econ. Perspect. 1995, 9, 61–82. [Google Scholar] [CrossRef]
  25. Peuckert, J. What shapes the impact of environmental regulation on competitiveness? Evidence from executive opinion surveys. Environ. Innov. Soc. Transit. 2014, 10, 77–94. [Google Scholar] [CrossRef]
  26. Ramanathan, R.; He, Q.L.; Black, A.; Ghobadian, A.; Gallear, D. Environmental regulations, innovation and firm performance: A revisit of the Porter Hypothesis. J. Clean. Prod. 2017, 155, 79–92. [Google Scholar] [CrossRef] [Green Version]
  27. Okuma, K. An analytical framework for the relationship between environmental measures and economic growth based on the regulation theory: Key concepts and a simple model. Evol. Inst. Econ. Rev. 2012, 9, 141–168. [Google Scholar] [CrossRef]
  28. Shehabi, M. Diversification effects of energy subsidy reform in oil exporters: Illustrations from Kuwait. Energy Policy 2020, 138, 110966. [Google Scholar] [CrossRef]
  29. Grafton, R.Q.; Kompas, T.; Long, N.V.; To, H. US biofuels subsidies and CO2 emissions: An empirical test for a weak and a strong green paradox. Energy Policy 2014, 68, 550–555. [Google Scholar] [CrossRef]
  30. Shimizu, M. The relationship between pollution abatement costs and environmental regulation: Evidence from the Chinese industrial sector. Rev. Dev. Econ. 2020, 24, 668–690. [Google Scholar] [CrossRef]
  31. Tong, J.; Liu, W.; Xue, J. Environmental regulation, factor input structure and industrial transformation and upgrading. Econ. Res. 2016, 7, 43–57. [Google Scholar]
  32. Zhao, X.M.; Liu, C.J.; Yang, M. The effects of environmental regulation on China’s total factor productivity: An empirical study of carbon-intensive industries. J. Clean. Prod. 2018, 179, 325–334. [Google Scholar] [CrossRef]
  33. Tsolakis, N.; Srai, J.S.; Aivazidou, E. Blue water footprint management in a UK poultry supply chain under environmental regulatory constraints. Sustainability 2018, 10, 625. [Google Scholar] [CrossRef] [Green Version]
  34. Yang, Q.Y.; Gao, D.; Song, D.Y.; Li, Y. Environmental regulation, pollution reduction and green innovation: The case of the Chinese Water Ecological Civilization City Pilot policy. Econ. Syst. 2021, 45, 100911. [Google Scholar] [CrossRef]
  35. Cao, Y.; Wan, N.N.; Zhang, H.Y.; Zhang, X.L.; Zhou, Q. Linking environmental regulation and economic growth through technological innovation and resource consumption: Analysis of spatial interaction patterns of urban agglomerations. Ecol. Indic. 2020, 112, 106062. [Google Scholar] [CrossRef]
  36. Pan, X.F.; Ai, B.W.; Li, C.Y.; Pan, X.Y.; Yan, Y.B. Dynamic relationship among environmental regulation, technological innovation and energy efficiency based on large scale provincial panel data in China. Technol. Forecast. Soc. 2019, 144, 428–435. [Google Scholar] [CrossRef]
  37. Zhu, X.Y.; Zhu, Y.L.; Meng, X.H. Government environmental information disclosure and environmental performance: Evidence from China. Sustainability 2021, 13, 6854. [Google Scholar] [CrossRef]
  38. Zhao, X.K.; Ding, X.H.; Li, L. Research on environmental regulation, technological innovation and green transformation of manufacturing industry in the Yangtze River Economic Belt. Sustainability 2021, 13, 10005. [Google Scholar] [CrossRef]
  39. Institute of Public & Environmental Affairs (IPE). Gradually Becoming the Norm—120 Cities PITI Report 2017–2018. 2018. Available online: https://wwwoa.ipe.org.cn//Upload/201903070959370175.pdf (accessed on 9 November 2021).
  40. China Business Network. China Urban and Industrial Innovation Report 2017. Industry Development Research Center of Fudan University, CBN Research, Research Institute of Chinese Economy. 2018. Available online: http://imgcdn.yicai.com/uppics/files/2018/01/636507587751508252.pdf (accessed on 9 November 2021).
  41. Mu, L.; Li, L.; Strielkowski, W. The Impact of Urbanization and Industrialization on Energy Security: A Case Study of China. Energies 2019, 12, 2194. [Google Scholar] [CrossRef] [Green Version]
  42. Cheng, Y.; Usama, A.; Shabbir, A.; Tan, Z.X. How do technological innovation and fiscal decentralization affect the environment? A story of the fourth industrial revolution and sustainable growth. Technol. Forecast. Soc. 2021, 162, 120398. [Google Scholar] [CrossRef]
  43. Zeng, Z.H.; Cheng, L.; Shi, L.; Luetkenhorst, W. China’s green transformation through eco-industrial parks. World Dev. 2021, 140, 105249. [Google Scholar] [CrossRef]
  44. Deng, Z.T.; Kang, J.J.; Fan, H.B. Environmental regulation and development transformation in the tropical and subtropical cities of China: A Big Data Analysis. Trop. Conserv. Sci. 2020, 13, 1–14. [Google Scholar] [CrossRef]
  45. Ramanathan, R.; Black, A.; Nath, P.; Muyldermans, L. Impact of environmental regulations on innovation and performance in the UK industrial sector. Manag. Decis. 2010, 48, 1493–1513. [Google Scholar] [CrossRef]
  46. Jin, W.; Zhang, H.Q.; Liu, S.S.; Zhang, H.B. Technological innovation, environmental regulation, and green total factor efficiency of industrial water resources. J. Clean. Prod. 2019, 211, 61–69. [Google Scholar] [CrossRef]
  47. Zheng, J.J.; Shao, X.F.; Liu, W.; Kong, J.; Zuo, G.S. The impact of the pilot program on industrial structure upgrading in low-carbon Cities. J. Clean. Prod. 2021, 290, 125868. [Google Scholar] [CrossRef]
  48. Gayer, T.; Horowitz, J.K. Market-based approaches to environmental regulation. Found. Trends Microecon. 2005, 1, 201–326. [Google Scholar] [CrossRef]
  49. Ren, S.G.; Li, X.L.; Yuan, B.L.; Li, D.Y.; Chen, X.H. The effects of three types of environmental regulation on eco-efficiency: A cross-region analysis in China. J. Clean. Prod. 2018, 173, 245–255. [Google Scholar] [CrossRef]
  50. Zhao, X.L.; Yin, H.T.; Zhao, Y. Impact of environmental regulations on the efficiency and CO2 emissions of power plants in China. Appl. Energy 2015, 149, 238–247. [Google Scholar] [CrossRef]
  51. Liu, W.; Tong, J.; Yue, X.H.; Tramontana, F. How does environmental regulation affect industrial transformation? A study based on the Methodology of Policy Simulation. Math. Probl. Eng. 2016, 2405624. [Google Scholar] [CrossRef]
  52. Kilkiş, Ş. Sustainable development of energy, water and environment systems index for southeast European cities. J. Clean. Prod. 2016, 130, 222–234. [Google Scholar] [CrossRef]
  53. Du, K.R.; Cheng, Y.Y.; Yao, X. Environmental regulation, green technology innovation, and industrial structure upgrading: The road to the green transformation of Chinese cities. Energy Econ. 2021, 98, 105247. [Google Scholar] [CrossRef]
  54. Ngai, L.R.; Pissarides, C.A. Structural change in a multisector model of growth. Am. Econ. Rev. 2007, 97, 429–443. [Google Scholar] [CrossRef] [Green Version]
  55. Yang, L.; Wang, K.L. Regional differences of environmental efficiency of China’s energy utilization and environmental regulation cost based on provincial panel data and DEA method. Math. Comput. Model. 2013, 58, 1074–1083. [Google Scholar] [CrossRef]
  56. Miao, C.L.; Fang, D.B.; Sun, L.Y.; Luo, Q.L. Natural resources utilization efficiency under the influence of green technological innovation. Resour. Conserv. Recycl. 2017, 126, 153–161. [Google Scholar] [CrossRef]
  57. Schumpeter, J.A. The Theory of Economic Development: An Inquiry into Profits, Capital, Credit, Interest and the Business Cycle; Harvard University Press: Cambridge, MA, USA, 1934. [Google Scholar]
  58. Zhao, K.J.; Jing, P.Q. Resource dependency, effective demand shortage and crowding out of innovation in enterprises: An empirical study based on the data of China’s provinces. Sci. Res. Manag. 2014, 35, 85–93. [Google Scholar] [CrossRef]
  59. Liu, Y.J.; Dong, F. How technological innovation impacts urban green economy efficiency in emerging economies: A case study of 278 Chinese cities. Resour. Conserv. Recycl. 2021, 169, 105534. [Google Scholar] [CrossRef]
  60. Tjahjadi, B.; Soewarno, N.; Hariyati, H.; Nafidah, L.N.; Kustiningsih, N.; Nadyaningrum, V. The role of green innovation between green market orientation and business performance: Its implication for open innovation. J. Open Innov. Technol. Mark. Complex. 2020, 6, 173. [Google Scholar] [CrossRef]
  61. Cole, M.A. Development, trade, and the environment: How robust is the environmental Kuznets curve? Environ. Dev. Econ. 2003, 8, 557–580. [Google Scholar] [CrossRef]
  62. Taylor, M.S. Unbundling the pollution haven hypothesis. Adv. Econ. Anal. Policy 2004, 4, 1–28. [Google Scholar] [CrossRef]
  63. Mulatu, A.; Gerlagh, R.; Rigby, D.; Wossink, A. Environmental regulation and industry location in Europe. Environ. Resour. Econ. 2010, 45, 459–479. [Google Scholar] [CrossRef] [Green Version]
  64. Acharyya, J. FDI, Growth and the environment: Evidence from India on CO2 emission during the last two decades. J. Econ. Dev. 2009, 34, 43–58. [Google Scholar] [CrossRef]
  65. Zhu, S.; He, C.; Ying, L. Going green or going away: Environmental regulation, economic geography and firms’ strategies in China’s pollution-intensive industries. Geoforum 2014, 55, 53–65. [Google Scholar] [CrossRef]
  66. Zhang, Y.; Zheng, H.M.; Yang, Z.F.; Li, Y.X.; Liu, G.Y.; Su, M.R.; Yin, X.N. Urban Energy Flow Processes in the Beijing-Tianjin-Hebei (Jing-Jin-Ji) Urban agglomeration: Combining multi-regional input-output tables with ecological network analysis. J. Clean. Prod. 2016, 114, 243–256. [Google Scholar] [CrossRef]
  67. Kunapatarawong, R.; Martínez-Ros, E. Towards green growth: How does green innovation affect employment? Res. Policy 2016, 45, 1218–1232. [Google Scholar] [CrossRef]
  68. Antonelli, C. Localized technological change and factor markets: Constraints and inducements to innovation. Struct. Change. Econ. D. 2006, 17, 224–247. [Google Scholar] [CrossRef] [Green Version]
  69. Magat, W.A. Pollution control and technological advance: A dynamic model of the firm. J. Environ. Econ. Manag. 1978, 5, 1–25. [Google Scholar] [CrossRef]
  70. Hansen, B.E. Threshold effects in non-dynamic panels: Estimation, testing and infeernce. J. Econom. 1999, 93, 345–368. [Google Scholar] [CrossRef] [Green Version]
  71. Liao, M.; Ren, Y. The ‘Double-Edged Effect’ of progress in energy-biased technology on energy efficiency: A comparison between the manufacturing sector of China and Japan. J. Environ. Manag. 2020, 270, 110794. [Google Scholar] [CrossRef]
  72. Xu, H.; Li, H.W. Economic growth and industrial structure change in the Silk Road Economic Belt. Econ. Geogr. 2016, 36, 31–37. [Google Scholar] [CrossRef]
  73. Miśkiewicz, J. Globalization—Entropy unification through the Theil index. Phys. A Stat. Mech. Appl. 2008, 387, 6595–6604. [Google Scholar] [CrossRef]
  74. Wang, R.; Wang, Q.Z.; Yao, S.L. Evaluation and difference analysis of regional energy efficiency in China under the carbon neutrality targets: Insights from DEA and Theil models. J. Environ. Manag. 2021, 293, 112958. [Google Scholar] [CrossRef]
  75. Li, H.; Zou, Q. Environmental regulations, resource endowments and urban industry transformation: Comparative analysis of resource-based and non-resource-based cities. Econ. Res. J. 2018, 53, 182–198. [Google Scholar]
  76. Lian, T.; Ma, T.; Cao, J.; Wu, Y. The effects of environmental regulation on the industrial location of China’s manufacturing. Nat. Hazards 2016, 80, 1381–1403. [Google Scholar] [CrossRef]
  77. Shapiro, J.S.; Walker, R. Why is pollution from US manufacturing declining? The roles of environmental regulation, productivity, and trade. Am. Econ. Rev. 2018, 108, 3814–3854. [Google Scholar] [CrossRef] [Green Version]
  78. Hu, S.; Liu, S. Do the coupling effects of environmental regulation and R&D subsidies work in the development of green innovation? Empirical evidence from China. Clean Technol. Environ. 2019, 21, 1739–1749. [Google Scholar] [CrossRef]
  79. Yang, F.; Cheng, Y.; Yao, X. Influencing factors of energy technical innovation in China: Evidence from fossil energy and renewable energy. J. Clean. Prod. 2019, 232, 57–66. [Google Scholar] [CrossRef]
  80. Wang, H.; Liu, H. Foreign direct investment, invironmental regulation, and environmental pollution: An empirical study based on threshold effects for different Chinese regions. Environ. Sci. Pollut. Res. 2019, 26, 5394–5409. [Google Scholar] [CrossRef]
  81. Zhang, H.; Wei, X.P. Green Paradox or Forced Emission Reduction: Dual effect of environmental regulation on carbon emissions. Chin. J. Popul. Resour. Environ. 2014, 24, 21–29. [Google Scholar]
  82. Schradin, C.; Drouard, F.; Lemonnier, G.; Askew, R.; Olivier, C.A.; Pillay, N. Geographic intra-specific variation in social organization is driven by population density. Behav. Ecol. Sociobiol. 2020, 74, 113. [Google Scholar] [CrossRef]
  83. Porcelli, F.; Vidoli, F. A Comprehensive model for the evaluation of standard expenditure needs and standard level of local services. Local Gov. Stud. 2020, 46, 734–762. [Google Scholar] [CrossRef]
  84. Qian, W.Q.; Cheng, X.Y.; Lu, G.Y.; Zhu, L.J.; Li, F. Fiscal decentralization, local competitions and sustainability of medical insurance funds: Evidence from China. Sustainability 2019, 11, 2437. [Google Scholar] [CrossRef] [Green Version]
  85. Nie, L.; Guo, Z.X.; Liu, X.L. Influence of land use structure and price on urban land use efficiency. Urban Issues 2019, 7, 30–36. [Google Scholar] [CrossRef]
  86. Qian, X.Y.; Wang, D.; Wang, J.; Chen, S. Resource curse, environmental regulation and transformation of coal-mining cities in China. Resour. Policy 2019, 61, 101447. [Google Scholar] [CrossRef]
  87. Li, H.J.; Long, R.Y.; Chen, H. Economic transition policies in Chinese resource-based cities: An overview of government efforts. Energy Pol. 2013, 55, 251–260. [Google Scholar] [CrossRef]
  88. Liu, L.J.; Jiang, J.Y.; Bian, J.C.; Liu, Y.Z.; Lin, G.H.; Yin, Y. Are environmental regulations holding back industrial growth? Evidence from China. J. Clean. Prod. 2021, 306, 127007. [Google Scholar] [CrossRef]
  89. Yu, C.; de Jong, M.; Cheng, B.D. Getting depleted resource-based cities back on their feet again—The example of Yichun in China. J. Clean. Prod. 2016, 134, 42–50. [Google Scholar] [CrossRef] [Green Version]
  90. Li, W.Q.; Sun, H.P.; Tran, D.K.; Taghizadeh, H.F. The impact of environmental regulation on technological innovation of resource-based industries. Sustainability 2020, 12, 6837. [Google Scholar] [CrossRef]
  91. Miao, C.L.; Fang, D.B.; Sun, L.Y.; Luo, Q.L.; Yu, Q. Driving effect of technology innovation on energy utilization efficiency in strategic emerging industries. J. Clean. Prod. 2018, 170, 1177–1184. [Google Scholar] [CrossRef]
  92. Wang, A.Q. Analysis on the Relation of Technological innovation, institutional change and industry innovation. Contemp. Econ. Res. 2005, 8, 31–34. [Google Scholar]
  93. Li, K.; Lin, B.Q. How to promote energy efficiency through technological progress in China? Energy 2018, 143, 812–821. [Google Scholar] [CrossRef]
  94. Fu, J.Y.; Geng, Y.Y. Public participation, regulatory compliance and green development in China based on provincial panel data. J. Clean. Prod. 2019, 230, 1344–1353. [Google Scholar] [CrossRef]
  95. Costa, J. Carrots or Sticks: Which policies matter the most in sustainable resource management? Resources 2021, 10, 12. [Google Scholar] [CrossRef]
Figure 1. The likelihood ratio function of the threshold estimation value in the single threshold model (RIS as the dependent variable and ER as the threshold variable in resource-based cities).
Sustainability 13 12512 g001
Figure 2. The likelihood ratio functions of the threshold estimation value in the single threshold model. (a) RIS as the dependent variable and TI as the threshold variable in resource-based cities; (b) RIS as the dependent variable and TI as the threshold variable in industry-oriented cities.
Sustainability 13 12512 g002
Figure 3. The likelihood ratio function of the threshold estimation value in the single threshold model (OIS as the dependent variable and ER as the threshold variable in comprehensive regional cities).
Sustainability 13 12512 g003
Figure 4. The likelihood ratio functions of the threshold estimation value in the single threshold model. (a) OIS as the dependent variable and ER as the threshold variable in resource-based cities; (b) OIS as the dependent variable and TI as the threshold variable in comprehensive regional cities; (c) OIS as the dependent variable and TI as the threshold variable in industry-oriented cities; (d) OIS as the dependent variable and TI as the threshold variable in industry-oriented cities.
Sustainability 13 12512 g004
Figure 5. Summary of the impacts of ER and TI on TIS in four functional cities. NEG represents negative effect; POS represents positive effect. ↑ indicates the effect strengthens with an increase in the level of the threshold variable. ↓ indicates the effect weakens with an increase in the level of the threshold variable. The straight lines indicate that the threshold effect and the threshold regression coefficient are significant; the dashed lines indicate that the threshold effect is significant, while the threshold regression coefficient is insignificant; the dotted lines indicate that neither is significant.
Sustainability 13 12512 g005
Table 1. Regression results between variables.
VariablesExplained Variable: lnRISExplained Variable: lnOIS
City ICity IICity IIICity IVCity ICity IICity IIICity IV
ModelFEFEFEFEREREFEFE
Intercept C13.0497−1.72014.8150−0.85540.37783.9346 ***4.9932 ***4.2569 ***
lnER−0.00880.2824 ***0.12380.1985 ***0.07640.1469 ***0.0899 ***0.0816 ***
lnTI−0.4637 ***−0.3793 ***−0.3668 ***−0.3220 ***0.1483 ***0.0757 ***0.0769 ***0.0519 ***
lnIL−0.41200.20970.07370.1793−0.1427 *−0.1487 ***−0.03270.0137
lnEDU−0.07860.0581−0.0773−0.17430.08300.3011 ***0.02250.0681
lnPD−2.15600.2728−0.8695−0.05190.1534−0.0979−0.2264−0.2568
lnFEL0.2588−0.4919 ***0.6096−0.18501.1822 ***0.2504 ***0.2770 ***0.4440 ***
LM test
(p values)
69.75 (0.0000)783.94 (0.0000)219.37 (0.0000)1413.86 (0.0000)123.85 (0.0000)666.69 (0.0000)527.78 (0.0000)1702.41 (0.0000)
Hausman test
(p values)
9.39 (0.2255)11.78 (0.1079)24.00 (0.0011)33.53 (0.0000)4.74 (0.6918)4.22 (0.7540)24.31 (0.0010)11.43 (0.1208)
Note: *** and * represent significance levels at 1% and 10%; Only the regression results of the final adopted model are presented in the table; City I, II, III, IV represent resource-based city, industry-oriented city, comprehensive regional city and other types of cities, respectively. The same below.
Table 2. Results of threshold effect test.
Dependent VariableThreshold VariableType of CityNumber of ThresholdF-Valuep-Value10% Critical Value5% Critical Value1% Critical Value
RISERISingle15.130.00908.591410.401514.9904
Double2.870.67807.07638.351111.4611
Triple3.600.61409.992012.164717.9686
IISingle7.420.23409.933512.537716.4491
Double7.810.14008.536110.413513.8035
Triple2.060.904010.673113.401721.1083
IIISingle6.720.26509.795212.049816.1735
Double22.790.00409.612612.277217.3093
Triple3.400.803032.579644.514471.1879
IVSingle3.880.695010.844412.706718.0046
Double3.210.67509.265210.959617.8906
Triple1.510.93007.69079.090712.3520
TIISingle40.030.006017.800723.474934.8751
Double11.520.193013.980117.101825.2613
Triple5.490.498012.832617.068926.0140
IISingle61.710.001027.829233.386747.6146
Double14.360.246020.271723.854035.5546
Triple10.010.516020.823925.016633.2640
IIISingle12.210.279019.236624.045335.3409
Double10.290.230015.031618.569725.4553
Triple6.850.366014.312119.902836.0568
IVSingle20.160.177024.706628.883442.2053
Double15.100.226024.709033.658652.7559
Triple11.940.515039.533748.130766.2757
OISERISingle5.970.21907.85899.285912.5147
Double−2.291.00009.035611.194117.0475
Triple2.010.79706.26977.56159.9365
IISingle14.090.116014.454216.220221.2922
Double8.350.298011.773513.831317.1880
Triple3.860.944019.938223.482129.9399
IIISingle11.790.02508.46019.982013.8596
Double1.610.95108.21069.775113.2893
Triple1.990.94509.658611.806317.2788
IVSingle4.750.865018.279822.033527.6451
Double5.580.586011.924413.968918.2083
Triple4.330.741016.150719.422224.9144
TIISingle23.550.020015.495219.302426.6315
Double8.140.303014.039117.908334.5277
Triple5.180.602014.747418.745829.3685
IISingle54.660.001019.575823.705430.4914
Double23.900.018016.517920.070426.0840
Triple10.950.871034.412238.794249.7323
IIISingle35.950.019024.447229.882239.3295
Double12.860.234018.467225.112340.8001
Triple5.170.729015.208919.586329.1890
IVSingle12.730.468025.523531.692348.4790
Double5.300.771021.466525.540832.1299
Triple4.530.704014.315417.289524.4365
Table 3. Threshold value estimation and threshold effect test results.
Dependent VariableThreshold VariableType of CityThreshold ValueCorresponding Value95% Confidence Interval
RISERI2.949719.10(2.8459, 2.9549)
RISTII0.50081.65(0.4637, 0.5068)
RISTIII2.12118.34(2.0056, 2.1353)
OISERIII4.114161.20(4.0395, 4.1352)
OISTII1.39384.03(1.1754, 1.4516)
OISTIII2.20729.09(2.1341, 2.2492)
OISTIII3.258126.00(3.0843, 3.3301)
OISTIIII4.602399.71(4.4599, 4.6496)
Table 4. Parameter estimation results of the panel threshold model, RIS as Dependent variable.
Threshold Variable: ERThreshold Variable: TIThreshold Variable: TI
City Type: ICity Type: ICity Type: II
VariableRegression Coefficientt-ValueVariableRegression Coefficientt-ValueVariableRegression Coefficientt-Value
lnIL−0.8993 **−3.17lnIL−0.4982−1.16lnIL0.05040.35
lnEDU−0.7044−1.57lnEDU−0.2410−0.81lnEDU−0.0650−0.33
lnPD−4.2112 **−3.39lnPD−2.9103 **−2.60lnPD0.77240.67
lnFEL−0.7707−1.58lnFEL0.13130.18lnFEL−0.7441 ***−2.98
lnER•I (lnER ≤ 2.9497)−0.7968 **−2.63lnER•I (lnTI ≤ 0.5008)0.17761.55lnER•I (lnTI ≤ 2.1211)0.11160.81
lnER•I (lnER > 2.9497)−0.4568 *−2.33lnER•I (lnTI > 0.5008)−0.1676−1.70lnER•I (lnTI > 2.1211)−0.0476−0.39
Note: ***, ** and * represent significance tests at the level 1%, 5% and 10%, respectively.
Table 5. Parameter estimation results of the panel threshold model, OIS as dependent variable and ER as threshold variable in comprehensive regional cities.
VariableRegression Coefficientt-Value
lnIL0.00160.01
lnEDU0.0067 **2.84
lnPD−0.0721−0.26
lnFEL−0.5270 ***4.30
lnER•I (lnER ≤ 4.1141)0.0802 **2.76
lnER•I (lnER > 4.1141)0.0982 ***3.73
Note: *** and ** represent significance tests at the level 1% and 5%.
Table 6. Parameter estimation results of the panel threshold model, OIS as Dependent variable and TI as threshold variable.
City Type: ICity Type: IICity Type: III
VariableRegression Coefficientt-ValueVariableRegression Coefficientt-ValueVariableRegression Coefficientt-Value
lnIL−0.0029−0.06lnIL−0.1264 ***−2.88lnIL−0.0026−0.02
lnEDU0.1621 *2.27lnEDU0.3946 ***6.49lnEDU0.0678 ***3.38
lnPD−0.2658−1.23lnPD−0.6853 ***−3.09lnPD−0.1525−0.58
lnFEL1.3373 ***8.06lnFEL0.2502 ***3.82lnFEL0.5173 ***4.05
lnER•I (lnTI ≤1.3938)0.0856 *2.02lnER•I (lnTI ≤2.2072)0.1425 ***4.41lnER•I (lnTI ≤ 4.6023)0.0971 ***3.57
lnER•I (lnTI >1.3938)0.1761 ***4.41lnER•I (2.2072 < lnTI ≤ 3.2581)0.1797 ***6.08lnER•I (lnTI > 4.6023)0.1380 ***5.30
---lnER•I(lnTI > 3.2581)0.2144 ***7.58---
Note: *** and * represent significance tests at the level 1% and 10%.
Publisher’s Note: MDPI stays neutral with regard to jurisdictional claims in published maps and institutional affiliations.

