Abstract
Habitat conservation banking is a policy instrument for conserving endangered species by providing financial incentives for the landowners in the United States. This policy instrument aims to protect habitat, but little or no thought has been given to its financial performance. A financial analysis of habitat conservation banks (HCB) informs policymakers and conservation biologists of the long-term success of this policy and the future of HCBs. This paper evaluates 26 habitat conservation banks (HCB) in California by calculating their Net Present Values (NPV). We do so by compiling the cost and revenue data for habitat conservation banks. The average annual cost of operating HCBs was $42.78/acre (median: $22.58/acre), and the average credit price or revenue from credit sale was $6014.72/acre (median: $553.65/acre). The average NPV for 26 HCBs was $4205.90/acre at a 4% rate of return, indicating an overall positive return from such an easement instrument. However, only 14 HCBs out of 26 produced a positive return. With the inclusion of land acquisition costs, three of eight HCBs performed financially well. On the brighter side, the number of HCBs has increased with time. But there is not enough evidence to ascertain financial certainty from their revenues. A right selection of space (land acquisition costs can make or break finances for HCB) and species could encourage landowners to establish HCBs. This could build confidence on those who may have been discouraged from lack of knowledge and fear of losing revenue due to regulatory compliance to conserve endangered species habitat in their land. The findings are helpful in identifying lands and prioritizing investments to generate conservation credits.
1. Introduction
Over the last 30 years, habitat conservation banks (HCBs) have been established as a market-based policy instrument that allows landowners to manage their land for endangered species habitat and generate conservation credits. U.S Fish and Wildlife Service (USFWS) defines HCB as “a parcel of land containing natural resource values that are conserved and managed in perpetuity, through a conservation easement held by an entity responsible for enforcing the terms of the easement, for specified listed species and used to offset impacts occurring elsewhere to the same resource values on non-bank lands” [1]. HCB provides mitigation alternatives to the developers required to comply with the Endangered Species Act 1973 (ESA) [2,3]. HCB maximizes incentives for the landowner, also called a ‘banker,’ by selling conservation credits to developers required to offset impacts on wildlife habitat elsewhere to comply with the ESA [4,5].
HCBs are permanently protected lands managed for endangered species and their habitat [1,2,3,4]. HCBs are similar to wetland mitigation banks but differ in terms of legislative instruments, policy frameworks, and agencies in charge of implementation [6]. In the HCB framework, landowners/bankers generate ‘credits’ that can then be sold to developers required by regulation to mitigate adverse impacts on listed species [2,4,6]. In the process, bankers take on all ecological, legal, and financial responsibilities. The banker provides mitigation and guarantees the protection of the endangered species habitat in perpetuity. The regulatory agencies approve the banks and monitor implementation. Since the establishment of the conservation banking program in 1995, the USFWS has approved 155 conservation banks (as of September 2018). The land area held by these banks is about 247,598 acres [7]. This is a modest amount of land area when compared to the overall habitat needs for listed species.
The first comprehensive analysis of HCBs using the data from 35 conservation banks in the U.S. by Fox and Nino-Murcia [4] concluded that conservation banking provides a partial solution to the development versus conservation conflict. Since then, several studies have drawn upon their theoretical frameworks for policy and institutional analysis and biodiversity offsets in assessing market-based policy instruments [6,8,9,10,11,12]. For example, Gamarra and Toombs [2] compared conservation biology principles to practice on 138 approved banks and concluded that HCBs had been well aligned with the 2003 USFWS National Guidance in terms of legal and administrative aspects, financial assurances, project durations, and monitoring and adaptive management. However, they noted that the banks are not fully aligned with the international biodiversity offset principles, such as using quality in credit calculation, addressing additionality, and accounting for landscape context [2,13,14].
A conservation credit calculation represents the ecological functions and/or services at a bank site and is often expressed as a measure of surface area (e.g., an acre), the number of individuals or mating pairs of a particular species, habitat function (e.g., habitat suitability index), or other appropriate metrics that can be consistently quantified [1]. Since different assessment methods are used to generate conservation credits, some scholars questioned the effective measure of biodiversity values gained and lost [15], and others called for a standardized exchange unit [16]. Even though scholars have varied on their assessment of methods and units to measure credits in practice, many regulators and bankers have accepted the use of acres for credit calculations. For example, Gamarra and Toombs [2] reported that 70% of the banks generate credits from the measure of surface area and 4% determine credits based on the number of individuals of the covered species.
Conservation credit prices are established by supply and demand, which depend on land value, availability of credits, the cost associated with credit production, the viability of alternative mitigation options, and level of economic activity [3]. Few studies have reported credit price variation across different species and regions. Fox and Nino-Murcia [4] found that most for-profit conservation banks were breaking even or making money and that the credit prices ranged from $3000 to $125,000 per acre across different species. Madsen et al. [17] reported a range of credit prices, with the lowest from $1500–$3000 for Golden-cheeked Warbler to the highest $150,000–$300,000 for Fairy Shrimp. Similarly, Poudel et al. [18] found that the Burke’s Goldfields, a rare and endangered species of flowering plant, had the highest credit price of $205,055. Additionally, Fairy Shrimp credits were sold for $200,000 to $300,000 per acre in California [19]. These numbers show the variation in conservation credit price by species across different regions.
About 67% of HCBs (out of 154 banks) had up to 150 transactions, only 4% had over 150 transactions, and 12% had no transaction [2]. More than 50% of the approved HCBs were in California. This is, at least, partially due to the high number of listed species, available policy instruments and awareness, and, as the most populous state, the relatively high levels of land development [19]. The variation in credit prices across the different endangered species and the underlying factors determining credit prices is not well studied. On the other hand, the landowner incurs costs to avoid or reduce externalities and gets incentives as revenues from habitat conservation credit sales. The banker faces a choice to invest their time, money, and other resources in HCB, a key measure to the ESA’s long-run success. Also, the cost of protecting threatened and endangered species is most likely to increase with the expanding list. The list grew from 114 in 1973 to 2414 (1466 animal and 948 plant species) in 2018 [20], and many other species are waiting to be added to this list [21] (17 species already proposed for listing as of 2018). This is particularly important because about 80% of listed endangered species rely on habitats located on private lands [22,23,24,25]. Landowners often avoid management activities that can potentially attract endangered species onto their lands and probably take actions to eliminate endangered species habitats [26,27,28,29].
As of the end of 2018, there were a total of 137 HCBs in the U.S. [18]. This includes 61 additional HCBs since 2005 [4]. Similarly, the land area under HCBs increased by almost 113,512 acres (288%), suggesting that the landowners, entrepreneurs, investors, and regulators have accepted this program with high interest [18]. While the recent literature shows an increasing number of HCBs [3] and a growing number for habitat conservation credit supply [18], no literature reports the financial performance. It is essential because the information on HCBs’ financial performance helps increase awareness, make informed investment decision in conservation efforts, and attract or change policies and programs to support market-based policy instruments. In addition, understanding the HCB’s financial performance is necessary to anticipate the economic effectiveness of Habitat Conservation Banking. To our knowledge, there is almost no information available on the financial performance of HCBs. This is primarily due to the fact that HCB is not yet widely deployed in industrial settings, resulting in a lack of economic data and market transactions data. Therefore, most of the existing studies rely on theoretical estimates based on economic specifications rather than empirical data. This paper aims to estimate HCBs’ financial performance by estimating net present values. We do so by compiling the cost and revenue data for HCBs in California.
2. Materials and Methods
2.1. Data
For this study, we developed three independent databases. First, we compiled bank establishment and operational costs from the conservation bank documents uploaded in the Regulatory In-Lieu Fee Banking Information System (RIBITS). Second, we compiled revenue information from survey response transaction records. Third, we matched the HCBs from the two datasets to generate a third spreadsheet, including revenues and costs for the HCBs in California. All conservation costs and revenues are adjusted for inflation and reported in the constant term (2020$). We also use bank codes instead of bank names due to non-disclosure agreements.
As of December 2016, RIBITS [7] reported 137 conservation banks with 2134 transaction records. These transaction records include available credits, credits sold, acres of land area, and HCB status. We also used the RIBITS database to obtain bank characteristics such as bank type, location, species and habitat type, total credit produced, and total credits sold. RIBITS includes over 29,000 credit ledger transactions and more than 8000 conservation bank-related files [29]. Each conservation bank name was treated as a unique observation. After compiling the list of HCBs, we reviewed all the documents uploaded by them to obtain an estimated average annual cost to generate those credits from the bank’s habitat management plans. It is important to note that the cost information reported in these HCB documents only includes the establishment (such as fencing, site preparation, treatments repeated periodically) and annual operational cost (such as labor cost, monitoring cost). Almost all HCBs had a habitat management plan document that includes expected or estimated cost information, particularly average annual costs based on the establishment and operational costs in their management plans. Using those estimated cost data, we were able to derive credit costs for 54 banks.
The RIBITS does not report revenues or the price of the credit sold. Hence, to obtain the credit price information, a survey was conducted in 2016. First, we were able to compile and identify 315 contacts (bankers) from four sources: USFWS, National Mitigation Banking Association (NMBA) [30], RIBITS, and Ecosystem Marketplace [17]. Since our objective was to obtain as many transaction records as possible, the survey questionnaire was not intended to capture the range of different variables and their associated distributions and characteristics, but was designed to obtain detailed transaction information or records. Second, we used mail, phone, and email to maximize survey responses. Also, several non-response follow-up attempts were made through emails and telephone. Then, the revenue data was estimated using transaction records by adding the sale price of credits sold. Out of a total of 315 mailed surveys, 15 (4% of total) returned as undeliverable, 29 returned (9.20% of total) without response, 37 responded via email (11.74% of total), and three individuals responded via phone (0.95% of total). Overall, the response rate for the survey was 21.90%. We were able to obtain 599 transaction records that included credit price information. These transaction records represented about 28% of the total transac-tion from 1995 to 2015. The relatively low response rate was due to the bankers being sen-sitive and reluctant to provide credit-pricing information. Since the habitat credit transac-tions are bilateral negotiations, most private banks were unwilling to disclose this propri-etary information. In addition, we also retrieved the credit price information by reviewing publicly available documents [7,30] and previous literature [2,3,4,5,6,15,16,17,18,19,22,23,24,25]. As a result, we were able to estimate credit price or revenue per acre for 43 banks. Finally, we matched the HCB between two databases to obtain the total cost and revenue (credit price) information for 26 HCBs in California.
The conservation bank documents (management plans) do not report the HCB’s land acquisition cost. To obtain the land acquisition cost, we used the Assessor’s Parcel Number (APN) in their management plan to match land parcels with the respective county tax office’s tax records. In addition, we used the recent land sale price and assessed land value as a proxy for the land acquisition cost for the HCB establishment. Out of 26 HCB, we were able to track the land acquisition value for eight banks.
2.2. Financial Analysis
Net Present Values (NPV) is the difference between the present value of all revenues generated through the sale of conservation credits and the present value of all credit costs associated with the production of these credits. NPV is a useful financial tool to measure the economic feasibility of HCBs and make crucial decisions on policy interventions. We estimate the NPVs per acre using Equation (1) where land acquisition costs, x = 0 for 26 banks with the available information on credit costs and prices.
where, R is the revenues per acre reported as total credit prices in the survey for an HCB, C is the average annual cost per acre reported on the management plan, r is the minimum acceptable rate of return (RoR), t is the average number of years between the first and the last sale of the credit, and x is the land acquisition costs per acre. We chose average sale time because of multiple credit transactions at different times. In general, average sale time is the time from credit production to the time of last reported credit sell. On average, it took about 2.9 years for HCB to sell all its credits. Land acquisition costs are the most important cost (probably the most limiting factor) in the financial success of HCBs. Therefore, we repeat the NPV calculation for eight banks (where data was available) using Equation (1).
Once the credit is sold, the banker enters into an easement contract, and the land is permanently protected for endangered species and their habitat. Therefore, we assume annual cost as a perpetual cash flow. We report credit produced and sold from the RIBITS database and survey, but we did not use this information in estimating NPV since the unit of credit was defined differently across different banks. Some HCBs defined a credit equivalent of an acre of land providing habitat, while another described it as the number of species protected. The RoR varied with the objective and nature of the HCBs. Public agencies like USFWS used an average RoR of 3.75% for such analysis. Studies on other ownership used a much higher RoR. For example, Donlan et al. [31] used an 8% RoR for the financial analysis of the gopher tortoise pre-listing conservation program, and Daniel [32] used a 7% RoR for the cost analysis of habitat restoration. It is common to set the RoR as high as 15% for long-term easement programs like HCBs to mitigate the associated risk and uncertainty due to poorly developed markets. Therefore, we calculate NPVs at 4%, 8%, 12%, and 15% to understand how these banks perform under risk and uncertainty.
3. Results
3.1. Descriptive Statistics
Table 1 shows the summary statistics of conservation credits, area of conservation banks, and credit prices for 26 conservation banks in California. These 26 HCBs provided 12 different types of habitats, held 19,120 acres to produce 30,173 conservation credits. The average annual cost was $42.78/acre (median: $23.58/acre). On average, an HCBs sold 349 credits (median: 115) and held 735 acres (median: 597 acres). The average price of conservation credit was $6014.72/acre (median: $553.65). Six banks reported producing Valley Elderberry Longhorn Beetle (VEB), five reported Giant Garter Snake (GGS), and two reported California Tiger Salamanders/Vernal Pool Habitat (CTS/VPH), Vernal Pool Habitat (VPH), Burke’s Goldfields (BGF), and Multiple Species (MSH), habitats, respectively. On average, the annual cost of producing Burrowing Owl (BOL) conservation credits was most expensive at $127.92/acre, followed by BGF conservation credits at $77.69/acre. The BGF conservation credits were sold at $39,398.32/acre, followed by CTS/VPH conservation credits at $8662.93/acre. The average years between the bank establish and final sale (as of 2015) was 2.9 years. Some of the banks sold some of their credits as far as 12 years from their establishments.

Table 1.
Summary statistics of conservation credits cost and revenues for habitat conservation banks in California.
3.2. Financial Analysis of Habitat Conservation Banks in California
Figure 1 presents the financial assessment of 26 HCBs in California. The present value (PV) of costs of operating a HCB in California was about $1069.59/acre (median: $564.47/acre) and the PV of revenues was $5275/acre (median: $516.43/acre) at 4% RoR (2020 constant $). Therefore, the average NPV at 4% is $4205.90/acre (median: $14.87/acre). Of 26 banks, 12 operated at a loss (negative NPV) based on credit sales until 2016. The NPVs at 4% RoR range from negative $2933.77 to $67,611.12 per acre (Figure 1). Bank 3 reported selling BGF credits at a price of over a million per credit (unknown what a single credit entails) and skewed the averages. The average drop down to $1669.69/acre (median: 5.99/acre) when we exclude Bank 3 as an outlier. Contrary to the normal understating of NPV calculations, with the increase of the RoR from 4% to 8%, only 7 HCBs exhibited loss (negative NPV). This kind of reverse NPV curve is observed when there are large cash flows (revenues in our analysis) at the early stages with smaller cashflows (annual costs) spread out through the project timeline [33,34]. In such a case, multiple internal rates of return can be observed [34,35]. Therefore, caution must be taken while comparing NPVs at different RoR for HCBs, and a decision must be made on RoR observing the markets before doing financial analysis. The use of the internal rate of return as a tool for decision-making will be misleading. With a further increase in RoR (12% and 15%), there was no further improvement in the number HCBs flipping to positive NPVs, but the trend followed.
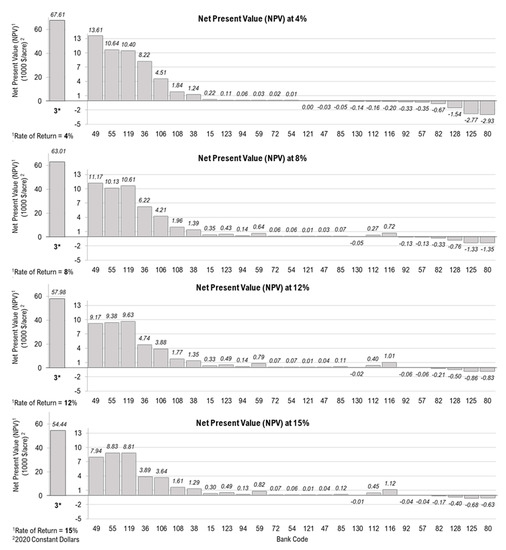
Figure 1.
Net Present Value of Habitat Conservation Banks of California.* Sale of a BGF credit was recorded for a price of over a million dollars.
3.3. Financial Analysis of HCBs including Land Acquisition Costs
The average credit produced and sold by eight banks, of which we were able to obtain land acquisition costs was 743 credits and 483 credits, respectively. The PV of costs of a conservation bank was $11,007.62/acre (median: $2783/acre), and the PV of revenues (credit price) was $4070.83/acre (median: $1790/acre) at 4% RoR. The average NPV at 4% RoR was negative $6936.79/acre (median: −$2025/acre) for these eight banks. Figure 2 shows the Net Present Values of the eight banks with and without land acquisition costs. The NPV slightly dropped with the introduction of land cost for all banks except Bank 119, where the impact was profound. This is attributed to the very high land cost (Table 1) in the Los Angeles region. At 4% RoR, the NPV values ranged between negative $41,045/acre to $8066/acre. Three HCBs making positive NPV (profit) had the lowest land acquisition costs.
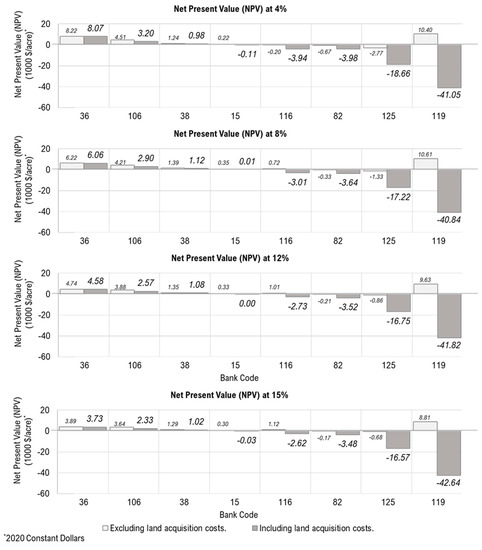
Figure 2.
Comparison of Net Present Values of Habitat Conservation with and without land acquisition costs.
4. Discussion
The economic feasibility of HCB depends on the area of land conserved, the number of credits produced, species available, and the cost and price of conservation credits [2,3,4,5,18]. Furthermore, the time of sale from the bank establishment could also impact the financial success of the conservation bank. Several time factors such as delayed credit release or failure, time-lags, the credit turnaround time for immediate demand, and regulatory agency’s bank approval, implementation, and monitoring process could change the financial performance of HCB. However, the average time to sell credits for HCBs on our study was not different between banks with positive and negative NPVs. The margin between the cost and selling price for the credits was random compared across the species. However, we cannot draw a conclusion for species-wise financial analysis in this study since there was not enough data on each species to capture variation in the conservation credit costs and prices. Also, geo-spatial, cross-sectional, and macroeconomic impacts must be accounted for to address the variation in cash flows with locations, species, habitat types, and ownerships. Poudel et al. [19] found that a banker’s interest in certain species lies in the profit opportunities based on credits production, rather than the price associated with wide-ranging species such as Florida panthers. The demand and the supply for the quantity of Florida Panthers credits are higher than other species, and that the price per credit is lower than other species.
The results show that HCBs generating positive NPV (profit) were producing a larger number of credits per bank and were also able to sell most of their credits. They also held larger acreages for the conservation effort. We could not establish a trend or relationship between time of sale and financial performance of HCBs in this study. Also, a higher price per credit (not acre) does not always provide positive returns or profit, but financial performance depends on the scale and location of the project and the landholdings. In conclusion, large-scale conservation banks of selected species can provide financial benefits.
On average, the NPV was positive, indicating a profitable industry. However, having half of the HCBs underperforming (even without including land cost) does not convey a positive message to landowners and could limit investment and interest in conservation efforts using market-based policy tools. However, these findings are remarkable given that HCBs were policy instruments designed to protect habitats providing financial incentives to landowners with less or no thought on economic returns. Also, with the increasing RoR, NPV increased for most HCBs exhibiting the possibility of multiple internal rates of returns [34], indicating uncertainty in their financial feasibility over time and an underdeveloped imperfect market for these habitat conservation credits. Large payments at the early stage of the project contributed to such counterintuitive performance. Consequently, this arrangement with minimal or no supervision (current situation) could lead to poor management and reduction of habitats. As expected, land acquisition costs impacted and reduced the profitability (or increased the loss). For most HCBs, including land acquisition costs in analysis lowered the NPV. However, the NPV was significantly dropped for bank 119 (nearby Los Angeles) with the introduction of land acquisition costs. Bank 119 performed exceptionally well when land acquisition costs were excluded, but it incurred an extreme loss when land costs were included. This indicates that buying land to establish HCBs is almost impossible in California, leading to market failures. This also revealed a significant impact on financial performance and uncertainty of HCB adoption in large cities or their proximity, undermining the intention of such policy instruments and its effectiveness in protecting habitats in wildland urban interfaces.
Excluding land values to evaluate the financial feasibility of an HCB may still be meaningful for publicly managed lands (without a necessity of land acquisition) and private lands that cannot be used for other resource production or already holding endangered species and seeking assistance in managing their habitat, usually mandated by law. The land acquisition to produce conservation credits is not a financially feasible strategy to date. However, HCBs can be a possible strategy to generate revenues from public or other lands that do not incur acquisition costs that can be crucial for the active management of the habitat. HCBs in coordination with recreation and other revenue-generating activities allowed while managing habitat can improve the financial feasibility. Also, as intended while formulating the conservation banking easement strategy, HCBs serve as an instrument to compensate landowners subjected to regulatory compliance to conserve endangered species in the lands, improving the acceptance of conservation-based management practices. Therefore, it is essential to reassess cost and regulatory compliances based on location to attract landowners and popularize HCBs. However, everything is not dismal. The positive story of the financial feasibility of half of the HCBs can serve as a model to other states and countries in adopting market-based policy instruments in biodiversity and habitat conservation.
Economic analysis has a considerable effect on planning, decision-making, and policy formulation, both in the public and private sectors. Our results showed that, on average, HCBs have positive cash flow, which indicates that the investment in HCB is not merely a conservation tool at a cost; instead, it can be a worthwhile investment that generates revenues along with ecological benefits and can help achieve habitat conservation policy goals. This study informs and makes the policymakers and other stakeholders aware of the financial performance of HCBs to help steer or re-evaluate new policy instruments with economics and markets in mind. For the long-term sustainability of HCBs and their inherent goal to protect sensitive habitats, these policies need to address the financial feasibility. They must include a provision to cover losses if they occur, especially when high land costs are involved. An ideal mechanism would be to pass the costs to the developers; however, this may compromise the marketability of the conservation credits. Therefore, a pricing mechanism for each HCB with a long-term financial feasibility assessment is a must while implementing these policies, outlining what should pass on to the developers and who bears the loss, if any. Suppose there is a significant market disadvantage due to very high costs. In that case, such policy instruments should consider alterative payments/incentives for the long-term success of these banks, hence the protection of habitats.
Several limitations should be worthwhile to note in the paper. The NPVs presented in this study do not entirely reflect the HCB market because of the limited sample size; results can only be considered a signal of economic feasibility in the HCB market. Also, HBCs are rather diverse in purpose of what species and/or ecosystems is worth of conservation. Species and ecosystem specific economic analysis would provide much focused insight into financial success for new HCBs [36]. A different suite of case-specific variables would likely produce different results, and hence, detailed case studies that monitor the costs and benefits of conservation banks over time are needed to determine the ecological efficiency and return on investment. Private sector investors, individual landowners, and ecological companies are making preliminary moves to invest in HCB projects in different states [18]. While our results provide valuable information for the potential investors in California, high up-front costs and the local economic condition can affect the investment decision. State and local economic conditions, significant knowledge, technology, and capacity deficits for a potential banker in other states, and scaling up from what is available and known is crucial. Since conservation credit markets are created and regulated by state policies, these results are very much dependent on state legislation and underlying payment mechanisms. Data limitations, such as continuous update of RIBITS database; lack of publicly available market transaction and credit price data; lack of HCBs cost data; inconsistent metrices and equivalency has been an issue in depth understanding of HCB market [2,18,37,38]. We do not recommend generalizing our findings in places with different regulations or approaches on incentivized conservation. However, we believe the concept and approach can be replicated anywhere to study the financial analysis of the conservation banking or incentive-based conservation approach.
5. Conclusions
This paper used the cost and the revenue data to examine the financial performance of 26 HCBs in California. The results have demonstrated that 14 conservation banks out of 26 in California generated positive financial returns with an average NPV of $4205.90/acre. Results show that under reasonable conditions and the assumption of no additional cost, investing in HCB provides an economic benefit. Our study reinforced the idea that enrolling larger landholdings, especially the public forests, could be a financially feasible HCB. However, investments with land acquisition to establish HCBs seem far-fetched at the moment. Finally, some benefits of conservation banks are public goods that flow to beneficiaries whether they contribute directly to conservation efforts. Investigating the societal benefits could be a future research perspective. The findings presented in this study may be extended in several ways, such as the change in cost structure and price between periods while considering the carrying capacity of conservation banks and inventory planning.
Author Contributions
Conceptualization, J.P.; methodology, J.P. and R.P.; software, J.P. and R.P.; validation, J.P. and R.P.; formal analysis, J.P. and R.P.; investigation, J.P. and R.P.; resources, J.P. and R.P.; data curation, J.P.; writing—original draft preparation, J.P. and R.P.; writing—review and editing, J.P. and R.P.; visualization J.P. and R.P.; supervision, J.P. and R.P.; project administration, J.P. and R.P.; funding acquisition, None. All authors have read and agreed to the published version of the manuscript.
Funding
This research received no external funding.
Institutional Review Board Statement
Not applicable.
Informed Consent Statement
Not applicable.
Data Availability Statement
Data used in this study are available in the Regulatory In-lieu Fee and Bank Information Tracking System (RIBITS) [7], agency reports, and previous literature. Poudel, J. compiled the credit sales data from the survey, and a detailed dataset (identification of conservation bank names) cannot be shared due to the non-disclosure agreement.
Acknowledgments
The authors would like to acknowledge National Mitigation and Ecosystem Banking Association members who provided some data used in this study.
Conflicts of Interest
The authors declare no conflict of interest.
References
- United States Department of Interior Fish and Wildlife Service (USFS). Guidance for the Establishment, Use and Operation of Conservation Banks; Fish and Wildlife Service, Interior: Washington, DC, USA, 2003; p. 19. Available online: https://www.fws.gov/endangered/esa-library/pdf/conservation_banking_guidance.pdf (accessed on 12 October 2018).
- Gamarra, M.J.C.; Toombs, T.P. Thirty years of species conservation banking in the U.S.: Comparing policy to practice. Biol. Conserv. 2017, 214, 6–12. [Google Scholar] [CrossRef]
- Poudel, J.; Zhang, D.; Simon, B. Estimating the demand and supply of conservation banking markets in the United States. Land Use Policy 2018, 79, 320–325. [Google Scholar] [CrossRef]
- Fox, J.; Nino-Murcia, A. Status of Species Conservation Banking in the United States. Conserv. Biol. 2005, 19, 996–1007. [Google Scholar] [CrossRef]
- Sonter, L.J.; Barnes, M.; Matthews, J.W.; Maron, M. Quantifying habitat losses and gains made by U.S. Species Conservation Banks to improve compensation policies and avoid perverse outcomes. Conserv. Lett. 2019, 12, e12629. [Google Scholar] [CrossRef] [Green Version]
- Boisvert, V. Conservation banking mechanisms and the economization of nature: An institutional analysis. Ecosyst. Serv. 2015, 15, 134–142. [Google Scholar] [CrossRef] [Green Version]
- Regulatory In-Lieu Fee Banking Information System (RIBITS), Banks & Sites. Available online: https://ribits.ops.usace.army.mil/ords/f?p=107:158:15210655867020::NO::P158_CANNED_ID:CLEAR (accessed on 12 October 2018).
- Ferraro, P.J.; McIntosh, C.; Ospina, M. The effectiveness of the US endangered species act: An econometric analysis using matching methods. J. Environ. Econ. Manag. 2007, 54, 245–261. [Google Scholar] [CrossRef]
- Wätzold, F.; Lienhoop, N.; Drechsler, M.; Settele, J. Estimating optimal conservation in the context of agri-environmental schemes. Ecol. Econ. 2008, 68, 295–305. [Google Scholar] [CrossRef]
- Vatn, A. Markets in environmental governance. From theory to practice. Ecol. Econ. 2015, 117, 225–233. [Google Scholar] [CrossRef]
- Vaissière, A.C.; Levrel, H.; Scemama, P. Biodiversity offsetting: Clearing up misunderstandings between conservation and economics to take further action. Biol. Conserv. 2017, 206, 258–262. [Google Scholar] [CrossRef] [Green Version]
- Galik, C.S.; McAdams, D. Supply, demand, and uncertainty: Implications for prelisting conservation policy. Ecol. Econ. 2007, 137, 91–98. [Google Scholar] [CrossRef]
- Business and Biodiversity Offsets Program (BBOP). BBOP Principles on Biodiversity Offsets; Business and Biodiversity Offsets Program (BBOP): Washington, DC, USA, 2016; Available online: http://bbop.forest-trends.org/documents/files/bbop_principles.pdf (accessed on 12 October 2018).
- Business and Biodiversity Offsets Program (BBOP). Biodiversity Offsets: A User’s Guide; Business and Biodiversity Offsets Program (BBOP): Washington, DC, USA, 2016; Available online: https://www.cbd.int/financial/doc/wb-offsetguide2016.pdf (accessed on 12 October 2018).
- Santos, R.; Schroeter-Schlaack, C.; Antunes, P.; Ring, I.; Clemente, P. Reviewing the role of habitat banking and tradable development rights in the conservation policy mix. Environ. Conserv. 2015, 42, 294–305. [Google Scholar] [CrossRef]
- Wissel, S.; Wätzold, F. A conceptual analysis of the application of tradable permits to biodiversity conservation. Conserv. Biol. 2010, 24, 404–411. [Google Scholar] [CrossRef]
- Madsen, B.; Carroll, N.; Moore, B.K. State of Biodiversity Markets Report: Offset and Compensation Programs Worldwide. 2010. Available online: https://www.ecosystemmarketplace.com/wp-content/uploads/2015/09/sbdmr.pdf (accessed on 12 October 2018).
- Poudel, J.; Zhang, D.; Simon, B. Habitat conservation banking trends in the United States. Biodivers. Conserv. 2019, 28, 1629–1646. [Google Scholar] [CrossRef]
- Rea, C.M. Theorizing command-and-commodify regulation: The case of species habitat conservation banking in the United States. Theory Soc. 2017, 46, 21–56. [Google Scholar] [CrossRef]
- U.S. Fish and Wildlife Service. ECOS Environmental Conservation Online System. Available online: https://ecos.fws.gov/ecp/species-reports (accessed on 12 October 2018).
- U.S. Fish and Wildlife Service. Species Proposed for Listing. Available online: https://ecos.fws.gov/ecp0/reports/ad-hoc-species-report?status=P&header=Species+Proposed+for+Listing&fleadreg=on&fstatus=on&finvpop=on (accessed on 12 October 2018).
- Brown, G.M.; Shogren, J.F. Economics of the endangered species act. J. Econ. Perspect. 1998, 12, 3–20. [Google Scholar] [CrossRef] [Green Version]
- Innes, R.; Polasky, S.; Tschirhart, J. Takings, Compensation, and Endangered Species Protection on Private Land. J. Econ. Perspect. 1998, 12, 35–52. [Google Scholar] [CrossRef] [Green Version]
- Evans, D.J.; Che-Castaldo, J.P.; Crouse, D.; Davis, F.W.; Epanchin-Niell, R.; Flather, C.H.; Frohlich, R.K.; Goble, D.D.; Li, Y.; Male, T.D.; et al. Species Recovery in the United States: Increasing the Effectiveness of the Endangered Species Act; Issues in Ecology Report Number 20; Ecological Society of America: Washington, DC, USA, 2016; Available online: https://pearl.plymouth.ac.uk/bitstream/handle/10026.1/10108/IssuesInEcology20%20SpRecoveryInESA%202016.pdf?sequence=1&isAllowed=y (accessed on 12 October 2018).
- Boyd, J.; Epanchin-Niell, R.S. Private Sector Conservation Investments under the Endangered Species Act: A Guide to Return on Investment Analysis. Resources for the Future RFF DP 17-11. 2017, p. 39. Available online: https://media.rff.org/documents/RFF-DP-17-11.pdf (accessed on 12 October 2018).
- Lueck, D.; Michael, J. Preemptive habitat destruction under the Endangered Species Act. J. Law Econ. 2003, 46, 27–60. [Google Scholar] [CrossRef]
- Zhang, D. Endangered Species and Timber Harvesting: The Case of Red-Cockaded Woodpeckers. Econ. Inq. 2004, 42, 150–165. [Google Scholar] [CrossRef]
- Byl, J.P. Perverse incentives and safe harbors in the Endangered Species Act: Evidence from timber harvests near woodpeckers. Ecol. Econ. 2019, 157, 100–108. [Google Scholar] [CrossRef]
- Martin, S.; Brumbaugh, R. Entering a New Era: What Will RIBITS Tell Us About Mitigation Banking? Natl. Wetl. Newsl. 2011, 33, 16–26. [Google Scholar]
- National Mitigation Banking Association (NMBA). The Trusted Voice of the Mitigation Banking Industry. Available online: https://environmentalbanking.org/ (accessed on 12 October 2018).
- Donlan, C.J. Proactive Strategies for Protecting Species: Pre-Listing Conservation and the Endangered Species Act, 1st ed.; Univ of California Press: Oakland, CA, USA, 2015; p. 288. [Google Scholar]
- Daniel, H. The Role of Economics in Habitat Restoration. In Proceedings of the Salmon Habitat Restoration Cost Workshop; Pacific States Marine Fisheries Commission: Gladstone, OR, USA, 2000. [Google Scholar]
- Perman, R. Economic Appraisal 5: Performance Measures, Introduction to Topic 5: Project Performance Indicators and Decision Criteria. Available online: http://personal.strath.ac.uk/r.perman/Economic Appraisal 5.pdf (accessed on 18 August 2021).
- Wagner, J.E. Misinterpreting the internal rate of return in sustainable forest management planning and economic analysis. J. Sustain. For. 2012, 31, 239–266. [Google Scholar] [CrossRef]
- Klemperer, W.D. Forest Resource Economics and Finance, 1st ed.; McGraw-Hill Inc.: Blacksburg, VA, USA, 1996. [Google Scholar]
- Grimm, M.; Köppel, J. Biodiversity offset program design and implementation. Sustainability 2019, 11, 6903. [Google Scholar] [CrossRef] [Green Version]
- Grimm, M. Metrics and equivalence in conservation banking. Land 2021, 10, 565. [Google Scholar] [CrossRef]
- Grimm, M. Conserving biodiversity through offsets? Findings from an empirical study on conservation banking. J. Nat. Conserv. 2020, 57, 125871. [Google Scholar] [CrossRef]
Publisher’s Note: MDPI stays neutral with regard to jurisdictional claims in published maps and institutional affiliations. |
© 2021 by the authors. Licensee MDPI, Basel, Switzerland. This article is an open access article distributed under the terms and conditions of the Creative Commons Attribution (CC BY) license (https://creativecommons.org/licenses/by/4.0/).