Abstract
This paper proposes a simple and easy-to-use methodology for forecasting the impact of changes in influent chemical oxygen demand (COD) and in the emission limit values (ELVs) of COD and total nitrogen on average energy requirements for aeration and sludge production by activated sludge wastewater treatment plants (WWTPs). The methodology is based on mass balances of sludge production and oxygen requirements for carbonaceous material biodegradation and/or nitrification, oxygen transfer and aeration equipment efficiency. Using average values of historical data of regular monitoring (water quality and operating conditions) WWTP-specific equations of oxygen requirements, energy consumption and sludge production are derived as a function of influent COD and influent N-total, which may be used to quantify the impact of influent and ELV changes. The methodology was tested in five extended aeration WWTPs for three scenarios established by the utility. The results show that increasing influent COD, from 900 to 1300 mg/L, for example, significantly increases the energy consumption by 49% and sludge production by 53%. For influent 54–68 mg/L N-total, imposing 15 mgN/L ELV results in a 9–26% increase in energy consumption. The COD ELV change studied (season-specific, from 150 mg/L 12 months/year to 125 mg/L 8 months/year to 100 mg/L 4 months/year) increases the energy consumption by 1.8–2.6% and the sludge production by 4.3–5.4%.
1. Introduction
The study of water resources and water pollution control has a long tradition. The Water Framework Directive (WFD), Directive 2000/60/EC [1], has led to the reduction of Biochemical Oxygen Demand (BOD), Chemical Oxygen Demand (COD), nitrates (N) and phosphorus (P) in surface water and coastal waters. The results from the JRC’s modelling show that BOD, N and P loads in treated wastewater have decreased by 61%, 32% and 44%, respectively, since the adoption of the Urban Waste Water Treatment Directive (UWWTD) [2]. While for some (coliforms, certain chemicals and, to a large extent, BOD) this has been decisive in the improvement of the condition of the water bodies (including bathing waters), for BOD and nutrients the effect on water bodies is less apparent due to the importance of other sources of pollution [3].
While the UWWTD does not call for specific action on energy efficiency of wastewater collection or treatment activity, common economic sense has led operators of wastewater treatment plants (WWTPs) to invest in research and development and to upgrade some plants towards more energy efficient treatment processes [2].
Actually, urban water systems need the supply of relevant amounts of energy for their operation, often corresponding to the second-largest-cost parcel of activated sludge WWTPs after human resources [4,5]. In the future, more stringent emission regulations on nutrients to mitigate the eutrophication risk in sensitive areas or contaminants of emerging concern may further increase these requirements [6]. In addition, the increase of the influent wastewater concentrations, e.g., due to industrial connections to the urban system, has an impact on energy consumption.
Many authors have been studying the key factors influencing energy consumption [7,8,9,10] and the impact of operating conditions [11]. Others indicate the impact of more stringent emission limit values (ELV) for treated water or the removal of other parameters of concern [6]. However, the impact of discharge permit regulation changes on energy consumption and sludge production is usually not quantified.
Energy consumption for nitrogen or organic matter (BOD5, COD) reduction in activated sludge WWTPs mainly occurs in aeration, and this corresponds to the main use of energy [4]. The energy requirements for aeration are a function of influent BOD5 and ammonia, biomass wasted and oxygen transfer, the latter varying with the aerator type (N0) or diffuser type (SOTE) as well as with compressor efficiency, temperature, dissolved oxygen, altitude, oxygen transfer correction factor for process water versus clean water (α) and, in case of diffuser systems, the fouling factor (F) and the outlet pressure [12].
Sophisticated tools have been developed in recent years for tackling energy consumption. For example, Li et al. [13] used the radial basis function neural network to forecast energy consumption, while Yu et al. [14] modelled the energy consumption based on Bayesian semi-parametric quantile regression.
The activated sludge models (ASM) implemented in biokinetic simulation tools are powerful tools for the optimization and rehabilitation of existing plants and for the design of new facilities [15,16]. They allow characterization of the real dynamics of the WWTP in reaction to a change in influent characteristics, but their use calls for specific skills (to choose the right ASM and run it) and data for model calibration (not included in regular monitoring programs, e.g., fractions of BOD5, COD) [16,17]. Instead, simple mass balances of sludge production and oxygen requirements for carbonaceous material biodegradation and/or nitrification, oxygen transfer and aeration equipment efficiency allow for computing the (static) energy requirements of a given wastewater under a given set of operating conditions.
Although the sludge produced by an activated sludge WWTP represents only 1–2% of the treated wastewater volume, its management is highly complex and, together with the energy and flocculant consumption in the sludge processing units [18], has a cost usually ranging from 20% to 60% of the total operating costs of wastewater treatment [19].
This paper aims to propose a simple and easy-to-use methodology for forecasting the impact of changes in influent wastewater strength and emission limits on average values of energy consumption and sludge production by activated sludge WWTPs. The work was trigged by a wastewater utility request for a practical methodology (that is not time consuming and involves no special analytical data nor computational skills) for quantifying the impact of these changes on their annual costs and to support future decisions with respect to industrial connections to the urban system or ELV changes.
The methodology was developed based on mass balances and the average values of historical data of regular monitoring (water quality and operating conditions). It was used in five WWTPs to quantify the changes resulting from the practical scenarios posed by the utility, namely an influent COD increase due to industrial inflows and past changes on discharge consents, i.e., COD ELV decrease (season specific, to protect the water body condition) and imposition of ELV for total nitrogen.
2. Methodology
2.1. Scenarios of Changes in Influent Wastewater Strength and in Discharge Permit Regulation
As requested by the wastewater utility, the impact on average energy consumption and sludge production in the following three scenarios was studied:
- (a)
- Increase of COD influent concentration to isolate the impact of current and future industrial connections to the drainage system;
- (b)
- Decrease of COD ELV from 150 mg/L year round to 100 mg/L during the 4-month summer period (the dry and hot season) and 125 mg/L during the remaining 8 months a year, to isolate the impact of such past change;
- (c)
- Imposition of ELV of 15 mg/L N-total, to isolate the impact of such past change.
2.2. Equations of Oxygen and Energy Consumption and Sludge Production
The impact on energy consumption of the three scenarios described mainly occurs in aeration [4]. Thus, energy consumption for aeration (EV O2) was calculated based on the oxygen requirements for the biodegradation of carbonaceous material and on the oxygen transferred under field conditions (N); when nitrification is to take place, the oxygen requirements include the oxygen required for oxidising ammonia and nitrite to nitrate [20]. Using the equation derived by Silva and Rosa [12], the oxygen requirements per treated volume were computed as:
- -
- for carbonaceous material biodegradation,
R0 (g O2/m3) = 1.6 BOD5 − 1.42 (Xθ/(24 θc) − nbVSS)
- -
- for carbon and nitrogen removal,
R0 (g O2/m3) = 1.6 BOD5 + 1.71 (Ntin − NH4out) + 2.86 NO3out − 1.625 (Xθ/(24 θc) − nbVSS)
- R0 = total oxygen required (g O2/m3)
- BOD5 = influent BOD5 − effluent BOD5 (g/m3 or mg O2/L, as usually reported)
Xθ/(24 θc) = PX, VSS/Q
- X = mixed-liquor volatile suspended solids (VSS) (mg/L)
- θ = detention time in aeration tank (h)
- θc = solids retention time (d)
- PX,VSS = net waste activated sludge produced (g VSS/d)
- Q = flowrate (m3/d)
- nbVSS = nonbiodegradable VSS in influent (mg/L)
- Ntin = influent N concentration (mg N/L)
- NH4out = effluent ammonia concentration (mg N/L)
- NO3out = effluent nitrate concentration (mg N/L)
Dividing the oxygen requirements by the oxygen transferred under field conditions (N, g O2/Wh or kg O2/kWh, as usually reported) allows for computing the energy requirements per treated volume, EV O2, as:
EV O2 (Wh/m3) = R0/N
For mechanical aerators, N is given by:
where,
- Nm = oxygen transferred under field conditions by mechanical aerators (kg O2/kWh)
- N0 = oxygen transferred to water at 20 °C and zero dissolved oxygen (kg O2/kWh), depending on the type of mechanical aerator
- β = salinity-surface tension correction factor (typically 0.95 to 0.98)
- Cwalt = oxygen saturation concentration in water (mg/L) = CsFa
- Cs = oxygen saturation concentration at sea level (mg/L) = 14.1327 × 0.97909 T
- T = temperature (°C)
- Fa = oxygen solubility correction factor for altitude = 1–0.0001 h
- h = altitude (m)
- Cs, 20 = Cs at 20 °C = 9.08 mg/L
- CL = operating oxygen concentration (mg/L)
- α = relative oxygen transfer rate in process water versus clean water
For diffuser systems, N is further based on blower power requirements, and the equation derived by Silva and Rosa [12] is:
where,
- Nd = oxygen transferred under field conditions by diffuser systems (kg O2/kWh)
- e = compressor efficiency (typical range 0.7 to 0.9)
- F = Fouling factor (typically 0.65 to 0.9)
- SOTE = standard oxygen transfer efficiency (-)
- P1, P2 = absolute inlet and outlet pressure (kPa)
The net waste activated sludge produced in the biological treatment per treated volume is estimated using Px,VSS/Q (Equation (3), sludge wasting in g VSS/m3).
The estimated percentage increase in sludge wasting was assumed equal to the WWTP sludge production increase, since no changes in sludge processing are expected.
2.3. WWTPs Studied
The WWTPs studied are operated by TRATAVE and were designed for average flows of 15,120 m3/d to 44,336 m3/d, corresponding to 126,000 and 357,740 population equivalents, respectively (Table 1). The plants have been operated under the conditions summarized in Table 2, where 5-year (2015–2019) averages are presented. As expressed by the high values of θ and θc as well as the low values of F/M in Table 2, the biological treatment in all WWTPs is extended aeration activated sludge to cope with the high-strength industrial input (Section 3.1) and (except in Agra I and II) to allow for nitrogen removal. Agra I, Serzedelo I and Rabada WWTPs have conventional plug-flow reactors with turbines while Agra II and Serzedelo II WWTPs have pre-anoxic selectors and oxidation ditches with fine-bubble air diffuser systems.

Table 1.
Design parameters of the five WWTPs studied.
Table 2.
Operating conditions of the five WWTPs studied (5-year averages).
According to the water utility, in 2018 the energy consumption for aeration in these WWTPs was 48% of total energy consumption in Agra (I + II), 55% in Rabada, 60% in Serzedelo I and 61% in Serzedelo II; the energy for recirculation represented 2–3% of total energy consumption (these plants do not include internal recirculation) and for sludge wasting around 0.5%.
3. Results and Discussion
After characterizing the influent wastewater of the five extended aeration WWTPs studied (Section 3.1), the assumptions needed for computing (for each scenario) the oxygen and energy requirements as well as sludge wasting in each WWTP were comprehensively presented (Section 3.2); the calculations were then conducted based on 5-year data and the impact of each change was ultimately quantified as a percentage of the baseline situation (Section 3.3). The scenarios studied the impact of an influent COD increase due to industrial inflows (Section 3.3.1) and of two past changes on discharge consents, namely the COD ELV decrease (Section 3.3.2) and the imposition of N-total (Section 3.3.3).
3.1. Raw Wastewater Characterization
The WWTPs studied have domestic, industrial (in particular, textile effluents) and rainwater inflows. The raw wastewater of each WWTP was characterized quantitatively by flowrates and qualitatively by influent concentrations.
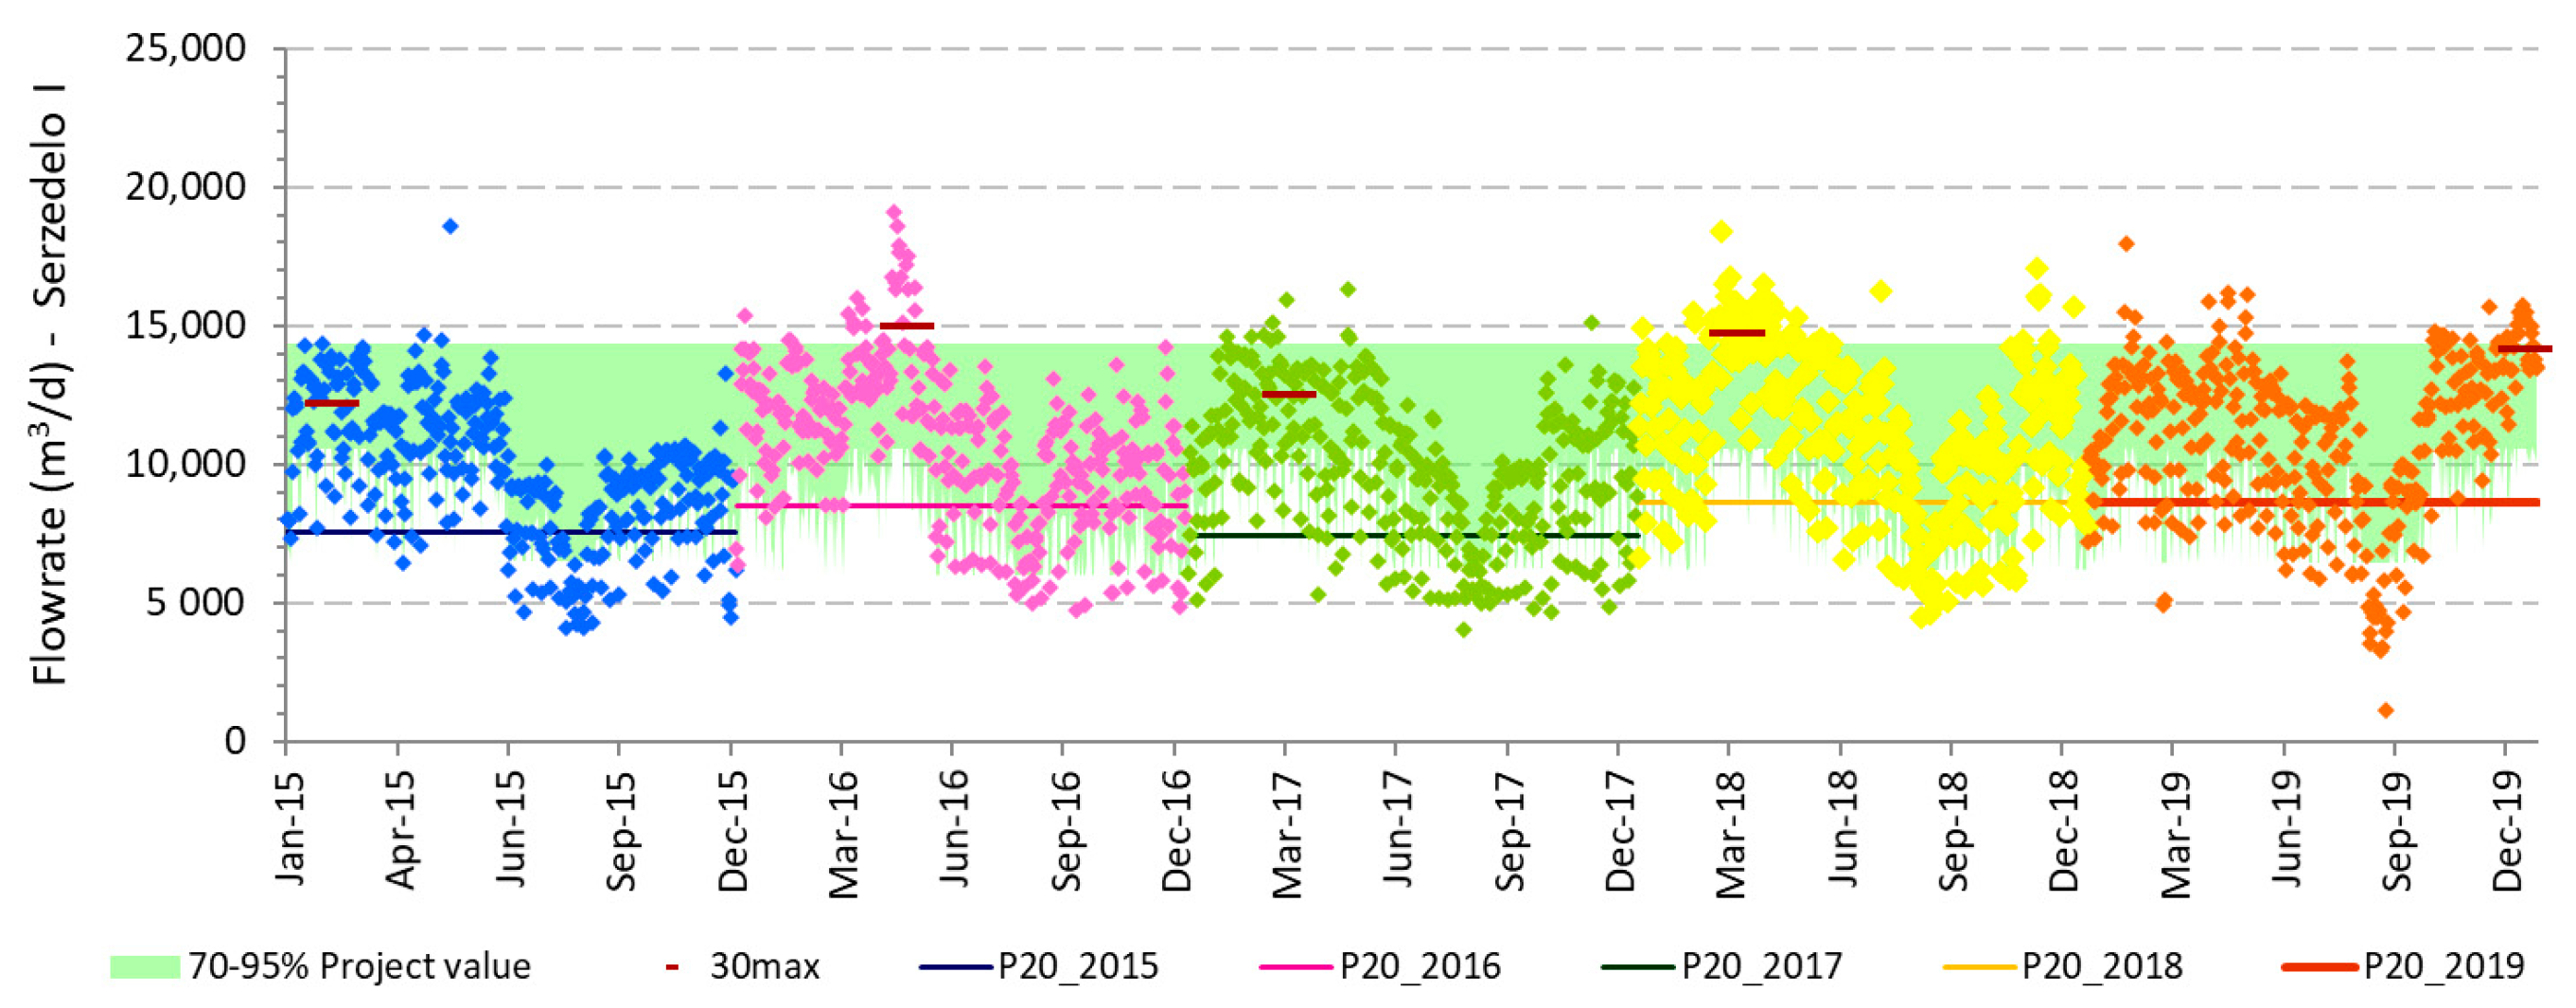
The average daily flowrates of the 2015–2019 period (illustrated in Figure 1 for Serzedelo I) have a strong seasonal fluctuation, registering minimums in August (usually a dry month and when industries close for summer holidays). All WWTPs work in some periods (Serzedelo I and Lordelo) or frequently (Serzedelo II, Agra and Rabada) above 95% of the project values, in hydraulic overutilization. They also have a large fluctuation between weekdays and weekend days.
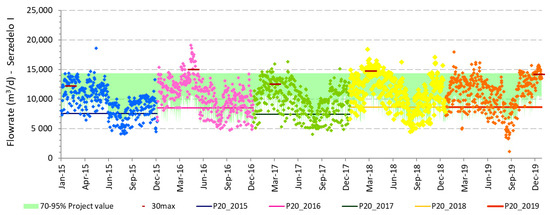
Figure 1.
Daily average flowrate influent to Serzedelo I WWTP in 2015–2019.
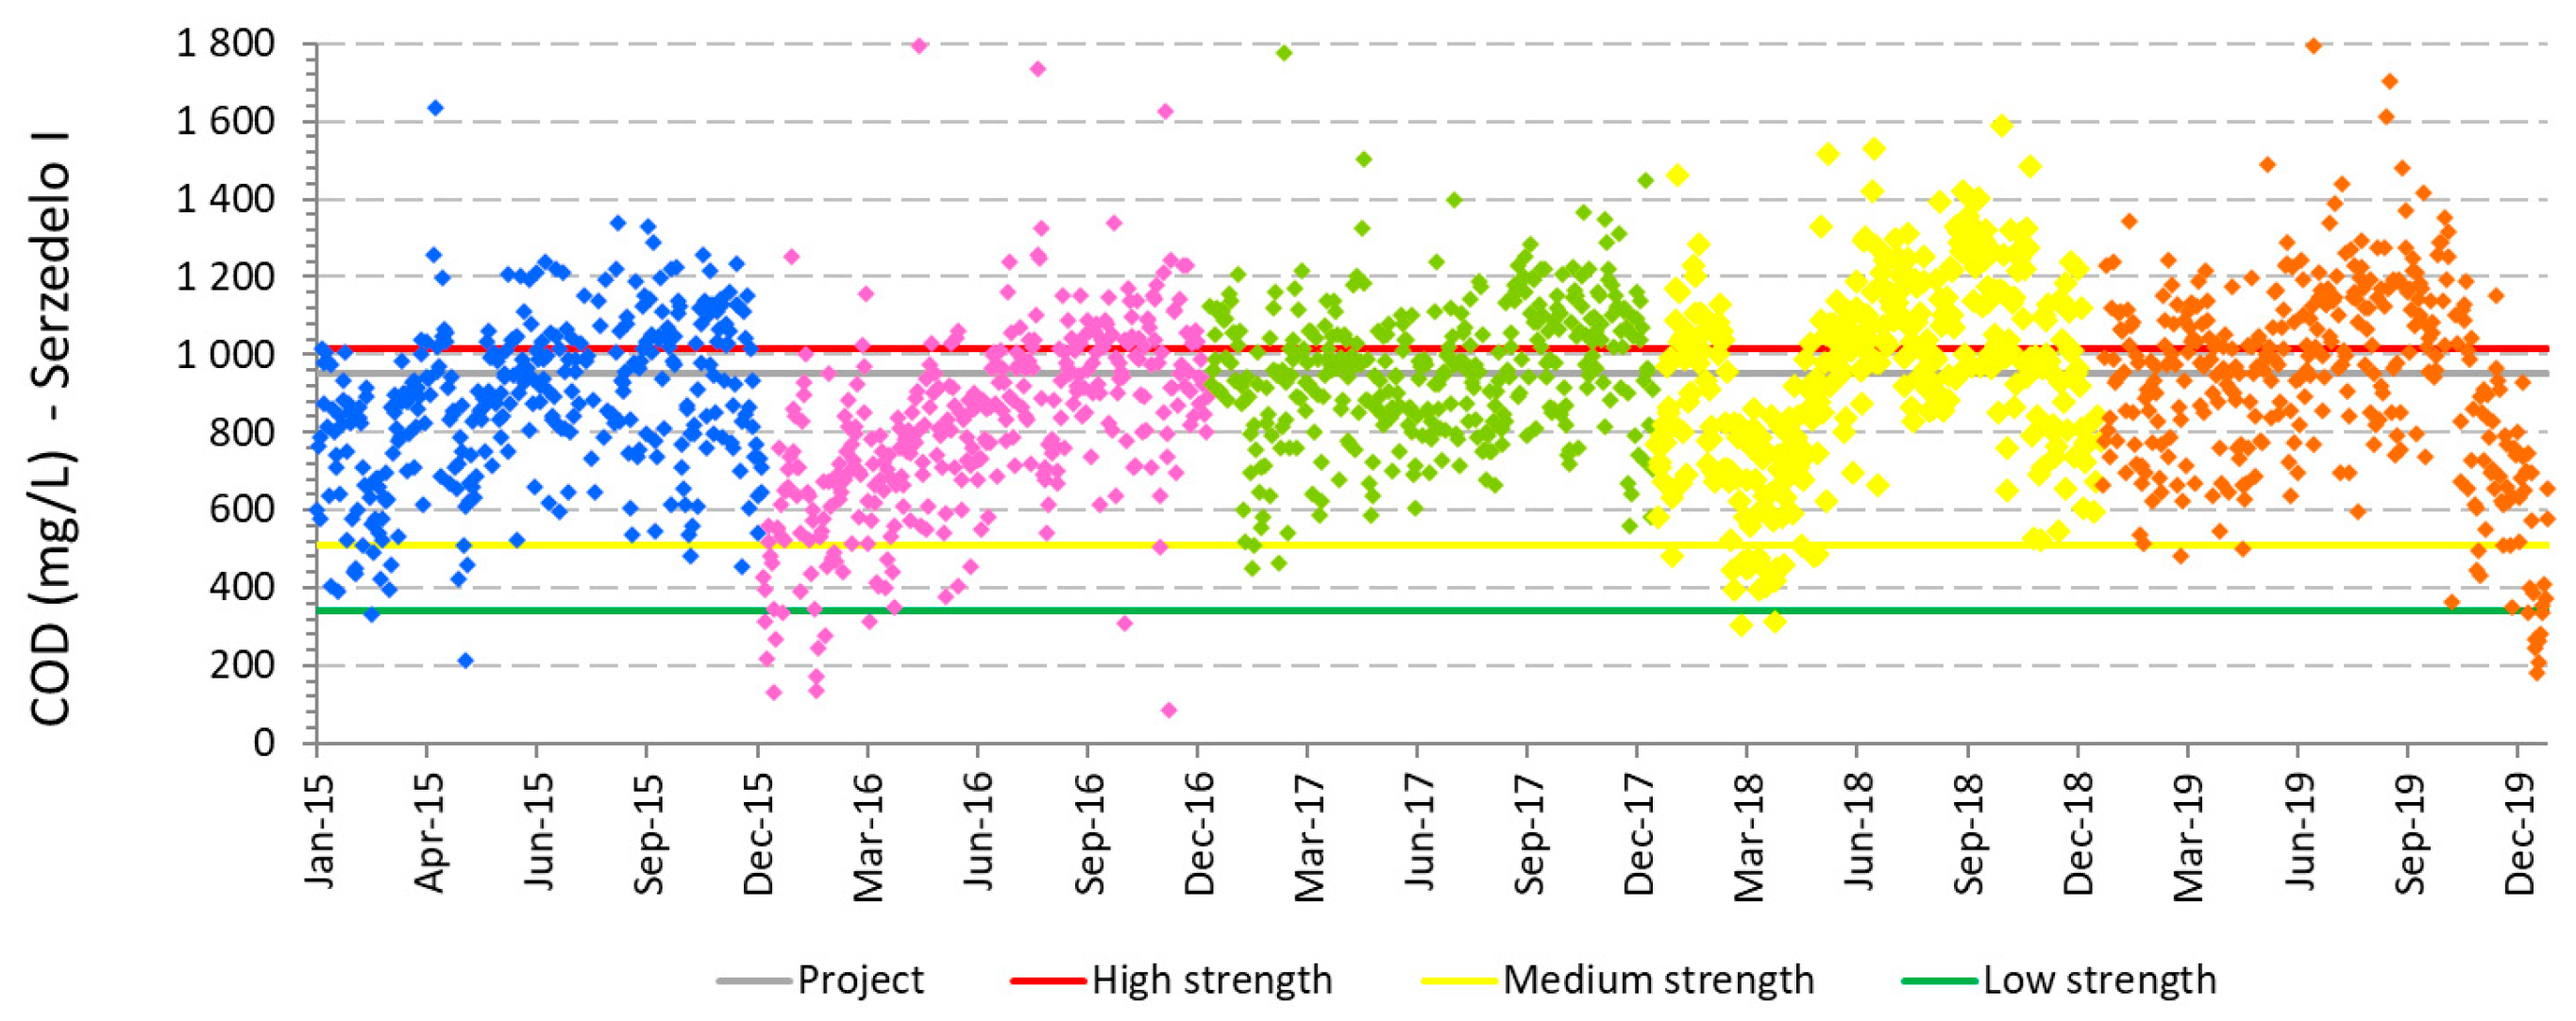
The concentrations in 2015–2019 of the parameters BOD5, COD, TSS, total nitrogen (total N) and total phosphorus (total P) were compared with the design values and with the typical values for untreated domestic wastewater produced in the U.S. [20]. Regarding BOD5, the results show that the influent concentrations ranged from medium to high strength, were higher than the design value and had strong seasonality. Regarding COD (Figure 2 for Serzedelo I) and TSS, the influent concentration varied every year (in 2015–2019) from low to high strength and exceeded the design value. The influent N concentration was often high strength, and the influent P concentration ranged from low to high.
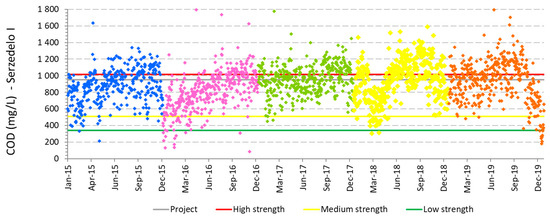
Figure 2.
COD concentrations influent to Serzedelo I WWTP in 2015–2019.
3.2. Assumptions Considered for Each Scenario
The scenarios analysed involved the assumptions summarized in Table 3.
Table 3.
Equations and assumptions considered for each scenario.
Briefly, since the long-term average impact on energy consumption and sludge production was to be studied, multi-annual average values of key parameters were considered whenever adequate. Therefore, for all scenarios, the 5-year average values for θ, θc, F/M and BOD5/COD ratio were assumed for each WWTP. The water utility practice for reliable and stable WWTP operation is to keep θ and θc constant and high, and F/M constant and low to effectively degrade the strong industrial load. Hence, N-removal required higher oxygen demand, not higher θc nor lower F/M values. Keeping the same F/M implied increasing X proportionally to CODin increase, i.e., X = CODin/CODin avg × Xavg.
The oxygen transfer rate in process water versus clean water (α-value) is the most important parameter affecting the oxygen transferred under field conditions by mechanical aerators or air diffusors, though it is also the most uncertain and difficult to establish parameter [11,12,20]. Factors influencing α-values include the influent water characteristics (the higher the load, the lower α), the type of aerators (low and high speed mechanical aerators or turbines, coarse and fine-bubble air diffusors) and the process operating conditions. For instance, higher MLSS or θc values or pre-anoxic reactors result in higher α-values [11,21]. Herein, the following assumptions were considered: same α-values for turbines and air diffusors (according to Metcaf and Eddy 2014); α ~ 0.5 for CODin 750 mg/L [20]; a 20% reduction for twice the CODin (i.e., for 1500 mg/L) [20,21]; and a linear decrease in between, i.e., α = 0.6–0.0001(3) × CODin a 20% α increase under N-removal conditions [11], i.e., α = 1.2 × [0.6–0.0001(3) × CODin].
3.3. Forecasting Oxygen and Energy Consumption and Sludge Production
3.3.1. Increase of COD Influent Concentration
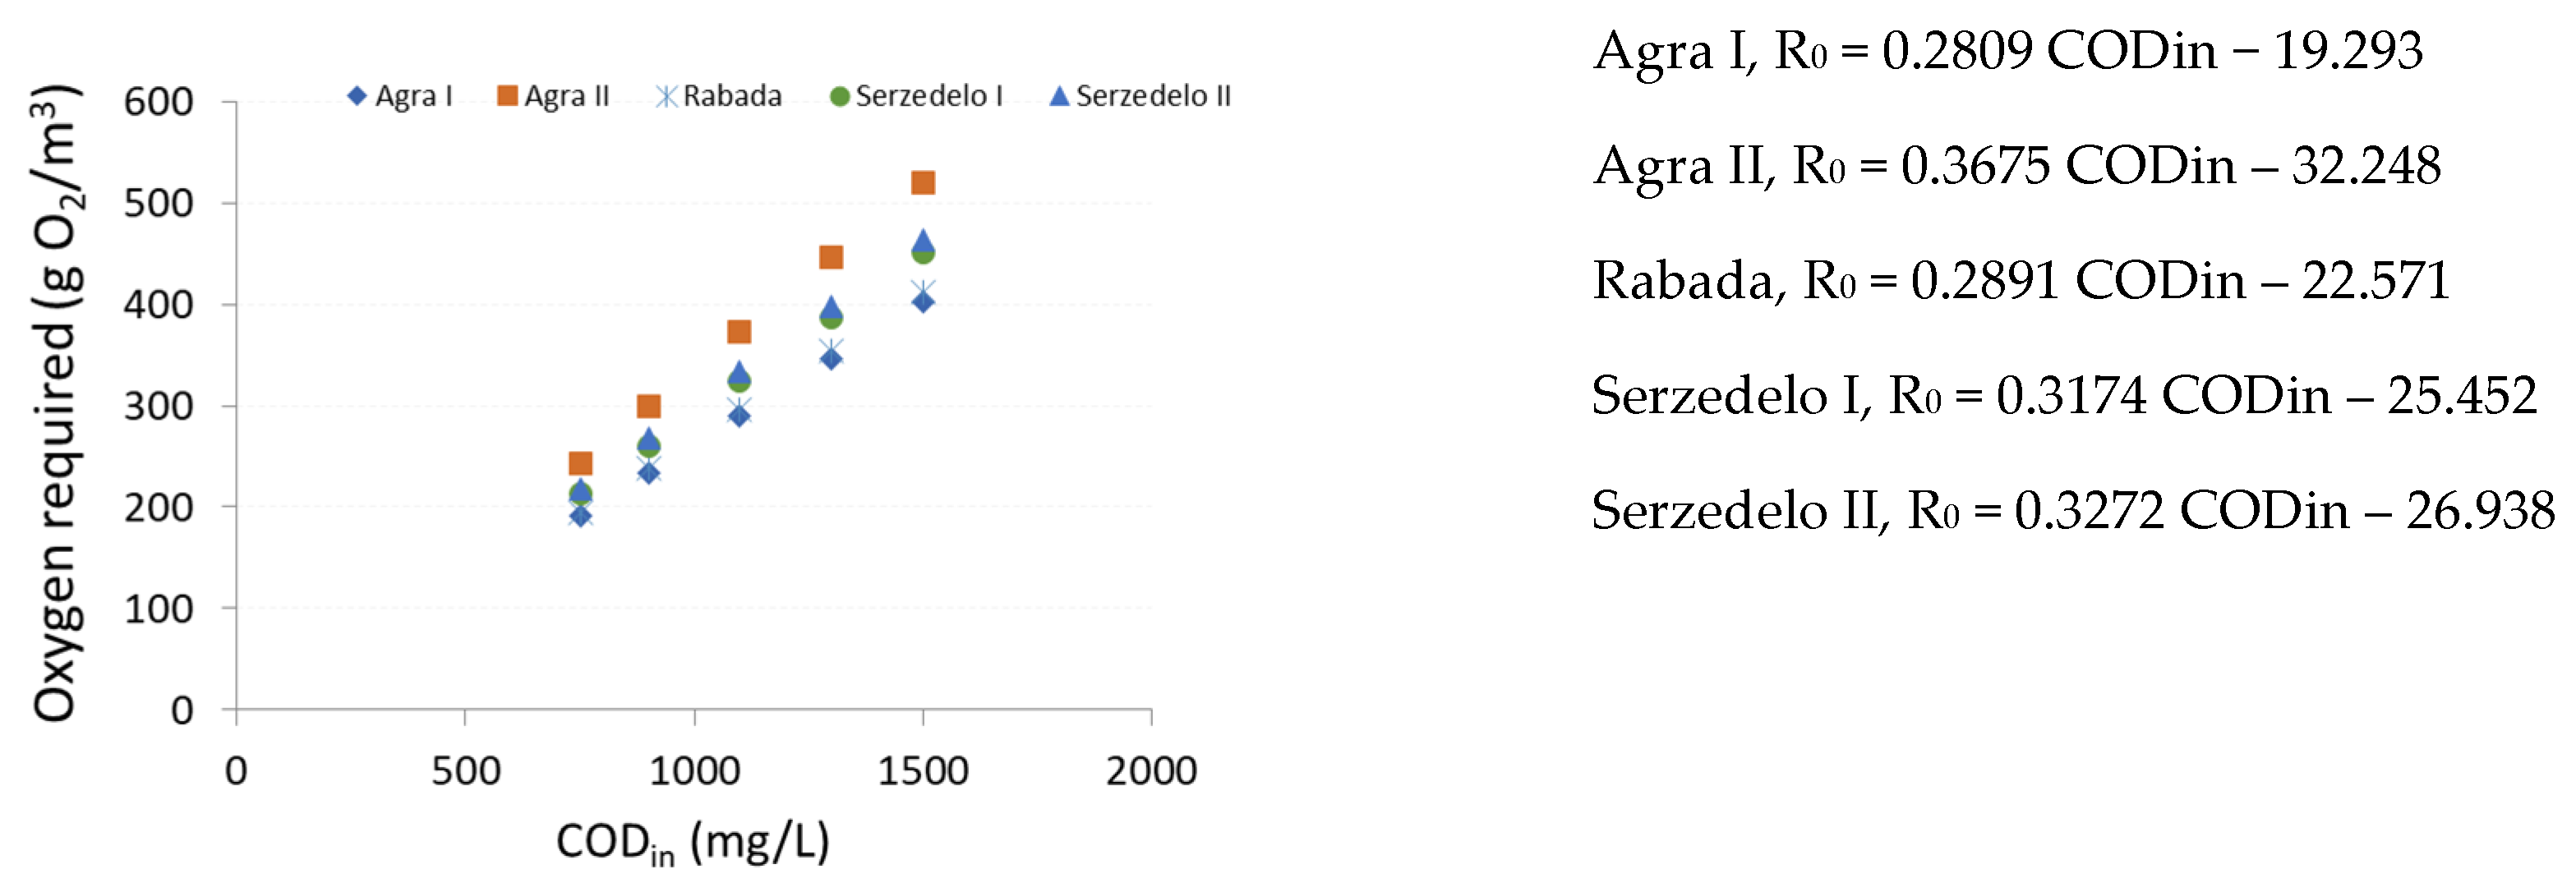
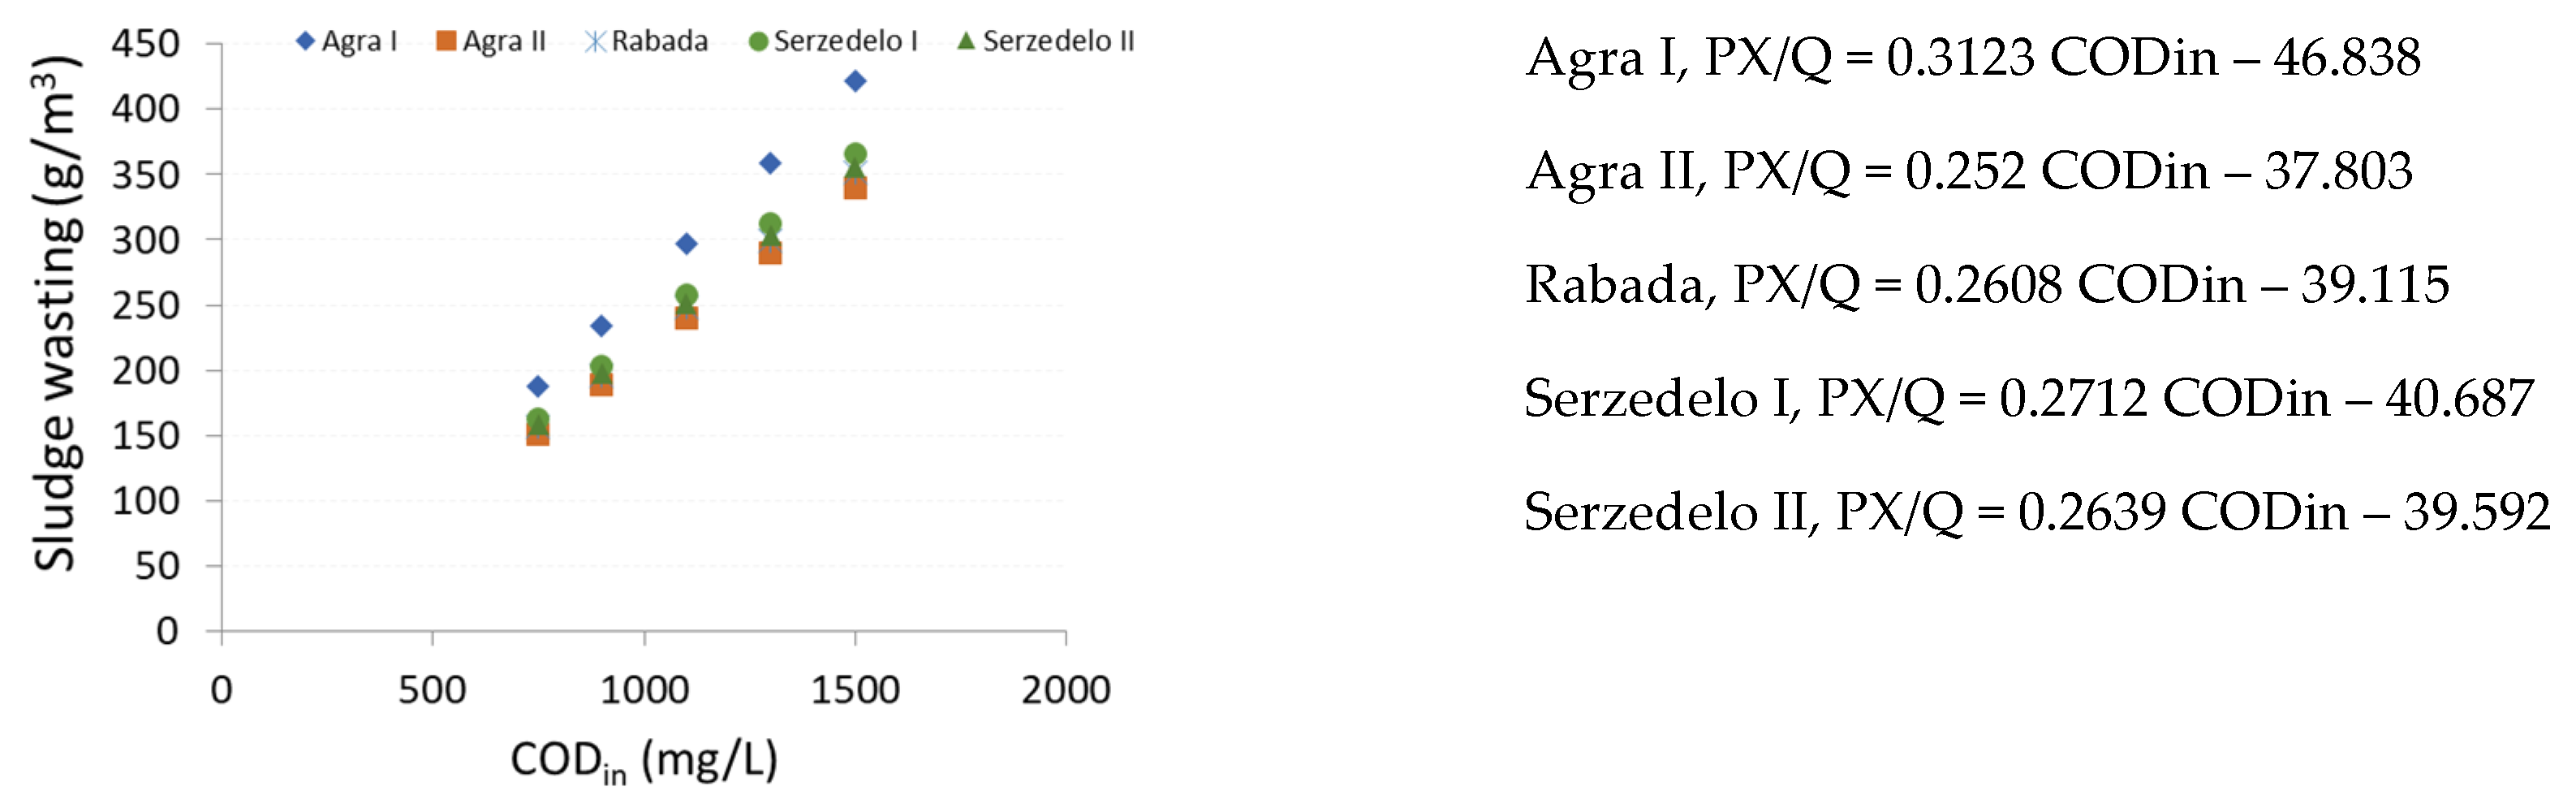
Using the equations and assumptions presented earlier (Section 2.2 and Section 3.2), the oxygen (Equation (1)) and energy (Equation (4)) required for aeration and sludge wasting (Equation (3)) were computed for each of the five activated sludge WWTPs. For this scenario, to isolate the impact of current and future industrial connections to the drainage system, a CODout of 150 mg/L was considered, different CODin values were imposed in the 750–1500 mg/L range and the corresponding BOD5, nbVSS and X values were computed as summarized in Table 3.
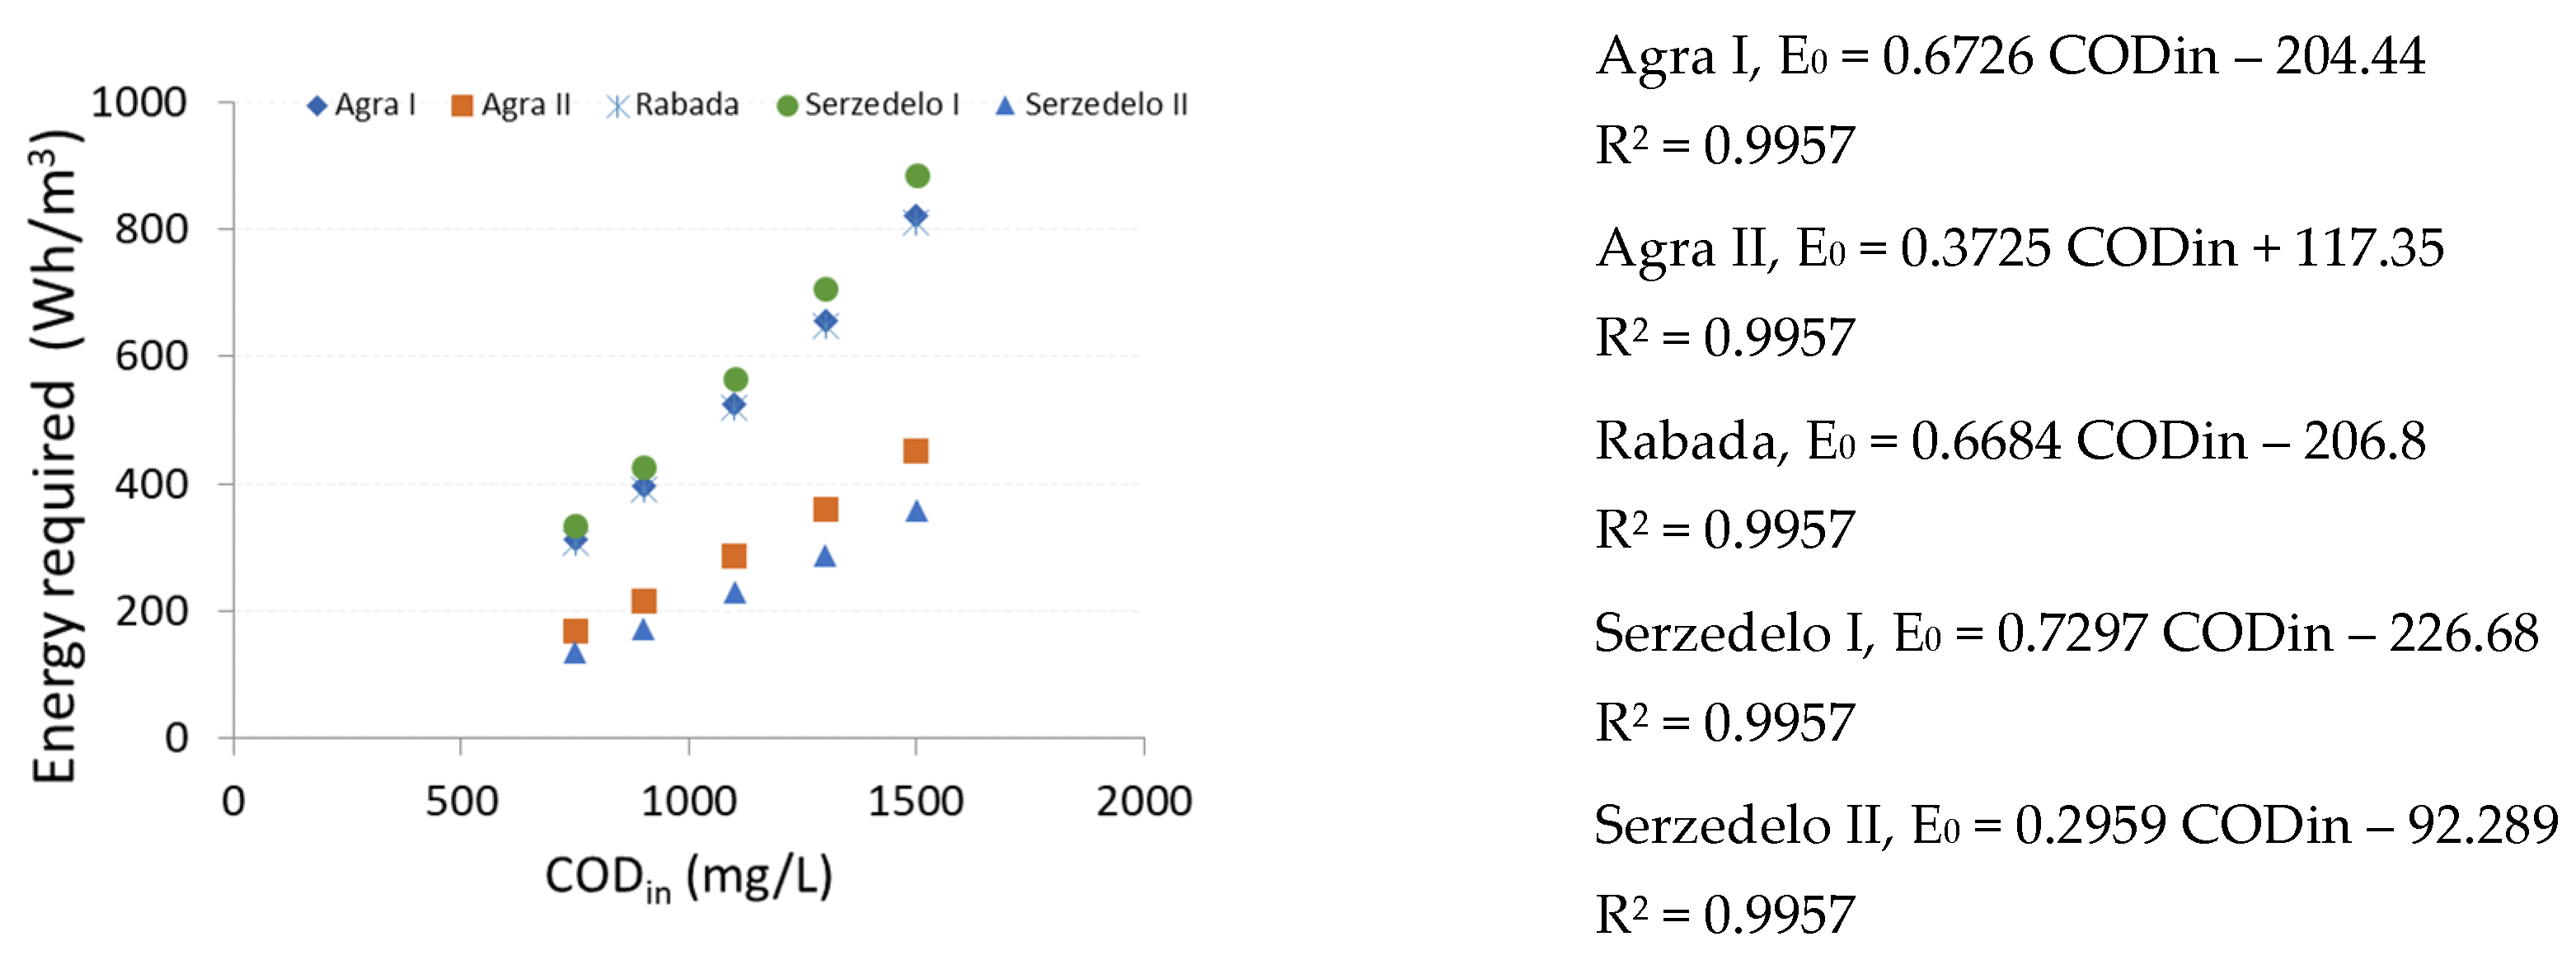
For each WWTP, equations of R0, E0 and PX/Q were then derived as a function of CODin (Figure 3, Figure 4 and Figure 5), and these equations were used to quantify the impacts targeted. The results show a COD influent increase from, for example, 900 to 1300 mg/L corresponds to an oxygen consumption increase of 49% (Figure 3), an energy consumption increase of 66% (Figure 4) and a sludge production increase of 53% (Figure 5). The energy increases more than the oxygen demand due to the 20% reduction of the α-value for twice the CODin. As expected, WWTPs with air diffuser systems are less (around half) energy intensive than WWTPs with mechanical aerators.
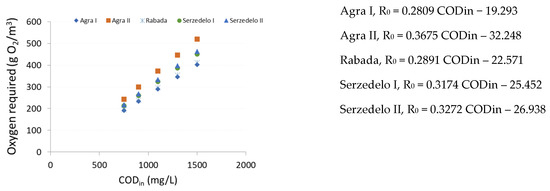
Figure 3.
Oxygen required per treated volume as a function of influent COD concentration.
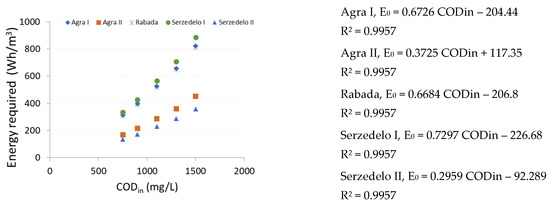
Figure 4.
Energy required per treated volume as a function of influent COD concentration.
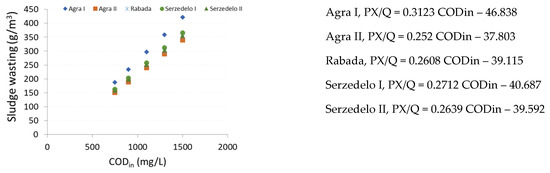
Figure 5.
Sludge wasting per treated volume as a function of influent COD concentration.
Longo et al., in a literature review study [22], refer to the energy consumption for aeration as between 0.18 and 0.8 kWh/m3, depending on the treatment plant size (2000 to 100,000 population equivalent). Herein, for 1000 mg/L CODin, a high-strength influent [20], the energy required for aeration varied between 0.2 and 0.5 kWh/m3, depending on the WWTP. Our results are limited to aeration and therefore are not comparable with many other studies in the literature relative to the overall energy consumption of the WWTPs [22,23], nor with those studies that address the energy reduction associated with improvement measures or equipment replacement [24] and not associated to the impact of influent changes.
3.3.2. Decrease in COD Emission Limit Value
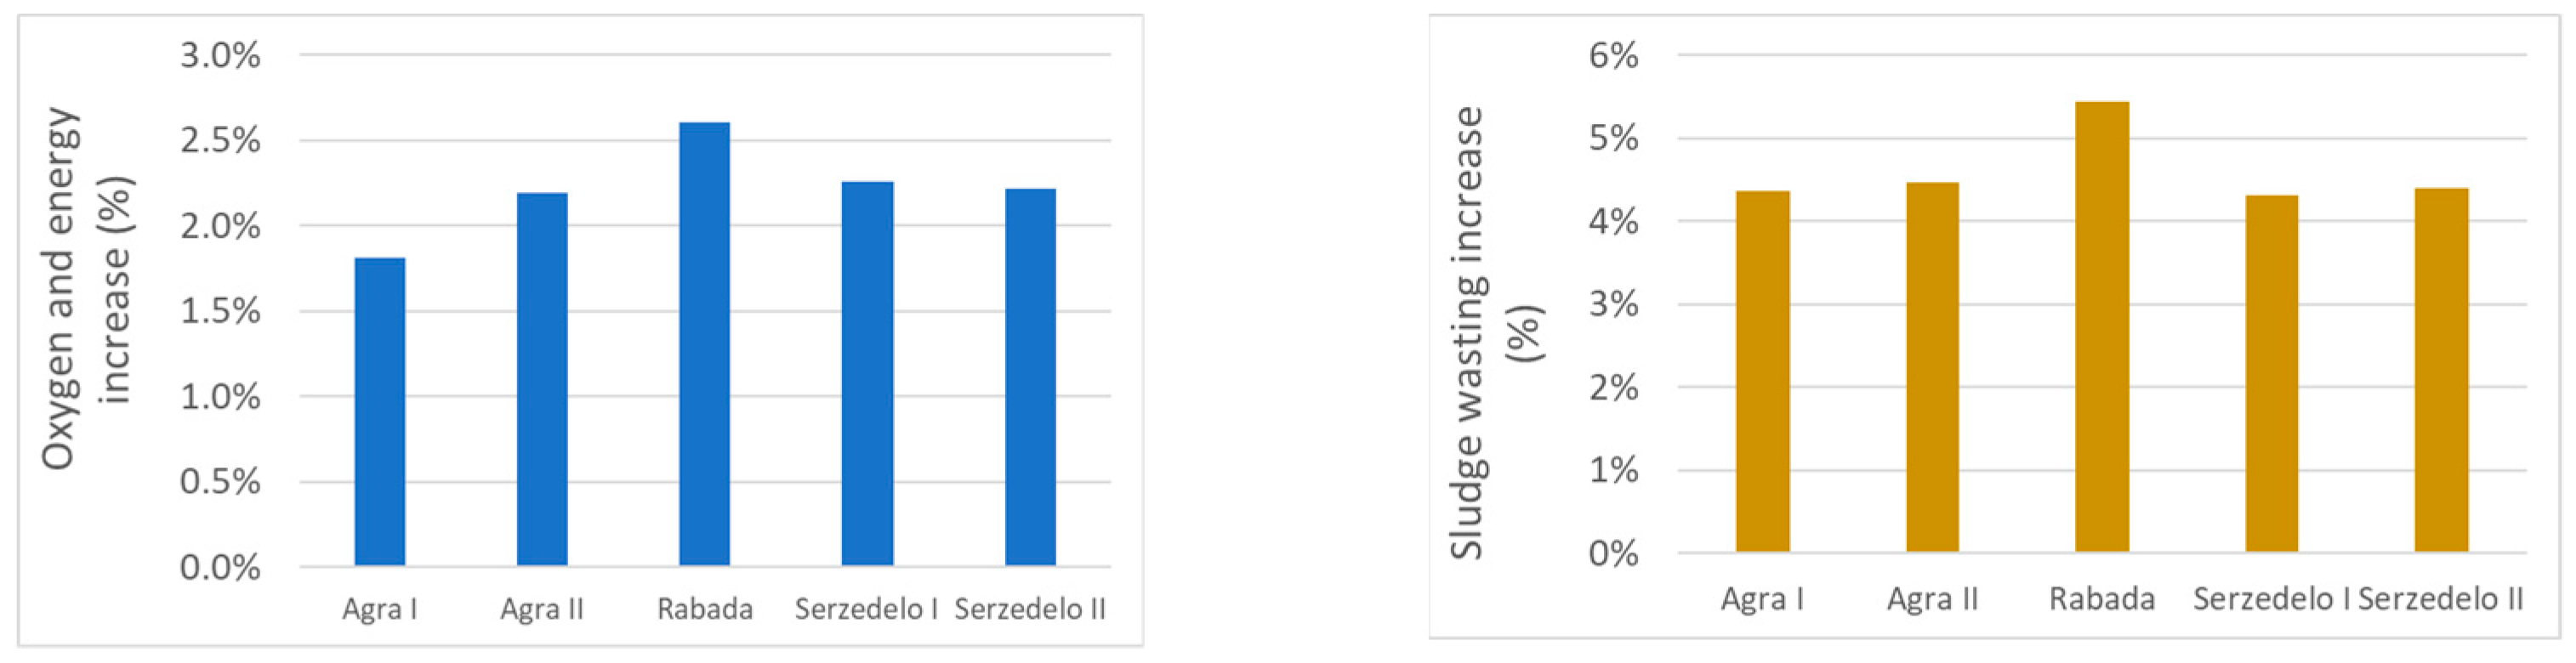
For the scenario of lowering the COD emission limit value from 150 mg/L, 12 months/year, to 100 mg/L in the 4 summer months and 125 mg/L in the remaining months, and the mean values for each period were considered. As expected, this change has a slight impact on oxygen and energy consumption in aeration (between 1.8% and 2.6%) and sludge wasting (between 4.3% and 5.4%) (Figure 6).
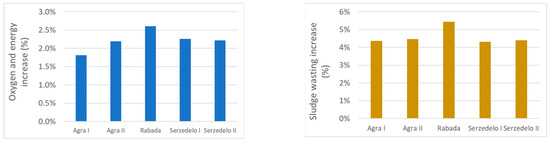
Figure 6.
Percentage increase in oxygen and energy required and sludge wasting with the change of COD emission limit value.
3.3.3. Imposition of Emission Limit Value for N Total
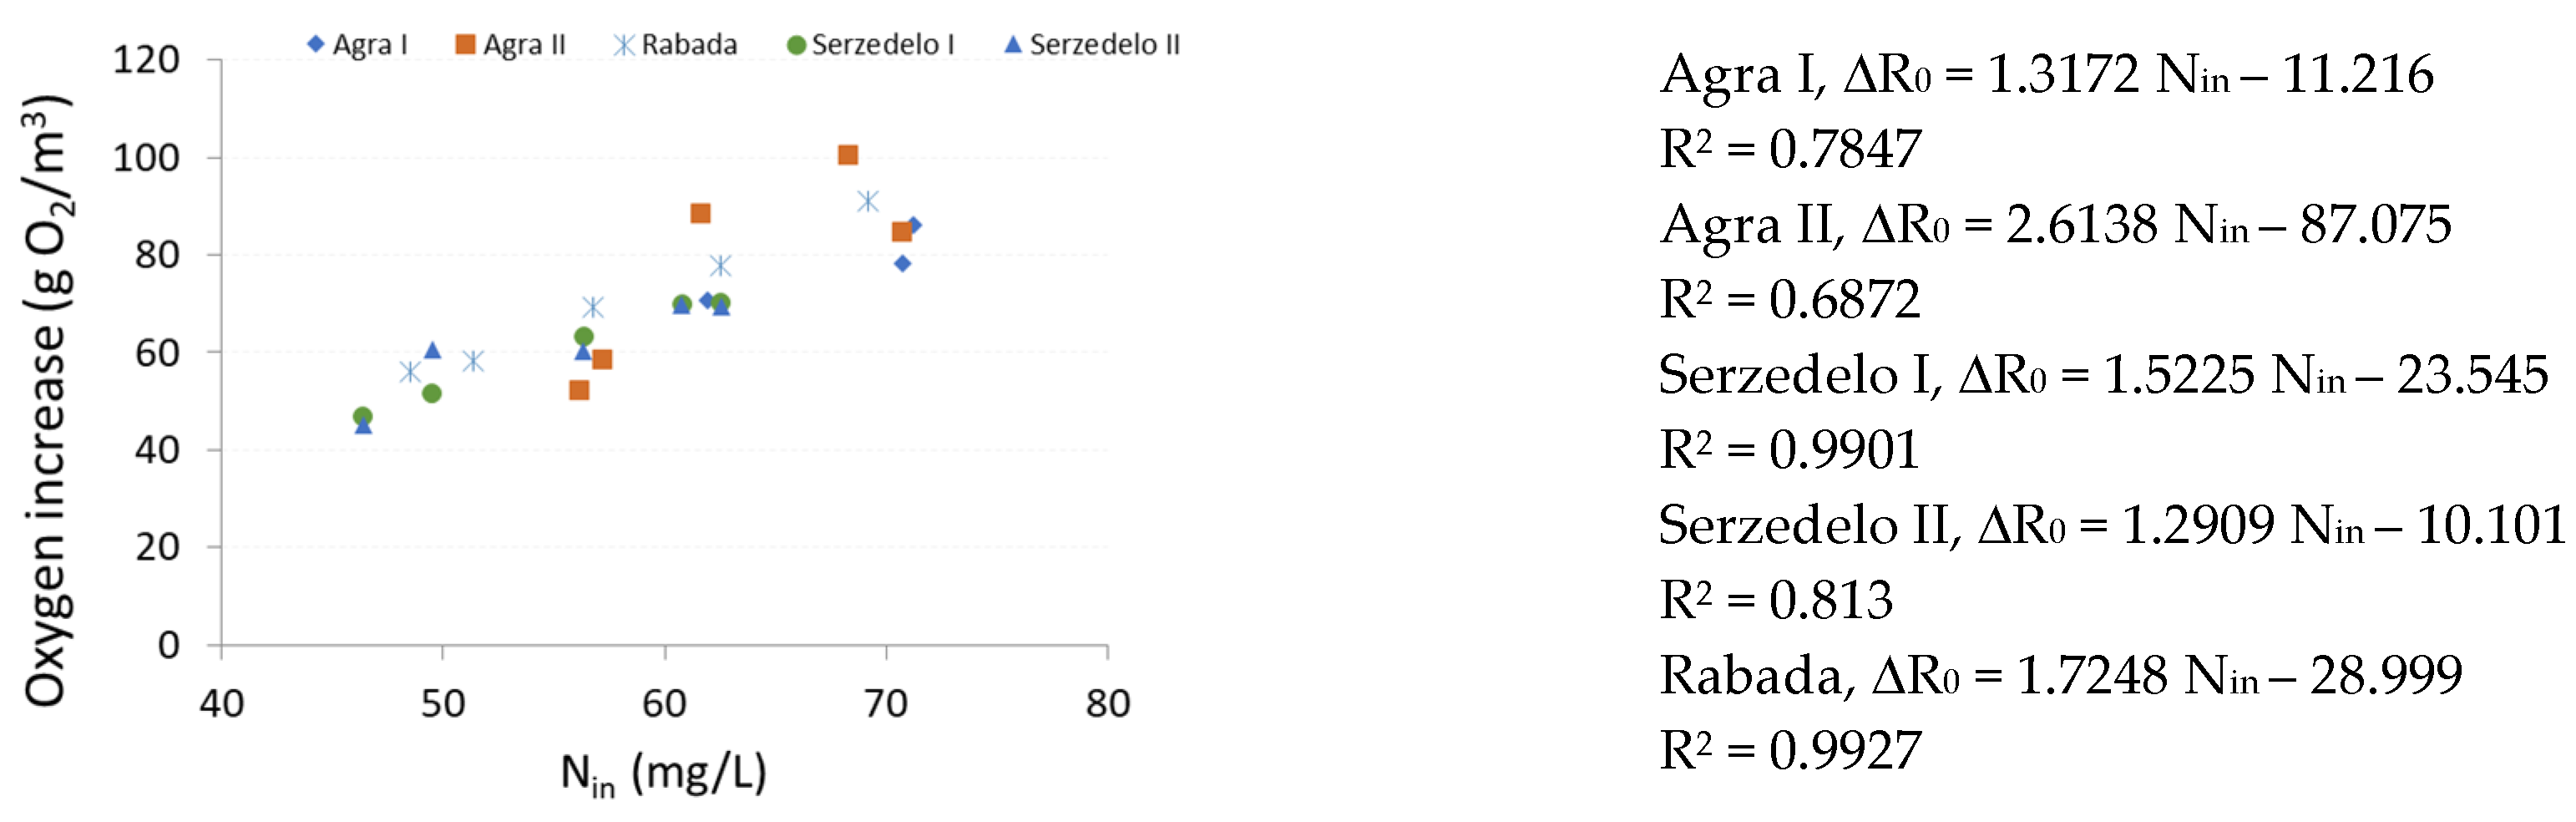
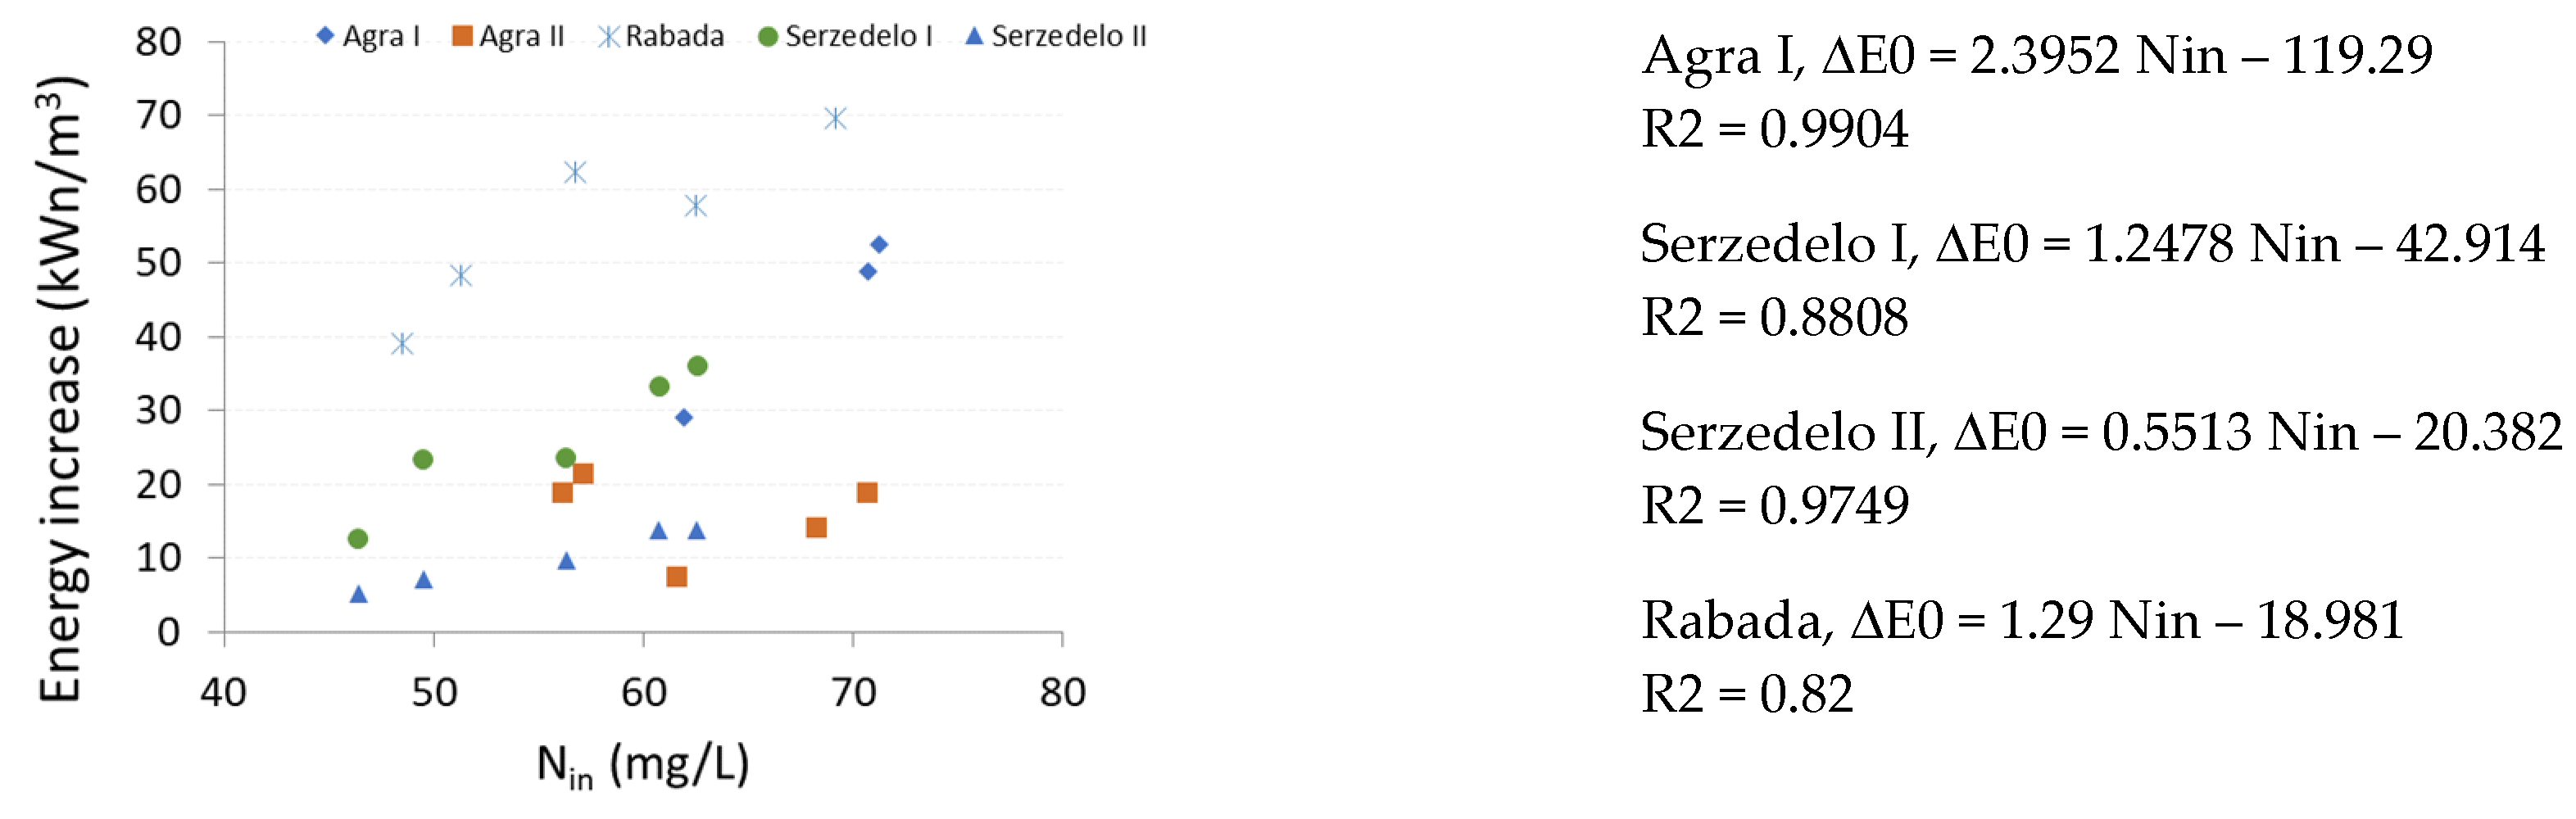
To analyse the impact of the nitrogen removal due to the imposition of the emission limit value of 15 mg/L, the oxygen needed for nitrification is added to the oxygen needed for the biodegradation of carbonaceous material as explained in Section 2. The increment in the oxygen and energy required for more stringent emission regulation on nutrients is a function of the WWTP influent nitrogen (Figure 7 and Figure 8). For example, using the average influent nitrogen to each WWTP, one expects the oxygen consumption to increase between 30% (in Serzedelo I) and 51% (in Rabada) and the energy consumption to increase between 9% and 26%. This higher impact on the oxygen consumption than on energy consumption is related to the α improvement with nitrification [11]. These results were consistent with those of Burton [25], which refers to a 13–31% increase in energy consumption with nitrification, depending on the treated volume.
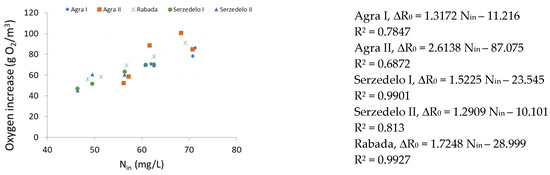
Figure 7.
Increment of oxygen required for complying with an emission limit value of 15 mg/L N total vs. influent nitrogen.
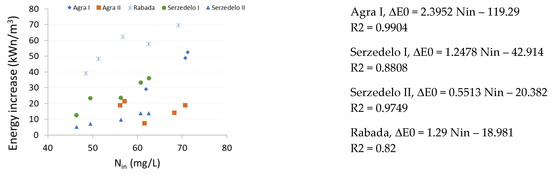
Figure 8.
Increment of energy required for complying with an emission limit value of 15 mg/L N total vs. influent nitrogen.
The field data in Table 2 show the three WWTPs with such a past change in their discharge consent (all except Agra I and II) have been complying with this N-total requirement (15 mg N-total/L) and significantly below it (7.6 mg N-total/L in Serzedelo I (turbine), 11.5 mg N-total/L in Serzedelo II (air diffusors), 8.6 mg N-total/L in Rabada), most probably due to over-aeration to guarantee the plant reliability.
4. Conclusions
This paper presents a methodology developed to forecast the impact of changes in influent COD, as well as in the emission limit values of COD and total nitrogen, on long-term average oxygen and energy requirements for aeration and sludge production by activated sludge WWTPs. It was based on mass balances (of sludge production and oxygen requirements for carbonaceous material biodegradation and/or nitrification), oxygen transfer and aeration equipment efficiency, and was tested in five extended aeration WWTPs using 5 years of operation data (2015–2019).
For the scenario of influent wastewater strength increase, WWTP-specific equations were derived as a function of influent COD. For example, a COD increase from 900 to 1300 mg/L corresponds to an oxygen consumption increase of 49%, an energy consumption increase of 66% and a sludge production increase of 53%.
The decrease in COD emission limit values (from 150 mg/L all year round to 100 mg/L during the 4 summer months and 125 mg/L during the remaining 8 months a year) has, as expected, a slight impact on oxygen and energy consumption for aeration (between 1.8% and 2.6%) and on sludge production (between 4.3% and 5.4%).
To forecast the impact of the imposition of the emission limit value of 15 mg/L N total, equations were also derived for oxygen and energy consumption as a function of the influent total nitrogen concentration. This change has a high impact on oxygen consumption (between 30% and 51%) and a lower impact on energy consumption (between 9% and 26%), as nitrification improves the oxygen transfer and dissolution in water.
These results constitute practical information for supporting the decisions to be taken by the water utility with respect to new industrial connections to the urban system or to understand the impact of discharge permit regulation changes on their annual energy and sludge costs. Ultimately, it allows the water utility to provide a high-quality service to the customer and the environment, as well as fair and sustainable pricing of wastewater treatment.
Author Contributions
Conceptualization, C.S. and M.J.R.; methodology, C.S. and M.J.R.; software, C.S.; validation, C.S. and M.J.R.; formal analysis, C.S. and M.J.R.; investigation, C.S. and M.J.R.; resources, C.S. and M.J.R.; data curation, C.S.; writing—original draft preparation, C.S. and M.J.R.; writing—review and editing, C.S. and M.J.R.; visualization, C.S.; supervision, M.J.R.; project administration, C.S.; funding acquisition, C.S. and M.J.R. All authors have read and agreed to the published version of the manuscript.
Funding
This research was funded by TRATAVE, S.A. (Proc. 0606/1201/22995).
Institutional Review Board Statement
Not applicable.
Informed Consent Statement
Not applicable.
Data Availability Statement
Not applicable.
Conflicts of Interest
The authors declare no conflict of interest.
References
- Directive, E.U.W. Council Directive of 21 May 1991 concerning urban waste-water treatment (91/271/EEC). J. Eur. Commun. 1991, 135, 40–52. [Google Scholar]
- Wood; COWI; CHI/NTUA; CENIA. Service Request Supporting the Evaluation of Directive 91/271/EEC Concerning Urban Waste Water Treatment; Publications Office of the European Union: Luxembourg, 2019. [Google Scholar]
- Pistocchi, A.; Dorati, C.; Grizzetti, B.; Udias, A.; Vigiak, O.; Zanni, M. Water Quality in Europe: Effects of the Urban Wastewater Treatment Directive; Publications Office of the European Union: Luxembourg, 2019. [Google Scholar]
- Silva, C.; Rosa, M.J. Energy performance indicators of wastewater treatment-a field study with 17 Portuguese plants. Water Sci. Technol. 2015, 72, 510–519. [Google Scholar] [CrossRef] [PubMed]
- Castellet, L.; Molinos-Senante, M. Efficiency Assessment of Wastewater Treatment Plants: A Data Envelopment Analysis Approach Integrating Technical, Economic, and Environmental Issues. J. Environ. Manag. 2016, 167, 160–166. [Google Scholar] [CrossRef] [PubMed]
- Capodaglio, A.G.; Olsson, G. Energy issues in sustainable urban wastewater management: Use, demand reduction and recovery in the urban water cycle. Sustainability 2020, 12, 266. [Google Scholar] [CrossRef] [Green Version]
- Castellet-Viciano, L.; Torregrossa, D.; Hernández-Sancho, F. The relevance of the design characteristics to the optimal operation of wastewater treatment plants: Energy cost assessment. J. Environ. Manag. 2018, 222, 275–283. [Google Scholar] [CrossRef] [PubMed]
- Vaccari, M.; Foladori, P.; Nembrini, S.; Vitali, F. Benchmarking of energy consumption in municipal wastewater treatment plants—A survey of over 200 plants in Italy. Water Sci. Technol. 2018, 77, 2242–2252. [Google Scholar] [CrossRef] [PubMed]
- Niu, K.; Wu, J.; Qi, L.; Niu, Q. Energy intensity of wastewater treatment plants and influencing factors in China. Sci. Total Environ. 2019, 670, 961–970. [Google Scholar] [CrossRef] [PubMed]
- Avilés, A.B.L.; Valásquez, F.C.; Riquelme, M.L.P. Methodology for energy optimization in wastewater treatment plants. Phase I: Control of the best operating conditions. Sustainability 2019, 11, 3119. [Google Scholar] [CrossRef] [Green Version]
- Rosso, D.; Stenstrom, M.K.; Garrido-Baserba, M. Aeration and Mixing. In Biological Wastewater Treatment: Principles, Modeling and Design, 2nd ed.; Chen, G., Ekama, G.A., van Loosdrecht, M.C.M., Brdjanovic, D., Eds.; IWA Publishing: London, UK, 2020; Chapter 9. [Google Scholar]
- Silva, C.; Rosa, M.J.; LNEC—National Civil Engineering Laboratory, Lisbon, Portugal. Reference values for benchmarking the energy performance uses in activated sludge systems. Unpublished work. 2021. [Google Scholar]
- Li, Z.; Zou, Z.; Wang, L. Analysis and forecasting of the energy consumption in wastewater treatment plant. Math. Probl. Eng. 2019, 2019, 8690898. [Google Scholar] [CrossRef] [Green Version]
- Yu, Y.; Zou, Z.; Wang, S. Statistical regression modeling for energy consumption in wastewater treatment. J. Environ. Sci. 2019, 75, 201–208. [Google Scholar] [CrossRef] [PubMed]
- Hauduc, H. Modèles Biocinétiques de Boues Activées de Type ASM: Analyse Théorique Etfonctionnelle, vers un jeu de Paramètres par Défaut. Ecologie, Environnement, AgroParisTech, Université Laval. 2010. Available online: https://hal.inrae.fr/tel-02594543/document (accessed on 10 September 2021).
- Rieger, L.; Gillot, S.; Langergraber, G.; Ohtsuki, T.; Shaw, A.; Takács, I.; Winkler, S. Guidelines for Using Activated Sludge Models; Scientific and Technical Report No. 22; IWA publishing: London, UK, 2013. [Google Scholar]
- Van Loosdrecht, M.C.M.; Lopez-Vazquez, C.M.; Meijer, S.C.F.; Hooijmans, C.M.; Brdjanovic, D. Twenty-five years of ASM1: Past, present and future of wastewater treatment modelling. J. Hydroinform. 2015, 17, 697–718. [Google Scholar] [CrossRef] [Green Version]
- Silva, C.; Matos, J.S.; Rosa, M.J. Performance Indicators and Indices of Sludge Management in Urban Wastewater Treatment Plants. J. Environ. Manag. 2016, 184, 307–317. [Google Scholar] [CrossRef] [PubMed]
- IWA. Sludge Treatment and Disposal; Biological Wastewater Treatment Series; Andreoli, C.V., Sperling, M., Fernandes, F., Eds.; IWA Publishing: London, UK, 2007; Volume 6. [Google Scholar]
- Metcalf and Eddy. Wastewater Engineering—Treatment and Resource Recovery, 5th ed.; McGraw-Hill Education: New York, NY, USA, 2014. [Google Scholar]
- Henkel, J. Oxygen Transfer Phenomena in Activated Sludge; TU Darmstadt: Darmstadt, Germany, 2010. [Google Scholar]
- Longo, S.; d’Antoni, B.M.; Bongards, M.; Chaparro, A.; Cronrath, A.; Fatone, F.; Lema, J.M.; Mauricio-Iglesias, M.; Soares, A.; Hospido, A. Monitoring and diagnosis of energy consumption in wastewater treatment plants. A state of the art and proposals for improvement. Appl. Energy 2016, 179, 1251–1268. [Google Scholar] [CrossRef] [Green Version]
- Di Fraia, S.; Massarottia, N.; Vanolia, L. A Novel Energy Assessment of Urban Wastewater Treatment Plants. Energy Convers. Manag. 2018, 163, 304–313. [Google Scholar] [CrossRef]
- WEF. Energy Conservation in Water and Wastewater Facilities; Manual of Practice No. 32; McGraw-Hill Education: New York, NY, USA, 2014. [Google Scholar]
- Burton, F.L. Water and Wastewater Industries: Characteristics and Energy Management Opportunities; Burton Environmental Engineering: Los Altos, CA, USA, 1996. [Google Scholar]
Publisher’s Note: MDPI stays neutral with regard to jurisdictional claims in published maps and institutional affiliations. |
© 2021 by the authors. Licensee MDPI, Basel, Switzerland. This article is an open access article distributed under the terms and conditions of the Creative Commons Attribution (CC BY) license (https://creativecommons.org/licenses/by/4.0/).