Abstract
(1) Background: In recent years, the EAT-Lancet Commission has suggested the inclusion of nuts among proteins from vegetable sources, but this inclusion would imply a higher consumption of nuts compared with a healthy Mediterranean diet. (2) Objective: In this work, we sought to provide a comparison between the macronutrient intakes and environmental impacts of two different types of diet: a diet including nuts and a diet without nuts. (3) Methods: In this pilot study, we recruited 89 Italians divided into two groups: nut consumers (44 individuals) and non-consumers (45 individuals). Food consumption was monitored by a seven-day diary, while the Mediterranean diet scores, habitual physical activity scores, and orthorexia nervosa scores were evaluated through standardized questionnaires. (4) Results: We found that nut consumers had higher physical activity and energy intake levels. High consumption of fat (p < 0.001) and protein (p < 0.001) was observed among nut consumers compared with the levels observed among non-consumers. Moreover, a higher environmental impact of total dietary intake was observed among nut consumers, in terms of carbon (p < 0.05) and land (p < 0.05) footprints; impacts on the water footprint was almost significant (p = 0.06). (5) Conclusions: We suggest that, among plant food proteins, the consumption of complementary proteins from legumes and cereals should be preferred to the consumption of proteins from nuts.
1. Introduction
Nuts include almonds, hazelnuts, walnuts, pistachios, and chestnuts [1,2] and contain proteins, lipids, fiber, vitamins, minerals, polyphenols, and phytosterols [2]. Interest in the consumption of nuts has increased in recent years due to the effects of nuts on human health [3]. Moreover, the consumption of nuts is correlated with a reduction in risk factors for chronic diseases [4]. Despite the risk of food safety and allergenicity, the global demand for nuts has increased due to a growing awareness of the benefits of eating nut products [5].
The EAT-Lancet Commission on Healthy Diets from Sustainable Food Systems suggests including nuts among the sustainable food sources of proteins [6]. Considering suggested portion sizes for 2500 kcal/person/d, differences in the amounts of nuts and seeds were found between the recommended eating patterns of the EAT-Lancet (50 g) and the healthy US style (Dietary Guidelines for Americans (DGA), 10 g), the healthy Mediterranean style (10 g), and the healthy vegetarian (18 g) [7]. Specifically, the EAT-Lancet included 2.8× the recommended portion of nuts and seeds [7].
Vitale et al. [8] recently reported that in Italy, during the period of 2000–2017, fish and nuts were among the food groups included among protein sources that experienced an increase in supply (+26%, and +21%, respectively), whereas beef greatly declined (−32%). The authors concluded that the consumption of nuts and legumes should be doubled to meet the targets proposed by the EAT-Lancet Commission [8]. However, Tucci et al. [9] recently noted that adapting a 2500 kcal/d EAT-Lancet Commission reference diet (ELCRD) to Italian food habits (EAT-IT) would yield considerably higher nut consumption compared with a dietary plan based on the Italian dietary guidelines (IDG) and would present certain nutritional issues due to the higher energy intake from lipids. In a randomized controlled trial among men, the energy intake from a walnut-supplement diet (including 75 g/d of walnuts) exceeded the usual diet, and 86% of the total fat from walnuts was not displaced [10]. Therefore, the risk of substituting other foods with nuts could lead to an increased risk of excess of body fat [11].
This pilot study aims to compare the macronutrient intakes and environmental impacts of two different types of diet, one including nuts (nut consumers) and one without nuts (non-nut consumers). In line with previous results [12,13,14], we also included several measures on eating behaviors, including adherence to the Mediterranean diet, orthorexia nervosa, physical activity level, and body composition.
2. Materials and Methods
2.1. Recruitment and Enrollment
Eligible individuals were recruited in Rome (from April to December 2019) using e-mail and verbal dissemination. Before participating, individuals were informed about the aim of the study, and those who agreed to participate gave their written consent. Volunteers did not receive a reward and were screened through a questionnaire that collected general information including sex, sports activities, smoking habits, medical history, use of drugs, use of supplements, and the consumption of foods for special purposes (e.g., gluten-free and protein-free). Then, a personal interview was conducted for clarification.
To avoid potential confounders, such as the avoidance of nuts for caloric control or health issues, we included several exclusion criteria including the presence of any disease, food allergy, or intolerance; the consumption of a special diet; or dietary restrictions, such as a vegetarian diet. In this pilot study, we recruited only male consumers due to the higher prevalence of strategies to lose weight for women compared to men [15,16]. Dieting, calorie counting, and avoiding fatty foods are among the various body-weight control behaviors observed in women [16,17,18]. Food cues presented on television programs reduced peanut, chocolate, and candy consumption and energy intake among women [19], whereas men were less likely to read and use the caloric information [20]. Therefore, for men, nut consumption could be related to a healthy and sustainable diet, whereas for women, the exclusion of nuts from the diet could be due to possible confounding eating disorders. Thus, the final sample consisted of 89 Italian male adults, with an age range between 19 and 48 and an average age of 31 years old.
Adherence to the Mediterranean diet was evaluated with the Mediterranean diet score (MDS-14), assessed using the questionnaire of the PREDIMED study [21], and with the Mediterranean score (MEDScore-55) [22]. MDS-14 [21] and Score-55 [22] differ in the scores they assign to certain dietary components. In particular, a higher score is assigned for the high consumption and low consumption of wine and white meat in MDS-14 and MEDScore-55, respectively. Furthermore, MDS-14 assigns a high score to the low consumption of sweets, butter, and carbonated beverages and the high consumption of “sofrito” (a Mediterranean sauce heated at high temperature) [21], whereas in MEDScore-55, high scores are assigned to the low consumption of full dairy products and the high consumption of potatoes and unrefined cereals [22]. In both scores, a high score is assigned to the low consumption of red meat and the high consumption of fish, fruits, vegetables, legumes, and olive oil. Moreover, MDS-14 includes the consumption of nuts. Based on this information (confirmed by a 7-day paper-based food diary), two groups were selected: nut consumers (44 individuals, nut consumers) and non-nut consumers (45 individuals, non-nut consumers). This observational study was undertaken in accordance with the Helsinki Declaration for research on humans and was notified to the Ethics Committee “Lazio 2”, Rome, Italy (study 164.18, 0197220/2018, protocol n. 0047966-15 March 2019).
2.2. Data Collection and Analysis
Body Mass (BM) was assessed with an OMRON BF-511 electric scale, which was used to evaluate the percentage of fat mass (FM%) in a previous study [23]. Stature was measured with a wall stadiometer (Seca Model 222 stadiometer) when the individuals were wearing light clothing and no shoes. BM and stature were recorded to the nearest 0.1 g or cm, respectively, and the BMI was calculated as weight (kg)/height (m2).
Dietary intakes were evaluated by means of a 7-day consecutively recorded food diary. The volunteers were asked to record the amounts of food, beverages, and supplements they consumed by food weighting or with the help of visual tools to increase the accuracy of the portion size. Data were revised and completed through a nutritional interview.
The nutritional composition of the diet was calculated by an internal database according to Italian food composition tables [24] and United States Department of Agriculture (USDA) databases [25]. Food and macronutrient intake were normalized as kg BM/d, as per a previous study [26]. Compliance with the recommended macronutrient intakes for the Italian population (Livelli di Assunzione di Riferimento di Nutrienti ed Energia per la Popolazione Italiana (LARN) [27]) was also evaluated.
Ecological footprints were calculated using the Barilla Center for Food and Nutrition (BCFN) database [28] and published data for whey protein supplements [29]. The carbon footprint (gCO2), water footprint (L), and land footprint (m2) were calculated and normalized for the food consumed as kg BM/d [26]. Compliance with the suggested dietary intake levels of food groups in the EAT-Lancet planetary health diet was evaluated [6].
Habitual physical activity was evaluated using the International Physical Activity Questionnaire Short Form (IPAQ-SF) [30], including items assessing intense physical activity (8.0 metabolic equivalent for the task: MET); moderate physical activity (4.0 MET); and walking quickly (3.3 MET), moderately (3.0 MET), or slowly (2.5 MET) [30]. Based on the collected data (the duration and frequency of physical activity), the energy expenditures were estimated (expressed in METmin/week). Moreover, the IPAQ provided a self-reported weekly sitting time.
The ORTO-15 test [31], a self-reported questionnaire featuring 15 items with 4-point Likert-scale response options specifically designed to assess orthorexia nervosa (an excessive attention to health concerns and the safety of food), was also administered [31]. A score of 1 is assigned to behaviors that most strongly reflect orthorexia, with a score of 4 assigned to the most normal behaviors, meaning that lower scores indicate higher levels of orthorexia [31]. According to Donini et al. [31], different scores were assigned to items for the responses “Always” (a score of 4 for items 2 to 5, 8, and 9; a score of 2 for items 1 and 13; a score of 1 for items 3, 4, 6, 7, 10, 11, 12, 14, and 15), “Often” (a score of 3 for items 2 to 5, 8, and 9; a score of 4 for items 1 and 13; a score of 2 for items 3, 4, 6, 7, 10, 11, 12, 14, and 15), “Sometimes” (a score of 2 for items 2 to 5, 8, and 9; a score of 3 for items 1 and 13; a score of 3 for items 3, 4, 6, 7, 10, 11, 12, 14, and 15), and “Never” (a score of 1 for items 2 to 5, 8, and 9; a score of 1 for items 1 and 13; and a score of 4 for items 3, 4, 6, 7, 10, 11, 12, 14, and 15).
2.3. Statistics
Categorical variables were expressed as percentages (significance was assessed with a χ2 test). Continuous variables were analyzed by a T-test (for results passing normality, a Shapiro–Wilk test was used) and expressed as the means and Standard Deviation (SD). Otherwise, data were analyzed by a Mann–Whitney rank sum test and expressed as the median (25–75% range). The significance level was set below 5% (p < 0.05). Spearman correlation was performed between variables.
3. Results
Nuts consumed included walnuts, almonds, sunflower seeds, and peanuts (Table 1). Apart from sunflower seeds, no other type of seeds (e.g., pumpkin and chia) were consumed by the volunteers. Almonds and walnuts were consumed the most frequently (4.2 ± 3.3 and 3.2 ± 2.5 times/week, respectively), with mean portion sizes of 26.19 ± 19.28 g and 27.17 ± 14.6 g, respectively. Overall, the mean portion of total nuts was 30.4 ± 19.2, with a consumption frequency of 4.9 ± 4.4/week.

Table 1.
Mean weekly consumption of nuts.
The nut consumer group featured a high percentage of smokers, but no difference in age was found between groups (Table 2).
Table 2.
Sample characteristics (n = 89).
Although no significant differences in the median BMI were found compared with non-nut consumers, the nut-consumer group had higher and lower percentages of overweight (OW) and obese (OB) individuals, respectively (OW: 64% versus 36%, OB: 2% versus 9%, Chi-square: p < 0.05). However, consumers of nuts had low FM% values and higher physical activity levels, despite their similar sitting times (Table 2). Many volunteers in the nut consumer group noted that they practice body building or are gym attendees (Figure 1), which accorded with their low FM% results (Table 2).
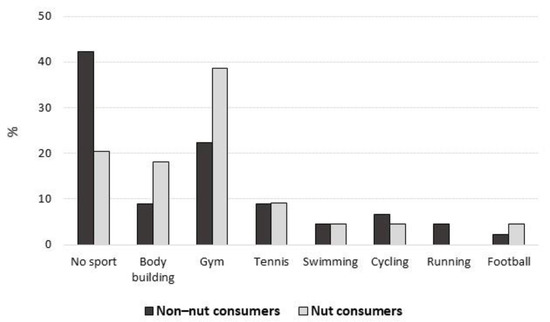
Figure 1.
Self-reported sports practice (%).
More individuals in the nut-consumer group reported practicing various sports activities (Table 2 and Figure 1). Among them, no differences were found in the weekly frequency (3.0× on average) or the duration of a single session (1.5 h on average). Nut consumers had higher fat, protein, and energy intakes (En), but the median contributions to total En (%En) for all macronutrients, alcohol, and fiber were similar (Table 3). Nuts contributed to the mean (calculated based on the seven-day diary) daily total En for 4.3 ± 3.6%.
Table 3.
Intakes of energy, macronutrients, alcohol, and fiber.
Differences in the percentages of individuals who had fat and sugar intakes (as %En) higher than the recommended values (LARN: 30% fat %En and sugars 10% En) did not reach statistical significance (fat %En > 30: nut consumers, 86%; non-nut consumers, 82%; Chi-square 0 = 0.80; sugar %En > 10: nut consumers, 59%; non-nut consumers, 78%; Chi-square p = 0.09). In addition to the intake of proteins from nuts and vegetables, the intake of proteins from animal sources was higher in the nut-consumer group (Table 3). Based on the results, high and low percentages of volunteers in the nut-consumer group had total intakes of proteins above and below the recommended values (LARN), respectively (Figure 2).
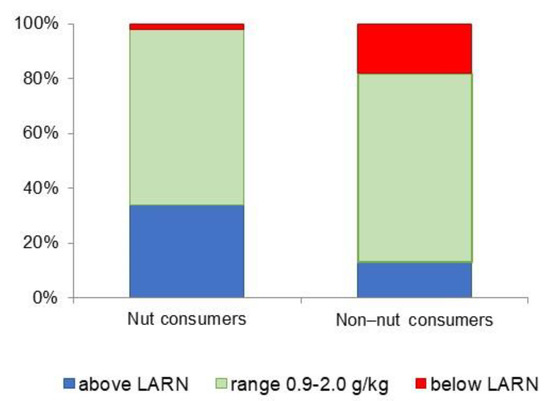
Figure 2.
Percentages of volunteers with and without protein intakes in the range of LARN (g/kg BM). Chi-square: p < 0.01.
Among the food groups suggested by the EAT-Lancet Commission, the consumption of fish was higher in the nut-consumer group (Table 4), and the percentage of men with fish intakes above the EAT-Lancet-suggested portion (0–1.4 g/kg BM) was higher (39%) than that in the non-nut-consumer group (18%, Chi-square p = 0.05).
Table 4.
Food categories consumed in the two groups and adherence to the Mediterranean diet.
No differences among groups were found in the foods considered in MDS-14 and/or MEDScore-55, including fruits, legumes, eggs, dairy products, poultry, red meat, cereals, tubers, sweets, dressing, and alcoholic beverages (Table 4). However, nut consumption was significantly higher compared with the values of the Mediterranean diet (Table 4) when evaluated with MDS-14 (Spearman correlation MDS-14 versus nut consumption: 0.527, p < 0.001) but not with MEDScore-55, including or not including nut consumption, respectively.
Both nut consumption and MDS-14 were correlated with the land footprint (Spearman correlations of 0.266 and 0.250, respectively, p < 0.05), but a higher correlation was observed between land footprint and fiber consumption (Spearman correlation of 0.340, p < 0.01). Moreover, both scores of adherence to the Mediterranean diet were correlated with fiber intake (MDS-14: Spearman correlation of 0.294, p < 0.01; MEDScore-55: Spearman correlation of 0.226, p < 0.05). The latter depends not only on nut consumption but also on vegetable consumption, which was higher among nut consumers (Table 4) and was included in both scores of adherence to the Mediterranean diet.
On the other hand, nut intake was correlated with the total (Spearman correlation 0.292, p < 0.01) and animal (Spearman correlation 0.273, p < 0.01) protein intakes. For both animal protein scores, a high score was assigned to the high consumption of fish, which was higher in the nut-consumer group compared with the non-nut-consumer group (Table 4). For fish consumption, carbon (kg CO2/kg BM: 4.2 (3.2–6.9) versus 2.5 (1.4–4.6), p < 0.01) and land (m2/kg BM: 0.23 (0.14–0.46) versus 0.18 (0.11–0.27), p < 0.05) footprints were higher in the nut-consumer group (Figure 3).
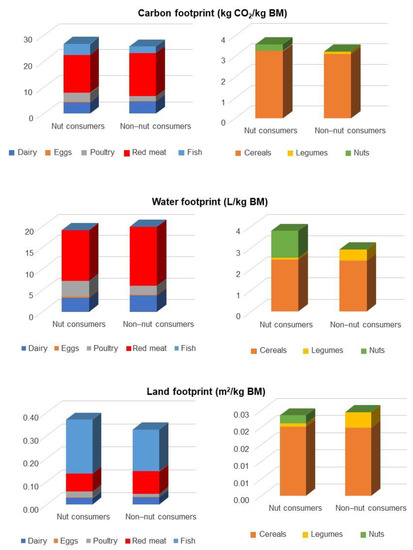
Figure 3.
Environmental impacts of different sources of food proteins.
These differences could partly account for the higher environmental impacts of the total dietary intakes of nut consumers (Figure 4) in terms of carbon (p < 0.05) and land (p < 0.05) footprints; the water footprint also nearly reached significance (p = 0.06).
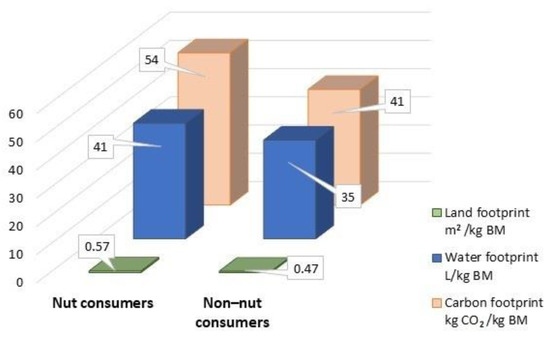
Figure 4.
Environmental impact of the diet.
On the other hand, both carbon and water footprints in the overall diet were correlated with fat (Spearman correlations: 0.329 (p < 0.01) and 0.422 (p < 0.001), respectively) and protein consumption (Spearman correlations (p < 0.001): 0.877 (total proteins) and 0.897 (animal proteins) versus carbon footprint; 0.804 (total proteins) and 0.825 (animal proteins) versus water footprint. Protein consumption was also related to land footprint (Spearman correlations (p < 0.001): 0.755 (total proteins) and 0.744 (animal proteins)).
The environmental impacts of diet in terms of carbon, water, and land footprints were correlated with the total energy intake (Spearman correlations: 0.616 (p < 0.001), 0.665 (p < 0.001), and 0.395 (p < 0.01), respectively), as well as with high-intensity physical activity (Spearman correlations: 0.270 (p < 0.05), 0.269 (p < 0.05), and 0.255 (p < 0.05), respectively) and—particularly—with hours/week spent engaging in a leisure sport activity (Spearman correlations: 0.439 (p < 0.001), 0.410 (p < 0.001), and 0.398 (p < 0.001), respectively). Moreover, the total impact of diet in terms of carbon and water footprints was inversely correlated with the FM% (Spearman correlations: −0.443 (p < 0.001) and −0.466 (p < 0.001), respectively). The latter, as expected, was correlated with total and intense physical activity (Spearman correlations: −0.383 (p < 0.001) and −0.422 (p < 0.001), respectively), as well as with animal and vegetable protein consumption (Spearman correlations: −0.399 (p < 0.001) and −0.329 (p < 0.01), respectively).
The water footprint of nuts was 1.3 (0.91–2.0) L/kg BM, while the carbon footprint (0.3 (0.2–0.5) kg CO2/kg BM) and land footprint (0.002 (0.001–0.003) m2/kg BM) were both lower than those of other protein sources (Figure 3).
For other food sources of proteins, in both groups, the median intakes (Table 4) of red meat were higher than the suggested EAT-Lancet values (0–0.4 g/kg BM), whereas the median egg, dairy, poultry, and legume intakes were in the correct range (g/kg BM: 0–0.36, 0–7.1, 0–0.83, and 0–1.4, respectively). Moreover, the ecological footprints did not differ among groups (Figure 3), and the median cereal consumption (complementary proteins for legumes) in both groups was below the mean suggested intake of the EAT-Lancet diet (3.3 g/kg BM, 0–60% En).
Although the median intake of vegetables was higher in the nut-consumer group than in the non-nut-consumer group and in the range of the EAT-Lancet recommendations (2.9–8.6 g/kg BM) (Table 4), the fiber intake (Table 3) was below the LARN (at least 25 g/d) in both groups. Table 4 shows the consumption of different food categories in each group. Tuber and fruit consumption was low (Table 4) but remained in the range of the EAT-Lancet recommendations (0–1.4 and 1.4–4.3, respectively).
No differences were found in the consumption of other foods not included in the EAT-Lancet classifications, and high percentages of coffee consumers were found in both groups (nut consumers, 89%; non-nut consumers, 71%, p = 0.07), with no differences observed in the median number of cups of coffee consumed daily (Table 4).
On the other hand, no differences were found between the groups for all ORTO-15 items (Table 5). In both groups, two of the three questions with the lowest scores, indicating higher orthorexia, involved food shops (item 2) and the market (item 14). The third question with the lowest scores in both groups was item 9 (Table 5), indicating that mood did not affect the eating behaviors of the volunteers.
Table 5.
Orthorexia nervosa (ORTO-15 items).
4. Discussion
In this work, we focused on how nut consumption affects macronutrient intake and environmental impacts. As secondary outcomes, eating patterns and behaviors (adherence to the Mediterranean diet and orthorexia) and physical activity levels were compared between nut consumers and non-nut consumers and discussed in the context of environmental sustainability.
4.1. Nutritional Concerns Regarding a Nut-Based Sustainable Diet and Alternative Protein Sources
We observed a high environmental impact from the diets of nut consumers compared with those of non-nut consumers. Although this result could be partly due to a higher En, a larger study conducted in southern Italy reported higher fat (median g/d: 51.6, Low Nut Intake group, versus 64.0, High Nut Intake group, p < 0.001) and protein (median g/d: 82.3, Low Nut Intake group, versus 84.8, High Nut Intake group, p < 0.001) intakes among nut consumers in conjunction with a lower En (median kcal/d: Low Nut Intake group, 2104.5, versus 2090.8, High Nut Intake group, p < 0.001) [2]. Moreover, the authors reported lower carbohydrate (median g/d: Low Nut Intake, 343.8, versus 294.7, High Nut Intake group, p < 0.001) and fiber (median g/d: Low Nut Intake group, 36.7, versus 31.0, High Nut Intake group, p < 0.001) intakes in individuals engaging in high levels of nut consumption [2]. In contrast, we did not observe significant differences in carbohydrates and fiber between the two groups, but nut consumers had higher levels of protein and fat consumption, as well as higher En values, than non-consumers.
The mean portion of total nuts was similar to the “standard” portion size (30.4 ± 19.2), with a consumption frequency of 4.9 ± 4.4×/week. Nuts contributed to 4.3 ± 3.6% of the mean daily En. This percentage was lower than the values recently described by Brown et al. [33], who compared the energy content from portion estimates (‘30 g serving’, ‘handful’, and ‘usual serving’) of nuts, expressed as a percentage of total required En, calculated based on a light physical activity level [33]. The percent contribution of nuts to total En for the estimated ‘30 g serving’ was 10.0% for men and 13.7% for women; a ‘handful’ corresponded to 15.0% for men and 16.6% for women; and the ‘usual serving’ contributed to 10.7% of the En for men and 10.5% of the En for women. The authors [33] concluded that these percentages agreed with those (10–20%) of intervention studies designed for personalized En% contributions from nuts, taking into account different BM and physical activity levels and that nut recommendations should be adapted to energy requirements. Accordingly, both the EAT-Lancet and Mediterranean diet “standard portion sizes” (for a man of 70 kg/BM) specify intakes of 2500 kcal [6] and 2000 kcal [34], respectively. As IPAQ is a self-reported questionnaire, in the present study, we preferred to normalize macronutrient and food consumption for BM, which is typically performed for proteins, as done in a recent study [26]. Furthermore, only an excess intake of food leading to obesity should be considered for its impact on the environment as metabolic food waste [35]. Considering the body compositions of nut consumers, normalizing the BM allowed us to reduce the risk of misinterpreting the results for sustainability. Obviously, nutritional demand and the resulting environmental impact of one’s diet is directly related to one’s BM. Our results show that nut consumers had lower FM% values than non-nut consumers; this result is in line with previous literature showing that obese consumers are less likely than normal-weight respondents to consume nuts [36]. Possibly, because consumers consider nuts to be a source of energy/calories (e.g., unsaturated fat), overweight and obese consumers may be less likely to eat nuts [36]. This result is also in line with a study by Wongprawmas et al. [37], which indicated that overweight and obese respondents were more concerned with the consumption of fatty products than achieving a normal body weight.
It must also be considered that the Italian national guidelines suggest a frequency of consumption below 3/week [32]. Communication of the positive health properties of nuts risks driving nut abuse, especially among people who practice sports. Such individuals (according to the Italian national guidelines [32]) should increase their En primarily with carbohydrates (60–70% En), whereas En from fat should be in the range of 20–35%, depending on the type of sport.
Recently, many alternative protein sources have been suggested as replacements for traditional animal products, including algae and insects [38]. Insect proteins have been extensively investigated due to their potential benefits in terms of nutritional and environmental impacts [39]. However, consumer acceptance of these novel foods is still debatable [40]. This reluctance is usually linked to strong barriers in Italy and other Mediterranean countries, which have a strong gastronomic heritage compared to Northern European countries [39]. Moreover, novel nutritional supplements, including those enriched with insect proteins [41], could receive negative attention by some groups of consumers. Thus, more familiar sources of proteins should be taken into consideration. A recent position paper from the Italian College of Academic Nutritionists MED/49 (ICAN-49) on osteosarcopenia in the elderly suggested at least 20–35 g/d of whey protein supplements in conjunction with resistance exercise [42]. Some special considerations related to supplementation were also included by the EAT-Lancet Commission [6]. Moreover, the production of whey protein concentrates from the land-spread waste streams of cheese (whey) reduces the environmental impacts of cheese production [29]. In addition to their high fat content, the concerning water footprints of nuts should also be considered [43,44].
4.2. Lifestyle, Food Choices, and Sustainability
In line with the results of Witkowska et al. [12], in the present study, nut consumers, compared with non-consumers, reported high levels of physical activity in their leisure time. We did not observe an association between orthorexia nervosa and more frequent consumption of nuts, which was previously reported among students [14]. Nevertheless, Santi-Cano et al. [13] reported that Cardio-Respiratory Fitness (CRF) was positively associated with nut or “sofrito” consumption but not with the overall Mediterranean diet patterns evaluated with MDS-14. Moreover, individuals who had low maximum oxygen uptake (VO2max) performed less physical activity. Therefore, physical activity, rather than nut consumption, could be the reason for higher VO2max levels. Accordingly, it has been suggested that volunteers who are more fit (with a higher VO2max) are also more likely to be health conscious and, for this reason, consume fewer treat/snack-type foods [45]. The authors in [45] found that with an increase in fitness, volunteers reported consuming more vegetables, fruits, and multigrain bread and fewer sugar-sweetened drinks, sweets, chocolates, and fries [45]. Conversely, in the Coronary Artery Risk Development in Young Adults (CARDIA) study, fruit–vegetable patterns were positively associated with the CRF, as assessed by the duration of exercise on a graded exercise treadmill, among white women only; however, the diet-quality score was positively associated with CRF among both black and white adults [46]. High physical activity entails both high caloric intake and high levels of exhaled carbon dioxide (CO2) but remains one of the primary prevention strategies for improving health. A lower respiratory-exchange ratio (“ecologically friendly”) along with a very-low-carbohydrate ketogenic diet among trained individuals was accompanied by a reduction in both fat mass (−0.78 kg) and fat-free mass (−1.82 kg) [47].
The presence of health consciousness among individuals with high fitness levels has been previously suggested [45], and the sub-score of ORTO-7 (excluding items 2, 5, 6, 8, 10, 12, 14, and 15) [48] was related to the FM% among gym attendees [49]. However, two of the items (item 2 and item 14) with median scores suggestive of orthorexia in both groups were among those excluded by ORTO-7 (2) “When you go in a food shop, do you feel confused?” and 14) “Do you think that there is also unhealthy food on the market?”). These items could be associated with healthy orthorexia, rather than orthorexia nervosa. The former can serve as a protective behavior [50,51,52] correlated with body appreciation, physical activity, and fruit and vegetable consumption [53], whereas the latter can be observed among individuals practicing sport activities [54]. Dietary advice for muscularity among men’s health magazines often includes increases in caloric and protein intake, including the intake of sports foods, supplements, red meat, and fish, as well as eggs, nuts, and legumes [55]. The EAT-Lancet Commission, which provides a range of zero to 60% for energy intake from cereals [6], did not consider complementary proteins in its suggested dietary plan. Moreover, whereas legumes, which contain limited contents of sulfur-containing Amino Acid (AA), are complementary proteins for limiting amino acid lysine in cereals [56]. Lysine (as well as methionine [57]) was reported to be a limiting AA in almonds [57,58], which were among the most frequently consumed nuts in the present study. Other authors reported the following as limiting AAs: lysine (hazelnuts, brazil nuts, walnuts, cashew nuts, and pine nuts), the sulfur-based amino acids methionine and cysteine (almonds), tryptophan (pecans and macadamias), and threonine (peanuts) [59]. Rather than relying upon nut consumption to acquire vegetable proteins, the consumption of complementary proteins from legumes and cereals should be preferred to improve both human and planetary health.
As expected from the differences between the two scores for adherence to the Mediterranean diet, we observed high MDS-14 scores among nut consumers (nut consumption questions were included) but no differences in the MEDScore-55 results between groups. Although the EAT-Lancet Commission suggested a higher consumption of nuts compared to that in the healthy Mediterranean style [7], the inclusion of nuts among the proteins from vegetable sources implicates greater energy from lipids [9], as observed in our study. Due to the low score assigned to alcohol consumption, MEDScore-55 can be considered healthier according to the latest national guidelines for nutrition [60], in addition to having a low environmental impact [6]. In the present study, the percentage of adherence to the Mediterranean was higher with MEDScore-55 (61% for nut consumers and 56% for non-nut consumers) than with MDS-14 (52% for nut consumers and 46% for non-nut consumers).
4.3. Limitations
This study has some limitations, and our findings should thus be interpreted carefully. First, generalization to the whole population cannot be accomplished due to the limited sample size and the study design. Moreover, food consumption may be conditioned by the geographical diversity of the Italian population, as different cultural traditions could play important roles in food selection and dietary choices. Another limitation of the study was the exclusive selection of male individuals. For these reasons, further research should consider these limitations.
5. Conclusions
In conclusion, although health benefits were observed for both nut and legume consumption [1], our study indicates that concerns exist regarding nut consumption (fat content), as previously suggested [9]. Legumes possess a better macronutrient profile than nuts for maintaining a healthy diet due to the generally high protein contents and low amounts of fats in legumes [1]. Thus, an optimal nutritional profile in the Italian meal context could be achieved by combining legumes and cereals. Understanding how nuts are perceived by consumers and health professionals, including the main factors of consumption, may help develop communication campaigns to avoid the excessive intake of nuts among consumers.
Author Contributions
Conceptualization, I.P.; investigation, E.T., A.R., L.M. and I.P.; data curation, E.T., A.R. and L.M.; writing, I.P., E.T. and G.S. All authors have read and agreed to the published version of the manuscript.
Funding
This research received no external funding.
Institutional Review Board Statement
The study was conducted according to the guidelines of the Declaration of Helsinki and notified to the Lazio-2 Ethics Committee (study 164.18, 0197220/2018, protocol n. 0047966-15 March 2019; this kind of study does not require approval but notification only), Rome.
Informed Consent Statement
Informed consent was obtained from all individuals involved in the study.
Data Availability Statement
The data are not publicly available (volunteers signed consent to publish only cumulative data).
Conflicts of Interest
The authors declare no conflict of interest.
References
- Martini, D.; Godos, J.; Marventano, S.; Tieri, M.; Ghelfi, F.; Titta, L.; Lafranconi, A.; Trigueiro, H.; Gambera, A.; Alonzo, E.; et al. Nut and legume consumption and human health: An umbrella review of observational studies. Int. J. Food Sci. Nutr. 2021, 72, 871–878. [Google Scholar] [CrossRef]
- Micek, A.; Godos, J.; Cernigliaro, A.; Cincione, R.I.; Buscemi, S.; Libra, M.; Galvano, F.; Grosso, G. Total Nut, Tree Nut, and Peanut Consumption and Metabolic Status in Southern Italian Adults. Int. J. Environ. Res. Public Health 2021, 18, 1847. [Google Scholar] [CrossRef]
- Neale, E.P.; Tran, G.; Brown, R.C. Barriers and Facilitators to Nut Consumption: A Narrative Review. Int. J. Environ. Res. Public Heal. 2020, 17, 9127. [Google Scholar] [CrossRef] [PubMed]
- Vaisman, N.; Press, J.; Leibovitz, E.; Boehm, G.; Barak, V. Short-Term Effect of Prebiotics Administration on Stool Characteristics and Serum Cytokines Dynamics in Very Young Children with Acute Diarrhea. Nutrients 2010, 2, 683–692. [Google Scholar] [CrossRef]
- Hong, L.; Yao, L.; Xie, P.; Li, W. An empirical study on consumer purchase intention for nuts and influencing factors—Survey based on consumers from Zhejiang. Food Control 2020, 117, 107343. [Google Scholar] [CrossRef]
- Willett, W.; Rockström, J.; Loken, B.; Springmann, M.; Lang, T.; Vermeulen, S.; Garnett, T.; Tilman, D.; DeClerck, F.; Wood, A.; et al. Food in the Anthropocene: The EAT–Lancet Commission on healthy diets from sustainable food systems. Lancet 2019, 393, 447–492. [Google Scholar] [CrossRef]
- Blackstone, N.T.; Conrad, Z. Comparing the Recommended Eating Patterns of the EAT-Lancet Commission and Dietary Guidelines for Americans: Implications for Sustainable Nutrition. Curr. Dev. Nutr. 2020, 4, 1–5. [Google Scholar] [CrossRef]
- Vitale, M.; Giosuè, A.; Vaccaro, O.; Riccardi, G. Recent Trends in Dietary Habits of the Italian Population: Potential Impact on Health and the Environment. Nutrients 2021, 13, 476. [Google Scholar] [CrossRef] [PubMed]
- Tucci, M.; Martini, D.; Del Bo’, C.; Marino, M.; Battezzati, A.; Bertoli, S.; Porrini, M.; Riso, P. An Italian-Mediterranean Dietary Pattern Developed Based on the EAT-Lancet Reference Diet (EAT-IT): A Nutritional Evaluation. Foods 2021, 10, 558. [Google Scholar] [CrossRef]
- Kranz, S.; Hill, A.; Fleming, J.A.; Hartman, T.J.; West, S.G.; Kris-Etherton, P.M. Nutrient displacement associated with walnut supplementation in men. J. Hum. Nutr. Diet. 2014, 27 (Suppl. 2), 247–254. [Google Scholar] [CrossRef]
- Tindall, A.M.; Petersen, K.S.; Lamendella, R.; Shearer, G.C.; E Murray-Kolb, L.; Proctor, D.N.; Kris-Etherton, P.M. Tree Nut Consumption and Adipose Tissue Mass: Mechanisms of Action. Curr. Dev. Nutr. 2018, 2, nzy069. [Google Scholar] [CrossRef] [PubMed]
- Witkowska, A.M.; Waśkiewicz, A.; Zujko, M.E.; Szcześniewska, D.; Śmigielski, W.; Stepaniak, U.; Pająk, A.; Drygas, W. The Consumption of Nuts is Associated with Better Dietary and Lifestyle Patterns in Polish Adults: Results of WOBASZ and WOBASZ II Surveys. Nutrients 2019, 11, 1410. [Google Scholar] [CrossRef] [PubMed]
- Santi-Cano, M.J.; Novalbos-Ruiz, J.P.; Jiménez, M.A.B.; Bibiloni, M.D.M.; Tur, J.A.; Martin, A.R. Association of Adherence to Specific Mediterranean Diet Components and Cardiorespiratory Fitness in Young Adults. Nutrients 2020, 12, 776. [Google Scholar] [CrossRef] [PubMed]
- Plichta, M.; Jezewska-Zychowicz, M. Eating behaviors, attitudes toward health and eating, and symptoms of orthorexia nervosa among students. Appetite 2019, 137, 114–123. [Google Scholar] [CrossRef]
- Attlee, A.; Atmani, N.; Stromtsov, V.; Ali, F.; Tikarly, R.; Ryad, S.; Salah, G.; Hasan, H.; Obaid, R.S. Assessment of Weight Management Practices among Adults in the United Arab Emirates. J. Nutr. Metab. 2017, 2017, 1–9. [Google Scholar] [CrossRef]
- Linhares, A.O.; Gigante, D.P.; Linhares, R.D.S.; Minten, G.C.; Horta, B.L. Prevalence of weight-loss strategies of young adults from the 1982 birth cohort in Pelotas, RS. Rev. Bras. Epidemiol. 2013, 16, 737–747. [Google Scholar] [CrossRef][Green Version]
- Frank, R.; Claumann, G.S.; Felden, E.P.G.; Silva, D.A.S.; Pelegrini, A. Body weight perception and body weight control behaviors in adolescents. J. Pediatr. 2018, 94, 40–47. [Google Scholar] [CrossRef]
- Radwan, H.; Hasan, H.A.; Ismat, H.; Hakim, H.; Khalid, H.; Al-Fityani, L.; Mohammed, R.; Ayman, A. Body Mass Index Perception, Body Image Dissatisfaction and Their Relations with Weight-Related Behaviors among University Students. Int. J. Environ. Res. Public Health 2019, 16, 1541. [Google Scholar] [CrossRef]
- Van Nee, R.; Larsen, J.K.; Fisher, J.O. Direct effects of food cues seen during TV viewing on energy intake in young women. Appetite 2016, 101, 80–85. [Google Scholar] [CrossRef]
- Chen, R.; Smyser, M.; Chan, N.; Ta, M.; Saelens, B.; Krieger, J. Changes in awareness and use of calorie information after mandatory menu labeling in restaurants in King County, Washington. Am. J. Public Health 2015, 105, 546–553. [Google Scholar] [CrossRef]
- Martínez-González, M.A.; García-Arellano, A.; Toledo, E.; Salas-Salvadó, J.; Buil-Cosiales, P.; Corella, D.; Covas, M.I.; Schröder, H.; Arós, F.; Gómez-Gracia, E.; et al. A 14-Item Mediterranean Diet Assessment Tool and Obesity Indexes among High-Risk Subjects: The PREDIMED Trial. PLoS ONE 2012, 7, e43134. [Google Scholar] [CrossRef] [PubMed]
- Panagiotakos, D.B.; Milias, G.A.; Pitsavos, C.; Stefanadis, C. MedDietScore: A computer program that evaluates the adherence to the Mediterranean dietary pattern and its relation to cardiovascular disease risk. Comput. Methods Programs Biomed. 2006, 83, 73–77. [Google Scholar] [CrossRef]
- Valkovic, L.; Chmelík, M.; Ukropcova, B.; Heckmann, T.; Bogner, W.; Frollo, I.; Tschan, H.; Krebs, M.; Bachl, N.; Ukropec, J.; et al. Skeletal muscle alkaline Pi pool is decreased in overweight-to-obese sedentary subjects and relates to mitochondrial capacity and phosphodiester content. Sci. Rep. 2016, 6, 20087. [Google Scholar] [CrossRef] [PubMed]
- Available online: https://www.crea.gov.it/-/tabella-di-composizione-degli-alimenti (accessed on 15 August 2021).
- Available online: https://ndb.nal.usda.gov/ndb/ (accessed on 15 August 2021).
- Toti, E.; Raguzzini, A.; Fedullo, A.L.; Cavedon, V.; Milanese, C.; Bernardi, M.; Mariani, B.M.; Massaro, L.; Mellara, F.; Sciarra, T.; et al. Longitudinal Effects of Dietary Advice on Wheelchair Basketball Athletes: Nutritional and Environmental Aspects. Sustainability 2021, 13, 5244. [Google Scholar] [CrossRef]
- Available online: https://sinu.it/tabelle-larn-2014/20141111_LARN_Porzioni.pdf (accessed on 15 August 2021).
- Available online: https://www.barillacfn.com/en/double_pyramid_technical_data/ (accessed on 15 August 2021).
- Bacenetti, J.B.; Bava, L.; Schievano, A.; Zucali, M. Whey protein concentrate (WPC) production: Environmental impact assessment. J. Food Eng. 2018, 224, 139–147. [Google Scholar] [CrossRef]
- Available online: http://www.societaitalianadiendocrinologia.it/public/pdf/questionario_ipaq.pdf (accessed on 15 August 2021).
- Donini, L.M.; Marsili, D.; Graziani, M.P.; Imbriale, M.; Cannella, C. Orthorexia nervosa: Validation of a diagnosis questionnaire. Eat. Weight. Disord. Stud. Anorexia Bulim. Obes. 2005, 10, e28–e32. [Google Scholar] [CrossRef] [PubMed]
- Dossier Scientifico delle Linee Guida per una sana alimentazione (Edizione 2018). Available online: https://www.crea.gov.it/web/alimenti-e-nutrizione/dettaglio-news/-/asset_publisher/jVGiA47VZNMv/content/nuove-linee-guida-per-una-sana-alimentazione-edizione-2018- (accessed on 15 August 2021).
- Brown, R.; Gray, A.; Chua, M.; Ware, L.; Chisholm, A.; Tey, S. Is a Handful an Effective Way to Guide Nut Recommendations? Int. J. Environ. Res. Public Health 2021, 18, 7812. [Google Scholar] [CrossRef]
- Vitiello, V.; Germani, A.; Capuzzo Dolcetta, E.; Donini, L.M.; Del Balzo, V. The New Modern Mediterranean Diet Italian Pyramid. Ann Ig 2016, 28, 179–186. [Google Scholar] [CrossRef]
- Serafini, M.; Toti, E. Unsustainability of Obesity: Metabolic Food Waste. Front. Nutr. 2016, 3, 40. [Google Scholar] [CrossRef]
- Yong, L.C.; Gray, A.R.; Chisholm, A.; Leong, S.L.; Tey, S.L.; Brown, R.C. Barriers to and facilitators and perceptions of nut consumption among the general population in New Zealand. Public Health Nutr. 2017, 20, 3166–3182. [Google Scholar] [CrossRef]
- Wongprawmas, R.; Mora, C.; Pellegrini, N.; Guiné, R.P.F.; Carini, E.; Sogari, G.; Vittadini, E. Food Choice Determinants and Perceptions of a Healthy Diet among Italian Consumers. Foods 2021, 10, 318. [Google Scholar] [CrossRef]
- Onwezen, M.C.; Bouwman, E.P.; Reinders, M.J.; Dagevos, H. A systematic review on consumer acceptance of alternative proteins: Pulses, algae, insects, plant-based meat alternatives, and cultured meat. Appetite 2010, 159, 105058. [Google Scholar] [CrossRef]
- Toti, E.; Massaro, L.; Kais, A.; Aiello, P.; Palmery, M.; Peluso, I. Entomophagy: A Narrative Review on Nutritional Value, Safety, Cultural Acceptance and A Focus on the Role of Food Neophobia in Italy. Eur. J. Investig. Health Psychol. Educ. 2020, 10, 46. [Google Scholar] [CrossRef] [PubMed]
- Sogari, G.; Menozzi, D.; Hartmann, C.; Mora, C. How to Measure Consumers Acceptance towards Edible Insects?—A Scoping Review about Methodological Approaches; Sogari, G., Mora, C., Menozzi, D., Eds.; Springer: Cham, Switzerland, 2019. [Google Scholar] [CrossRef]
- Placentino, U.; Sogari, G.; Viscecchia, R.; De Devitiis, B.; Monacis, L. The New Challenge of Sports Nutrition: Accepting Insect Food as Dietary Supplements in Professional Athletes. Foods 2021, 10, 1117. [Google Scholar] [CrossRef] [PubMed]
- Montalcini, T.; Pujia, A.; Donini, L.M.; Frittitta, L.; Galvano, F.; Natali, A.; Pironi, L.; Porrini, M.; Riso, P.; Rivellese, A.A.; et al. A Call to Action: Now is the Time to Screen Elderly and Treat Osteosarcopenia, a Position Paper of the Italian College of Academic Nutritionists MED/49 (ICAN-49). Nutrients 2020, 12, 2662. [Google Scholar] [CrossRef] [PubMed]
- Vanham, D.; Mekonnen, M.; Hoekstra, A.Y. Treenuts and groundnuts in the EAT-Lancet reference diet: Concerns regarding sustainable water use. Glob. Food Secur. 2020, 24, 100357. [Google Scholar] [CrossRef]
- Harris, F.; Moss, C.; Joy, E.J.M.; Quinn, R.; Scheelbeek, P.F.D.; Dangour, A.D.; Green, R. The Water Footprint of Diets: A Global Systematic Review and Meta-analysis. Adv. Nutr. 2020, 11, 375–386. [Google Scholar] [CrossRef] [PubMed]
- Howe, A.S.; Skidmore, P.M.; Parnell, W.R.; Wong, J.E.; Lubransky, A.C.; Black, K.E. Cardiorespiratory fitness is positively associated with a healthy dietary pattern in New Zealand adolescents. Public Health Nutr. 2016, 19, 1279–1287. [Google Scholar] [CrossRef]
- Shikany, J.M.; Jacobs, D.R.; E Lewis, C.; Steffen, L.M.; Sternfeld, B.; Carnethon, M.R.; Richman, J.S. Associations between food groups, dietary patterns, and cardiorespiratory fitness in the Coronary Artery Risk Development in Young Adults study. Am. J. Clin. Nutr. 2013, 98, 1402–1409. [Google Scholar] [CrossRef]
- McSwiney, F.T.; Fusco, B.; McCabe, L.; Lombard, A.; Crowley, P.; Walsh, J.; Hone, M.; Egan, B. Changes in body composition and substrate utilization after a short-term ketogenic diet in endurance-trained males. Biol. Sport 2021, 38, 145–152. [Google Scholar] [CrossRef]
- Moller, S.; Apputhurai, P.; Knowles, S.R. Confirmatory factor analyses of the ORTO 15-, 11- and 9-item scales and recommendations for suggested cut-off scores. Eat. Weight. Disord. -Stud. Anorexia, Bulim. Obes. 2019, 24, 21–28. [Google Scholar] [CrossRef] [PubMed]
- Toti, E.; Cavedon, V.; Raguzzini, A.; Fedullo, A.L.; Milanese, C.; Bernardi, E.; Bellito, S.; Bernardi, M.; Sciarra, T.; Peluso, I. Dietary Intakes and Food Habits of Wheelchair Basketball Athletes compared to Gym Attendees and Individuals who do not Practice Sport Activity. Endocrine, Metab. Immune Disord. -Drug Targets 2021, 21, 1. [Google Scholar] [CrossRef] [PubMed]
- Barthels, F.; Barrada, J.R.; Roncero, M. Orthorexia nervosa and healthy orthorexia as new eating styles. PLoS ONE 2019, 14, e0219609. [Google Scholar] [CrossRef] [PubMed]
- Depa, J.; Barrada, J.R.; Roncero, M. Are the Motives for Food Choices Different in Orthorexia Nervosa and Healthy Orthorexia? Nutrients 2019, 11, 697. [Google Scholar] [CrossRef] [PubMed]
- Strahler, J. Trait mindfulness differentiates the interest in healthy diet from orthorexia nervosa. Eat. Weight. Disord. - Stud. Anorexia, Bulim. Obes. 2021, 26, 993–998. [Google Scholar] [CrossRef] [PubMed]
- He, J.; Zhao, Y.; Zhang, H.; Lin, Z. Orthorexia nervosa is associated with positive body image and life satisfaction in Chinese elderly: Evidence for a positive psychology perspective. Int. J. Eat. Disord. 2021, 54, 212–221. [Google Scholar] [CrossRef]
- Kiss-Leizer, M.; Tóth-Király, I.; Rigó, A. How the obsession to eat healthy food meets with the willingness to do sports: The motivational background of orthorexia nervosa. Eat. Weight. Disord. -Stud. Anorexia, Bulim. Obes. 2019, 24, 465–472. [Google Scholar] [CrossRef]
- Cook, T.M.; Russell, J.M.; Barker, E.M. Dietary advice for muscularity, leanness and weight control in Men’s Health magazine: A content analysis. BMC Public Health 2014, 14, 1062. [Google Scholar] [CrossRef]
- Devi, S.; Varkey, A.; Dharmar, M.; Holt, R.R.; Allen, L.H.; Sheshshayee, M.S.; Preston, T.; Keen, C.L.; Kurpad, A.V. Amino Acid Digestibility of Extruded Chickpea and Yellow Pea Protein is High and Comparable in Moderately Stunted South Indian Children with Use of a Dual Stable Isotope Tracer Method. J. Nutr. 2020, 150, 1178–1185. [Google Scholar] [CrossRef]
- Ng, S.; Lasekan, O.; Muhammad, K.S.; Hussain, N.; Sulaiman, R. Physicochemical properties of Malaysian-grown tropical almond nuts (Terminalia catappa). J. Food Sci. Technol. 2015, 52, 6623–6630. [Google Scholar] [CrossRef]
- House, J.D.; Hill, K.; Neufeld, J.; Franczyk, A.; Nosworthy, M.G. Determination of the protein quality of almonds (Prunus dulcis L.) as assessed by in vitro and in vivo methodologies. Food Sci. Nutr. 2019, 7, 2932–2938. [Google Scholar] [CrossRef] [PubMed]
- Venkatachalam, M.; Sathe, S.K. Chemical Composition of Selected Edible Nut Seeds. J. Agric. Food Chem. 2006, 54, 4705–4714. [Google Scholar] [CrossRef] [PubMed]
- Available online: https://www.salute.gov.it/imgs/C_17_pubblicazioni_2915_allegato.pdf (accessed on 15 August 2021).


Publisher’s Note: MDPI stays neutral with regard to jurisdictional claims in published maps and institutional affiliations. |
© 2021 by the authors. Licensee MDPI, Basel, Switzerland. This article is an open access article distributed under the terms and conditions of the Creative Commons Attribution (CC BY) license (https://creativecommons.org/licenses/by/4.0/).