Abstract
Several factors over the years have contributed to stigma in public transport. Many studies have highlighted the need to make the transport system more equitable both from economic and gender perspectives. This study attempts to demonstrate how the perceptions of public transport users and non-users are stigmatized from social and cultural standpoints. Thus, it identifies the social and cultural stigma-induced barriers embedded with the use and people’s general perception about the public bus service, taking SAPTCO (Saudi Public Transport Company) as a case study. The study results suggest that privacy concern is the primary cause of stigma. Most of the users are unwilling to ride with their families as SAPTCO does not account for gender needs (e.g., privacy, travel convenience, safety, comfort, etc.). Moreover, people from the high-income classes are more stigmatized against this ridership. A fuzzy inference system (FIS) model is used to analyze the survey questionnaire responses and understand what stigma means for the public bus service. Expert opinions are employed to generate “if–then” rules of the FIS models. Sensitivity of the defined fuzzy model is conducted to different aspects of the ridership. The study results further suggest that “inconvenience” poses the highest impact while “feeling safe”, “privacy”, “fare”, “timing”, and “comfort” are found to be the medium impact-making variables for stigma. The stigma-defining variables would be critical for the public bus service to improve its service quality and help (re-)design the policies that would attract a high amount of ridership. Some solutions are suggested in the end that would complement, strengthen, and promote the current SAPTCO service. The demonstrated methodology of this study would be relevant and adaptive to any relevant context to improve public transportation service and pertaining policies.
1. Introduction
The common definition of stigma shares the notion that people who are stigmatized have (or are believed to have) one or a set of attributes that marks them devalued in the eyes of others [1,2] It also is known as a relationship, which is situated in a social context. The stigma associated with public transportation is not something new. However, its nature of prevalence, targeted people, and consequences are different across the socioeconomic and cultural landscapes [3,4,5]. For instance, stigma against women who choose to ride in public transit has been a critical subject of discussion across many developing and developed nations [6]. Beyond the context of physicality (i.e., public transport), the trajectory of stigma has also prevailed through the virtual space (i.e., social media). The ramification of such stigmatized propaganda on public transport usage has deep adverse consequences on the equal and safe ridership [7]. Public transport users are often stigmatized based on their color, gender, religion, ethnicity, income status, etc. [8]. However, the nature and type of such stigma are also diversified and variable across the countries and regions, including the Middle East.
The recent COVID-19 pandemic has dramatically reduced the use of public transport worldwide. Because of the need to maintain social distancing, safety protocol and growing psychological fear of infection leads the bus users to choose other forms of mobility instead [9,10,11,12]. In Saudi Arabia, the primary public transport users are the expatriate labor force (a common word used in Saudi Arabia to distinguish from the native work force) and a limited number of Saudi nationals from lower- to low–middle-income classes [13].
Because of heavily subsidized and cheap gasoline prices, and higher financial affordability, most Saudi nationals use private cars for daily mobility. The privacy concern and the scarcely available (functional) public transport are also contributing factors in favor of private vehicles for intra-city mobility. SAPTCO (Saudi Public Transport Company) [14] is the only state-owned public transport provider that operates in the major cities and a few towns across the country. There have been discrete plans to expand its operations following a bus rapid transit (BRT) model [15] which should have been integrated to offer a customer-centric standard services quality and (re-)design the infrastructure and operation network as per the demand) [16]. However, the intra-city operation of SAPTCO bus service remains confined only to a few cities i.e., Makkah, Madina, Riyadh, Jeddah, and Dammam Metropolitan Area (DMA), while the associated infrastructure and its quality remain sub-standard and inadequate. The fare for SAPTCO bus service being less costly, it becomes affordable to the expatriate workers as well as lower- and middle-income class Saudi citizens.
Due to a lack of supporting and integrated infrastructure, SAPTCO bus never appears to be popular among the people from higher-middle and high-income segments. The bus service has had a significant amount of recurring investment since the inception of its operation. However, due to a lack of understanding of the nature of demands and ability to design and expand the infrastructure and supporting amenities to cater to the needs, SAPTCO failed to capture its intended market and expand its operations both for intra- and inter-city mobility. This has led to a tiny percentage of population of the country (<2%) that uses SAPTCO bus [17]. Given the status quo, the bus service became less attractive for intra-city mobility while it has been only used by particular users who are frequently branded as “poor” [18]. Such stigmatized perception has also been pervasive for not being able to take the gender and other pertaining needs, notably privacy, comfort, safety, and convenience into account.
From the user and non-user standpoints, this study attempts to analyze the stigmatized barriers that hinders the use of SAPTCO buses. It analyzes the barriers and identifies the presence of stigmas on people’s perception regarding its usage. This study also investigates the problems associated with SAPTCO bus ridership and extracts user perceptions of whether they will use this service for daily mobility, if the problems they are currently confronting are resolved. Finally, the study identifies how public transportation is stigmatized in terms of its sub-standard level of services, prestige, privacy concern, convenience, safety, and other gender-sensitive issues and what needs to be done to standardize the current level of service in line with the integrated fundamentals of BRT. Figure 1 presents the key steps of the study.
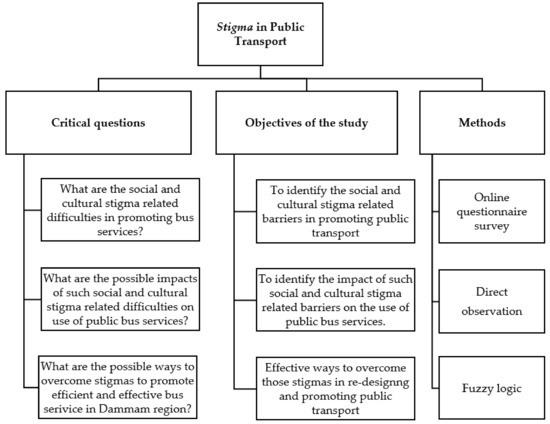
Figure 1.
Key components of the study.
2. Literature Review
2.1. Stigma and Public Transportation
By definition, the word “stigma” means a mark of disgrace or public disapproval of something. It may result from internal psychological processes within the person or interpersonal social processes between individuals and groups influenced by the cultural and political context [19]. The word stigma is mostly associated with physical deformities, blemishes of character and racism, nationalism, and religion [20]. However, the association of stigma with public transportation is quite uncommon. This study aims to identify stigmatized perceptions of public bus service through the lenses of socioeconomic and cultural attributes.
During the 1970s, public transportation was stigmatized in Germany to the extent that it was understood as the mode of transportation for the foreigners, and lower income classes [21]. A similar context was also found in Scotland and the UK, where bus patronization became difficult since people consider it a transportation mode only for the young, elderly, and low-income people (Bus Partnership Forum, 2003). Though the mode choice depends upon the individual’s age, gender, disability, income, accessibility, available mode of transportation, and acceptability [22,23,24,25], the experience or perception associated with a particular type of mode also has a great influence on the choice of a transportation mode [26].
Many studies [27,28,29,30,31,32,33,34,35] suggested that besides instrumental factors such as speed, flexibility, safety, convenience, etc., non-instrumental factors including sensation, power, superiority, arousal, etc. influence the choice of mode for an individual. The modal choice for travel depends on three functions: instrumental, symbolic, and effective [36]. To identify the prevailing factor of a mode choice, a questionnaire survey was conducted in Rotterdam, the Netherlands using factor analysis method. The results suggested that men valued the symbolic function of a car higher than women; younger respondents more strongly valued the affective functions than the older age groups, and low-income groups valued the affective function more than the other income groups. Though factor analysis was used for identifying mode choice behavior [36], other researchers proposes a qualitative study to obtain a better understanding of traveler attitude towards public mode choice [37]. However, the ordered logistic regression model was also applied for measuring the traveler perceptions regarding the service quality and infrastructure facilities of bus stops and train stations in Los Angeles [38]. To analyze the variability of the user behavior and their level of satisfaction other authors suggested both the factor analysis method and ordered logit modeling, where factor analysis helps to discern and recognize the underlying unobserved factors that the respondents perceive [39]. Path analysis, binomial regression, latent variable, and structural equation models are examples of some of the advanced statistical techniques used to reveal the relationship among different variables and examine the predictive power of several variables on overall level of satisfaction [40,41,42,43].
It is noted that not only the behavioral component and socio-demographic or travel characteristics can influence the choice of transport, but also the media describing public transport services can influence the way potential users think about future transit investments [7].
In fact, public transport companies that use Twitter to chat with users about their experiences or new services also have statistically significant positive feelings expressed about them on social media [7].
During 1970s, the “Metropolitan Atlanta Rapid Transit Authority” (MARTA) system was launched, and MARTA turned into “Moving Africans Rapidly through Atlanta”. It was seen as racial stigma rising slowly. A recent study suggests that 70% of the MARTA riders are black, and question rose that “can a city build a less stigmatized bus?” It was noticed that ridership on buses declined due to an increase in income, so many companies introduce various less energy consumable cars aiming to take out people from the cars by providing transit system with better choices that meet the commuting needs [44].
Different authors [45,46] raised a similar question that “I choose not to have a car. Does that make me a choice rider or a captive one?” Planners also felt that problem of “choice” and “captive” and people perception was that car owners have a choice and transit riders are captive—they don’t have any other alternatives. But “captive” and “choice” are thought to be endpoints where all people don’t have “choice”. Sometimes they have cars, but not trustworthy or they cannot afford the fuel cost.
Our society is responsible for a split in each service such as public transport for poor people. The US politicians and policymakers provide bus transit for everyone, but it became stigmatized due to poor management skillsets, although it has good impacts on the emission reduction [47].
The U.S history of transportation policies and transit funding that buses are the least attractive way to travel; only commuters are those who do not have any other choice [48]. In Chicago, most people prefer to travel on trains compared to buses, while in other small towns, people prefer to travel on streetcars. Overall, thinking remains the same that buses are only for those who do not have a choice, are poor, and from minority groups. Furthermore, he emphasized that if authorities want to increase ridership of buses, they must modify buses according to trains to offer riders the choice and satisfaction. Moreover, the design of buses similar to trains, i.e., separate sections for each class, shades, and waiting rooms, will enhance the bus ridership and reduce the associated stigma [49].
Other studies define mobility issues for diffident ages, gender, and class of people [50]. They took a close look over travel patterns in two cities, and it reveals big differences for gender and class while observing travel patterns in both cities. It became clear that respondents from the poorer and old residential neighbors walk more, while people of the newly developed areas use more motor vehicles. This work analyzed the stigma that is not only related to the traditional buses but also a new bus rapid transit (BRT) to understand if users prefer this dedicated form of transport and if it can solve some of the problems with bus usage. In this sense, cities are looking for sustainable modes of transport that can discourage the use of private vehicles and transport residents quickly, efficiently, and safely on their roads. One such solution is rapid transit by bus (BRT), a high-speed transit system in cities, where buses travel on dedicated routes.
The latest research shows that BRT can reduce travel times by millions of hours for commuters [51]. In addition, according to [52,53], BRT improves the quality of life in cities in at least four key ways: (i) saving travel time, (ii) reducing greenhouse gases (GHG) and local air pollutant emissions, (iii) improving traffic safety and (iv)increasing physical activity. In particular, dedicated lanes separate BRT buses from mixed traffic, allowing them to travel faster through a city. In a similar way to subways, stops can be characterized by prepaid boarding platforms and level platforms that speed up passenger boarding, while the management of road signs that gives priority to BRT buses and high-frequency bus service reduces waiting times to a minimum. These features have a significant positive impact in the cities where BRT systems operate [54,55].
The implementation of BRT systems contributes to reducing road accidents and fatalities in several ways [56]. This results in fewer drivers on the road and a safer transport environment for drivers, pedestrians, and cyclists. Secondly, bus lanes reduce the interaction between buses and other vehicles, minimizing the risk of road accidents. It is also necessary to promote a better design of terminal and waiting areas to reduce or mitigate potential conflicts and, therefore, accidents of pedestrians or users of the BRT waiting service [57]. Moreover BRT systems also increase the physical activity of passengers due to the spacing of BRT terminals, which tend to require quite longer walking distances than private and other motorized vehicles [58].
“BRT systems in Australasia” highlights infrastructure, development characteristics, and operations. Lessons learned from operation and implementation are also reviewed. His study also demonstrates that no large-scale systems were developed for over a decade despite early interest in the Adelaide busway. The performance of BRT has been well beyond expectations in both Adelaide and Brisbane busways. However, BRT could not supersede the choice in favor of light rail and heavy rail [59].
An analysis of the current level of service provision in Cape Town by public transport has been addressed in the literature [60]. For assessing BRT’s role in the improvement of services, especially for poor people those are users, effects of transformation to IRT (Integrated Rapid Transit) and current conditions were analyzed together that conversion from BRT to IRT will not contribute much more to address social issues of segregation of stigmatized public transport. The safety and level of service (LOS) of the BRT system can be evaluated in a preventive manner through microsimulation, assuming different types of users and different geometries with or without dedicated lanes [61].
Additionally, BRT has emerged as an efficient and cost-effective transport system for urban mobility that offers safe and high-quality transport services for city dwellers, as described in a study focusing on South Asia, where user needs may be diverse including comfort [62]. Moreover the accessibility to BRT has a positive impact on the nearby property prices [63,64].
Recently, public transport services are complemented with shared mobility and demand-responsive transit (DRT) in many parts of the world. Both solutions are sustainable, especially if they involve the use of hybrid or electric means of transport [65,66]. These modal choices allow the sharing of a single means of transport, but while the car-sharing service requires a driver, the DRT service allows users without a driver’s license to use it, requiring both fixed and demand-responsive stops, in some cases modifying the route. In particular, DRT allows the connection of areas of weak demand or that are inadequately serviced, i.e., peripheral areas or areas where the public transport service has been reduced or canceled due to the pandemic [67,68].
2.2. Fuzzy Inference System (FIS) and Public Transportation
Participant attitudes, as with their satisfaction, are inherently uncertain in assessing the features of a survey, including quality-type non-numerical perceptions [69].
Fuzzy linguistic computing provides a robust tool in analyzing survey questionnaires [69,70,71,72] by processing the intrinsic uncertainties and vagueness in participant responses [72].
The domain of a fuzzy variable is a group of pre-defined fuzzy concepts, such as very low, low, medium, high, and very high, in evaluating a survey questionnaire [72]. Statistical analysis of the responses is an effective approach to derive critical information from a survey questionnaire. However, the linguistic variables used in the questionnaire, such as satisfactory/dissatisfactory, strongly satisfactory/dissatisfactory, and neutral are fuzzy languages that possess a vague nature that expresses the real situation. Fuzzy relation can be used to assess the aggregative evaluation [70] and to aggregate fuzzy views in survey analysis using 2-tuple fuzzy linguistic [70,72].
A methodology for a descriptive analysis of responses in a questionnaire with fuzzy ratings was demonstrated in [69]. In evaluating a survey, it was shown that there usually is a difference in fuzzy linguistic encoding and statistical conclusions, where using the fuzzy rating was recommended for significant statistical conclusions.
The public perception of the transition to a hydrogen transport system based on data collection through a survey questionnaire were examined [70]. The Fuzzy Cognitive Mapping technique was employed to investigate user insights. The impacts of sharing economy on sustainability in two major transportation platforms in Iran were investigated by studying the cause-effect relationship between the variables, using the fuzzy Delphi method and fuzzy cognitive maps based on aggregated expert opinions to identify the most relevant variables [73].
A fuzzy inference system (FIS) was employed to model the demand of the induced trips, i.e., the extra trips that are traveled because of the improvement in the conditions of travel, based on data from a survey questionnaire [74].
The developed FIS was used to evaluate the change in the number of passengers with respect to two variables i.e., the connection time (i.e., the time between arrivals of transit vehicles) and the passengers’ saved time. A FIS modeling was applied to identify the severity of traffic congestion levels based on real-world data of highways in Hungary [75]. The inputs to the FIS model were traffic flow and segment capacity. The model had 75 rules developed based on the data and expert opinions. Moreover, the Mamdani inference system was used by [76] to develop a framework to help the transportation managers deploy available resources considering three FISs for the occurrence of fog, risk conditions of the road, and priority of deployment.
2.3. Development of Equity and Gender Equality for the Improvement of Public Transport
Several research underline the importance of psychosocial and cultural factors in transport choices. They generally investigate travel habits such as travel frequency or travel motivation. Some studies focus on the condition of equity and gender equality in transport choices, showing that in different parts of the world there is still no equality due to several factors (e.g., environmental, cultural, political, religious, etc.).
A study conducted in Mexico City investigated how women pursue mobility despite hostile and violent conditions that immobilize them, highlighting through the data acquired that gender-based violence in public transport and at the same time describing Mexico City as an example where women-only transport played a role in changing traditional gender norms that reinforced violence against women commuters [77]. The problem of sexual violence and stalking in waiting areas or on board transport is one of the factors that most reduce the use of public transport as demonstrated in a study conducted in Santiago de Chile [78]. Another study focusing on the city of Bogota shaded lights on how socioeconomic and gender inequalities can be increased by differences in transport accessibility. The survey found that accessibility to transport differs between men and women with a similar socioeconomic background and because of these differences, women have less access to transport for work; furthermore, differences are stronger in low-income socioeconomic areas [79]. Many studies in the literature have helped to establish the differences in the daily practices of men and women of different socioeconomic strata, as well as the characteristics of access to different transport systems and have pointed out that women generally travel less than men and spend more than men on transport, although their journeys can be shorter. This has led to less accessibility of transport to the workplace but also some criticalities in daily life especially in the lower socioeconomic areas of the world [80].
Some of the studies have also shown that the experience of a woman traveling in urban areas is dramatically different from that of a man in the same city from that of a man. To date, the experiences of women in the public transport space are little examined [81]. Perceived safety in both urban spaces and transport systems often influences lifestyles. Negative events such as stalking or violence near waiting areas of transport systems deeply influence modal choices and frequency of use [81]. Gender inequality is major obstacle to sustainable development, economic growth, and equal and safe access to services such public transportation. Goal 5 of Agenda 2030 aims to achieve equal opportunities between women and men in economic development, the elimination of all forms of violence against women and girls and equal rights at all levels of participation and enjoying public services [82].
3. Materials and Methods
In general, data (and opinion) collection can be both ad hoc and periodic and are carried out using different methods, including questionnaires survey. Its administration takes place on paper, online (both face-to-face and self-administered) surveys or through focus groups [83]. Adopting an online and self-administered questionnaire method, this study received 288 responses of which 257 were found valid. Responses in 31 questionnaires were found inconsistent and that is why they were not accounted for further consideration. Out of 257 respondents, 200 were SAPTCO bus non-users who opined based on their perceptions (what they have observed or hear from others), and 57 were the bus users who had firsthand experiences of the ridership. The average time to complete the questionnaire was about 12 min. The questions used in the questionnaire were mixed—short and close ended in nature. With this short survey time, the effects of fatigue causing a distorted response were minimized.
The study adopted a stratified random sampling technique where Saudi and non-Saudi respondents were 70 and 30% respectively. Thus, the sampling of respondents was done on a random manner so that a heterogeneous group with a diversity of socioeconomic backgrounds and employment types could be generated. Some of the questions were specifically designed to identify challenges that are associated with infrastructure, for example, the location and design of bus stops, bus routes and walking distance to the nearest bus stop, among others.
The survey produced a variable cognitive understanding of stigmas within the cohorts shown in Figure 2. Specifically, it shows that 64% of the respondents are service holders, such as office workers, engineers, lab workers, and administrative officers, while the rest are drivers, salespeople, and students. About 70% of them have a monthly income that falls in the range of USD 1333 to USD 2666.
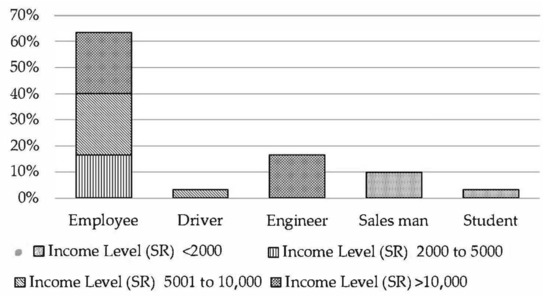
Figure 2.
Distribution of respondents as per the income status and employments.
As far as the origins of the respondents are concerned, 36.7% of respondents are from Khobar, and 20% and 10% come from Dammam and Dhahran respectively, while the remaining ones are from Qatif and Al-Hasa regions. Although SAPTO bus does not operate through Qatif and Al-Hasa, respondents from these regions have either firsthand experience of the bus ridership or a perception about its service quality.
The quality of responses (quantitative and qualitative) is evaluated while triangulating with the information obtained from the observations. The observations include the presence and quality of the bus stops and the interior environment of the bus, staff behavior, bus routes and schedule, and seat allocation for women, among others. As per the study focus, data are initially processed in SPSS for descriptive analysis and ready them for further application of fuzzy logic. Expert opinions were also obtained to prioritize and assign weightage for each variable to be analyzed under a fuzzy inference system (FIS) model.
3.1. Description of the Study Area
No study related to Saudi Arabia has been conducted to reveal the attributes that are associated with infrastructure, services, and amenities that make public transit less popular and stigmatized. It is currently unclear whether such stigmatized perception prevails only among those who use the bus service or whether non-users also contribute to this growing negative notion. Therefore, it was considered essential to focus the study on the nature of the constituents of this passive negative perception. A recent and growing concern among policy makers and planners has spread regarding the stigmatized barriers that negatively affect the image and use of public transport in the Kingdom of Saudi Arabia [84]. That stems the need to evaluate the service offered by SAPTCO, focusing on how it is perceived by both users and non-users and investigating the variables that constitute stigma. According to Saudi Arabia’s Tenth Development Plan, the government has taken a major step towards development in the transport and communications sector, and budget allocations on this sector show an upswing of more than 70% compared to its previous Ninth Development Plan. Some of the main objectives of the Tenth Development Plan relate to improvements through the provision of highly efficient transport services and the upgrading of safety standards in SAPTCO’s various modes of transport.
Unfortunately, SAPTCO has minimized city services due to the lack of infrastructure for city bus services [85], which shows a sheer mismatch with the country’s Tenth Development Plan. According to the Saudi Arabian National Transportation Strategy (2011), urban bus transport is not fully developed, and the initial concessions for bus services did not produce the desired service levels. In addition, public transport reform was not high on the overall policy agenda due to declining demand on the number of bus users and the financial unfeasibility of planned operations [86]. This was reflected in SAPTCO’s limited coverage of intra-city transport across the Dammam Metropolitan Area (DMA), consisting of Dammam, Khobar, Dhahran, Qatif, and Hasa city, which has not been expanded over time (see Figure 3).
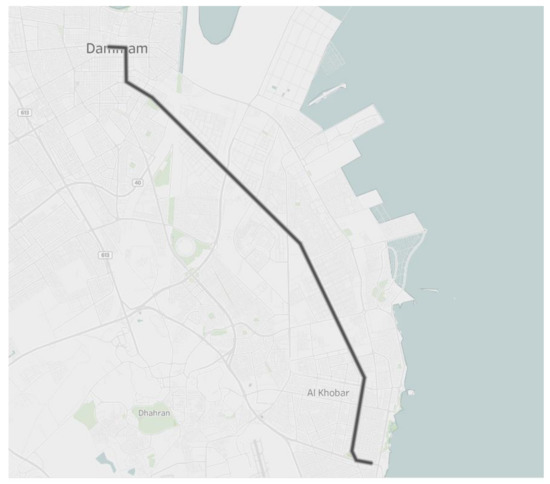
Figure 3.
SAPTCO unchanged bus route map from Rahmaniya mall of Khobar to SEIKO building in Dammam.
3.2. Preliminary Processing of Data from Online Survey
The opinion about bus services of both users and non-users holds great significance in mitigating the negative impacts associated with the transport systems [87,88] Therefore, it is recommended to assess public transport service quality through questionnaire survey and/or focus group discussions, as appropriate, to identify the factors that potentially influence people’s perceptions and determine their satisfaction or dissatisfaction with the public transport service. Studies carried out in major cities, such as Lisbon, suggest that service improvement is influenced by the compatibility between the use of public transport and the level of service in compliance with timetables and appropriate response to the user needs [89].
An intensive review of the literature makes it possible to select and calibrate the questions related to quantitative parameters to know the social and cultural barriers related to stigma in the promotion or demotion of SAPTCO bus service. Thus, the study is carried out in steps with a statistical evaluation of the social and cultural variables that influence the modal choice of the users along with their impression about the variables that could define their preferences or reservation over SAPTCO bus ridership. Non-user perceptions are also evaluated on what would make them choose or not to opt for SAPTCO bus. Figure 4 summarizes the key methodological steps followed in this study.
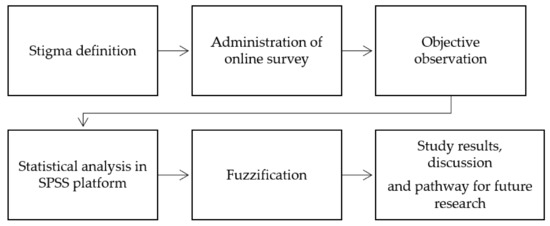
Figure 4.
Key methodological steps.
3.3. Modeling “Stigma” Using Fuzzy Inference System (FIS) and Expert Opinions
Using FIS, two different fuzzy models are developed to define the stigma. In a FIS, fuzzy set theory is employed to map the inputs (i.e., the responses to the questionnaire) to the output (i.e., stigma) [90].
The Sugeno type FIS is used in the proposed definition algorithm [91], whereas the rules are defined based on expert advice. Figure 4 shows the overall configuration of a FIS, composed of fuzzification, rules, aggregation, and defuzzification [76,92]. The membership functions (MFs) of the inputs and the output are selected to be : Very Low, : Low, : Medium, : High, and : Very High. In the inputs that can only take three values, the MFs are : Very Low, : Medium, and : Very High. Gaussian, Trapezoidal and Triangular functions are the common MFs [92].
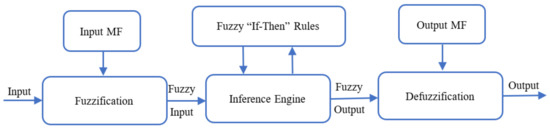
Figure 5.
Topology of the functional blocks in the fuzzy inference system.
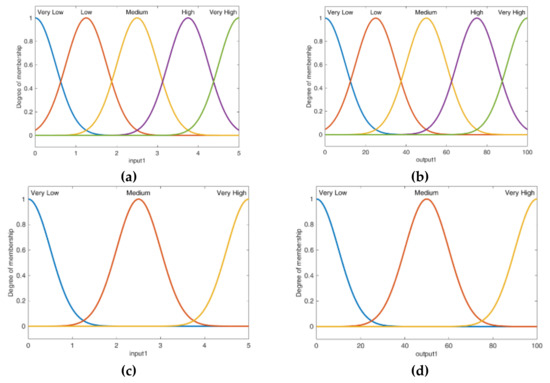
Figure 6.
Input and output membership functions (MFs). (a) the input with 5 MFs. (b) the output with 5 MFs. (c) the input with 3 MFs. (d) the output with 3 MFs.
The if–then rules are defined based on expert understanding of the stigma with the FIS Rules Structure as
where , and are the indices of the MFs. The proposed fuzzy models to define the stigma are described in the following. First, the questions are listed in Table 1 and abbreviated for briefness.

Table 1.
Variables definition for sensitivity analysis with direct (D) or reverse (R) impact.
Then, the questions are categorized based on their effect on the stigma as direct and reverse impacts based on expert opinions. For instance, the impact of Q4 on the definition of stigma is marked as reversed, which means that if the answer to Q4 is low, then the stigma will be high.
Conversely, the impact of Q6 on the definition of stigma is marked as direct, which means that if the answer to Q6 is low, then the stigma will be low. The rules of the FISs are defined based on the reverse/direct impacts of the variables on the stigma regarding public perception. A more detailed description of Table 1 can be found in the Appendix A.
3.3.1. Stigma Fuzzy Model 1
In the first proposed model, the rules are separately defined with respect to the impact of the responses, as shown in Table 1.
Three FISs are defined (i.e., , where the superscript 1 indicates the model I). The first and the second FISs are for the input variables with reverse and direct impacts, respectively, as shown in Table 2.
Table 2.
Model I: Rules of the FISs.
The overall configuration of the proposed model to define the stigma using FISs is depicted in Figure 6. The weight properties of the rules of the FISs are set to 1, and thus all variables’ rules have equal weights in the stigma model. The total stigma is calculated by averaging the stigma calculated for each individual using the above-mentioned rules, as shown in Figure 6. In the proposed FIS model shown in Figure 6, the total number of input is N = 16, because there was primarily 18 variables (questions) in the survey questionnaire considered to be the inputs to the model. A total of 15 questions are considered individually, while 3 questions are considered together as inputs to the sub-model . Therefore, N is chosen as N = 15 + 1 = 16 in the averaging box in Figure 7.
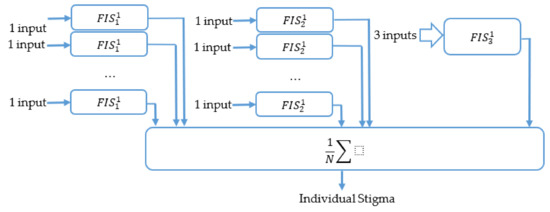
Figure 7.
The proposed fuzzy model 1 to define the stigma (N = 16 is the number of set of Questions).
3.3.2. Stigma Fuzzy Model 2
In the second method, multiple FISs are employed to develop the model defining the stigma, as shown in Table 3. Four FISs are defined as as shown in Figure 7. The inputs of are the outputs of , where each has respectively 7, 8, and 3 inputs. Hence, has 3 inputs.
Table 3.
Model 2: Rules of the FISs.
The rules are designed based on expert opinions, and their weights are shown in Table 3.
The overall configuration of the proposed multiple FIS model is shown in Figure 8.
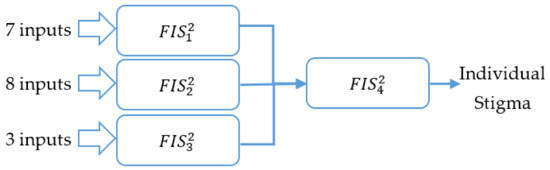
Figure 8.
The proposed fuzzy model (2) to define the stigma.
4. Study Results
4.1. Reflection: Non-User Perceptions and User Experience
The study finds that 50% of the respondents did not use SAPTCO bus at all, which gives a major clue about the barriers and reluctance against availing this service. However, many of the respondents traveled by SAPTCO bus at least once, although none of them were regular travelers. It turns out that only 20% of bus stops are located within a walking distance (i.e., >1 km) while the remaining are far (+1 km) from the respondent points of origin i.e., home, office, marketplaces, etc. People’s ignorance about the location of the bus stops also suggests two possible scenarios: (i) they are not interested to take SAPTCO bus and (ii) infrastructure (e.g., bus route, interior design, and environment, etc.) associated with SAPTCO bus is below standard and poorly maintained. This is further clarified by the fact that 67% of the respondent do not use SAPTCO bus as it does not have a route to their origins or destinations (e.g., office, home, etc.), service coverage within their neighborhoods and unclear as well as infrequent bus schedule (see Table 4).
Table 4.
Non-user response for not using SAPTCO bus service.
The effect of income and car ownership on bus usage is also considered. A negative relationship between the level of income and bus usage is found i.e., the tendency to take SAPTCO bus service is less for the high-income classes. Similarly, a negative association is also seen between the car ownership and bus usage—a significant portion (58%) of the car owners never traveled by SAPTCO bus.
Interior as well as exterior environment of the SAPTCO bus including cabin and bus stops prevent people from using its service. Respondents (73%) have strong concern about the bus stops because the design does not offer the needed privacy for women while the shades and seats are either poorly maintained or totally absent. As far for the interior environment of the bus is concerned, 80% of the respondents expressed dissatisfaction and concern about safety and comfort. About 63% of the users did not use the SAPTCO bus with their families, as it is “inconvenient” and does not offer the required privacy and separate seating arrangements for women. On the question of SAPTCO bus operating on BRT principles, 71% of the respondents are aware that BRT is safe, convenient, and affordable. Therefore, they would like SAPTCO to operate following the standards of BRT.
4.2. Numerical Evaluation of the Results Using Fuzzy Models
Two different fuzzy models were developed to define the stigma using the FISs based on expert opinions. The participant perceptions of the stigma are shown in Figure 9 using the FIS models 1 and 2. Comparing the outcomes of the proposed models using the fuzzy MF values (i.e., very low, low, medium, high, and very high), the first and the second models result in similar outcomes in 75% of the cases. Therefore, both models can be employed to define the stigma. However, different expert opinions will result in different outcomes.
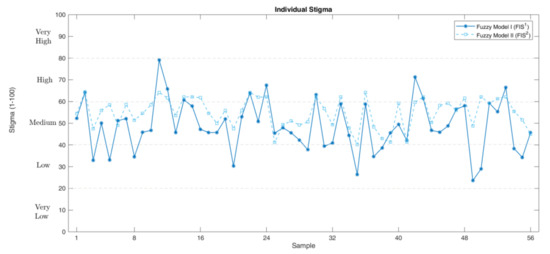
Figure 9.
The individual’s perception of stigma calculated using the defined Fuzzy Inference Systems.
Sensitivity Analysis
In the following, the sensitivity of the Stigma defined by the proposed fuzzy model 1 to different inputs (i.e., questions) is calculated using the weighted average method and correlation. The pairwise correlation of two variables and are defined as [93] and, Equation (1):
where is the covariance of and , is the expectation function, and are the mean of and respectively, and is the number of samples.
The sensitivity of the sigma value defined by the proposed fuzzy model 1 with respect to questions listed in Table 1 is shown in Figure 10. Since the total stigma defined by the fuzzy model 1 is the weighted average of the stigma of each individual, the weight of each individual is increased from 1 to N = 16 to assess the impact of each question on the total stigma value. Results show that the sensitivity of stigma to “Convenient Bus Stop (Q1)”, “Travel Convenience (Q16–Q18)”, and “Timing (Q2)” is the highest. The sensitivity of stigma to all the parameters is listed in Table 5.
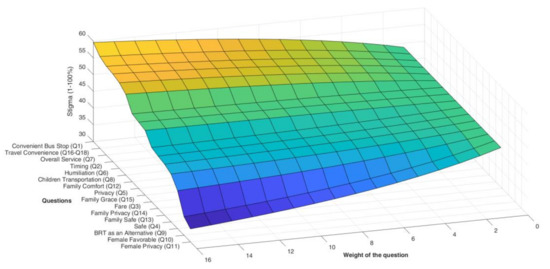
Figure 10.
Sensitivity of stigma defined by the fuzzy model 1 () to different parameters.
Table 5.
Sensitivity analysis with respect to the input parameters using correlation analysis and the fuzzy model 1.
Moreover, considering that the participant perception about the “Overall Service” indicates the individual stigma, its correlation is calculated pairwise with respect to all other questions, as shown in Table 5. A low (high) correlation value for a question, indicates a weak (strong) relationship and connectivity between that question and the stigma. The questions are sorted based on their correlation values from low (weak connectivity) to high (strong relationship). The results show that the sensitivity calculated by the proposed fuzzy model 1 is highly consistent with the correlation analysis. In 82% of the cases, both models result in exactly identical sensitivity values. The sensitivity results from the correlation analysis are comparable to the fuzzy model 1 in most input parameters (i.e., questions) except for only “family grace”, “humiliation” and “timing”.
For instance, both correlation analysis and fuzzy modeling show that the inconvenience of the bus stops (Q1) has a high impact on stigma of SAPTCO bus, whereas feeling safe during the travel (Q4) has a medium impact. Figure 11 shows the sensitivity distribution considering the variables by correlation and fuzzy model 1. As is also shown in Figure 11 and Table 5, the sensitivity of stigma is high, medium, and low respectively to 4, 6, and 7 input parameters, in view of correlation analysis. Similarly, the sensitivity of stigma is high, medium, and low to 6, 6, and 5 input parameters, respectively, in view of the proposed fuzzy model.
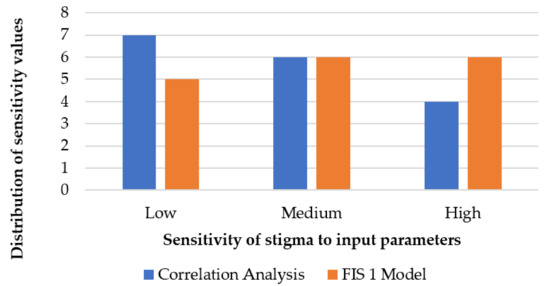
Figure 11.
Distribution of sensitivity values with respect to correlation analysis and fuzzy model 1.
5. Discussion and Conclusions
As it turns out, there is a negative relationship of income and car ownership with the use of public SAPTCO bus i.e., high-income populations are more stigmatized to its service. The study results suggest that operation of SAPTCO bus is widely unavailable and inaccessible across the region. There are a few designated bus stops while they are poorly maintained and do not offer any level of privacy, comfort, and convenience to the waiting families with kids and female passengers. Interior bus environment is also below standard that disregards the needs for privacy, comfort, and convenience of the female passengers, families, and their accompanying children. Beyond the domain of such “instrumental” factors (physical infrastructure), Saudi nationals in particular are found to be more stigmatized about the “non-instrumental” factors about SAPTCO bus, including “poor” income status of the users, etc. This corroborates with the study findings by [26,28,35,94,95,96].
To many Saudi citizens, ridership with SAPTCO bus is “disgraceful”, as it is perceived to be a commodity for the low-income people who are powerless and inferior in the society, as [36] described. This also resonates with the study by [97] in Scotland and the UK. Essentially, the “inconvenience” associated with SAPTCO bus for visiting leisure destinations, commuting to home/office, and going to shopping centers, market places, stores etc. have the highest impact on stigma, similar to “inconvenience” adjoined with the bus stops. Thus, the instance of only affordable choice for SAPTCO bus strongly echoes with the “captive” option where poor people must use public bus services as they do not have any other “choice” such as car, as [45,46,47] contended. “Feeling safe”, “privacy” in the bus, “fare”, bus “timing”, and “feeling comfort” while traveling with family turn out to have medium impact on stigma in Saudi Arabia. However, these attributes are also available in other regions across the world that are reflected in studies such as [48,50].
The connectedness of these variables across the world regions shows a prevalence of similar type and nature of stigmatized features in public transport, although their geographical, economic, and socio-cultural contexts are different. That means, potential solutions to address stigma in public transport could be transferrable with a critical translation that adapts to the socio-cultural, economic, political, and geographical landscapes of the corresponding regions. This leaves with the question of what needs to be adopted to treat stigma in favor of a well-functioning and “SAPTCO-for-all” bus service in Saudi cities.
A lower stigma with SAPTCO bus could be achieved or entirely removed with a careful improvement of the variables e.g., “inconvenience”, “safety”, “privacy”, “bus fare”, “timing”, “comfort”, etc. However, the ones with high and medium sensitivity (as presented in Table 5) can significantly improve the stigma associated with SAPTCO by minimum effort and investment. Understandably, BRT is going to pave out the pathway for a promising solution in minimizing or removing the stigmatized barriers tagged with SAPTCO bus. Findings from the global researchers suggest BRT as the most promising solution towards a well-accepted, functioning, and gender-responsive public transport. This expects to change the perceptions of both users and non-users and decrease the prevailing stigma and improve its acceptability. That being said, the cultural, social, political and economic factors and gender-responsive “instrumental” and “non-instrumental” needs must be critically adapted and contextualized to make SAPTCO bus a sensible BRT in Saudi Arabia. It must be able to compete with other modal choices such as cars to attract passengers from all groups of people and gender across the society [61]. In some parts of the world, drivers choose car because it is reliable, fast, flexible, and easy to use and the costs for individual trips are apparently low. Demand rapid transit (DRT) services should complement BRT to address these inherent challenges. This is even more critical during and post-COVID era because of the compliance with physical distancing and on-board quotas as well as the psychosocial barriers that have characterized the reduction in the use of public transport across the globe [12]. The deployment of digital platforms related to the concept of Mobility as a Service (MaaS) can exemplify the user’s modal choices by informing them about possible routes and costs as well [98].
While Saudi Arabia is undergoing a substantial economic, political and cultural transformations [99], this study is going to significantly contribute to address the prevailing stigmas embedded in the use of SAPTCO bus across Dammam Metropolitan Area (DMA). Moreover, the proposed methodological approach (i.e., fuzzy model applying fuzzy inference system (FIS) and triangulated the results with expert opinions) would help identify the nature of stigma while building the ground on how to solve them while implementing BRT across the DMA. This methodological approach is a contribution to stigma related research in public transportation and further development of what has been done by the researchers such as [76,90,92] etc. Moreover, this would further influence the proposition of BRT under the Tenth Development Plan of Saudi Arabia. Social marketing, as coined by [100], would define the key marketing strategies and techniques to educate about the social, economic and health benefits of BRT to offer the communal benefits to all the individuals and society as a whole. It can also assist to design campaigns aiming to improve the use of SAPTCO transport in a fair, just, and sustainable way.
Since this study is the first attempt to identify the stigma associated with public transportation in Saudi Arabia, understanding the preferences and challenges of SAPTCO bus users and non-users to characterize their experience and perception expects to help the decision-makers identify the fundamental areas for improvement. As well, analyzing how the individual and household characteristics influence the mode choice decision will help identify the underlying issues related to stigma and thus, facilitate in defining realistic and measurable goals for its improvements. A further study, however, should warrant the nature and magnitude of impacts of the prevailing stigmatized perceptions on the current reformation and plan for BRT-driven public transit under the “Vision 2030” of Saudi Arabia.
The findings of this study would be relevant in designing public transit in countries including Mexico, the USA, Australia, South Africa, etc. to address where stigma is a critical impediment. As the study suggests, the intended success of any public transit planning and consequent operations could be under threat due to the prevailing stigmatized perceptions. Identification of the nature and type of stigma would be the first step to put forward the design policies in favor of an accessible public transportation [40,41,42,43].
The demonstrated methodological approach of this study has a great potential to be adapted to any socio-cultural contexts where stigmatized transportation turns out to be a contemporary and inherent challenge.
Finally, to inclusively plan and manage cities safely with equity, planners, politicians, and other stakeholders will have to address the clear relationship between the challenge of safety, comfort, convenience, privacy, and women’s mobility. Policy interventions should generally aim to improve the travel experiences of all passengers. It is also essential to ensure that any change is made possible through the spread of democratic planning by listening to the most marginalized sections of the population including the women and the poor while finding ways to incorporate these concerned into making a functional public transport system [101]. Therefore, to guarantee a functional public transport that is free from the stigma-defining variables (as this study identifies), responsive to the gender needs and adaptive to local contexts e.g., DMA in Saudi Arabia, it is necessary to:
- Guarantee full and effective gender participation and equal leadership opportunities at all decision-making levels in the political, economic and public life spheres [102]
- Plan cities tailored to each inhabitant by promoting the safety of places with continuous control through surveillance and video cameras and greater lighting [103]
- Plan transport services specifically designed for gender needs, paying particular attention to unsystematic travel and the design of vehicles and infrastructures [104]
- Promote the development of multimodal mobility and MaaS digital platforms by emphasizing the importance of complementary transport services such as DRT or shared mobility services in transport areas with low demand [105].
- Design mobility and land uses with attention to gender needs. Planning a city of “short distances” by locating public transport stops close enough so that the movements to reach public transport can be made on foot, create routes of safe pedestrian and cycle paths, and revitalize the social and residential dimension of the road network [106,107,108].
Author Contributions
Conceptualization: K.M.N., A.M.S. and T.C.; Methodology: K.M.N., A.M.S., T.C., K.A., K.H. and R.S.; Software: K.M.N. and A.M.S.; Validation: K.M.N.; Formal analysis: K.M.N., A.M.S., T.C. and K.A.; Resources: K.M.N.; Data curation: K.M.N. and A.M.S.; Writing—original draft preparation: K.M.N., A.M.S., T.C. and K.A.; writing—review and editing, K.M.N., A.M.S., T.C., K.A., K.H. and R.S.; Supervision: K.M.N., K.H. and R.S. All authors have read and agreed to the published version of the manuscript.
Funding
This research was partially funded by the MIUR (Ministry of Education, Universities, and Research [Italy]) through a project entitled WEAKI TRANSIT (Project code: 20174ARRHT/CUP Code: J74I19000320008).
Institutional Review Board Statement
Not applicable.
Informed Consent Statement
Not applicable.
Data Availability Statement
Data sharing not applicable.
Acknowledgments
This work was partially supported by the Ministry of Infrastructure and Development as part of the Eastern Poland Development Operational Program in association with the European Regional Development Fund, which financed the research instruments. The authors acknowledge financial support from the MIUR (Ministry of Education, Universities and Research [Italy]) through a project entitled WEAKI TRANSIT: WEAK-demand areas Innovative TRANsport Shared services for Italian Towns (Project code: 20174ARRHT/CUP Code: J74I19000320008), financed with the PRIN 2017 (Research Projects of National Relevance) program. We authorize the MIUR to reproduce and distribute reprints for governmental purposes, notwithstanding any copyright notations thereon. Any opinions, findings, and conclusions, or recommendations expressed in this material are those of the authors and do not necessarily reflect the views of the MIUR.
Conflicts of Interest
The authors declare no conflict of interest.
Appendix A
Table A1.
Survey Questions.
Table A1.
Survey Questions.
| Abbreviation | Question | Impact | |
|---|---|---|---|
| Q1 | Convenient Bus Stop | Is the environment of SAPTCO bus stops convenient? | Reverse |
| Q2 | Timing | Are you satisfied with the timing of SAPTCO buses? | Reverse |
| Q3 | Fare | Are you satisfied with the current SAPTCO bus fare system? | Reverse |
| Q4 | Safe | Please rate the degree to which you agree with the statement: “During my travel in SAPTCO buses, I feel Safe” | Reverse |
| Q5 | Privacy | Please rate the degree to which you agree with the statement: “During my travel in SAPTCO buses, my privacy being kept” | Reverse |
| Q6 | Humiliation | Please rate the degree to which you agree with the statement: “During my travel in SAPTCO buses, I feel humiliated” | Direct |
| Q7 | Overall Service | Please rate the overall level of service offered by SAPTCO buses | Reverse |
| Q8 | Children Transportation | Mode of transportation your school-age children use to go to school is SAPTCO | Reverse |
| Q9 | BRT as an Alternative | If your children currently use private automobiles, will you ask them to use an alternative mode of transportation (particularly, BRT) in case that it is introduced? | Reverse |
| Q10 | Female Favorable | If the bus environment becomes more favorable to females, will you take buses? | Direct |
| Q11 | Female Privacy | If the bus environment provides higher privacy, will you take buses? | Direct |
| Q12 | Family Comfort | How did you feel while traveling with your family? (Comfortable?/Uncomfortable) | Reverse |
| Q13 | Family Safe | How did you feel while traveling with your family? (Safe?/Unsafe) | Reverse |
| Q14 | Family Privacy | How did you feel while traveling with your family? (Privacy respected?/violated) | Reverse |
| Q15 | Family Grace | How did you feel while traveling with your family? (Family was graced?/disgraced) | Reverse |
| Q16 | Commute to Office | How SAPTCO is convenient for Commuting to school/office? | Reverse |
| Q17 | Travel to Stores | How SAPTCO is convenient for Going to shopping centers/stores? school/office | Reverse |
| Q18 | Visiting Leisure Venues | How SAPTCO is convenient for Visiting leisure venues? | Reverse |
References
- Crocker, J.; Major, B.; Steele, C. Socialstigma. In Handbook of Social Psychology; Fiske, S., Gilbert, D., Lindzey, G., Eds.; McGraw-Hill: Boston, MA, USA, 1998; Volume 2, pp. 504–553. [Google Scholar]
- Major, B.; O’Brien, L. The social psychology of stigma. Annu. Rev. Psychol. 2005, 56, 393–421. [Google Scholar] [CrossRef] [PubMed]
- Bertrand, M.; Chugh, D.; Mullainathan, S. Implicit Discrimination. Am. Econ. Rev. Pap. Proc. 2005, 95, 94–98. [Google Scholar] [CrossRef]
- Beaman, L.; Chattopadhyay, R.; Duflo, E.; Pande, R.; Topalova, P. Powerful Women: Does Exposure Reduce Prejudice. Q. J. Econ. 2009, 124, 1497–1540. [Google Scholar] [CrossRef]
- Corno, L.; Ferrara, E.L.; Burns, J. Interaction, stereotypes and performance. Evidence from South Africa. In Institute for Fiscal Studies Working Paper W19/03; Institute for Fiscal Studies: London, UK, 2018. [Google Scholar]
- Kondylis, F.; Legoviniy, A.; Vybornyz, K.; Zwagery, A.; Andradey, L. Demand for Safe Spaces—Avoiding Harassment and Stigma. 2020. Available online: https://openknowledge.worldbank.org/handle/10986/33853 (accessed on 2 June 2020).
- Schweitzer, L. Planning and Social Media: A Case Study of Public Transit and Stigma on Twitter. J. Am. Plan. Assoc. 2014, 80, 218–238. [Google Scholar] [CrossRef]
- Aguilar, A.; Gutierrez, E.; Villagran, P.S. Benefits and Unintended Consequences of Gender Segregation in Public Transportation: Evidence from Mexico City’s Subway System. EDCC 2018, 69. [Google Scholar] [CrossRef]
- Campisi, T.; Basbas, S.; Al-Rashid, M.A.; Tesoriere, G.; Georgiadis, G. A region-wide survey on emotional and psychological impacts of COVID-19 on public transport choices in Sicily, Italy. Trans. Transp. Sci. 2021, 2, 1–10. [Google Scholar] [CrossRef]
- Al-Rashid, M.A.; Goh, H.C.; Harumain, Y.A.S.; Ali, Z.; Campisi, T.; Mahmood, T. Psycho-social barriers of public transport use and social exclusion among older adults: Empirical evidence from Lahore, Pakistan. Int. J. Environ. Res. Public Health 2021, 18, 185. [Google Scholar] [CrossRef]
- Nahiduzzaman, K.M.; Lai, S.K. What does the Global Pandemic COVID-19 Teach Us? Some Reflections. J. Urban Manag. 2020, 9, 261. [Google Scholar] [CrossRef]
- Nahiduzzaman, K.M. COVID-19 and Change Dynamics in the Transformational Cities. J. Urban Manag. 2021, 10, 95–96. [Google Scholar] [CrossRef]
- General Authority for Statistics. Tenth Development Plan, Saudi Arabia. 2015. Available online: https://www.stats.gov.sa/en/page/72 (accessed on 16 November 2015).
- SAPTCO. Available online: http://www.saptco.com.sa/mainsite/home.aspx (accessed on 1 May 2014).
- Salama, K.F.; Alhajri, R.F.; Al-Anazi, A.A. Assessment of air quality in bus terminal stations in Eastern Province, Kingdom of Saudi Arabia. Int. J. Community Med. Public Health 2017, 4, 1413. [Google Scholar] [CrossRef]
- Venter, C.; Jennings, G.; Hidalgo, D.; Valderrama Pineda, A.F. The equity impacts of bus rapid transit: A review of the evidence and implications for sustainable transport. Int. J. Sustain. Transp. 2018, 12, 140–152. [Google Scholar] [CrossRef]
- Al-Fouzan, S.A. Using Car Parking Requirements to Promote Sustainable Transport Development in the Kingdom of Saudi Arabia. Cities 2012, 29, 201–211. [Google Scholar] [CrossRef]
- Alotaibi, O.; Potoglou, D. Perspectives of travel strategies in light of the new metro and bus networks in Riyadh City, Saudi Arabia. Transp. Plan. Technol. 2017, 40, 4–27. [Google Scholar] [CrossRef]
- Yang, L.; Chau, K.W.; Chu, X. Accessibility-based premiums and proximity-induced discounts stemming from bus rapid transit in China: Empirical evidence and policy implications. Sustain. Cities Soc. 2019, 48, 101561. [Google Scholar] [CrossRef]
- Goffman, E. Stigma: Notes on the Management of Spoiled Identity; Prentice Hall: New York, NY, USA, 1963. [Google Scholar]
- Hass-Klau, C. Accessibility in Metropolitan Regions: Why are the rich now moving close to public transportation services? In Proceedings of the Planning and Sustainable Development of Metropolitan Capitals and Regions Conference, Madrid, Spain, 2006. [Google Scholar]
- Assi, K.J.; Nahiduzzaman, K.M.; Ratrout, N.T.; Aldosary, A.S. Mode choice behavior of high school goers: Evaluating logistic regression and MLP neural networks. Case Stud. Transp. Policy 2018, 6, 225–230. [Google Scholar] [CrossRef]
- Assi, K.J.; Shafiullah, M.; Nahiduzzaman, K.M.; Mansoor, U. Travel-to-school mode choice modelling employing artificial intelligence techniques: A comparative study. Sustainability 2019, 11, 4484. [Google Scholar] [CrossRef]
- Rahman, M.T.; Nahiduzzaman, K.M. Examining the walking accessibility, willingness, and travel conditions of residents in Saudi cities. Int. J. Environ. Res. Public Health 2019, 16, 545. [Google Scholar] [CrossRef]
- Al-Rashid, M.A.; Nahiduzzaman, K.M.; Ahmed, S.; Campisi, T.; Akgün, N. Gender-Responsive Public Transportation in the Dammam Metropolitan Region, Saudi Arabia. Sustainability 2020, 12, 9068. [Google Scholar] [CrossRef]
- Garling, T. Changes of private car use in response to travel demand management. In Traffic and Transportation Psychology. Theory and Application. Proceedings of the ICTTP 2004; Underwood, G., Ed.; Elsevier: Oxford, UK, 2005. [Google Scholar]
- Steg, L.; Tertoolen, G. Affective Motives for Car Use. In Transport Policy, Planning and Practice; PTRC: London, UK, 1999; pp. 13–27. [Google Scholar]
- Steg, L.; Gatersleben, B. A social dilemma analysis of car use: A comparison between UK and the Netherlands. In Proceedings of the Second International Conference on Traffic and Transport Psychology, Bern, Switzerland; 2000. [Google Scholar]
- Abrahamse, W.; Steg, L.; Gifford, R.; Vlek, C. Psychological factors influencing car use for commuting. In Proceedings of the Third International Conference on Traffic & Transport Psychology, Nottingham, UK, 5–9 September 2004. [Google Scholar]
- Gatersleben, B. Affective, social and instrumental aspects of the commute to work: Comparing perceptions of drivers, public transport users, walkers and cyclists. In Proceedings of the Third International Conference on Traffic & Transport Psychology, Nottingham, UK, 5–9 September 2004. [Google Scholar]
- Mann, E.; Abraham, S.C.S. The role of affect in UK commuters’ travel mode choices: An interpretative phenomenological analysis. Br. J. Psychol. 2006, 97, 155–176. [Google Scholar] [CrossRef]
- Steg, L.; Geurs, K.; Ras, M. The effects of motivational factors on car use: A multidisciplinary modelling approach. Transp. Res. Part A 2001, 35, 789–806. [Google Scholar] [CrossRef]
- Steg, L.; Geurs, K.; Ras, M. Motives in transport models: Can they be ignored? In Travel Behaviour Research: The Leading Edge; Hensher, D., Ed.; Pergamon Press: Amsterdam, The Netherlands, 2001. [Google Scholar]
- Steg, L.; Vlek, C.; Slotegraaf, A. Instrumental-reasoned and symbolic-affective motives for using a motor car. Transp. Res. Part F 2001, 4, 151–169. [Google Scholar] [CrossRef]
- Moslem, S.; Campisi, T.; Szmelter-Jarosz, A.; Duleba, S.; Nahiduzzaman, K.M.; Tesoriere, G. Best-Worst Method for Modelling Mobility Choice after COVID-19: Evidence from Italy. Sustainability 2020, 12, 6824. [Google Scholar] [CrossRef]
- Steg, L. Car Use: Lust and must. Instrumental, symbolic and affective motives for car use. Transp. Res. Part A 2005, 39, 147–162. [Google Scholar] [CrossRef]
- Beirao, G.; Cabral, J.S. Understanding attitudes towards public transport and private car: A qualitative study. Transp. Policy 2007, 14, 478–489. [Google Scholar] [CrossRef]
- Iseki, H.; Taylor, B.D. Style versus service? Analysis of user perceptions of transit stops and stations in Los Angeles. In Proceedings of the 87th Annual Meeting of the TRB, Washington, DC, USA, 13–17 January 2008. [Google Scholar]
- Tyrinopoulos, Y.; Antoniou, C. Public transit user satisfaction: Variability and policy implications. Transp. Policy 2008, 15, 260–272. [Google Scholar] [CrossRef]
- Joewono, T.B.; Kubota, H. User perception of private paratransit operation in Indonesia. J. Public Transp. 10 2007, 4, 99–118. [Google Scholar] [CrossRef]
- Stuart, K.R.; Mednick, M.; Bockman, J. Structural equation model of customer satisfaction for the New York City subway system. Transp. Res. Rec. 2000, 1735, 133–137. [Google Scholar] [CrossRef]
- Eboli, L.; Mazzulla, G. Service quality attributes affecting customer satisfaction for bus transit. J. Public Transp. 2007, 10, 21–34. [Google Scholar] [CrossRef]
- Nurul-Habib, K.M.; Kattan, L.; Islaam, T. Why do the people use transit? A model for explanation of personal attitude towards transit service quality. In Proceedings of the 88th Annual Meeting of the TRB, Washington, DC, USA, 11–15 January 2009. [Google Scholar]
- Hess, A. Race, Class, and the Stigma of Riding the Bus in America—Amanda Hess—The Atlantic Cities. 2012. Available online: http://www.theatlanticcities.com/commute/2012/07/race-class-and-stigma-riding-bus-america/2510/ (accessed on 1 May 2014).
- Bromley, D.W.; Buehler, R. How can the stigma of public transport as the ‘poor man’s vehicle’ be overcome to enhance sustainability and climate change mitigation? Nat. Resour. Forum 2011, 34, 327–331. [Google Scholar] [CrossRef][Green Version]
- Walker, J. Why We Should Stop Talking About “Bus Stigma”. 2012. Available online: http://www.theatlanticcities.com/commute/2012/07/why-we-should-stop-talking-about-bus-stigma/2601/ (accessed on 1 May 2014).
- Narefsky, K. Revisiting Bus Stigma. 2012. Available online: https://www.jacobinmag.com/2012/08/bus-stigma/ (accessed on 1 May 2014).
- Webber, R. The Bus Stigma: Why It Exists, and Should We Care? 2012. Available online: http://www.ssti.us/2012/07/the-bus-stigma-why-it-exists-and-should-we-care/ (accessed on 1 May 2014).
- Keddy, K. Resistance to Using Public Transportation: Stigma, Classism, and Negative Perceptions, 2010. Available online: http://iaps.scix.net/cgi-bin/works/Show?iaps_21_2010_230_2 (accessed on 2 December 2010).
- Tran, H.A.; Schlyter, A. Gender and class in urban transport: The cases of Xian and Hanoi. Environ. Urban. 2010, 22, 139–155. [Google Scholar] [CrossRef]
- Kumar, A.; Zimmerman, S.; Agarwal, O.P. International Experience in Bus Rapid Transit Implementation: Synthesis of Lessons Learned from Lagos, Johannesburg, Jakarta, Delhi, and Ahmedabad; The World Bank: Washington, DC, USA, 2012. [Google Scholar]
- Cuenot, F.; Fulton, L.; Staub, J. The prospect for modal shifts in passenger transport worldwide and impacts on energy use and CO2. Energy Policy 2012, 41, 98–106. [Google Scholar] [CrossRef]
- Linovski, O.; Baker, D.M.; Manaugh, K. Equity in practice? Evaluations of equity in planning for bus rapid transit. Transp. Res. Part A Policy Pract. 2018, 113, 75–87. [Google Scholar] [CrossRef]
- Asgharzadeh, M.; Shafahi, Y. Real-time bus-holding control strategy to reduce passenger waiting time. Transp. Res. Rec. 2017, 2647, 9–16. [Google Scholar] [CrossRef]
- Bunker, J.M. High volume bus stop upstream average waiting time for working capacity and quality of service. Public Transp. 2018, 10, 311–333. [Google Scholar] [CrossRef]
- Gómez-Ortiz, V.; Cendales, B.; Useche, S.; Bocarejo, J.P. Relationships of working conditions, health problems and vehicle accidents in bus rapid transit (BRT) drivers. Am. J. Ind. Med. 2018, 61, 336–343. [Google Scholar] [CrossRef]
- Bocarejo, J.P.; Velasquez, J.M.; Díaz, C.A.; Tafur, L.E. Impact of bus rapid transit systems on road safety: Lessons from Bogotá, Colombia. Transp. Res. Rec. 2012, 2317, 1–7. [Google Scholar] [CrossRef]
- Figueroa, M.J.; Fulton, L.; Tiwari, G. Avoiding, transforming, transitioning: Pathways to sustainable low carbon passenger transport in developing countries. Curr. Opin. Environ. Sustain. 2013, 5, 184–190. [Google Scholar] [CrossRef]
- Currie, G. Bus Rapid Transit in Australasia: Performance, Lessons Learned and Futures. Public Transp. BRT Spec. 2006, 9, 1. [Google Scholar] [CrossRef]
- Mnglor, L.M. The Role of Bus Rapid Transit in Improving Public Transport Levels of Service, Particularly for the Urban Poor Users of Public Transport a Case of Cape Town; University of Cape Town: Cape Town, South Africa, 2011. [Google Scholar]
- Campisi, T.; Tesoriere, G.; Canale, A. Microsimulation approach for BRT system: The case study of urban turbo roundabout. In AIP Conference Proceedings; AIP Publishing LLC: Melville, NY, USA, 2017; Volume 1906, p. 190005. [Google Scholar]
- Nadeem, M.; Azam, M.; Asim, M.; Al-Rashid, M.A.; Puan, O.C.; Campisi, T. Does Bus Rapid Transit System (BRTS) Meet the Citizens’ Mobility Needs? Evaluating Performance for the Case of Multan, Pakistan. Sustainability 2021, 13, 7314. [Google Scholar] [CrossRef]
- Yang, L.; Chu, X.; Gou, Z.; Yang, H.; Lu, Y.; Huang, W. Accessibility and proximity effects of bus rapid transit on housing prices: Heterogeneity across price quantiles and space. J. Transp. Geogr. 2020, 88, 102850. [Google Scholar] [CrossRef]
- Singer, M.E. Restructuring public transport through bus rapid transit: An international and interdisciplinary perspective. Transp. Rev. 2019, 9, 420–421. [Google Scholar] [CrossRef]
- Torrisi, V.; Campisi, T.; Inturri, G.; Ignaccolo, M.; Tesoriere, G. Continue to share? An overview on Italian travel behavior before and after the COVID-19 lockdown. In AIP Conference Proceedings; AIP Publishing LLC: Melville, NY, USA, 2021; Volume 2343, p. 090010. [Google Scholar]
- Campisi, T.; Canale, A.; Ticali, D.; Tesoriere, G. Innovative solutions for sustainable mobility in areas of weak demand. Some factors influencing the implementation of the DRT system in Enna (Italy). In AIP Conference Proceedings; AIP Publishing LLC: Melville, NY, USA, 2021. [Google Scholar]
- Ahangari, S.; Chavis, C.; Jeihani, M. Public Transit Ridership Analysis during the COVID-19 Pandemic. medRxiv 2020. [Google Scholar] [CrossRef]
- Abdullah, M.; Ali, N.; Shah, S.A.H.; Javid, M.A.; Campisi, T. Service Quality Assessment of App-Based Demand-Responsive Public Transit Services in Lahore, Pakistan. Appl. Sci. 2021, 11, 1911. [Google Scholar] [CrossRef]
- Lubiano, M.A.; de Sáa, S.D.L.R.; Montenegro, M.; Sinova, B.; Gil, M.Á. Descriptive analysis of responses to items in questionnaires. Why not using a fuzzy rating scale? Inf. Sci. 2016, 360, 131–148. [Google Scholar] [CrossRef]
- Lin, L.; Lee, H.M. Fuzzy assessment method on sampling survey analysis. Expert Syst. Appl. 2009, 36, 5955–5961. [Google Scholar] [CrossRef]
- Kontogianni, A.; Tourkolias, C.; Papageorgiou, E.I. Revealing market adaptation to a low carbon transport economy: Tales of hydrogen futures as perceived by fuzzy cognitive mapping. Int. J. Hydrog. Energy 2013, 38, 709–722. [Google Scholar] [CrossRef]
- Ngan, S.C. Decision making with extended fuzzy linguistic computing, with applications to new product development and survey analysis. Expert Syst. Appl. 2011, 38, 14052–14059. [Google Scholar] [CrossRef]
- Nozari, M.A.; Ghadikolaei, A.S.; Govindan, K.; Akbari, V. Analysis of the sharing economy effect on sustainability in the transportation sector using fuzzy cognitive mapping. J. Clean. Prod. 2021, 311, 127331. [Google Scholar] [CrossRef]
- Szarata, A. Public transport induced demand estimation with application of Fuzzy Inference System. In 2017 4th International Conference on Transportation Information and Safety (ICTIS); IEEE: Piscataway, NJ, USA, 2017; pp. 1105–1110. [Google Scholar]
- Amini, M.; Hatwagner, M.F.; Mikulai, G.C.; Koczy, L.T. An intelligent traffic congestion detection approach based on fuzzy inference system. In 2021 IEEE 15th International Symposium on Applied Computational Intelligence and Informatics (SACI); IEEE: Piscataway, NJ, USA, 2021; pp. 97–104. [Google Scholar]
- Ortega, L.C.; Otero, L.D.; Otero, C. Fuzzy Inference System Framework to Prioritize the Deployment of Resources in Low Visibility Traffic Conditions; IEEE: Piscataway, NJ, USA, 2019; Volume 7, pp. 174368–174379. [Google Scholar]
- Dunckel Graglia, A. Finding mobility: Women negotiating fear and violence in Mexico City’s public transit system. Gend. Place Cult. 2016, 23, 624–640. [Google Scholar] [CrossRef]
- Korn, J. Riding Scared: Sexual Violence and Women’s Mobility on Public Transportation in Santiago, Chile, 2018. Available online: https://repository.upenn.edu/senior_seminar/24/ (accessed on 25 May 2021).
- Guzman, L.A.; Oviedo, D.; Rivera, C. Assessing equity in transport accessibility to work and study: The Bogotá region. J. Transp. Geogr. 2017, 58, 236–246. [Google Scholar] [CrossRef]
- Lecompte, M.C.; Pablo, B.S.J. Transport systems and their impact con gender equity. Transp. Res. Procedia 2017, 25, 4245–4257. [Google Scholar] [CrossRef]
- Alonso, F.; Useche, S.A.; Faus, M.; Esteban, C. Does urban security modulate transportation choices and travel behavior of citizens? A national study in the Dominican Republic. Front. Sustain. Cities 2020, 2, 42. [Google Scholar] [CrossRef]
- Esquivel, V. Power and the Sustainable Development Goals: A feminist analysis. Gend. Dev. 2016, 24, 9–23. [Google Scholar] [CrossRef]
- Yin, R. Case Study Research and Applications: Design and Methods; SAGE Publications, Inc.: Thousand Oaks, CA, USA, 2018. [Google Scholar]
- Ministry of Transport. The Public Transport Authority, 2020. Available online: https://www.mot.gov.sa/en/TransportSystem/PublicTransport/Pages/default.aspx (accessed on 2 June 2020).
- Ministry of Transport. National Transportation Strategy, 2015. Available online: https://mot.gov.sa/ar/AboutUs/TKingdom/Documents/Final%20Report%20English%20New.pdf (accessed on 1 June 2021).
- Riyadh Economic Forum. Regional and Global Transport Hub: A Public-Private Partnership Opportunity, 2005. Available online: https://riyadhef.com/wp-content/uploads/2021/03/2005_02_03.pdf (accessed on 2 June 2021).
- Campisi, T.; Akgün, N.; Ticali, D.; Tesoriere, G. Exploring Public Opinion on Personal Mobility Vehicle Use: A Case Study in Palermo, Italy. Sustainability 2020, 12, 5460. [Google Scholar] [CrossRef]
- Chen, Y.; Frei, A.; Mahmassani, H.S. From personal attitudes to public opinion: Information diffusion in social networks toward sustainable transportation. Transp. Res. Rec. 2014, 2430, 28–37. [Google Scholar] [CrossRef]
- Ramos, S.; Vicente, P.; Passos, A.M.; Costa, P.; Reis, E. Perceptions of the public transport service as a barrier to the adoption of public transport: A qualitative study. Soc. Sci. 2019, 8, 150. [Google Scholar] [CrossRef]
- Azimirad, E.; Pariz, N.; Sistani, M.B.N. A novel fuzzy model and control of single intersection at urban traffic network. IEEE Syst. J. 2010, 4, 107–111. [Google Scholar] [CrossRef]
- Rutkowski, L. Fuzzy Inference Systems. In Flexible Neuro-Fuzzy Systems. The International Series in Engineering and Computer Science, 771; Springer: Boston, MA, USA, 2004. [Google Scholar]
- Zhang, G.; Li, H. An Efficient Configuration for Probabilistic Fuzzy Logic System. IEEE Trans. Fuzzy Syst. 2012, 20, 898–909. [Google Scholar] [CrossRef]
- Quek, C.; Pasquier, M.M.; Lim, B.L.B. POP-TRAFFIC: A novel fuzzy neural approach to road traffic analysis and prediction, IEEE Trans. Intell. Transp. Syst. 2006, 7, 133–146. [Google Scholar] [CrossRef]
- Steg, L. Instrumental, social and affective values of car use. In Proceeding of the Third International Conference on Traffic & Transport Psychology, Nottingham, UK, 5–9 September 2004. [Google Scholar]
- Tertoolen, G.; Van Kreveld, D.; Verstraten, B. Psychological resistance against attempts to reduce private car use. Transp. Res. Part A Policy Pract. 1998, 32, 171–181. [Google Scholar] [CrossRef]
- Steg, L.; Uneken, E. Car use: Lust and must. In Traffic and Transport Psychology: ICTTP 2000 Proceedings; Rothengatter, J., Huguenin, D., Eds.; Pergamon: Oxford, UK, 2002. [Google Scholar]
- Bus Partnership Forum. Understanding Customer Needs, 2003. Available online: https://publications.parliament.uk/pa/cm200203/cmhansrd/vo031021/text/31021w01.htm (accessed on 16 April 2020).
- Hensher, D. Future bus transport contracts under a mobility as a service (MaaS) regime in the digital age: Are they likely to change? Transp. Res. Part A Policy Pract. 2017, 98, 86–96. [Google Scholar] [CrossRef]
- Topal, A. Economic reforms and women’s empowerment in Saudi Arabia. Women’s Stud. Int. Forum 2019, 76. [Google Scholar] [CrossRef]
- Kotler, P.; Roberto, N.; Lee, N. Social Marketing: Improving the Quality of Life; Sage Publications: California, CA, USA, 2002. [Google Scholar]
- Dyer, M.; Weng, M.-H.; Wu, S.; Garcia Ferrari, T.; Dyer, R. Urban narrative: Computational linguistic interpretation of large format public participation for urban infrastructure. Urban Plan. 2020, 5, 20–32. [Google Scholar] [CrossRef]
- Campisi, T.; Basbas, S.; Tesoriere, G.; Trouva, M.; Papas, T.; Mrak, I. How to Create Walking Friendly Cities. A Multi-Criteria Analysis of the Central Open Market Area of Rijeka. Sustainability 2020, 12, 9470. [Google Scholar] [CrossRef]
- Taylor, E. Lights, camera, redaction… Police body-worn cameras; autonomy, discretion and accountability. Surveill. Soc. 2016, 14, 128–132. [Google Scholar] [CrossRef]
- Pirra, M.; Kalakou, S.; Carboni, A.; Costa, M.; Diana, M.; Lynce, A.R. A preliminary analysis on gender aspects in transport systems and mobility services: Presentation of a survey design. Sustainability 2021, 13, 2676. [Google Scholar] [CrossRef]
- Campisi, T.; Garau, C.; Acampa, G.; Maltinti, F.; Canale, A.; Coni, M. Developing Flexible Mobility On-Demand in the Era of Mobility as a Service: An Overview of the Italian Context Before and After Pandemic. In International Conference on Computational Science and Its Applications; Springer: Cham, Switzerland, 2021; pp. 323–338. [Google Scholar]
- Campisi, T.; Nahiduzzaman, K.M.; Akgün, N.; Ticali, D.; Tesoriere, G. Gender equality on developing transport system in sicily: A consideration on regional scale. In AIP Conference Proceedings; AIP Publishing LLC: Melville, NY, USA, 2021; Volume 2343, p. 090003. [Google Scholar]
- Viswanath, K.; Mehrotra, S.T. ‘Shall we go out?’ Women’s safety in public spaces in Delhi. Econ. Political Wkly. 2007, 42, 1542–1548. [Google Scholar]
- Kenyon, S.; Lyons, G.; Rafferty, J. Transport and social exclusion: Investigating the possibility of promoting inclusion through virtual mobility. J. Transp. Geogr. 2002, 10, 207–219. [Google Scholar] [CrossRef]


Publisher’s Note: MDPI stays neutral with regard to jurisdictional claims in published maps and institutional affiliations. |
© 2021 by the authors. Licensee MDPI, Basel, Switzerland. This article is an open access article distributed under the terms and conditions of the Creative Commons Attribution (CC BY) license (https://creativecommons.org/licenses/by/4.0/).