Abstract
In terms of sustainability, traditional disclosure does not provide the necessary information to all stakeholders, mainly addressing the company’s shareholders’ expectations. As a result, organisations need to disclose more non-financial information, which implies social and environmental issues. Many organisations currently provide sustainability reports in addition to the annual management reports containing financial and economic data. Several studies have focused on adopting practices and tools in the sustainability area and their overlap with traditional managerial techniques and tools. Nevertheless, integration involves a harmonising process, compatibility and alignment between different management practices. This study aims to assess the impact that the inclusion of sustainable reporting practices in corporate management reports has on economic performance, and to support filling the gap in the specific literature by proposing an integrated reporting model achieved through a harmonising process, compatibility and alignment.
1. Introduction
In today’s increasingly globalised economy, with information technologies in full swing, stakeholders want any organisation to be responsible, accountable and transparent. Sustainability reporting involves assessing the economic performance in environmental and social terms, not just economic and financial. Sustainability reporting supports the process of minimising risks, increasing the corporate brand, occupying a competitive position in the market, raising staff awareness on sustainability issues, and attracting long-term financial capital and more favourable funding conditions from credit institutions.
Regardless of its scope, reporting must create a coherent picture of the values, principles, governance, practices and economic performance. In sustainability, reporting allows stakeholders to better assess an organisation’s risks and reliability and the long-term challenges the organisation faces.
The diverse characteristics of stakeholders pose a challenge for an organisation, as each category of stakeholders has specific information needs. That is why sustainability reports should be transparent and flexible to meet the general requirements of most users. Organisations need to find a balance between stakeholders’ expectations and a practical and feasible reporting process, as an increasing number of stakeholders are concerned about companies’ sustainability rating. A key challenge in sustainability reporting is reporting links between sustainability pillars (social, economic and environmental). Organisations must highlight the mitigated risks and the positive influence of sustainability pillars [1] on profitability.
A practical approach to corporate sustainability reporting has been the introduction of various reporting guidelines and frameworks. One of the first and most effective initiatives is the Global Reporting Initiative (GRI), based on the “triple bottom line” performance model [2,3]. Many other frameworks have been added: UNGC (the UN Global Compact), Sustainable Development Goals (SDGs) IPIECA (International Association for Environmental Conservation in the Oil Industry), CDP (previously the Carbon Disclosure Project) and the Task Force on Climate-Related Financial Disclosures TFCD [4,5], the International Integrated Reporting Council Framework (IIRC, 2013) [6] and the SDGs Compass Guide [4]. Each reporting framework aims to influence disclosure and transparency on sustainability. Ioannou and Serafeim [7] confirm that improvements in disclosing sustainability practices, determined by the regulatory process, are associated with increases in company values.
There is currently the need for an evolution in sustainability reporting since the information requested by stakeholders has increased exponentially, with much of it overlapping with the information in the management reports. This need has led to the proposal of integrated reporting, which presents a company’s situation at a given time and the actions taken in all directions of sustainable development: economic, social and environmental [8,9,10]. Integrated reporting aims to harmonise the principal risks of the organisation’s activity and profitability potential, providing an overview of its inputs and results by connecting all three sustainability pillars [11]. The stakeholders must consider the sustainability drivers that can influence performance in all areas of an organisation and determine the integration of sustainability in the business strategy. Appropriately, there is a need to integrate sustainable reporting practices into overall management reporting.
Integrated reporting aims to reduce the information gap on the risk-return ratio so that investors can benefit from all the information in a friendly format that allows for more efficient investment decisions [12]. The main principle behind integrated reporting refers to value creation or value addition [13]. Corporate disclosure must convey how an organisation manages different asset values (physical resources, reputation and stakeholder relationships). Integrated reporting overcomes the disadvantages of separate reporting (managerial reporting and sustainability reporting) and will reflect how sustainability issues have been integrated into an organisation’s business and management strategy. However, distinct sustainability reporting is the first and essential stage preceding integrated reporting [12]. The two types of reports must meet different audiences’ information needs, making the integration process difficult and requiring special attention. Integrated reports address all stakeholders’ needs to ensure efficient and effective communication and avoid information oversaturation.
An integrated reporting process is necessary because the information has the expected effects only when connected to the organisation’s management system. Therefore, the goal of any organisation must be an integrated management approach, including reporting.
Despite its apparent advantages, integrated reporting is still not being used by most organisations to look at how reporting is performed to ensure public disclosures and managerial transparency. The speed of adopting an integrated reporting approach has been steady but slow so far [14]. Although there may be a relatively large expansion of corporate sustainability reports, they are inconsistent. Reports often lack indicators, with each report illustrating a different stage in a company’s reporting maturity and sustainability experiences. However, proponents of integrated reporting suggest establishing reporting guidelines to make it more consistent and give it a greater standardisation rate [7,15].
This article aims to assess the impact of the inclusion of sustainable reporting practices in corporate management reporting on economic performance, and propose an integrated reporting model obtained through harmonisation, compatibility and alignment. The analysis is carried out at the macroeconomic level by using indexes that illustrate disclosure, transparency and sustainability, and GDP levels that express EU countries’ economic performance. Following the introduction to the research topic, we have reviewed the literature on reporting sustainability practices and their economic performance impact. Section three introduces the research design, the methods used, and the variables selected for research. The five research questions are also presented. In the following section, the results of the study are outlined and further discussed. Drawing from them, in the fifth section, an integrated management reporting model that includes sustainable reporting practices is proposed. The last section provides conclusions based on the results and proposals made.
2. Literature Review
2.1. Perspectives on Adopting the Vision of Sustainability
Sustainability can be defined as the process that internalises social and environmental vectors into the organisation’s operations and involves considering stakeholders’ interests and involvement in implementing organisational strategy [16,17,18]. To fully integrate sustainability into the business strategy, an organisation must consider the sustainability issues with setting and achieving organisational goals while implementing managerial processes, functions and responsibilities [19,20,21]. Sustainability must be imprinted in the organisational DNA and incorporated into the practices, beliefs and adoption process of each level of the organisation [22,23,24]. Integration involves combining the social and environmental pillars with the economic pillar by including these dimensions in the process of making existing economic and financial decisions.
The full adoption of a sustainability vision involves three stages: refusing the sustainability philosophy and the formal embrace and holistic integration of sustainability in organisational strategy [17,25]. If an organisation refuses to include sustainability, it may choose, for example, as a principle of action, to focus on shareholders by maximising its profit, or any another approach considered beneficial or appropriate, in the specific economic, spatial and temporal context.
Organisations that provide evidence to the public through press releases, summary sustainability reports, and information on the organisation’s website are described as organisations that formally embrace sustainability [17,21,26]. Fully sustainable organisations adopt an inclusive, holistic, integrative vision of all sustainability elements and consider all stakeholders’ interests. This vision generates long-term growth and performance, considering all sustainability aspects similarly and interdependently [21,25,27,28,29].
Organisations that formally embrace sustainability adhere to the legal requirements imposed by various bodies [17,30], characterised by a short-term vision, on the financial line, focused on satisfying the interests of shareholders [17,21,26,30].
Much of the research on sustainability has focused on the formal, institutional vision, prioritising the organisation’s survival [21,31,32,33]. Only a few researchers in sustainability have adopted a vision of integrated sustainability and have shown how it should be implemented [16,17,34,35].
2.2. The Impact of Sustainability and Managerial Reporting on Economic Performance
The number of organisations that have developed processes for measuring, analysing and disclosing their sustainability efforts has grown exponentially in recent years. Although [36] these trends are partly the result of organisations’ voluntary behaviour, more and more trends result from the regulatory process in the area of sustainability [37]. Globally, regionally and nationally, there has been a proliferation of regulations to create reporting frameworks to stimulate organisations to improve their environmental, social and governance (ESG) performance [8].
On the one hand, increased transparency, to the extent that it is achieved due to mandatory regulations, could help and guide organisations, motivating them to perform more effectively in achieving the three pillars of sustainable performance. On the other hand, compulsory disclosure regulations could have negative implications for organisations by generating high costs and unavailable human resources to comply with mandatory rules set at the national, regional or global level and distinguish them from other organisations to gain a competitive advantage. In other words, the regulatory process could have costly financial consequences, rather than having the effect of striking a balance between added value through disclosures in the field of sustainability and diminished value due to very high financial and human costs.
Among the forerunners of research on the sustainability and performance connection are Waddock and Graves [38]. They provided the first empirical evidence to demonstrate a virtuous circle of social performance (social performance is related to economic performance and economic performance allows sustainable investments that ultimately generate social performance). Subsequent research has substantiated the two-way relationship between organisations’ social performance and their economic performance [19,39,40,41].
The effectiveness of regulations on sustainability disclosures is not a priori obvious, making many organisations reluctant to apply them. Such rules usually include a compliance or explanation clause, giving organisations the option not to increase the level of disclosures in sustainability, but instead to briefly explain why they do not disclose specific sustainability data. Additionally, following research on reporting frameworks, we have found that potential sanctions for non-compliance are usually not clearly stated for sustainability reporting. There is little guidance on the indicators and information an organisation needs to provide, quantify and make public [14]. As a result, the impact of regulations on sustainability disclosures remains unclear. Therefore, it is essential to empirically explore such implications at an organisation’s microeconomic level and a country’s macroeconomic level [7].
Regarding managerial reporting, previous studies have discovered an overall positive effect of disclosure regulations on organisations’ value [42,43]. However, other studies indicate adverse effects. Bushee and Leuz [44] have found that disclosure requirements can generate high costs for some organisations. The implications of disclosure regulations on organisations’ value are further complicated because, in addition to shareholders, there are other categories of stakeholders directly interested in their disclosure [45]. The existence of positive effects of sustainability practices has been debated at length in the literature on the topic. Some researchers have noticed a constructive relationship between sustainability and performance [46,47], others a bad relationship [39,48], irrelevant relationships [49] or mixed relationships [50,51]. The reasons for these contradictory results are inconsistencies or ambiguities in quantifying sustainability and the use of indicators that depict sustainability and performance [52,53].
On the one hand, higher disclosure and transparency encourage changing managerial practices and management models [7,54,55], diminishing carbon footprint, raising employee engagement and reducing turnover. On the other hand, regulations on sustainability disclosures could reduce an organisation’s value by imposing high costs of implementing new management and training reporting systems, while forcing them to disclose competitively sensitive information. Forcing organisations to increase disclosure in sustainability through regulations favours stakeholders who do not own shares in transparency claims, potentially leading to a transfer of wealth from shareholders to other stakeholders [7,14]. In sustainability disclosure practices, the target audience is not strictly limited to a company’s investors. By disseminating a sustainability report, organisations aim to inform a plethora of stakeholders, not just shareholders, about non-financial objectives, issues and values [56,57]. Our paper contributes to an emerging literature flow that aims to study non-financial disclosure consequences [7,58,59,60]. Additionally, it proposes an integrated reporting, disclosure and transparency model, addressing all the needs of stakeholders, but maintaining the flexibility of the reporting process. All variables used in this research are indexes calculated at the country’s level, obtained by aggregating data collected from that country’s companies and organisations. In practical terms, macroeconomic variables from collecting data from the microeconomic level can be used in both types of analyses.
2.3. Integrating Sustainability Reporting into Managerial Reporting
Regarding the relationship between sustainability reporting and managerial reporting, both researchers and practitioners consider that old-style disclosure does not deliver a vibrant and complete overview of organisations’ value [61]. Usually, the information presents the financial position or financial inflows or outflows within a period [62]. In terms of sustainability, traditional disclosures are insufficient to provide the necessary information to all stakeholders [63,64], focusing almost exclusively on rentability and financial measures [65]. Over the years, this reporting process has been extended to include social and financial aspects [66], becoming an evaluation and communication element of an organisation’s sustainable performance [67]. Most of the literature emphasises singular issues of sustainability reporting practices, considering them as separate dimensions. In this regard, several recent studies have called for a more integrated approach to organisational reporting. Along this line, researchers have suggested ways and frameworks for a more integrated vision of sustainability and its reporting [68,69,70]. From the study of the literature on this topic, we found two main currents of thought. Authors in the first current of thinking believe that integration must be achieved by overlapping sustainability with traditional strategies and existing reporting systems [68,70,71,72,73]. The second current considers that integration must be conceived as a process of the harmonisation, compatibility and alignment of reporting tools and practices [69,74,75]. In fact, the first current of thinking (overlapping) is the early stage of full integration obtained through harmonisation, compatibility and alignment.
3. Materials and Methods
3.1. Description of Variables (Indexes)
Two indexes for managerial reporting (Disclosure index—DI, and Corporate transparency index—CTI) were used to determine the impact of sustainable reporting practices’ inclusion into corporate management reporting on economic performance. They were calculated within the World Bank Doing Business 2020 Report [76]. Moreover, we used an index for sustainability—SDG Index, calculated in the Sustainable Development Report 2020 [77], and an index for economic performance—GDPC (Gross Domestic Product per Capita). In the research, these indexes were calculated for the countries of the European Union [78]. The World Bank Doing Business 2020 Report collects information on various business regulation areas, supporting governments by diagnosing business administration procedure problems. The report quantifies the complex regulatory processes, allowing comparisons between economies concerning how business is conducted and the regulations that govern them [76]. In scientific research, the indexes used to illustrate how the reporting is performed in the European Union member states are disclosure index and corporate transparency index. The disclosure index quantifies investor protection by disclosing information about an organisation’s ownership and financial information, especially concerning transactions. The index registers’ values range from 0 to 10, with the higher values signifying a higher level of disclosure. The corporate transparency index quantifies the degree of communication of information shared by a company with board members and senior executives, and through annual meetings and internal and external audits. The Sustainable Development Report 2020 provides information on the developments of 166 countries concerning the 17 Sustainable Development Goals (SDGs) set by the United Nations in the Agenda 2030 [77]. The Sustainable Development Goals Index (SDGI) summarises information on sustainability performance and trends in the countries under examination regarding the 17 SDGs. GDP per capita is the ratio between real GDP and the average population in a year (Eurostat, Luxembourg, 2020). GDP quantifies the value of goods and services produced by an economy as a measure of economic activity and is used as an illustrative indicator for their development level. However, GDP is a limited indicator of economic well-being. It does not include household work results for self-consumption and the adverse effects of economic activity, such as environmental degradation.
3.2. Research Design and Hypotheses
This study aims to emphasise the importance of disclosure and transparency through management reporting and the influence on economic performance. Moreover, a central focus of this research is investigating the effects of integrating sustainability into organisations’ management reporting. As a result of the literature review, we have developed a set of research questions, which account for the research design and hypotheses’ foundation.
- RQ1 addressed the topic of variables DI and CTI and their influence on the SDGI: how do the variables DI and CTI influence the variable SDGI—degree of intensity and meaning (+/−)?;
- RQ2 addressed the topic of variables DI and CTI and their influence on the GDPC: how do the variables DI and CTI influence the variable GDPC—degree of intensity and meaning (+/−)?;
- RQ3: how do the variables SDGI and GDPC influence each other—degree of intensity and meaning (+/−)?;
- RQ4: how do the variables DI and CTI influence each other—degree of intensity and meaning (+/−)?;
Finally, RQ5 was broadly inclusive; in other words, if the sustainability component is included in the company’s reporting, what would be the effects on economic performance?
Based on the results obtained, we have proposed a sustainable reporting model using the integration methodology of Gond et al. [68]. The integrated model is developed by harmonising, compatibility and aligning the generic elements of the two types of reporting (managerial and sustainability) to achieve the antagonistic objectives of flexibility, suppleness and completeness of the information reports. The correlations investigated are illustrated in Figure 1.
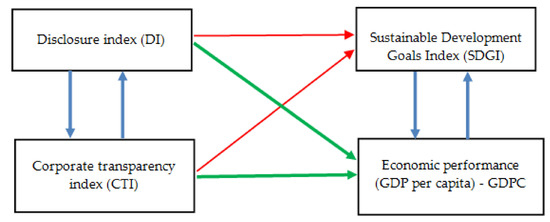
Figure 1.
Hypothetical correlations between studied variables.
Based on the hypothetical correlations between the variables investigated, we have formulated a set of 4 hypotheses to be subjected to the validation/invalidation process:
Hypothesis 1 (H1).
The variables DI and CTI influence the variable SDGI.
Hypothesis 2 (H2).
The variables DI and CTI influence the variable GDPC.
Hypothesis 3 (H3).
The variables SDGI and GDPC influence each other.
Hypothesis 4 (H4).
The variables DI and CTI influence each other.
To demonstrate the need to integrate sustainability reporting into managerial reporting, we developed Hypothesis 5. This hypothesis reflects the need to implement/include sustainability reporting practices into annual corporate reporting and the company’s general reporting.
Hypothesis 5 (H5).
The variables DI and CTI influence the GDPC variable, using SDGI as a mediation variable.
Figure 2 shows a graphical representation for the H5 hypothesis.
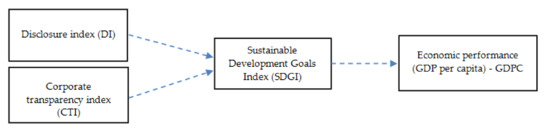
Figure 2.
The mediating effect of sustainability on the relation between disclosure and transparency and economic performance.
3.3. Methodological Framework
Regression analysis is the most effective approach to systematically describe the influence between variables from a dataset array. We intended to find regression models to describe the influence according to hypotheses H1–H5. They have allowed us to perform systematic studies on the influence between certain variables of the datasets under investigation. They have also enabled us to predict the values of dependent variables, with certain confidence level (or assessment error), corresponding to any possible values of independent variables called predictors.
The regression models are built starting from the values of variables available in the current dataset array. Only an ideal regression model allows for the precise reproduction of the correspondence , where X denotes the input variable and Y represents the output variable, with both variables containing the current dataset array’s actual values. A real-world regression model provides approximated values of the output variable, denoted here Ymdl: . The closer Ymdl and Y are to each other, the better the regression model is.
To find the optimal (best matching) relationships according to hypotheses H1–H5 proposed above, we have tested various regression models treated as analytical functions , where (two input variables and one output variable corresponding to hypotheses H1 and H2) or (one input variable and one output variable corresponding to hypotheses H3 and H4) or (three input variables and one output variable corresponding to Hypothesis 5).
Any regression model’s analytical expression involves one or more parameters β next to the input variable(s). The related function f can be linear or nonlinear concerning the parameters β and/or the input variable X [79]. A mathematical criterion is compulsory to choose the most appropriate regression model according to the best fitting principle to the available data. This corresponds to minimising the regression model’s mean square deviation concerning the actual values [80]. We tested linear, quadratic and cubic functions to choose the most accurate models for each hypothesis, being guided by this criterion.
The variables play roles of dependent or independent variables, being vectors of elements corresponding to the number of objects (EU member states here) under observation. The regression function estimates the corresponding object’s actual value from the dataset up to a deviation term ε: as detailed in Table 1.

Table 1.
Synthesis of regression functions proposed for hypotheses H1–H5.
Table 1.
Synthesis of regression functions proposed for hypotheses H1–H5.
| Input Variable(s) | Output Variable | Optimal Regression Model | Coefficients β | Diagrams of Influence | Prediction Diagram and Prediction Example | ||
|---|---|---|---|---|---|---|---|
| H1 | Figure 3 | Figure 4 lead to | |||||
| H2 | Figure 5 | Figure 6 lead to | |||||
| H3 | a | Figure 7a | Figure 8a leads to | ||||
| b | Figure 7b | Figure 8b leads to | |||||
| H4 | a | Figure 9a | Figure 10a leads to | ||||
| b | Figure 9b | Figure 10b leads to | |||||
| H5 | Figure 11 | Figure 12 lead to | |||||

Figure 3.
Incremental effect of independent variables on the regression model in Hypothesis 1 (a); the global image of the regression model corresponding to Hypothesis 1 (b).
Figure 3.
Incremental effect of independent variables on the regression model in Hypothesis 1 (a); the global image of the regression model corresponding to Hypothesis 1 (b).


Figure 4.
Prediction diagram for hypothesis H1 with 95% confidence bounds.
Figure 4.
Prediction diagram for hypothesis H1 with 95% confidence bounds.


Figure 5.
Incremental effect of independent variables on the regression model in Hypothesis 2.
Figure 5.
Incremental effect of independent variables on the regression model in Hypothesis 2.


Figure 6.
Prediction diagram for hypothesis H2 with 95% confidence bounds.
Figure 6.
Prediction diagram for hypothesis H2 with 95% confidence bounds.


Figure 7.
Influence diagrams related to hypothesis H3: (a)—Influence of SDGI on GDPC; (b)—Influence of GDPC on SDGI.
Figure 7.
Influence diagrams related to hypothesis H3: (a)—Influence of SDGI on GDPC; (b)—Influence of GDPC on SDGI.


Figure 8.
Prediction diagrams for hypothesis H3 with 95% confidence bounds. Examples: (a)—SDGI of 80 units leads to GDPC within a domain of 80…127 units; (b)—GDPC of 160 units leads to SDGI within a domain of 76…81 units.
Figure 8.
Prediction diagrams for hypothesis H3 with 95% confidence bounds. Examples: (a)—SDGI of 80 units leads to GDPC within a domain of 80…127 units; (b)—GDPC of 160 units leads to SDGI within a domain of 76…81 units.


Figure 9.
Influence diagrams related to hypothesis H4: (a)—Influence of DI on CTI; (b)—Influence of CTI on DI.
Figure 9.
Influence diagrams related to hypothesis H4: (a)—Influence of DI on CTI; (b)—Influence of CTI on DI.


Figure 10.
Prediction diagram for hypothesis H4 with 95% confidence bounds. Examples: (a)—DI of 6 units leads to CTI within a domain of 5.4…6 units; (b)—CTI of 6 units leads to DI within a domain of 5.7…7.6 units.
Figure 10.
Prediction diagram for hypothesis H4 with 95% confidence bounds. Examples: (a)—DI of 6 units leads to CTI within a domain of 5.4…6 units; (b)—CTI of 6 units leads to DI within a domain of 5.7…7.6 units.


Figure 11.
Incremental effect of independent variables on the regression model in Hypothesis 5.
Figure 11.
Incremental effect of independent variables on the regression model in Hypothesis 5.


Figure 12.
Prediction diagram for hypothesis H5 with 95% confidence bounds.
Figure 12.
Prediction diagram for hypothesis H5 with 95% confidence bounds.

4. Results and Discussions
The regression model’s coefficients β (see Table 1) were computed according to the criterion of minimising the regression model’s mean square deviation named above. A global measure of this criterion is given by the squared residual coefficient, introduced in the scientific literature as the coefficient of determination [81]:
where: is the actual value of the dependent variable corresponding to the object k; is the approximated value given by the regression model excepting the deviation ; is the mean value of the variable Y.
Values closer to 1 of the squared residual coefficient correspond to a higher quality of the regression model. This criterion led to the models detailed in Table 1.
The results in Table 1 contain details on the independent variable (or variables) for each hypothesis, the dependent variable, the regression function and the regression function’s coefficients. A higher value of a coefficient indicates a stronger influence of the corresponding independent variable on the dependent variable; contrarily, a lower coefficient corresponds to a weaker influence of its corresponding variable on the output. The intensity and sign of the influence of an independent variable on the dependent one are given by the response of the dependent variable at small deviations of the independent variable, computed mathematically through the derivatives of the regression function:
for single-variable models (as for hypotheses H3, H4) or
describes the influence of x1 and x2, respectively, on y for multiple-variable models;
describes the global influence of x1 and x2 on y for multiple-variable models.
Suggestive influence diagrams of each independent variable (by removing all others’ effects) on the regression models (shape, strength and direction) are shown in Figure 3, Figure 5, Figure 7, Figure 9 and Figure 11.
A particular discussion related to Hypothesis 1 is needed. The quadratic regression model does not allow splitting each independent variable’s influence entirely because of the mutual term (see Table 1). Therefore, in Figure 3a the impact of the mutual term is shown explicitly.
The influences shown in Figure 3a are described mathematically by the related derivatives of the regression model detailed in Table 1 (column “Optimal regression model”):
denotes the influence of DI (x1) on SDGI (y). It can be numerically computed for any values of DI (x1) and CTI (x2) by replacing here these values and the coefficients β (taken from Table 1). In other words, this is the derivative of the curve in blue in Figure 3a.
denotes the influence of CTI (x2) on SDGI. It can be numerically computed for any DI (x1) values and CTI (x2) values by replacing these values and the coefficients β. In other words, this is the derivative of the curve in red in Figure 3a.
denotes the global influence of DI and CTI on SDGI. It can be numerically computed by replacing the value of . In other words, this is the second-order derivative of the curve in green in Figure 3a.
The graphical scale on the x-axis of Figure 3a is the same for both independent variables since they are defined on the same range from 1 to 10. Otherwise, the quantity on the x-axis corresponding to the mutual term is the product within a range from 1 to 100; to keep the same graphical scale, the product was divided by 10. Ten units on the diagram correspond to 100 units of the related quantity . The regression model’s global image is shown in Figure 3b, where the actual values from the dataset are also shown.
All other regression models related to hypotheses 2–5 are linear, and all diagrams of influence are straight lines. The strength and sense of influence for Hypothesis 2 (Figure 5) are apparent: the influence of variable CTI is significantly more robust than the influence of DI, and the slopes of the curves show the sense of influence—positive for CTI (GDPC increases while CTI increases) and negative for DI (GDPC decreases while DI increases). The related derivatives confirm these observations:
denotes the negative slope of the curve in blue from Figure 5; indicates the positive slope of the curve in red from Figure 5.
The global image of this model is simply a flat surface, deliberately not shown here.
Regarding the model related to Hypothesis 5, the variable SDGI has a stronger influence on the GDPC, while DI has weak influence and negative direction (Figure 11). This result confirms the weak direct influence of DI on GDPC obtained in Hypothesis 2. We should remark that this result might be wrongly interpreted if taken out of context: DI has an essential effect on SDGI through the mutual term (as seen in hypothesis H1). Simultaneously, SDGI also has a strong influence on GDPC (hypotheses H3a and H5). Therefore, the influence of DI on GDPC is strong, but indirectly. The weight of this influence is obtained by replacing the incremental effect of DI on SDGI from the regression model H1 in the regression model H5:
where: is the incremental effect of DI on SDGI according to the regression model of hypothesis H1; is the incremental effect of SDGI on GDPC according to the regression model of hypothesis H5; is the indirect incremental effect of DI on GDPC according to the regression models of hypotheses H1, H5 (with SDGI as mediation variable); is the regression model coefficient for the hypothesis H1.
It must be noticed that the incremental model refers to the variations of the output, not to actual values, this being the reason for removing the constant term of the regression model in Equation (2).
Similarly, the influence of CTI on GDPC is obtained. An equivalent model for hypothesis H5 is built by replacing the mediation variable SDGI and keeping only DI and CTI as independent variables. The new regression model is expressed mathematically as:
wherwhere similar notations of variables as in Table 1 were used.
The obtained regression functions are essential to predict the variables of interest in various circumstances. This is merely possible with particular values of independent variables replaced in the regression model. An example of prediction for each case, with confidence bounds of 95%, is also given in Table 1, with corresponding prediction diagrams shown in Figure 4, Figure 6, Figure 8, Figure 10 and Figure 12. We built the diagrams employing a Matlab application.
Based on the results of the investigation of the five hypotheses presented in Table 1 and Figure 3, Figure 4, Figure 5, Figure 6, Figure 7, Figure 8, Figure 9, Figure 10, Figure 11 and Figure 12, we concluded that all five hypotheses demonstrate validity. Of the two variables, disclosure and transparency, considered to illustrate managerial reporting, disclosure has a significant influence on sustainability through the mutual regression term (Figure 3) and consequently on economic performance, since sustainability has a strong positive effect on economic performance (Figure 7a and Figure 11). The broader impacts are manifested on sustainability, leading to companies and stakeholders’ inclination towards a more sustainable way of doing business. The influence of sustainability on economic performance is positive and relevant (Figure 7a), while economic performance does not significantly impact sustainability (Figure 7b). The two variables, disclosure and transparency, considered to illustrate managerial reporting, influence each other significantly in a positive way (Figure 9). Research has resulted in a significant mediating effect of sustainability variables on the relationship between disclosure and transparency and economic performance, indicating a positive effect of including the dimension of sustainability in managerial reporting through an integration process. In line with previous research, we highlight that the sustainability disclosure policy positively impacts performance [54,55]. The effects of regulating disclosure policies in sustainability are differentiated [7,14,82,83], significantly influencing performance [7].
5. Proposed Integrated Reporting Model
In the past, and sometimes, currently, sustainability was considered by many stakeholders to be a cost or obligation that has adverse effects on organisational efficiency and prevents the sustained growth of the organisation’s profits and value. In recent decades, business owners and managers have begun to perceive corporate sustainability as an opportunity [84]. This evolution has been caused by the increased transparency requirements of the various stakeholders that have started to be heavily considered by organisational management [85]. Many organisations have tried to make trade-offs between adopting ethical management practices to be sustainable in the long run and the movement to maximise short-term profit. However, due to technological and communication improvements and the fact that global sustainability reporting is increasing rapidly, the comparability of sustainability practices is continuously rising due to the increase in the transparency and standardisation of disclosure practices. Despite many benefits, critics of sustainability reporting complain that it is too expensive and complicated, does not increase return on long-term investment, and reports are used to embellish reality [86,87]. To remove these prejudices and encourage the integration of sustainability practices into the organisational strategy, researchers must provide more evidence to demonstrate the positive effects of sustainability practices on economic performance.
At present, the implementation of disparate management initiatives in the field of sustainability is no longer enough, with many researchers proposing an integrated approach [68,70] to more effectively address the challenges of sustainability and its issues, as well as to prevent the negative effects of isolated management practices on economic performance [68]. To this end, managerial reporting and sustainability reporting should be fully aligned to support managers in establishing and implementing a sustainable strategy for the organisation [69]. Previous studies have proposed the integration of overlapping practices and tools [68,70,71,72,73]. A few studies have considered that the integration among various managerial and sustainability tools and practices results from harmonisation, compatibility and alignment [69,74,88,89,90]. Therefore, starting from the conclusions of other research [69,91,92,93,94,95,96,97,98,99,100,101,102] to consider such alignment processes, this study aims to propose an integrated reporting model obtained through a process of harmonisation, compatibility and alignment. Integrating the various reporting tools must occur through several steps (harmonisation, compatibility and alignment of the information provided through management reports and sustainability reports). The basis of both types of reporting is the vision, mission and strategy of the organisation. If managerial reporting contains only economic and financial information, addressed to shareholders and investors in the company, sustainability reporting takes into account, in addition to the economic pillar (summarised), the other two pillars of sustainability: social and environmental. According to the TBL (triple bottom line) philosophy, most companies’ sustainability reports comprise four categories of information: general, economic, social and environmental. Thus, the identification and examination of the two factors, social and environmental, resulted from the current sustainability reporting structure, as shown in Figure 13, and from the analysis of companies’ numerous sustainability reports.
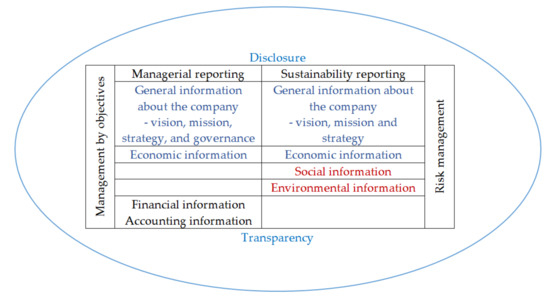
Figure 13.
Integrated reporting model.
For the integration process, we used the conceptual framework stated by Gond et al. Ref. [68], who defined three dimensions of integration: technical, organisational and cultural dimensions. Gond et al. Ref. [68] used this conceptual framework of integration to overcome overlapping traditional management and sustainability practices. The proposed integrated reporting model for the harmonisation, compatibility and alignment of managerial reporting integration with sustainability reporting is presented in Figure 13.
The technical dimension of integration corresponds to the overlapping of managerial and sustainability reports, to obtain a single, more flexible reporting framework, eliminating redundancies and addressing all stakeholders’ categories. Organisational integration is supplemental to technical integration. The dialogue between the sustainability department, management and stakeholders ensures transparency, by regular meetings where issues are discussed, future actions, and possible adjustments to the strategy or definitions of values. Technical and organisational integration cannot succeed without aligning the culture of stakeholders to the sustainability policy (cultural dimension). The process of disseminating organisational values is crucial to aligning all company levels to a single goal: pursuing long-term sustainable goals.
Among the management tools used to integrate managerial reporting with sustainability reporting, we have considered that both Management by Objectives and Risk Management can be used. Management by Objectives ensures the unity of direction that descends from the organisational strategy to the individual goals set for each member of the organisation.
In turn, Risk Management ensures a harmonised approach to economic, social and environmental issues, providing stakeholders with a clear and coherent picture of the company’s sustainability challenges. A robust managerial commitment ensures the integration of managerial and sustainability reporting [103].
In summary, this article’s primary purpose is to propose an integrated image and approach for corporate reporting (managerial reporting and sustainability reporting). The process of harmonisation, compatibility and alignment will be based on Jorgensen’s integrated approach [104] by comparing and identifying common elements, eliminating redundancies, arranging according to the TBL model and simplifying the information processed and communicated so that all stakeholders can understand it. Information of a complex nature that focuses on a specific category and activity could be placed in the so-called annexes of the reports, accessed only when it arouses interest for stakeholders.
6. Conclusions
Since the 2030 Agenda [1], organisations have had to address sustainability challenges at the managerial level, enabling resilient growth to be achieved, considering all stakeholders’ needs. The disparate approach of reporting tools does not provide a clear picture of sustainability. There is a need for a sustained integration of managerial practices and tools with those in sustainability to achieve sustainable economic performance.
Based on the investigation of the five hypotheses drawn from the theoretical framework and tested by the empirical research, we have demonstrated that the disclosure within the management reporting process has a significant influence on economic performance and, in particular, on sustainability. Empirical research has allowed us to observe a significant mediating effect of sustainability variables on the relationship between disclosure and transparency and economic performance, indicating a consistently positive impact when including the dimension of sustainability in managerial reporting through an integration process. As a result, we consider it necessary, along with other researchers [7,14,54,82,83,91], to integrate sustainability reporting into an organisation’s management reporting.
To achieve this, we used the integration model (technical, organisational and cultural) proposed by Gond et al. [68] to integrate traditional managerial reports and sustainability reports. Reporting integration can be even more efficient when performed by harmonising and aligning components. The concept of integration does not exclude the idea of overlap but consolidates it. Managers need to align such reshaped practices to ensure a high degree of disclosure and full transparency of organisational activities.
This study provides a basis for more applied empirical analyses on integrating managerial and sustainability practices and tools to ensure sustainable performance. Studies conducted at both macroeconomic and microeconomic levels can also help identify ways to integrate managerial and sustainability reporting to eliminate redundancies.
The first limitation of this research was due to the lack of literature dedicated to the impact of sustainability reporting on economic performance. Therefore, we have resorted to studying the indirect effects of sustainable reporting practices on performance, using the Mediation Method (SDG Index was seen as a mediation variable). A correct interpretation of the regression models related to hypotheses 1 and 5 demonstrates this conclusion with no doubt.
The second limitation was generated by the lack of will from corporate decision-makers to implement an integrated vision and ground for sustainability reporting. Hence, we developed a general framework of integrated reporting that ensures organisation sustainability. Last but not least, it is worth noting that the results of our study related to the regression models could be a valuable tool for prediction studies.
The next research step will also be to present a detailed view and demonstration of the integrated reporting model, developing the specific integrating process tools.
Author Contributions
Conceptualisation, A.B., C.G.B., M.D.B., L.M., L.G.M. and C.S.S.; Formal analysis, A.B., C.G.B., M.D.B., L.M., L.G.M. and C.S.S.; Investigation, C.G.B., M.D.B. and C.S.S.; Methodology, C.G.B., L.M., L.G.M. and C.S.S.; Validation, A.B., C.G.B., M.D.B., L.M., L.G.M. and C.S.S.; Writing—original draft, C.G.B. and C.S.S.; Writing—review and editing, A.B., C.G.B., M.D.B., L.M., L.G.M. and C.S.S. All authors have read and agreed to the published version of the manuscript.
Funding
This research received no external funding.
Institutional Review Board Statement
Not applicable.
Informed Consent Statement
Informed consent was obtained from all subjects involved in the study.
Data Availability Statement
Data available in a publicly accessible repository. The data presented in this study are openly available in EUROSTAT at http://appsso.eurostat.ec.europa.eu/nui/show.do?dataset=tec00114&lang=en and in World Bank DOING BUSINESS 2020 Report at http://documents1.worldbank.org/curated/en/688761571934946384/pdf/Doing-Business-2020-Comparing-Business-Regulation-in-190-Economies.pdf.
Conflicts of Interest
The authors declare no conflict of interest.
References
- UN. Transforming Our World: The Agenda 2020 for Sustainable Development. Available online: http://www.un.org/ga/search/view_doc.asp?symbol=A/RES/70/1&Lang=E (accessed on 15 November 2020).
- Glavas, A.; Mish, J. Resources and Capabilities of Triple Bottom Line Firms: Going over Old or Breaking New Ground? J. Bus. Ethics 2015, 127, 623–642. [Google Scholar] [CrossRef]
- Jackson, A.; Boswell, K.; Davis, D. Sustainability and triple bottom line reporting–What is it all about. Intern. J. Bus. Humanit. Technol. 2011, 1, 55–59. [Google Scholar]
- GRI–UNGC–WBCSD. SDG Compass. The Guide for Business Action on the SDGs. Available online: https://sdgcompass.org/wp-content/uploads/2015/12/019104_SDG_Compass_Guide_2015.pdf (accessed on 10 November 2020).
- Global Reporting Initiative. Business Reporting on the SDGs. Available online: https://www.globalreporting.org/information/SDGs/Pages/Reporting-on-the-SDGs.aspx (accessed on 17 November 2020).
- IIRC. The International <IR> Framework. Available online: https://integratedreporting.org/resource/international-ir-framework (accessed on 18 November 2020).
- Ioannou, I.; Serafeim, G. The Consequences of Mandatory Corporate Sustainability Reporting. In Harvard Business School Research Working Paper; Harvard Business School: Boston, MA, USA, 2017; pp. 11–100. [Google Scholar]
- La Torre, M.; Sabelfeld, S.; Blomkvist, M.; Dumay, J. Rebuilding trust: Sustainability and non-financial reporting and the European Union regulation, Emerald Group Publishing Ltd. Meditari Account. Res. 2020, 28, 701–725. [Google Scholar] [CrossRef]
- La Torre, M.; Sabelfeld, S.; Blomkvist, M.; Tarquinio, L.; Dumay, J. Harmonising non-financial reporting regulation in Europe: Practical forces and projections for future research, Emerald Group Publishing Ltd. Meditari Account. Res. 2018, 26, 598–621. [Google Scholar] [CrossRef]
- Tsalis, T.A.; Malamateniou, K.E.; Koulouriotis, D.; Nikolaou, I.E. New challenges for corporate sustainability reporting: United Nations’ 2030 Agenda for sustainable development and the sustainable development goals. Corp. Soc. Responsib. Environ. Manag. 2020, 27, 1617–1629. [Google Scholar] [CrossRef]
- Del Baldo, M. The Implementation of Integrating Reporting <IR> in SMEs. Insights from a pioneering experience in Italy, 2049–2372X. Meditari Account. Res. 2017, 25, 505–532. [Google Scholar] [CrossRef]
- Eccles, R.; Krzus, M. Integrated reporting for a sustainable strategy. Financ. Exec. 2010, 26, 29–32. [Google Scholar]
- Velte, P.; Stawinoga, M. Integrated reporting: The current state of empirical research, limitations and future research implications. Springer Berlin Heidelberg. J. Manag. Control 2017, 28, 275–320. [Google Scholar] [CrossRef]
- Eccles, R.; Ioannou, I.; Serafeim, G. The Impact of Corporate Sustainability on Organizational Processes and Performance. Manag. Sci. 2014, 60, 2835–2857. [Google Scholar] [CrossRef]
- Dumay, J.; Bernardi, C.; Guthrie, J.; Demartini, P. Integrated reporting: A structured literature review. Account. Forum 2016, 40, 166–185. [Google Scholar] [CrossRef]
- Hahn, T.; Preuss, L.; Pinkse, J.; Figge, F. Cognitive frames in corporate sustainability: Managerial sensemaking with paradoxical and business case frames. Acad. Manag. Rev. 2015, 40, 18–42. [Google Scholar] [CrossRef]
- Perrott, B. The sustainable organisation: Blueprint for an integrated model. J. Bus. Strategy 2015, 35, 26–37. [Google Scholar] [CrossRef]
- Hansmann, R.; Mieg, H.A.; Frischknecht, P. Principal sustainability components: Empirical analysis of synergies between the three pillars of sustainability. Int. J. Sustain. Dev. World 2012, 19, 451–459. [Google Scholar] [CrossRef]
- Ameer, R.; Othman, R. Sustainability Practices and Corporate Financial Performance: A Study Based on the Top Global Corporations. J. Bus. Ethics 2012, 108, 61–79. [Google Scholar] [CrossRef]
- Bell, J.; Soybel, V.E.; Turner, R.M. Integrating Sustainability into Corporate DNA. J. Corp. Account. Financ. 2012, 23, 71–82. [Google Scholar] [CrossRef]
- Avery, G.; Bergsteiner, H. Sustainable Leadership Practices for Enhancing Business Resilience and Performance. Strategy Leadersh. 2011, 39, 5–15. [Google Scholar] [CrossRef]
- Waas, T.; Huge, J.; Verbruggen, A.; Wright, T. Sustainable Development: A Bird’s Eye View. Sustainability 2011, 3, 1637–1661. [Google Scholar] [CrossRef]
- Harris, L.C.; Crane, A. The Greening of Organizational Culture: Management Views on the Depth, Degree and Diffusion of Change. J. Organ. Change Manag. 2001, 18, 214–234. [Google Scholar] [CrossRef]
- Whittington, R. Completing the Practice Turn in Strategy research. Organ. Stud. 2006, 27, 613–632. [Google Scholar] [CrossRef]
- Valente, M. Theorizing Firm Adoption of Sustaincentrism. Organ. Stud. 2012, 54, 563–591. [Google Scholar] [CrossRef]
- Dunphy, D.C.; Griffiths, A.; Benn, S. Organizational Change for Corporate Sustainability: A Guide for Leaders and Change Agents of the Future; Routledge: Abingdon, UK, 2007. [Google Scholar]
- Linnenluecke, M.K.; Russell, S.V.; Grifiths, A. Subcultures and Sustainability Practices: The Impact on Understanding Corporate Sustainability. Bus. Strategy Environ. 2009, 18, 432–452. [Google Scholar] [CrossRef]
- Banerjee, S.B. Embedding Sustainability across the Organization: A Critical Perspective. Acad. Manag. Learn. Educ. 2011, 10, 719–731. [Google Scholar] [CrossRef]
- Raucci, D.; Tarquinio, L. Sustainability performance indicators and non-financial information reporting. Evidence from the Italian case. Adm. Sci. 2020, 10, 13. [Google Scholar] [CrossRef]
- Willard, B. The 5-Stage Sustainability Journey. Available online: http://sustainabilityadvantage.com/2010/Q7/27/the-5-stage-sustainability-journey (accessed on 14 November 2020).
- Aragón, C.J.A.; Sharma, S.A. Contingent Resource-Based View of Proactive Corporate Environmental Strategy. Acad. Manag. Rev. 2003, 28, 71–88. [Google Scholar] [CrossRef]
- Carini, C.; Rocca, L.; Veneziani, M.; Teodori, C. Ex-ante impact assessment of sustainability information- the directive 2014/95. Sustainability 2018, 10, 560. [Google Scholar] [CrossRef]
- Banerjee, S.B.; Bonnefous, A. Stakeholder management and sustainability strategies in the French nuclear industry. Bus. Strategy Environ. 2011, 20, 124–148. [Google Scholar] [CrossRef]
- Valente, M. Business Sustainability Embeddedness as a Strategic Imperative: A Process Framework. Bus. Soc. 2015, 84, 126–142. [Google Scholar] [CrossRef]
- Dyllick, T.; Hockerts, K. Beyond the Business Case for Corporate Sustainability. Bus. Strategy Environ. 2002, 11, 130–141. [Google Scholar] [CrossRef]
- The Alliance for Corporate Transparency. 2019 Research Report. An Analysis of the Sustainability Reports of 1000 Companies Pursuant to the EU Non-Financial Reporting Directive. Available online: https://www.allianceforcorporatetransparency.org/assets/2019_Research_Report%20_Alliance_for_Corporate_Transparency-7d9802a0c18c9f13017d686481bd2d6c6886fea6d9e9c7a5c3cfafea8a48b1c7.pdf (accessed on 14 November 2020).
- Doni, F.; Bianchi, M.S.; Corvino, A.; Mazzoni, M. Voluntary versus mandatory non-financial disclosure. Emerald Group Publishing Ltd. Meditari Account. Res. 2019, 28, 781–802. [Google Scholar] [CrossRef]
- Waddock, S.A.; Samuel, B.G. The Corporate Social Performance-Financial Performance Link. Strateg. Manag. J. 1997, 18, 303–319. [Google Scholar] [CrossRef]
- Brammer, S.; Brooks, C.; Pavelin, S. Corporate social performance and stock returns: UK evidence from disaggregate measures. Financ. Manag. 2006, 35, 97–116. [Google Scholar] [CrossRef]
- Surroca, J.; Tribö, J.A.; Waddock, S. Corporate responsibility and financial performance: The role of intangible resources. Strateg. Manag. J. 2010, 37, 463–490. [Google Scholar] [CrossRef]
- Wissink, R.B.A. A Test of the Virtuous Cycle of Corporate Social Responsibility: Testing the Relation Between Corporate Social Performance and Corporate Financial Performance; University of Twente: Enschede, The Netherland, 2012. [Google Scholar]
- Shleifer, A.; Vishny, R.W. A Survey of Corporate Governance. J. Financ. 1997, 52, 737–783. [Google Scholar] [CrossRef]
- Porta, R.; López, S.F.; Shleifer, A.; Vishny, R. Investor Protection and Corporate Governance. J. Financ. Econ. 2000, 58, 3–27. [Google Scholar] [CrossRef]
- Gavana, G.; Gottardo, P.; Moisello, A.M. Do customers value CSR disclosure? Evidence from Italian family and non-family firms. Sustainability 2018, 10, 1642. [Google Scholar] [CrossRef]
- Leopizzi, R.; Iazzi, A.; Venturelli, A.; Principale, S. Non-financial risk disclosure: The ‘state of the art’ of Italian companies. Corp. Soc. Responsib. Environ. Manag. 2020, 20, 358–368. [Google Scholar] [CrossRef]
- Orlitzky, M.; Schmidt, F.L.; Rynes, S.L. Corporate social and financial performance: A meta-analysis. Organ. Stud. 2003, 24, 403–441. [Google Scholar] [CrossRef]
- Margolis, J.D.; Walsh, J.P. Misery loves companies: Rethinking social initiatives by business. Adm. Sci. Q. 2003, 48, 268–305. [Google Scholar] [CrossRef]
- Wright, P.; Ferris, S.P. Agency conflict and corporate strategy: The effect of divestment on corporate value. Strateg. Manag. J. 1997, 18, 77–83. [Google Scholar] [CrossRef]
- Williams, A.; Siegel, D. Corporate social responsibility: A theory of the firm perspective. Acad. Manag. Rev. 2001, 26, 117–127. [Google Scholar] [CrossRef]
- Scholtens, B. A note on the interaction between corporate social responsibility and financial performance. Ecol. Econ. 2008, 68, 46–55. [Google Scholar] [CrossRef]
- Barnett, M.L.; Salomon, R.M. Does it pay to be really good? Addressing the shape of the relationship between social and financial performance. Strateg. Manag. J. 2012, 33, 1304–1320. [Google Scholar] [CrossRef]
- Beurden, P.; Gossling, T. The worth of values: A literature review on the relation between corporate social and financial performance. J. Bus. Ethics 2008, 82, 407–424. [Google Scholar] [CrossRef]
- Venturelli, A.; Caputo, F.; Leopizzi, R.; Pizzi, S. The state of art of corporate social disclosure before the introduction of non-financial reporting directive: A cross country analysis. Soc. Responsib. J. 2019, 15, 409–423. [Google Scholar] [CrossRef]
- Konar, S.; Cohen, M.A. Information as regulation: The effect of community right to know laws on toxic emissions. J. Environ. Econ. Manag. 1997, 32, 109–124. [Google Scholar] [CrossRef]
- Scorse, J.; Schlenker, W. Does Being a ‘top 10’ Worst Polluter Affect Facility Environmental Releases? Evidence from the U.S. Toxic Release Inventory; Working Paper; Monterey Institute of International Studies: Monterey, CA, USA, 2012. [Google Scholar]
- Frìas, A.J.V.; Rodrìguez, A.L.; Garcìa, S.I.M. Explanatory factors of integrated sustainability and financial reporting. Bus. Strategy Environ. 2014, 23, 56–72. [Google Scholar] [CrossRef]
- James, M.L. Sustainability and integrated reporting: A case exploring issues, benefits and challenges. J. Int. Acad. Case Stud. 2013, 19, 95–103. [Google Scholar]
- Luca, F.; Phan, H. Informativeness assessment of risk and risk-management disclosure in corporate reporting: An empirical analysis of Italian large listed firms. Financ. Report. 2019, 2, 9–41. [Google Scholar] [CrossRef]
- Franco, G.; Kothari, S.P.; Verdi, R. The Benefits of Financial Statement Comparability. J. Account. Res. 2011, 49, 895–931. [Google Scholar] [CrossRef]
- Cheng, B.; Ioannou, I.; Serafeim, G. Corporate Social Responsibility and Access to Finance. Strateg. Manag. J. 2014, 35, 1–23. [Google Scholar] [CrossRef]
- Caputo, F.; Leopizzi, R.; Pizzi, S.; Milone, V. The non-financial reporting harmonisation in Europe: Evolutionary pathways related to the transposition of the directive 95/2014/EU within the Italian context. Sustainability 2020, 12, 92. [Google Scholar] [CrossRef]
- Schaltegger, S.; Bennett, M.; Burritt, R. Sustainability Accounting and Reporting; Springer Science & Business Media: Dordrecht, The Netherlands, 2006. [Google Scholar]
- Dumay, J.; Dai, T. Integrated thinking as a cultural control? Meditari Account. Res. 2017, 25, 574–604. [Google Scholar] [CrossRef]
- Manes, R.F.; Tiron, T.A.; Nicolô, G.; Zanellato, G. Ensuring More Sustainable Reporting in Europe Using Nonfinancial Disclosure—De Facto and De Jure Evidence. Sustainability 2018, 10, 1162. [Google Scholar] [CrossRef]
- Loh, L.; Thomas, T.; Wang, Y. Sustainability reporting and firm value: Evidence from Singapore-Listed companies. Sustainability 2017, 9, 2112. [Google Scholar] [CrossRef]
- Mion, G.; Loza, A.C.R. Mandatory non-financial disclosure and its consequences on the sustainability reporting quality of Italian and German companies. Sustainability 2019, 11, 4612. [Google Scholar] [CrossRef]
- Lozano, R.; Nummert, B.; Ceulemans, K. Elucidating the relationship between sustainability reporting and organisational change management for sustainability. J. Clean. Prod. 2016, 125, 168–188. [Google Scholar] [CrossRef]
- Gond, J.P.; Grubnic, S.; Herzig, C.; Moon, J. Coniguring management control systems: Theorising the integration of strategy and sustainability. Manag. Account. Res. 2012, 23, 205–228. [Google Scholar] [CrossRef]
- Maas, K.; Schaltegger, S.; Crutzen, N. Integrating corporate sustainability assessment, management accounting, control, and reporting. J. Clean. Prod. 2016, 136, 248–287. [Google Scholar] [CrossRef]
- Battaglia, M.; Passetti, E.; Bianchi, L.; Frey, M. Managing for integration: A longitudinal analysis of management control for sustainability. J. Clean. Prod. 2016, 136, 218–225. [Google Scholar] [CrossRef]
- Adams, C.A.; Frost, G.R. Integrating sustainability reporting into management practices. Account. Forum 2008, 32, 288–302. [Google Scholar] [CrossRef]
- Riccaboni, A.; Leone, E.L. Implementing strategies through management control systems: The case of sustainability. Int. J. Prod. Perform. Manag. 2010, 59, 130–144. [Google Scholar] [CrossRef]
- Giovannoni, E.; Maraghini, M.P. The challenges of integrated performance measurement systems: Integrating mechanisms for integrated measures. Account. Audit. Accoun. 2013, 26, 978–1008. [Google Scholar] [CrossRef]
- GBS. The SDGs in the Reports of the Italian Companies; Franco Angeli: Milan, Italy, 2019. [Google Scholar]
- Villiers, C.; Rouse, P.; Kerr, J. A new conceptual model of inluences driving sustainability based on case evidence of the integration of corporate sustainability management control and reporting. J. Clean. Prod. 2016, 36, 75–85. [Google Scholar]
- World Bank. Doing Business 2020; World Bank: Washington, DC, USA, 2020. [Google Scholar]
- Sachs, J.; Schmidt, T.G.; Kroll, C.; Lafortune, G.; Fuller, G.; Woelm, F. The Sustainable Development Goals and COVID-19. Sustainable Development Report 2020; Cambridge University Press: Cambridge, UK, 2020. [Google Scholar]
- Eurostat. GDP Per Capita in PPS. Available online: http://appsso.eurostat.ec.europa.eu/nui/show.do?dataset=tec00114&lang=en (accessed on 29 October 2020).
- Draper, N.R.; Smith, H. Applied Regression Analysis, 3rd ed.; John Wiley: Hoboken, NJ, USA, 1998. [Google Scholar]
- Wackerly, D.; Mendenhall, W.; Scheaffer, R. Mathematical Statistics with Applications, 7th ed.; Thomson Brooks: Belmont, MA, USA, 2008. [Google Scholar]
- Wright, S. Correlation and causation. J. Agric. Res. 1921, 20, 557–585. [Google Scholar]
- Elshandidy, T.; Shrives, P.J.; Bamber, M.; Abraham, S. Risk reporting: A review of the literature and implications for future research. J. Account. Lit. 2018, 40, 54–82. [Google Scholar] [CrossRef]
- Veltri, S. The Mandatory Non-financial Disclosure in the European Union. In Mandatory Non-financial Risk-Related Disclosure; Springer: Cham, Switzerland, 2020. [Google Scholar]
- Ludema, J.D.; Laszlo, C.; Lynch, D.L. Embedding sustainability: How the field of organisation development and change can help companies harness the next big competitive advantage. Res. Organ. Chang. Dev. 2012, 20, 265–299. [Google Scholar]
- Fischer, T.M.; Sawczyn, A.A. The relationship between corporate social performance and corporate financial performance and the role of innovation: Evidence from German listed firms. J. Manag. Control. 2019, 24, 27–52. [Google Scholar] [CrossRef]
- KPMG. The KPMG Survey of Corporate Responsibility Reporting 2020. Available online: https://home.kpmg/be/en/home/insights/2020/12/sus-the-kpmg-survey-of-sustainability-reporting-2020.html (accessed on 8 October 2020).
- Villiers, C.; Hsiao, P.C.K.; Maroun, W. The Routledge Handbook of Integrated Reporting; Routledge: London, UK, 2020. [Google Scholar]
- Villiers, C.; Rinaldi, L.; Unerman, J. Integrated reporting: Insights, gaps and an agenda for future research. Account. Audit. Account. J. 2014, 27, 1042–1067. [Google Scholar] [CrossRef]
- Villiers, C.; Maroun, W. Sustainability Accounting and Integrated Reporting; Routledge: London, UK, 2017. [Google Scholar]
- Rossi, F.; Harjoto, M.A. Corporate non-financial disclosure, firm value, risk, and agency costs: Evidence from Italian listed companies. Rev. Manag. Sci. 2019, 14, 1149–1181. [Google Scholar] [CrossRef]
- Vitale, G.; Cupertino, S.; Rinaldi, L.; Riccaboni, A. Integrated Management Approach Towards Sustainability: An Egyptian Business Case Study. Sustainability 2019, 11, 1244. [Google Scholar] [CrossRef]
- Vaz, N.; Fernandez, F.B.; Ruiz, S. Integrated reporting: An international overview. Bus. Ethics A Eur. Rev. 2016, 25, 577–591. [Google Scholar] [CrossRef]
- Bebbington, J.; Russell, S.; Thomson, I. Accounting and sustainable development: Reflections and propositions. Crit. Perspect. Account. 2017, 48, 21–34. [Google Scholar] [CrossRef]
- Baumüller, J.; Schaffhauser-Linzatti, M.M. In search of materiality for nonfinancial information—reporting requirements of the Directive 2014/95/EU. Nachhalt. Manag. Forum 2018, 26, 101–111. [Google Scholar] [CrossRef]
- Lai, A.; Melloni, G.; Stacchezzini, R. Why do companies adopt an integrated report? First insights into a legitimacy theory explanation. In IV Financial Reporting Workshop; Department of Law and Economics, University La Sapienza: Rome, Italy, 2013; pp. 1–39. [Google Scholar]
- Bernardi, C. Implementing Integrated Reporting. Lessons from the Field; Springer International Publishing: Berlin/Heidelberg, Germany, 2020. [Google Scholar]
- Minnis, M. The Value of Financial Statement Verification in Debt Financing: Evidence from Private U.S. Firms. J. Account. Res. 2011, 49, 457–506. [Google Scholar] [CrossRef]
- Mio, C.; Venturelli, A. Non-financial Information About Sustainable Development and Environmental Policy in the Annual Reports of Listed Companies: Evidence from Italy and the UK. Corp. Soc. Responsib. Environ. Manag. 2013, 20, 340–358. [Google Scholar] [CrossRef]
- Moneva, J.M.; Cuellar, B. The value relevance of financial and non-financial environmental reporting. Environ. Resour. Econ. 2009, 44, 441–456. [Google Scholar] [CrossRef]
- Muserra, A.L.; Papa, M.; Grimaldi, F. Sustainable development and the European Union policy on non-financial information: An Italian empirical analysis. Corp. Soc. Responsib. Environ. Manag. 2019, 27, 22–31. [Google Scholar] [CrossRef]
- Stubbs, W.; Higgins, C. Integrated reporting and internal mechanisms of change. Account. Audit. Account. J. 2014, 27, 1068–1089. [Google Scholar] [CrossRef]
- PWC. SDG Reporting Challenge. Exploring Business Communication on the Global Goals. 2017. Available online: https://www.pwc.com/gx/en/sustainability/SDG/sdg-reporting-2018.pdf (accessed on 20 November 2020).
- Nicolescu, M.M.; Vărzaru, A.A. Ethics and disclosure of accounting, financial and social information within listed companies. Evidence from the Bucharest Stock Exchange. In Proceedings of the BASIQ International Conference, New Trends in Sustainable Business and Consumption, Messina Italy, 4–6 June 2020; pp. 73–80. [Google Scholar]
- Jørgensen, T.H. Integration of Management Systems–Towards More Sustainable Management Systems. Available online: http://vbn.aau.dk/files/57363399/THJ_GIN_2006.pdf (accessed on 6 January 2021).


Publisher’s Note: MDPI stays neutral with regard to jurisdictional claims in published maps and institutional affiliations. |
© 2021 by the authors. Licensee MDPI, Basel, Switzerland. This article is an open access article distributed under the terms and conditions of the Creative Commons Attribution (CC BY) license (http://creativecommons.org/licenses/by/4.0/).