Review

Advancements in Geo-Inclusions for Ballasted Track: Constitutive Modelling and Numerical Analysis

1
Transport Research Centre, School of Civil and Environmental Engineering, University of Technology Sydney, Sydney, NSW 2007, Australia
2
CONSTRUCT, Faculty of Engineering, University of Porto, 4200-465 Porto, Portugal
*
Author to whom correspondence should be addressed.
Sustainability 2021, 13(16), 9048; https://doi.org/10.3390/su13169048
Submission received: 21 July 2021 / Revised: 7 August 2021 / Accepted: 10 August 2021 / Published: 12 August 2021
(This article belongs to the Special Issue Sustainability and Innovation in Transport Infrastructure Geotechnics)

Abstract

:
This paper reviewed some salient features evolving through mathematical and numerical modelling of ballasted track components incorporating recycled rubber products. Firstly, a constitutive model based on the bounding surface concept was introduced to simulate the shear stress-strain response of waste mixtures (i.e., recycled rubber crumbs, coal wash, and steel furnace slag) used for the capping layer placed below the ballast medium, whereby the energy absorbing property resulting from the inclusion of different amounts of rubber has been captured. Subsequently, key research findings concerning the inclusion of recycled rubber mats on ballasted tracks for reduced particle degradation under cyclic loading were examined and discussed. Discrete element modelling (DEM) coupled with Finite element modelling (FEM) to micro-mechanically characterise ballast behaviour with and without rubber mats offers invaluable insight into real-life track operations. In particular, this coupled DEM-FEM model facilitates the exploration of micromechanical aspects of particle breakage, contact force distributions within the granular assembly, and the orientation of contacts during cyclic loading.

1. Introduction

Rail tracks contribute to the largest worldwide transportation network. The increasing use of rail as one of the most sustainable and energy-efficient means of transport along with the associated increases in axle loads and train speeds have led to a rapid deterioration of track substructure components and exacerbated maintenance costs [1]. The need to maintain a competitive advantage implies there is pressure on the rail industry to improve its operational efficiency and passenger comfort, while minimising the maintenance and construction expenses [2,3]. Despite recent advances in the field of rail geotechnics, the rapid deterioration of track substructure (especially the ballast layer) is considered to be the most pronounced factor contributing to increased track maintenance costs [4,5]. To cope with this problem, there have been numerous studies into using artificial inclusions (rubber mats, geosynthetics, geocells, granulated rubber, etc.) to enhance rail ballast performance and reduce its degradation [6,7,8,9,10,11,12]. Field trials by Indraratna et al. [13] showed that rubber mats could significantly minimise ballast deformations, apart from reducing particle breakage. Previous laboratory studies using large-scale test facilities indicated that plastic under sleeper pads placed beneath sleepers could minimise ballast breakage by mitigating the transmission of impact loading effects [14].
In recent years, the Australian railway industry has trialled an innovation where waste and marginal materials are used as a sustainable replacement for the traditional capping layer. Energy absorbing recycled materials such as discarded rubber and ore wastes are blended into a new ductile material that will stabilise heavy haul tracks built on problematic terrain. The engineering properties of these new materials can be optimised such that they can be used during track construction instead of the traditional sub-ballast (capping) materials. Steel furnace slag (SFS) and coal wash (CW) are granular byproducts derived from steel manufacturing and coal mining, and since Australia is based on mining, it can produce several hundred million tons of SFS and CW per year [15,16]. In order to recycle these waste materials in civil engineering and curtail their adverse geotechnical properties (i.e., the swelling potential of SFS and breakage susceptibility of CW), engineers usually mix SFS with dredged materials, cement, fly ash, or asphalt for earthwork construction or pavement applications [17,18,19,20], while CW blended with SFS has been used very successfully for a Wollongong port reclamation project [21]. Not only are these recycled waste materials environmentally friendly and economically beneficial, but they can also help to solve some geotechnical problems. It has been found that adding rubber crumbs (RC) resulting from waste-car tyres to SFS-CW mixtures can significantly improve their energy absorbing capacity, which is associated with the high damping ratio of rubber products [12,22,23,24,25,26]. This means that SFS+CW mixtures may also be used in projects involving dynamic loading by adding RC. Indraratna et al. [27] developed a selection system to optimise the SFS+CW+RC matrix for railway sub-ballast and found that a waste matrix consisting of SFS:CW = 7:3 and with the inclusion of 10% RC (by weight) is the optimal mixture for subballast materials. Qi and Indraratna [28] further confirmed this outcome via large-scale physical modelling and proved that using this optimal waste mixture (SFS+CW+RC) as subballast (or called capping layer which is the layer directly below ballast and above the subgrade, with a usual thickness of 150–200 mm) could efficiently absorb the energy and reduce ballast breakage. However, further investigation is needed to look into the mechanism of energy absorbing mixtures from a mathematical point of view.
Apart from traditional laboratory testing to understand the geotechnical properties of ballast and capping materials, mathematical and computational models are increasingly being demonstrated as alternative approaches with the possibility of implementing complex loadings subjected to varying boundary conditions [29,30,31,32]. Numerical simulations for real-scale track embankments subject to actual moving train loads (i.e., considering rest periods) could be more complex and time-consuming with either finite element or discrete element modelling approaches [33,34,35,36,37], so there is a need for co-simulations that can couple several computational schemes together to utilise computational resources and further advance railway research.
This paper described mathematical and numerical approaches to investigate the improved performance of track substructure layers incorporating geo-inclusions (i.e., SFS+CW+RC mixtures and recycled rubber mats). A constitutive model adopting the bounding surface concept was developed for SFS+CW+RC mixtures, where the energy absorption capacity resulting from the RC inclusion is captured through an empirical relationship for the critical state parameter ( M c s ) in relation to the total work input ( W t o t a l ). Coupled discrete-continuum modelling was then used to examine the cyclic loading behaviour of a track specimen and the role of rubber mats in reducing ballast degradation. These mathematical and numerical models were calibrated and validated based on extensive laboratory testing.

2. Use of Waste Mixture for Subballast (Capping) Layer in Rail Tracks

Previous studies have examined the stress-strain behaviour of SFS+CW+RC blends subjected to monotonic loading [38] and found that the inclusion of rubber crumbs (RC) has a significant effect on the geotechnical properties of the mixture such that a higher RC content ( R b ) makes the waste matrix more ductile and contractive, but with reduced shear strength. Qi et al. [39] found that with more than 20% RC, the SFS+CW+RC matrix could not attain a critical state, albeit there was a trend towards reaching a critical state with total axial strain over 25%, and thus extrapolation was adopted to estimate the critical state parameters for R b 20 % .
In the following sections, the effect of the RC content on the critical state response is investigated, and the total work input is considered to be related to the critical state parameters to capture the energy absorbing characteristics due to adding rubber. In this context, a constitutive model following the bounding surface theory and the critical state concept is then developed for the waste mixtures.
To calibrate the parameters of this constitutive model, the results of consolidated drained triaxial tests of the SFS+CW+RC matrix (SFS:CW = 7:3, R b = 0 % ,   10 % ,   20 % ,   30 % ,   and   40 % ) from Indraratna et al. [27] were adopted. The waste matrix specimens were compacted to >95% of their maximum dry-unit weight, and before shearing they were saturated and then consolidated under varying effective confining pressures ( σ 3 = 10 ,   40 ,   or   70 kPa). The specimen and loading conditions for these tests were aimed at simulating the field conditions of subballast along the Australian coastline. The proposed model was then verified by comparing the prediction results with the laboratory data for SFS+CW+RC blends [27], as well as SFS+CW blends tested by Tasalloti et al. [40] and sand-RC blends examined by Youwai and Bergado [26].

2.1. Constitutive Modelling

2.1.1. Governing Equations

Conventional triaxial q p notation was adopted in this study, where q = σ 1 σ 3 denotes the deviator stress, p = ( σ 1 + 2 σ 3 ) / 3 is the mean effective stress, and σ 1   and   σ 3 are the axial and radial stresses, respectively. Following the theory of bounding surface plasticity [41], the governing equation for the common stress-strain relationship can be expressed as:
[ d p d q ] = ( D e D e m n T D e H + n T D e m ) [ d ε v d ε q ]
where m is the unit vector of plastic flow, n is the unit normal loading vector, H is the hardening modulus, ε v and ε q are the volumetric and deviator strains, respectively, and D e denotes the elastic compliance, which can be defined by:
D e = [ K 0 0 3 G ] ,
where K and G are the tangential bulk and shear modulus, respectively, as determined by:
K = ( 1 + e 0 ) p κ
G = 3 ( 1 2 ν ) 2 ( 1 + ν ) K
where κ refers to the gradient of the swelling line, e 0   refers to the initial void ratio, and v is the Poisson’s ratio.

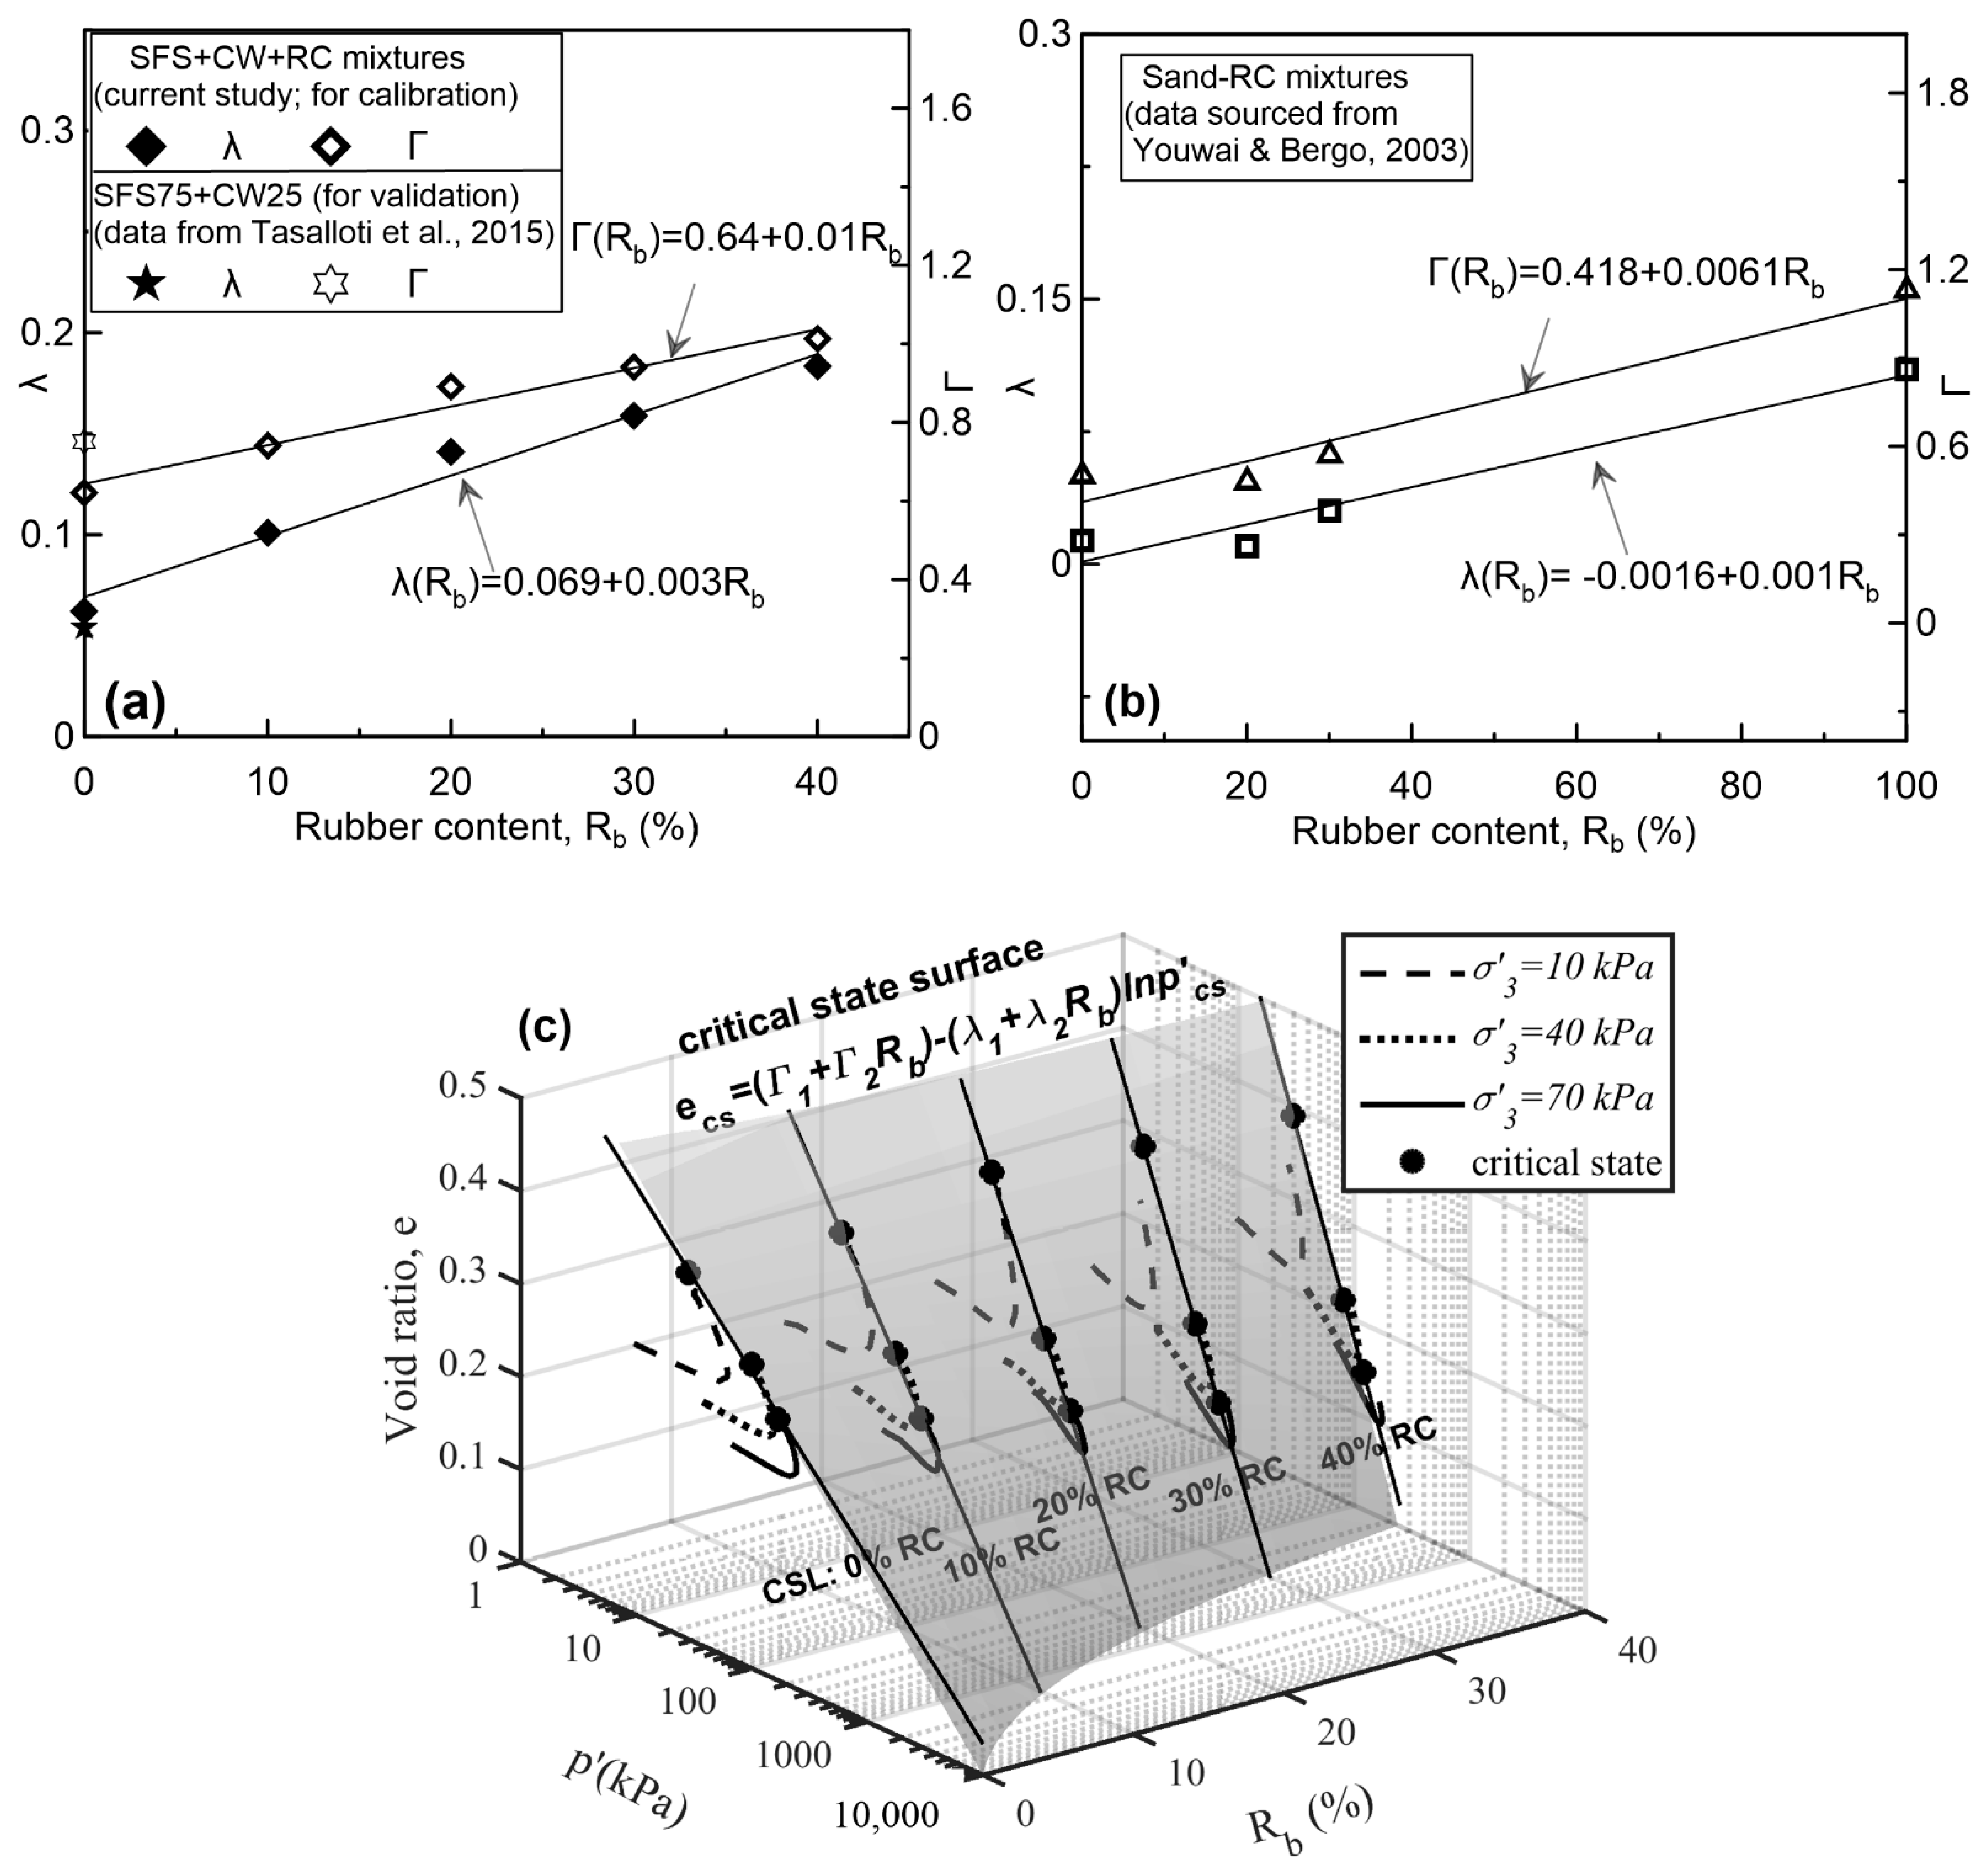
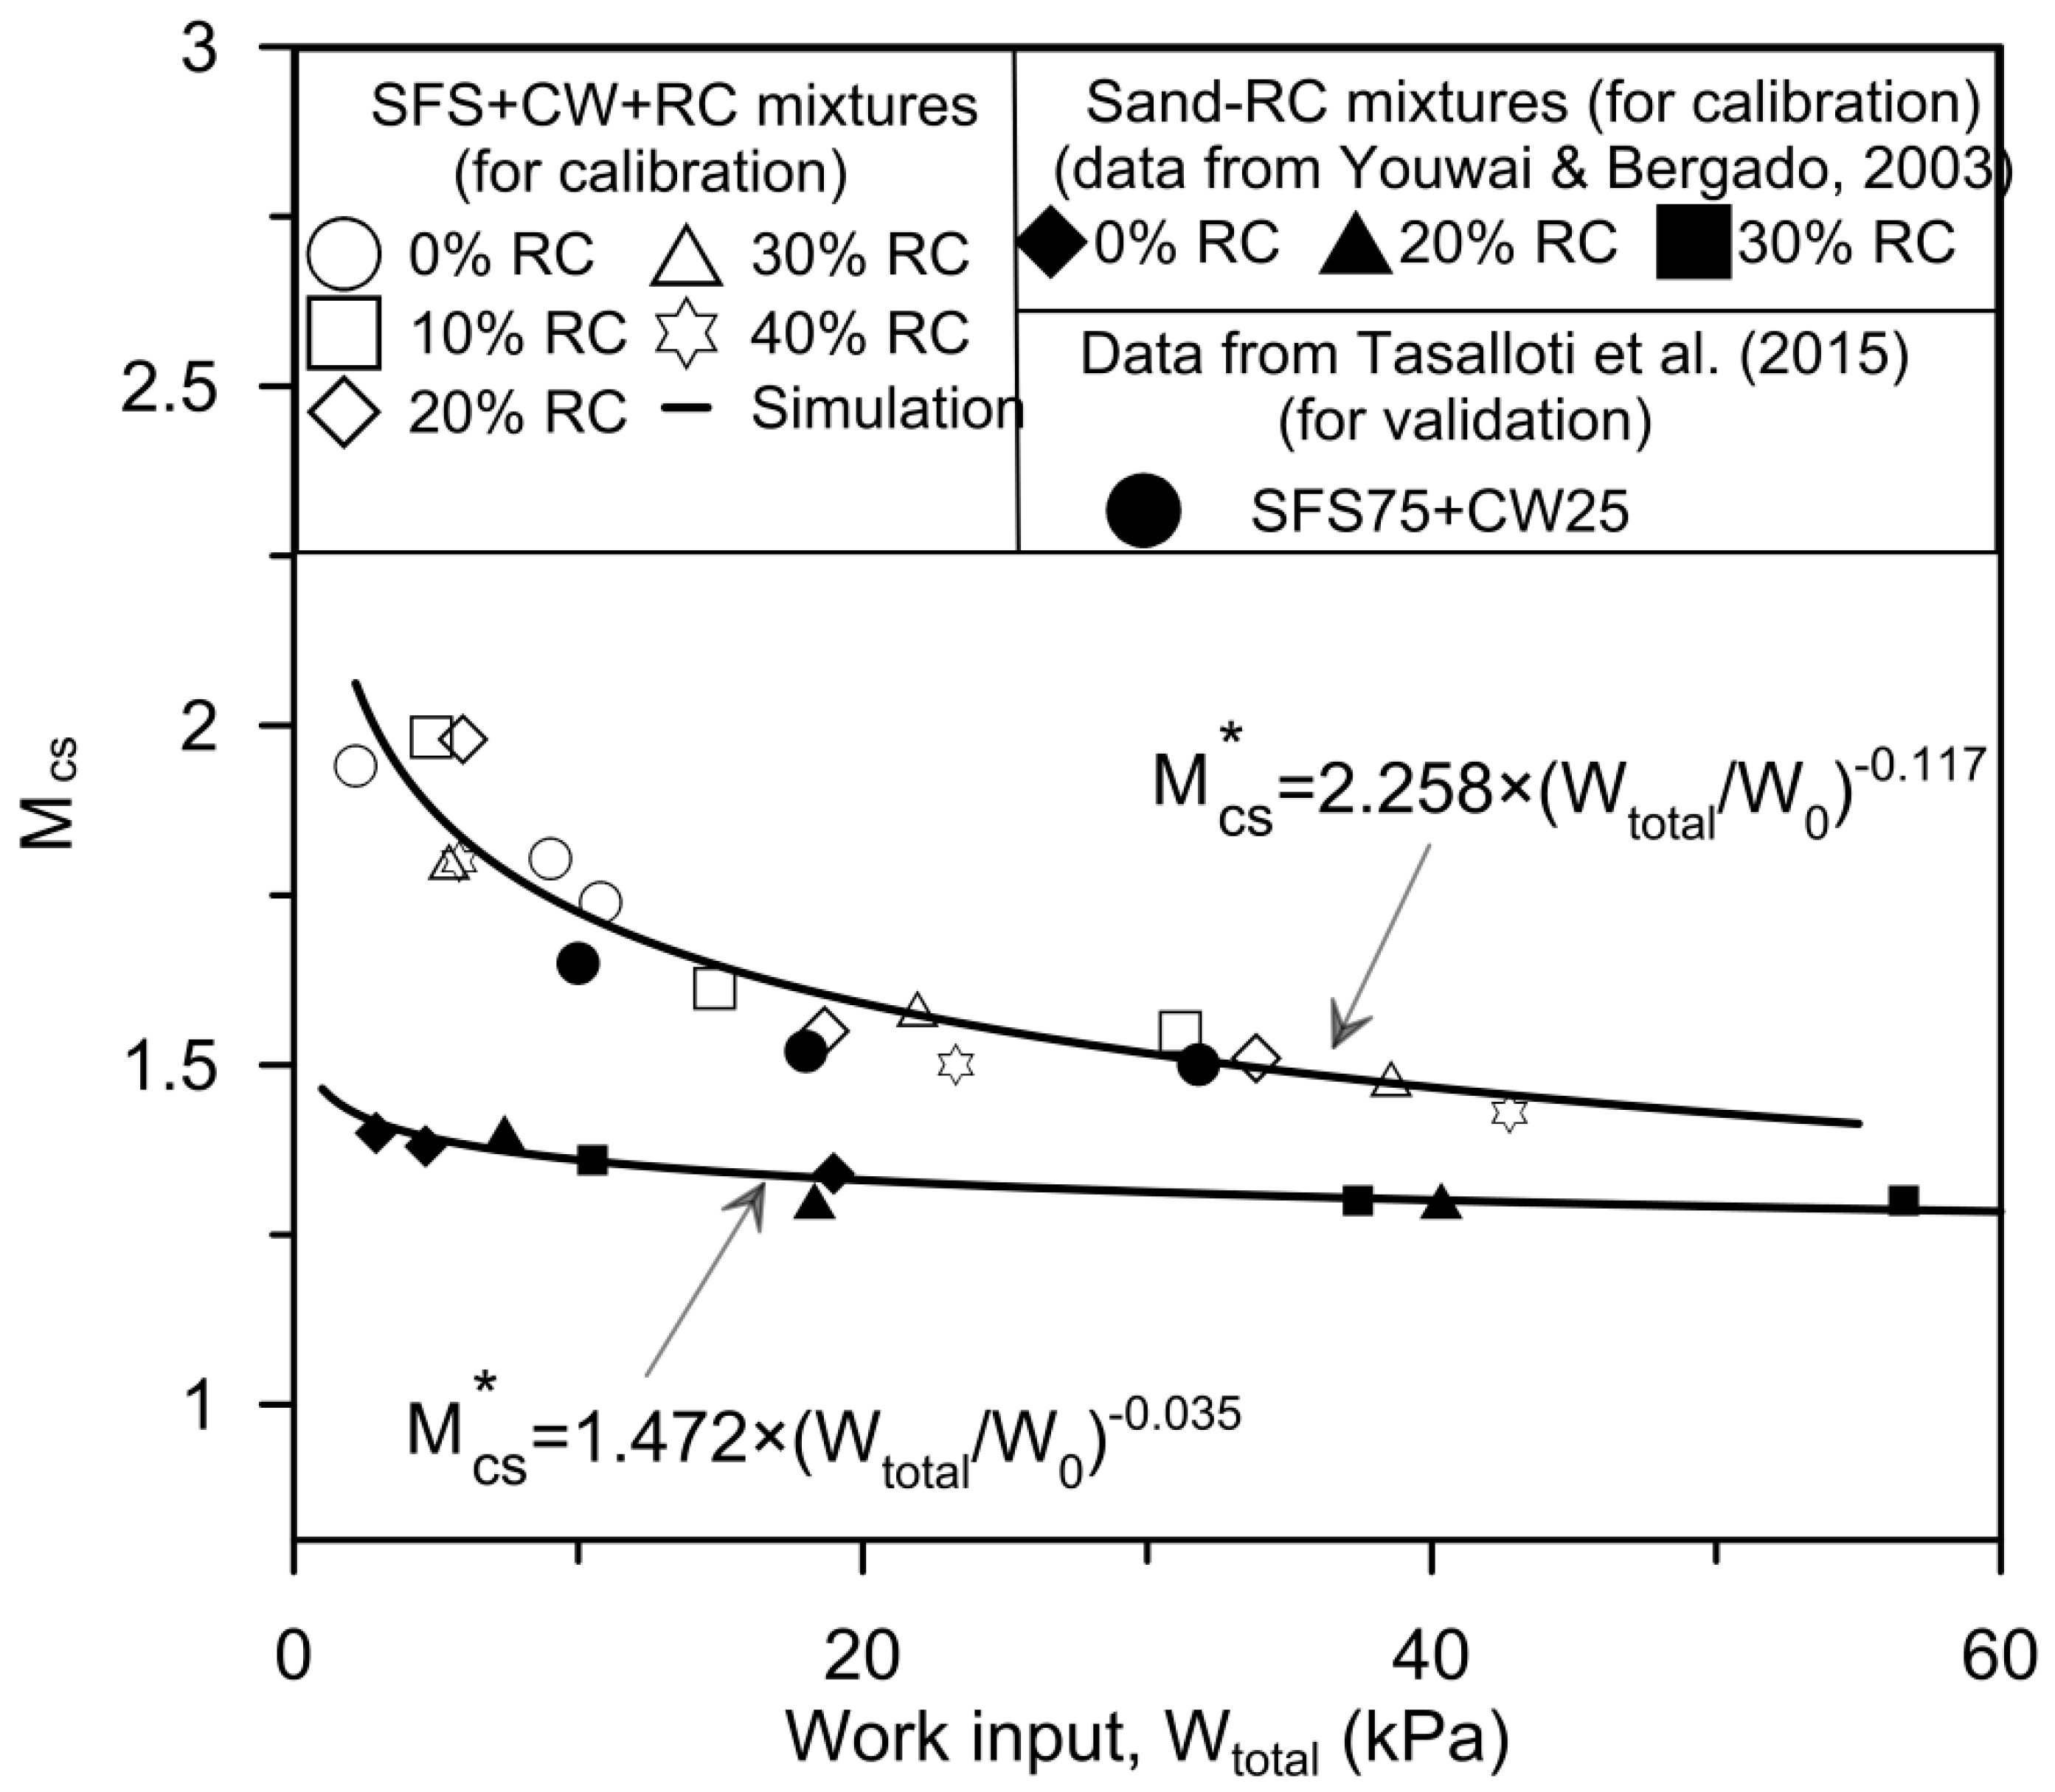
2.1.2. The Critical State

The critical state refers to a condition of a material where there is no further change in the mean effective stress and deviator stress with increasing axial strain, meanwhile, the dilatancy d ε v p / d ε v q is also approaching zero, i.e.,
d p d ε q = d p d ε q = d ε v p d ε v q = 0
Since rubber chips or tyre fibre continuously change shape towards the end of the triaxial test, it is difficult or even impossible to achieve a critical state. However, the rubber crumbs are usually smaller, so they are hindered from deformation by the surrounding stiff particles (e.g., SFS and CW). This implies that soil-RC mixtures can attain a critical state, albeit with larger amounts of RC the axial strain ε 1 can be higher than 25% [39]. Since most laboratory conditions are limited, ε 1 > 25 % is difficult to achieve, and thus the parameters related to the critical state (e.g., the stress ratio at critical state M c s = q c s / p c s , and the critical void ratio e c s ) were obtained by extrapolation following Carrera et al. [42]. More details about the extrapolation for SFS+CW+RC mixtures can be found in Qi et al. [39]. The information associated with the critical state parameters for the materials investigated in this study is summarised in Table 1.
The critical state line (CSL) for each SFS+CW+RC blend with certain R b   ( % ) in the space of e ln p is linear; this is identical to other granular materials and is represented by:
e c s = Γ λ ln p c s
where Γ is the void ratio at p c s = 1   k P a , and λ is the slope of the CSL in e ln p space. By changing the amount of R b , the critical state parameters Γ and λ change with the amount of RC accordingly, and this effect can be captured by a linear relationship (Figure 1a) as:
Γ ( R b ) = Γ 1 + Γ 2 R b
λ ( R b ) = λ 1 + λ 2 R b
where   Γ 2 , λ 1 , and   λ 2 are the calibration parameters computed on the basis of laboratory data for SFS+CW+RC mixtures (SFS:CW = 7:3 with different R b ) obtained by [39], and the test data for SFS75+CW25 (SFS:CW 7 : 3 , R b = 0 % ) reported by Tasalloti et al. [40] is also shown in Figure 1a for validation purposes. The slight divergence between the proposed empirical relationship and the validation data may be due to the minor difference in the SFS:CW ratio. Similarly, a linear relationship is also found for sand-RC mixtures from [26], as shown in Figure 1b. This linear relationship is based on sand-RC mixtures that can reach or almost reach a critical state under laboratory conditions (test data provided in Table 1).
Substituting Equations (7) and (8) into Equation (6), the CSL for SFS+CW+RC blends is now a function of p c s and R b , indicating a critical state surface can be formed in the space of e ln p R b , as illustrated in Figure 1c, that can be expressed by:
e c s * = Γ 1 + Γ 2 R b ( λ 1 + λ 2 R b ) ln p c s
where e c s * is the modified critical void ratio related to the RC content ( R b ).
M c s for each SFS+CW+RC blend with a certain amount of RC varies with σ 3 and R b , as seen in Table 1. It is also aware that the total work input W t o t a l is also influenced by the σ 3 and R b , which indicates that W t o t a l is the potential parameter that will reflect the changes of M c s , and also help to incorporate the energy-absorbing property of the blends. This is in agreement with Chavez and Alonso [43], who also proposed that the work input is a good indicator to capture the variations of M c s that are influenced by parameters such as σ 3 and suction of rockfill. The increment of W t o t a l is the total incremental work input by the applied stress q and p , as shown below:
d W t o t a l = p d ε v + q d ε q
where d W t o t a l is the total incremental work input and d ε v and d ε q are the incremental volumetric and deviator strains, respectively. Here, the total work input is calculated up to failure, which is taken as the peak deviator stress introduced by Zornberg et al. [44].
By connecting W t o t a l to M c s in Figure 2, an empirical relationship is established:
M c s * = q c s p c s = M 0 × ( W t o t a l W 0 ) α
where M c s * is the modified critical stress ratio by relating to the total work input, M 0 is the critical stress ratio when W t o t a l = 1   k P a , α is a regression coefficient, and W 0 = 1   k P a is used to keep the same units on both sides of the equation.
For validation purposes, data for SFS75+RC25 from Tasalloti et al. [40] are also shown in Figure 2, as is the good correlation with the proposed empirical relationship. Moreover, in Figure 2 a similar power relationship is established between M c s and W t o t a l for sand-RC mixtures based on test data for mixtures involving 0%, 20%, and 30% RC [26]. This empirical equation will help to estimate the critical state parameters for soil-RC mixtures with larger quantities of RC, which cannot reach a critical state due to the limited laboratory conditions.

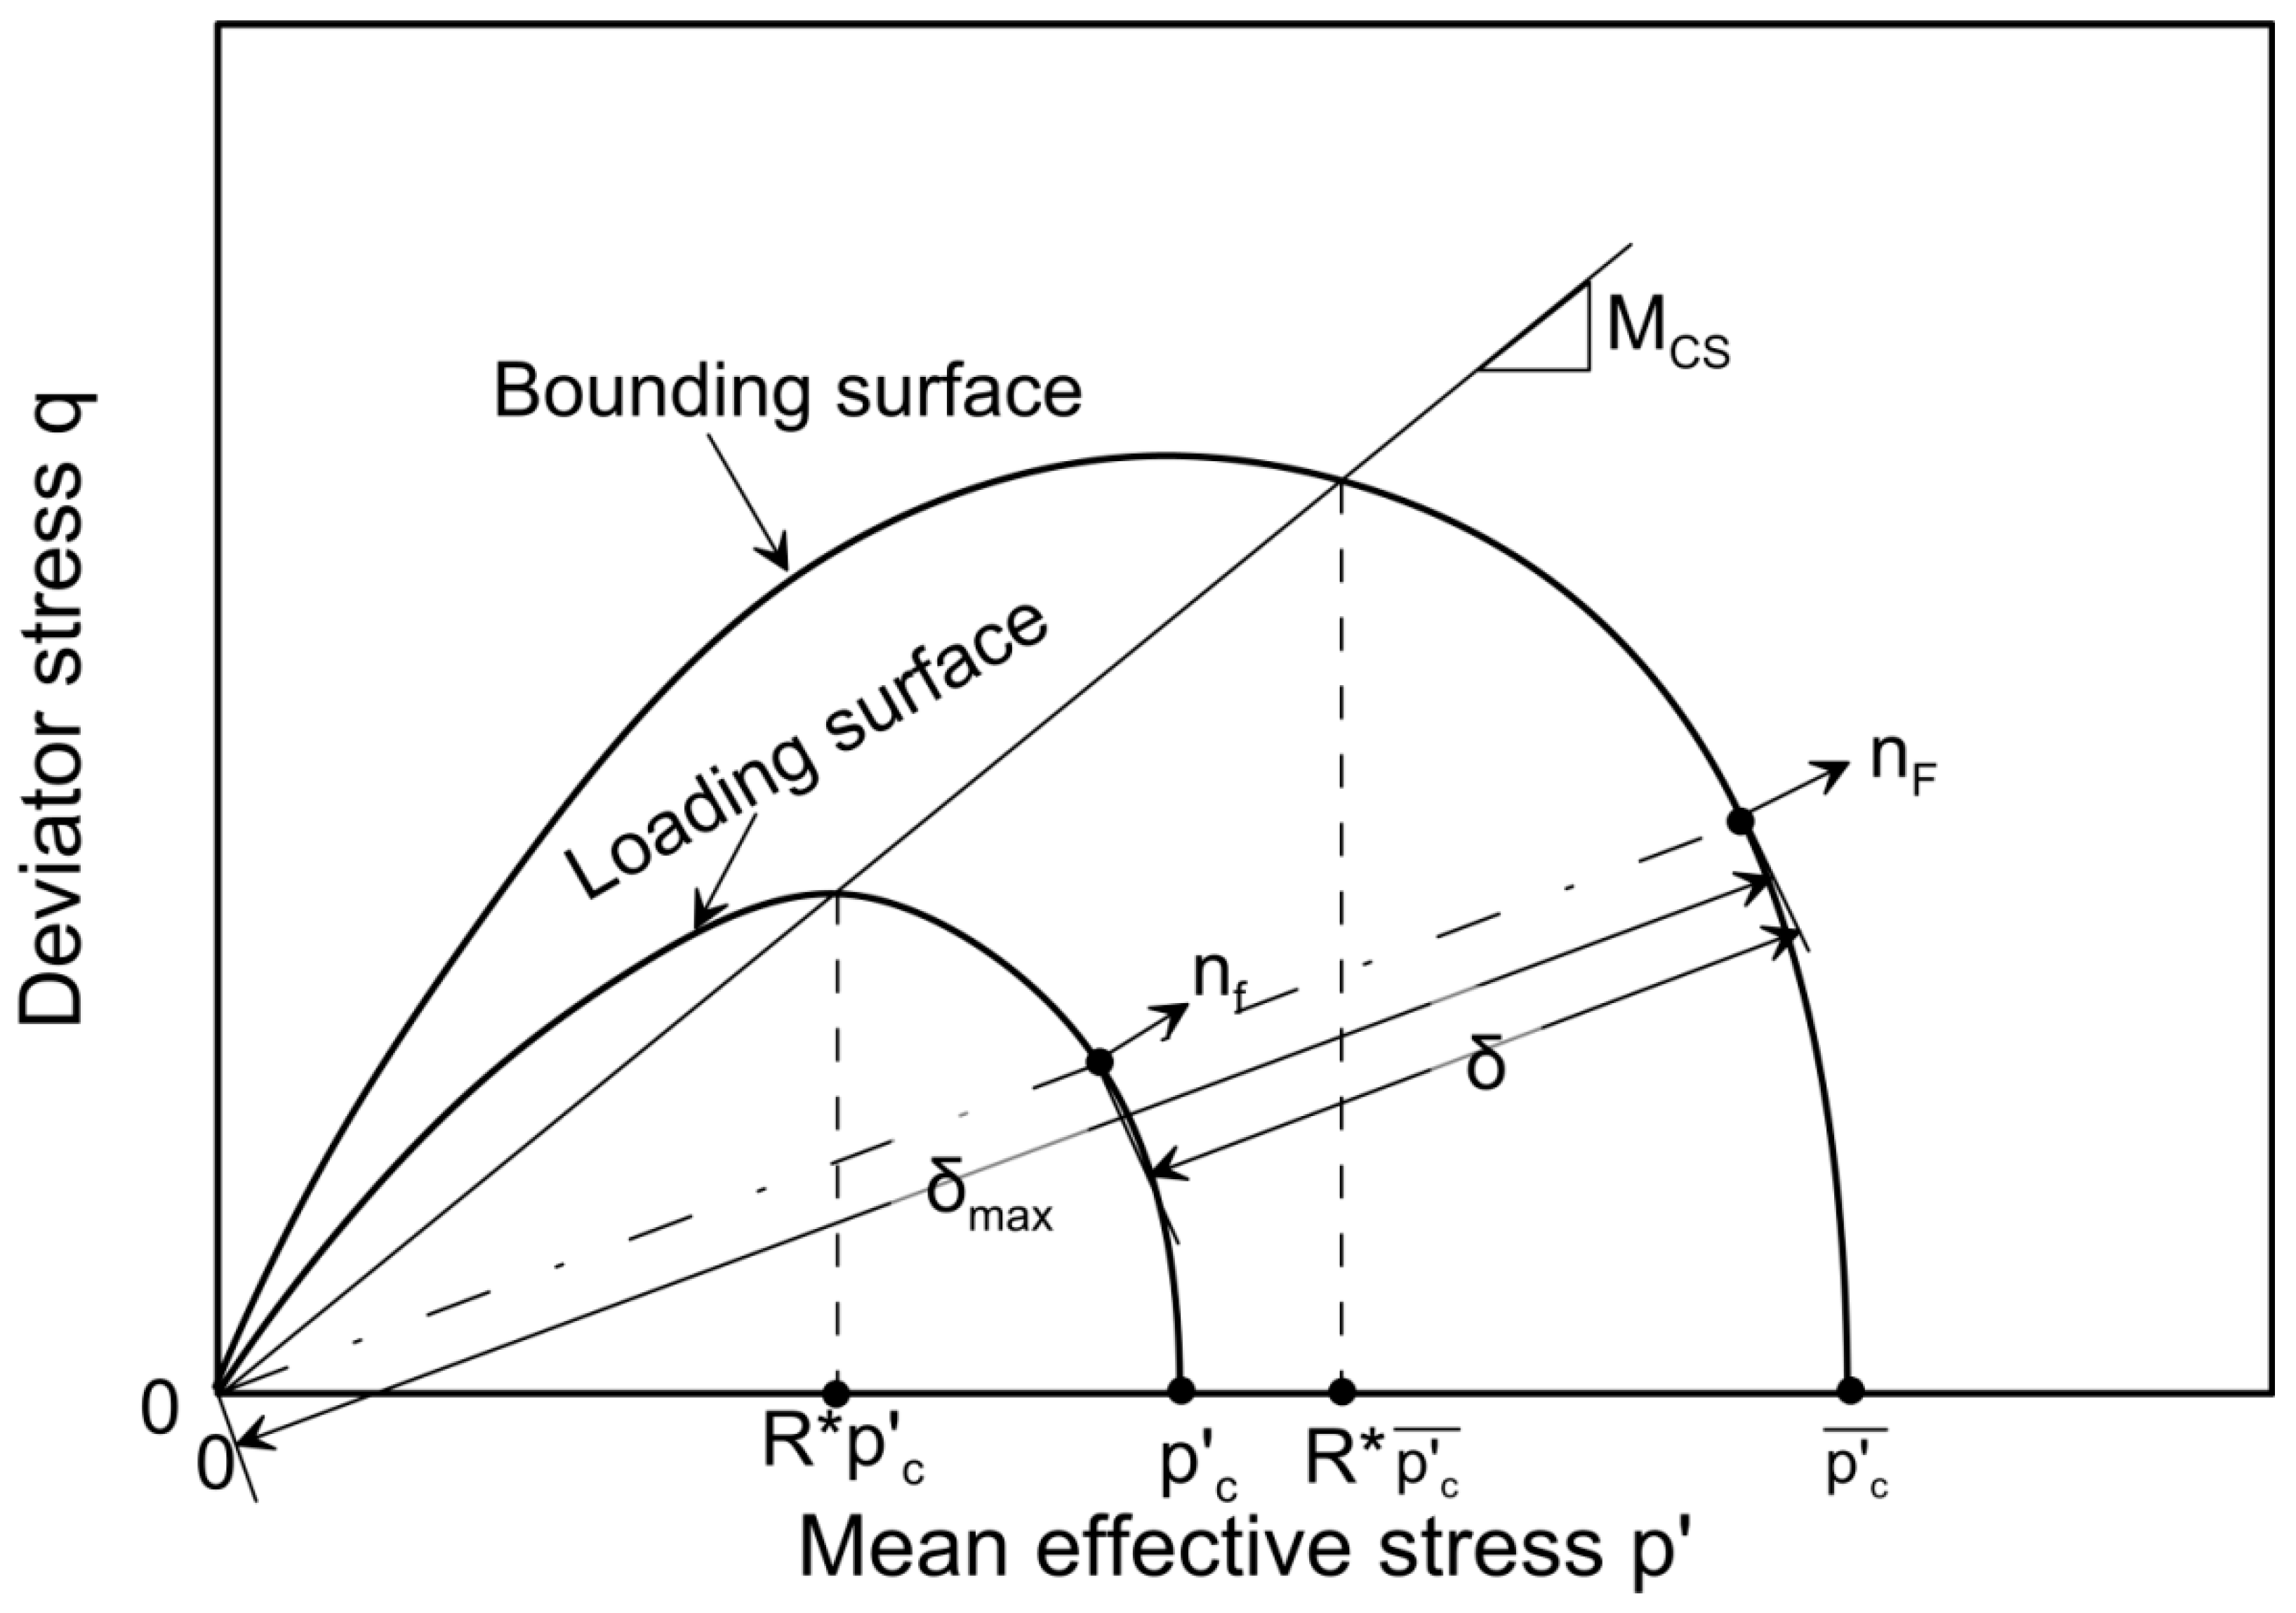
2.1.3. Bounding Surface and Loading Surface

This study used bounding surface plasticity theory because, unlike conventional elastic-plasticity theory, it has a versatile formulation for the loading and bounding surfaces, which eliminates the abrupt change between elastic and elastic-plastic response [45,46,47].
The shape of the bounding surface was selected experimentally based on the undrained behaviour of granular materials. The bounding surface is shaped like a half water drop which aims to cover the triaxial compaction behaviour [48,49]. To facilitate further analysis, the same shape was adopted for the loading surface [45,50]; in this instance, the bounding surface F ( p ¯ , q ¯ , p ¯ c ) = 0 and the loading surface f ( p , q , p C ) = 0 for the waste matrix are represented by [46]:
F ( p ¯ , q ¯ , p ¯ c ) = { q ¯ + M c s * ( p ¯ ) [ N ln ( p ¯ p ¯ C ) ] 1 / N } = 0
f ( p , q , p C ) = { q + M c s * ( p ) [ N ln ( p p C ) ] 1 / N } = 0
where p ¯ c and p C refer to the interception points of the bounding surface and loading surface with the q = 0 axis, respectively, and they are the key factors controlling the size of the bounding surface and the loading surface (Figure 3). N 1 is a constant relating to the material properties and it governs the curvature of the bounding surface. R = p p C = p ¯ p ¯ C is another material constant to express the ratio between p and p C , and the ratio between p ¯ and p ¯ C . According to the radial mapping rule [51,52], the stress ratio η is expressed as η = q p = q ¯ p ¯ . By combining Equations (12) and (13), and then substituting the stress ratio η function, the material constant R can be rewritten as
R * = e x p [ 1 N ( η M c s * ) N ]
The value of p ¯ c controls the size change of the bounding surface which is connected to the change of the volumetric strain; therefore, to locate the position of p ¯ c , the swelling line
e = e κ 0 κ ln p
is combined with Equations (6)–(8) and Equation (14), and then the position of p ¯ c is obtained
p ¯ c = p r R * e x p ( Γ ( R b ) e κ ln p λ ( R b ) κ )
where e κ 0 refers to the void ratio when p = 1 in Equation (15), p r denotes the unit pressure, and Γ ( R b ) and λ ( R b ) are critical state parameters modified by the amount of RC.
The unit normal loading vector n at the image point on the bounding surface is then obtained through Equation (17):
n = F / σ ¯ F / σ ¯ = [ n p ,   n q ] T = [ M c s * [ N ln p ¯ p c ¯ ] 1 N [ 1 + ( N ln p ¯ p c ¯ ) 1 ] { M c s * [ N ln p ¯ p c ¯ ] 1 N [ 1 + ( N ln p ¯ p c ¯ ) 1 ] } 2 + 1 , 1 { M c s * [ N ln p ¯ p c ¯ ] 1 N [ 1 + ( N ln p ¯ p c ¯ ) 1 ] } 2 + 1 ] T
where σ ¯ represents the effective stress on the bounding surface, and n p and n q are the loading direction vectors.

2.1.4. Plastic Potential

The plastic potential, also regarded as the dilatancy relationship d = d ε v p d ε q p , is related to the state of soil corresponding to its compaction status and the applied pressure. Been and Jefferies [53] proposed a state parameter ψ after Worth and Bassett [54] to include the influence of the soil density and applied pressure on the deformation behaviour of soil, and ψ can be defined by Equation (18) as the difference between the current void ratio and the critical void ratio under the same loading conditions:
ψ = e e c s
By substituting Equation (9), ψ can be re-written as:
ψ * ( R b ) = e ( Γ 1 + Γ 2 R b ( λ 1 + λ 2 R b ) ln p c s )
According to Li and Dafalias [55], the dilatancy ( d ) is related to ψ , and may be represented by:
d = d ε v p d ε q p = g / p g / q = d 0 ( e m ψ * ( R b ) η M c s * )
where g denotes the plastic potential, and d 0 and   m are constants related to the material properties.
The plastic potential g = 0 can then be obtained by integrating Equation (20). The unit vector of plastic flow ( m ) at σ (the effective stress on the loading surface) can generally be expressed as:
m = g σ g σ = [ m p ,   m q ] T = [ d 1 + d 2 , 1 1 + d 2 ] T
where m p   and   m q refer to the plastic flow direction vectors.

2.1.5. Hardening Law

According to the bounding surface concept, H (the hardening modulus) is expressed with two components:
H = H b + H δ
where H b refers to the plastic modulus at σ ¯ , and H δ is the arbitrary modulus at σ . H b is then attained by adopting an isotropic hardening rule associated with ε v p   by using the following equation:
H b = F p ¯ c p ¯ c ε v p m p F / σ ¯ = M c s * p [ N ln p ¯ p ¯ C ] 1 N p ¯ c N ln p ¯ p ¯ C 1 + e λ ( R b ) κ d 0 ( e m ψ * R b η M c s * ) 1 + [ d 0 ( e m ψ * R b η M c s * ) ] 2 1 { M c s * [ N ln p ¯ p c ¯ ] 1 N [ 1 + ( N ln p ¯ p c ¯ ) 1 ] } 2 + 1
Based on the bounding surface theory, H δ represents a decreasing function related to the distance between σ and σ ¯ [56], and by taking an arbitrary form it can be expressed as:
H δ = h 0 δ δ m a x δ 1 + e λ ( R b ) κ p p ¯ c
where h 0 refers to a scaling parameter that controls the steepness of deformation behaviour in the ε v ε q space, so it may be considered as a material constant. δ m a x is the distance between the stress origin and the image stress point, and δ is the distance between the current stress point to the image stress point (Figure 3). Following the radial mapping rule, δ / ( δ m a x δ ) equals ( p ¯ c p C ) / p C . Since ( 1 + e ) / [ λ ( R b ) κ ] remains positive, H δ is always positive, and only when p ¯ c = p C , H δ reaches zero, at which H = H b , and in this case the material is purely plastic. When δ m a x δ , H δ = + , H tends to be very large and the soil behaviour becomes purely elastic, but when H = H b ,   H = 0 , the soil sample changes from strain hardening to strain softening.

2.1.6. Parameters Calibration

This proposed constitutive model needs 12 parameters; here, there are two elastic parameters, i.e., Poisson’s ratio v which is a constant related to materials properties, and κ which can be attained by unloading and reloading in isotropic compression.
The parameters reflecting the critical state are M 0 , α , Γ 1 , Γ 2 , λ 1 and λ 2 . α and M 0 are attained based on the relationship between the work input and critical stress ratio shown in Figure 2, and Γ 1 , Γ 2 , λ 1 , and λ 2 are calculated by curve fitting (Figure 1a,b). The parameter N is used to control the shape of the bounding surface and can be defined using a normalised q ~ p plot of the yield points from undrained shearing behaviour. Due to the unavailability of the undrained test results for this study, N = 1 was set for simplicity, in light of previous studies [46,57,58] for granular soils.
d 0 and m are related to the soil dilatancy; m is obtained through Equation (20) at the changing point where the material turns from contraction to dilation; therefore, d = d ε v p d ε q p = 0 , ψ * = ψ * d , and η = η d , so
m = 1 ψ * d ln ( η d M c s * )
and the parameter d 0 can be determined by Equation (20) at the failure point which achieves the peak deviator stress [27], so d = d p e a k , ψ * = ψ * p e a k , and η = η p e a k . Therefore,
d 0 = d p e a k ( e m ψ * p e a k η p e a k M c s * )
h 0 is the parameter associated with the hardening modulus and it is obtained by fitting ε v ε q curves. All the required parameters are listed in Table 1 and Table 2.

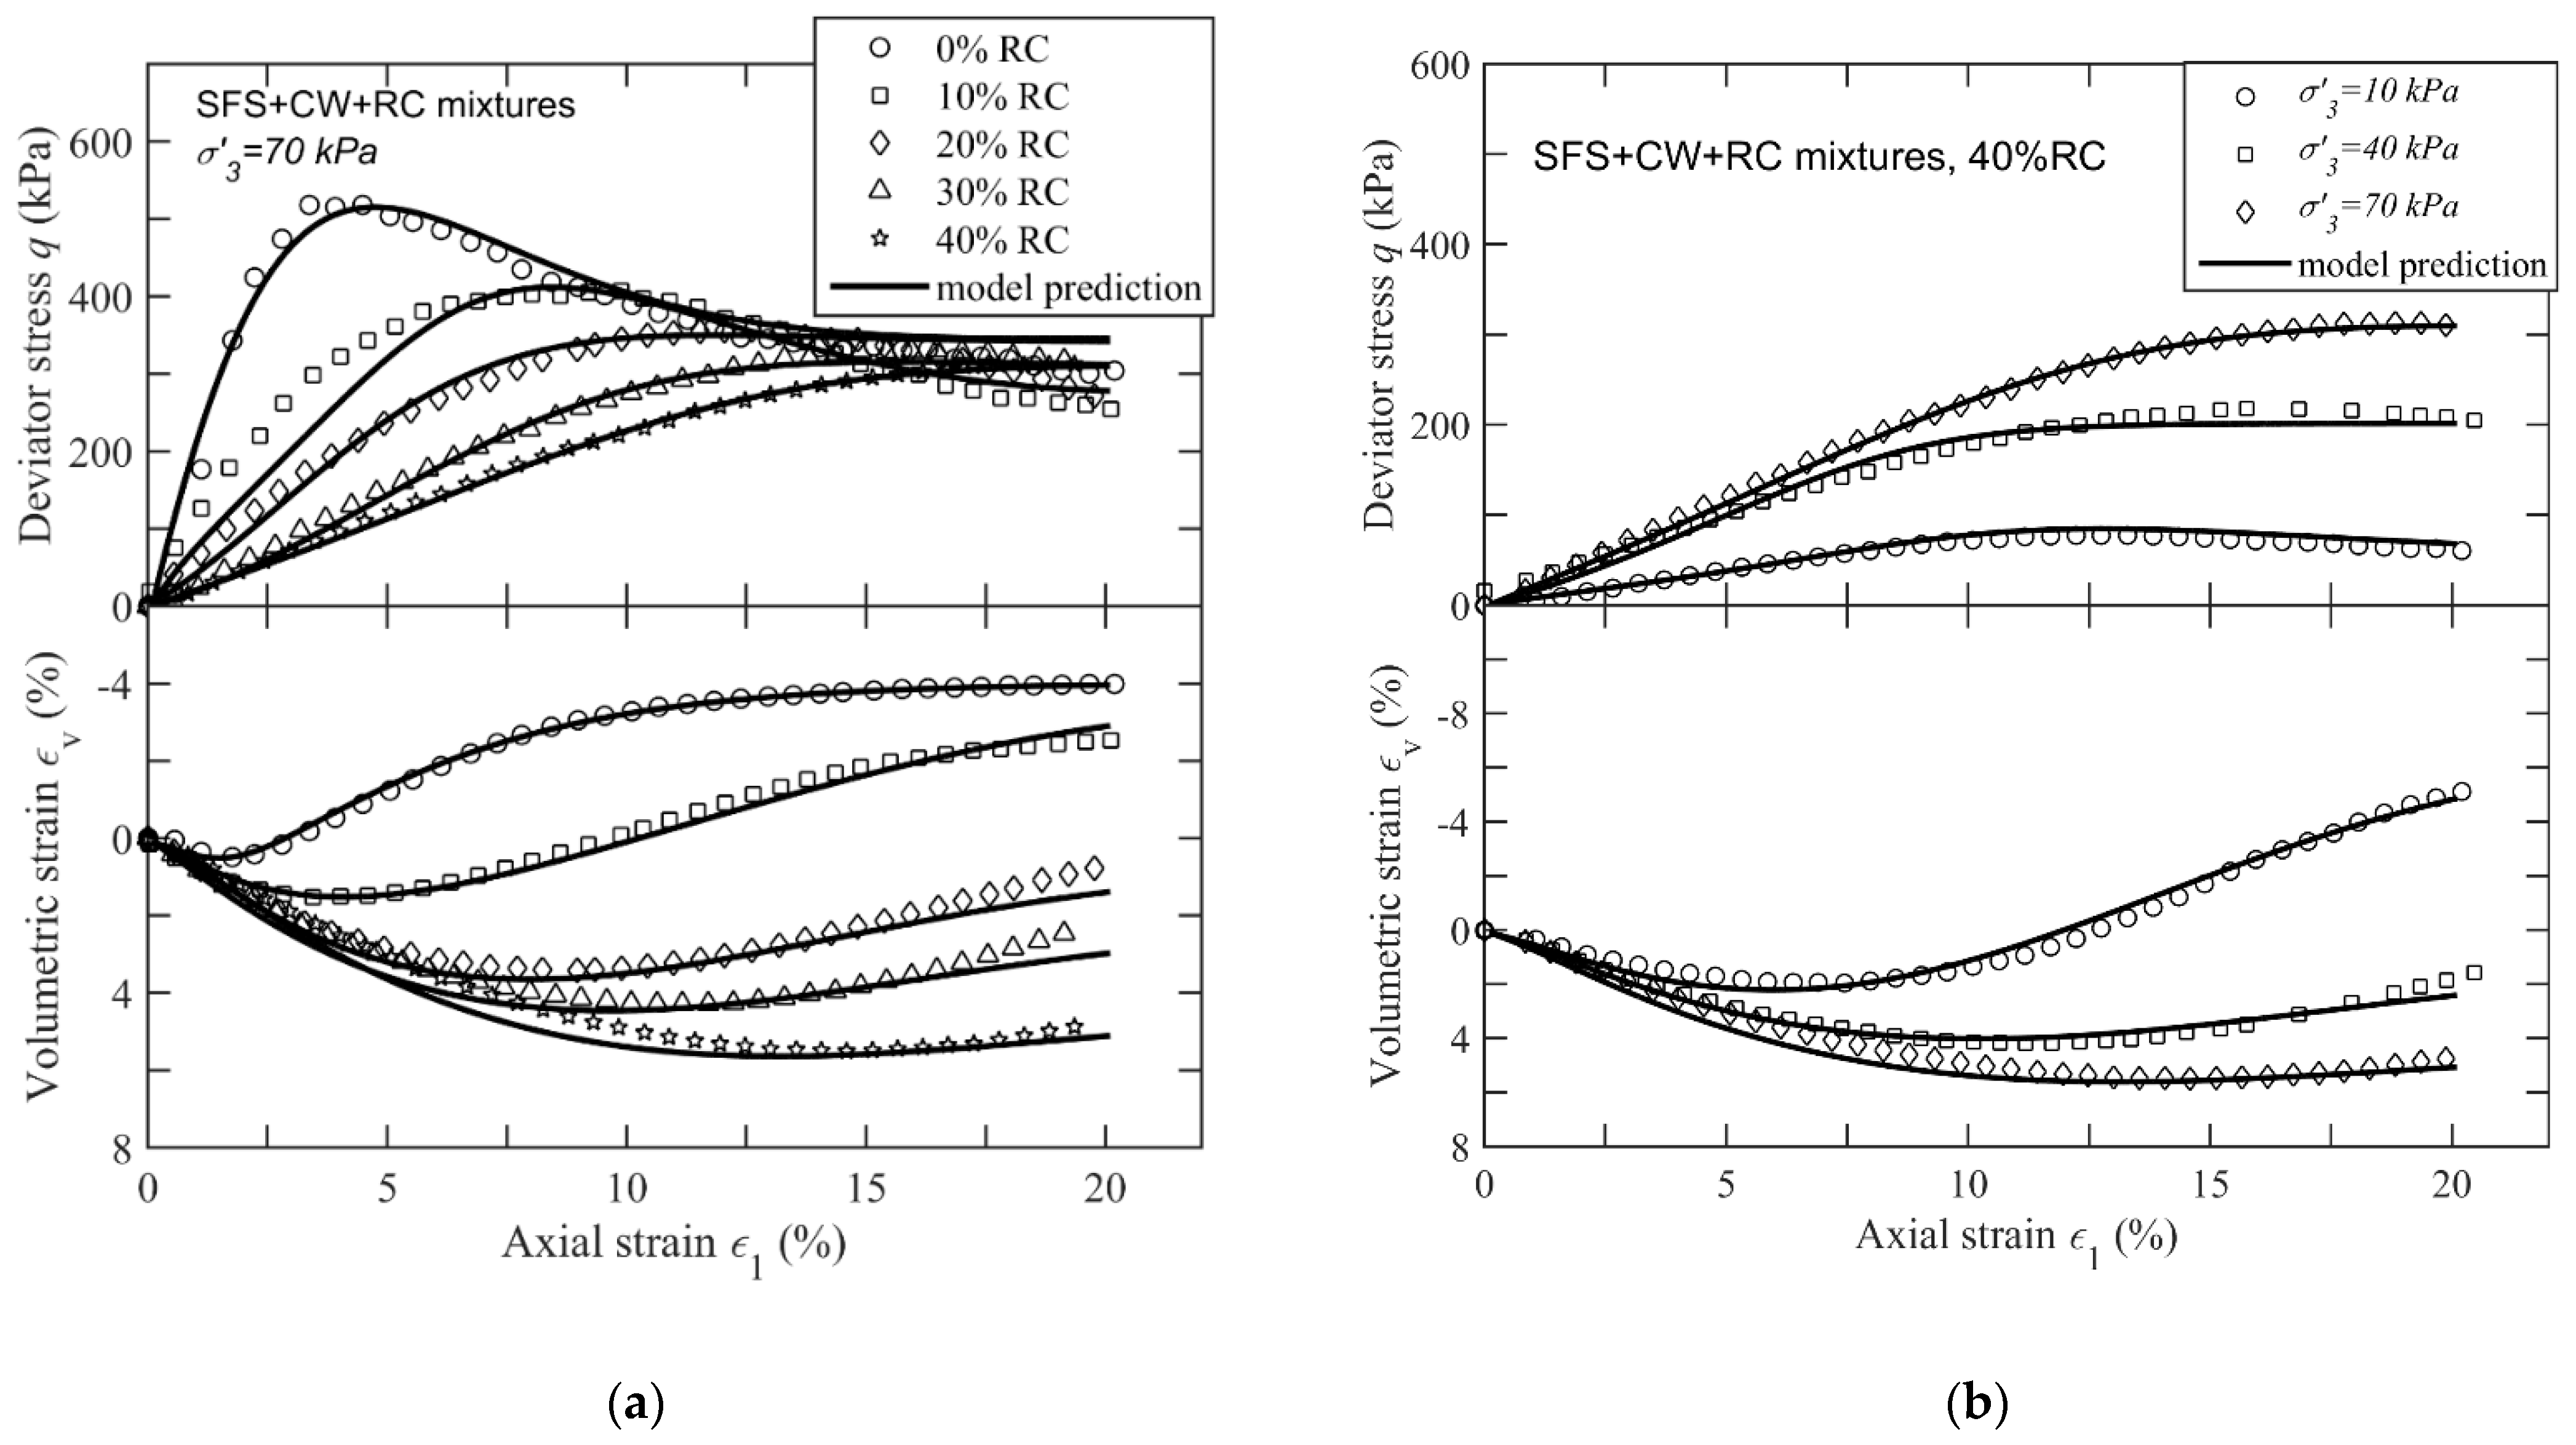
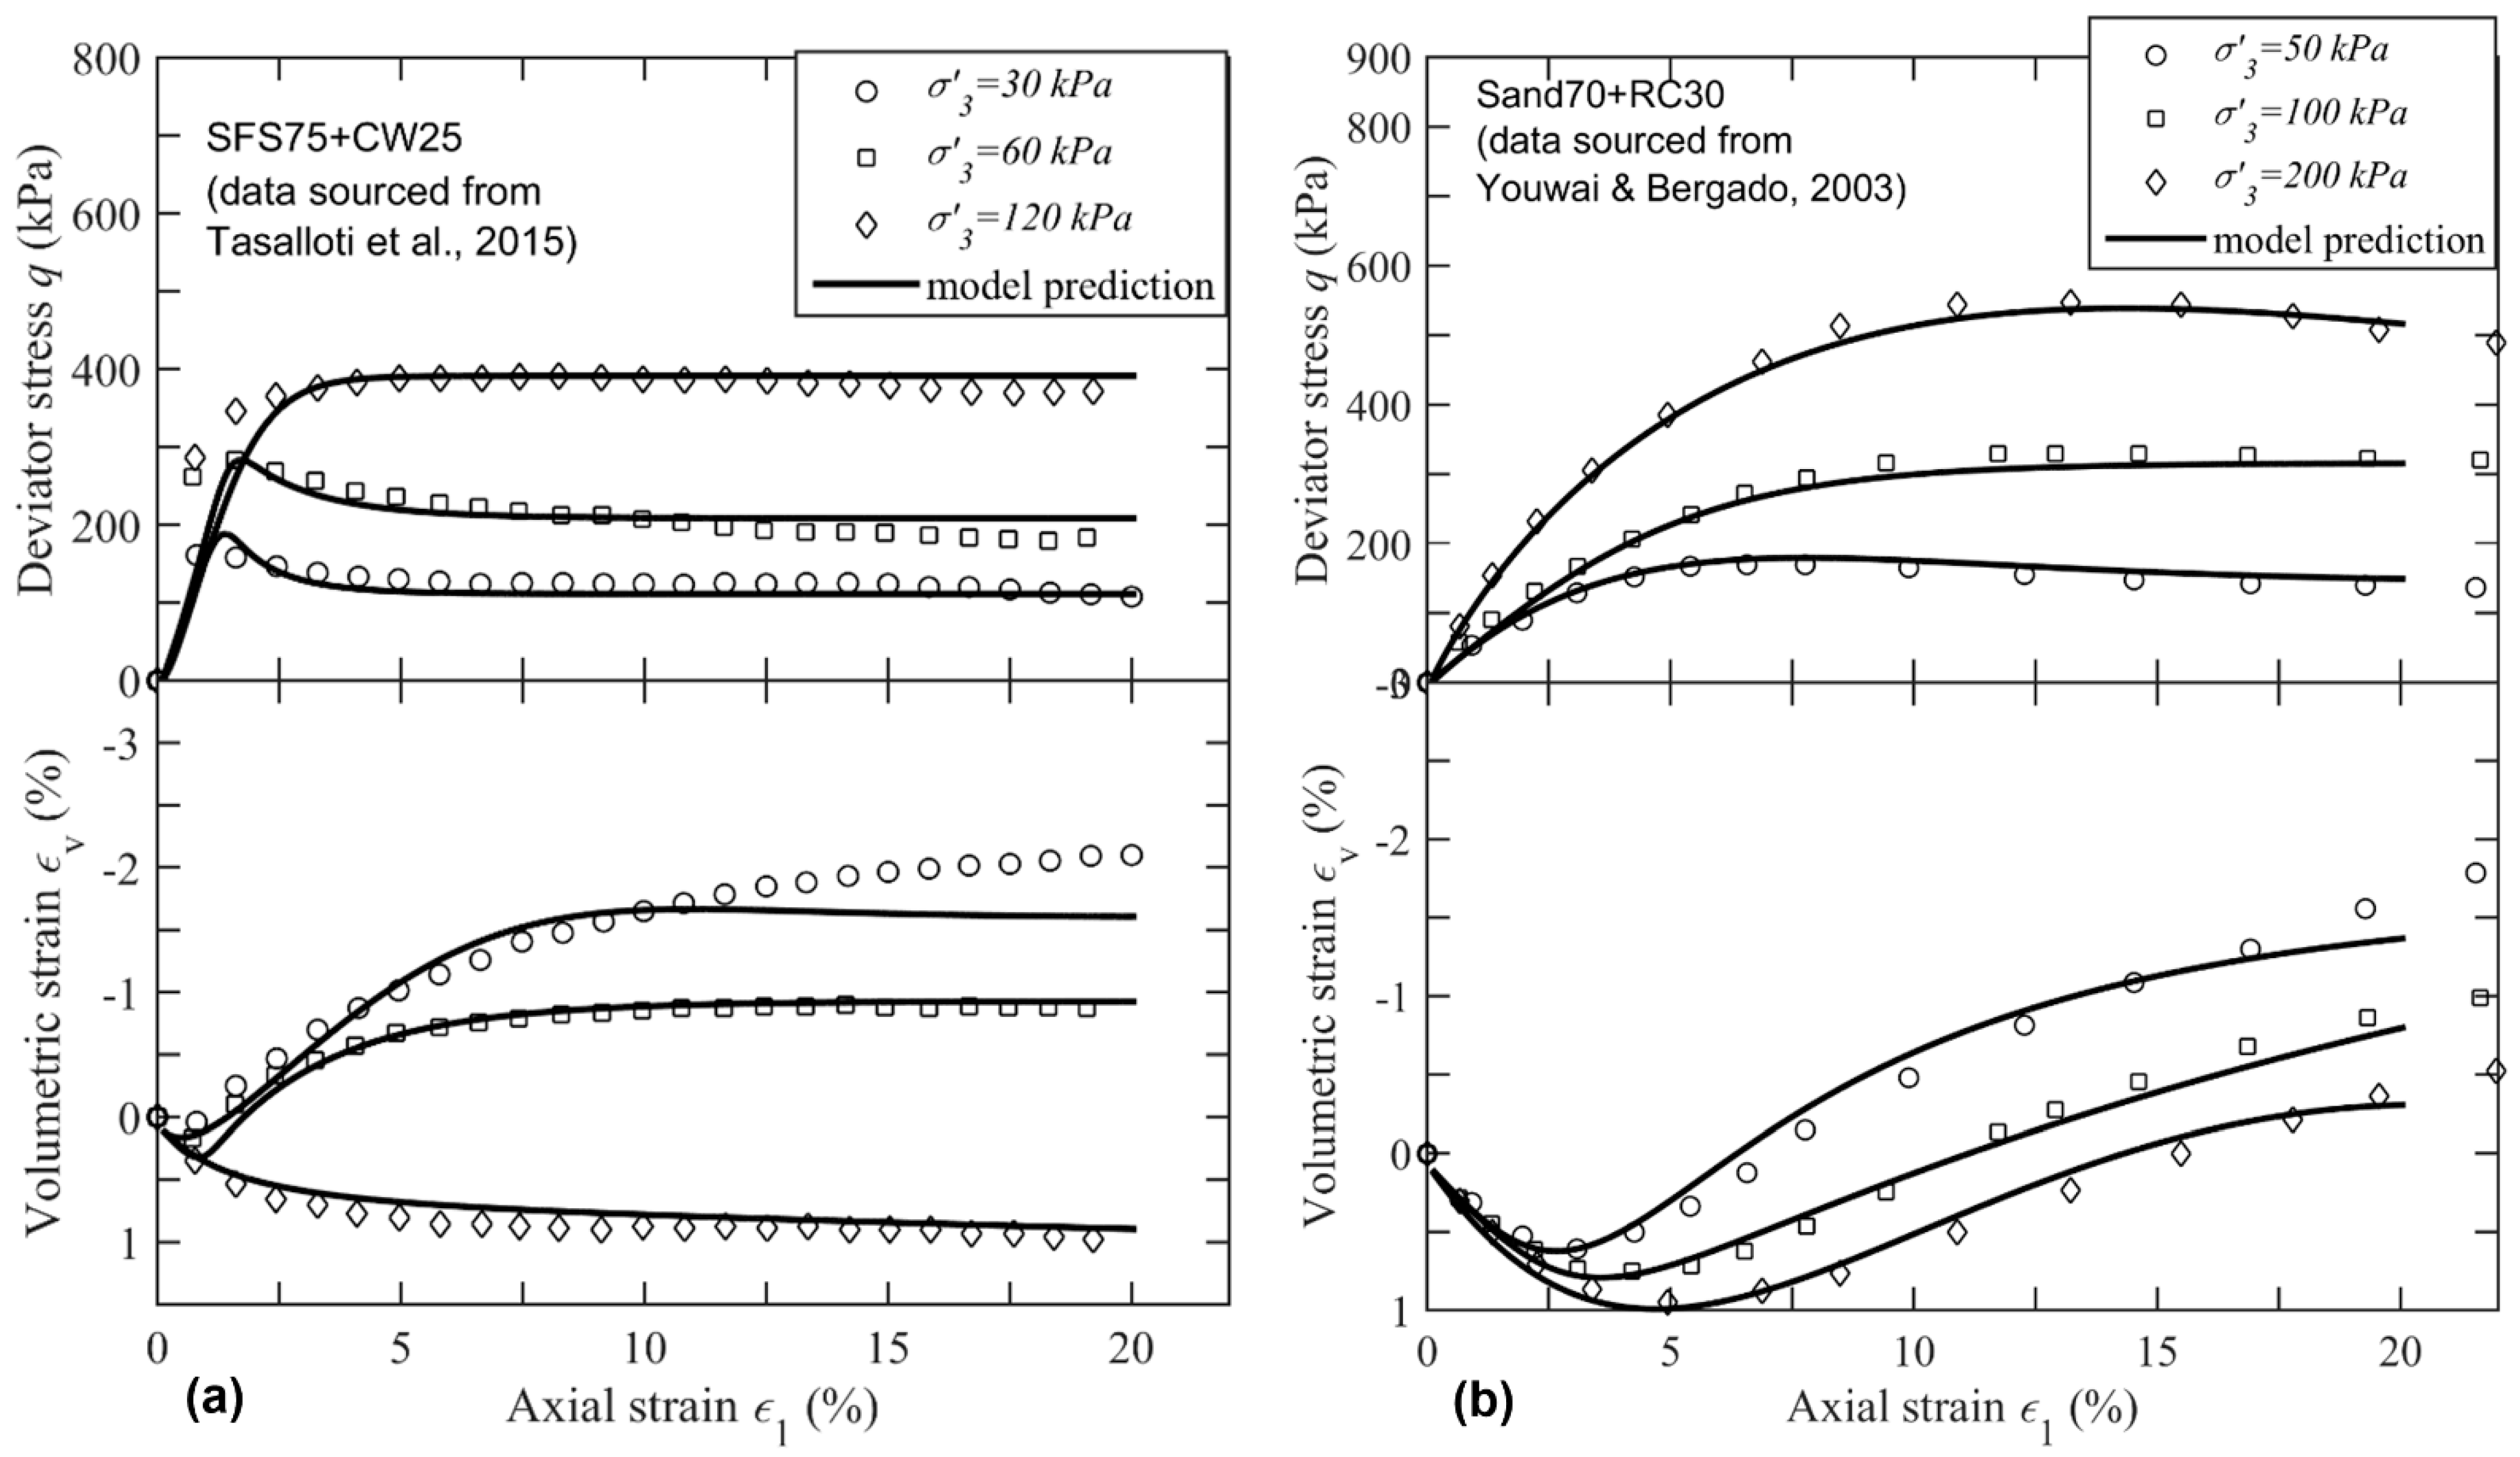
2.2. Model Validation

In order to validate the proposed constitutive model, a comparison was established between the model predictions and the test results for the above-mentioned mixtures, including SFS+CW+RC mixtures [38] (Figure 4), SFS75+CW25 mixtures [40] (Figure 5a), and sand-RC mixtures [26] (Figure 5b). Note that the developed model captured the overall stress-strain and volumetric responses of the mixtures with adequate accuracy. Figure 4 shows that by increasing R b in the waste matrix, (i) the peak deviator stress decreases, (ii) the specimen becomes more ductile, (iii) the volumetric response is more contractive, and (iv) the behaviour changes from strain-softening to strain-hardening. Moreover, in view of Figure 4b and Figure 5, when σ 3 increases, (i) the peak deviator stress increases, (ii) the strain-hardening response becomes more pronounced, and (iii) the specimen tends to exhibit a more significant contractive behaviour.
Without exception, the model developed for the waste matrix has some limitations. For instance, the bounding surface is defined for q > 0 , which means that this bounding surface model can only predict compressive loading conditions, and the proposed relationship for M c s relating to W t o t a l is specified for soil-RC mixtures with varying M c s . It is not appropriate for soil-rubber mixtures with larger particles of rubber, such as chips or tyre fibre because they may not reach a critical state even after large axial strain (>25%) due to the continuous deformation experienced by larger rubber particles towards the end of the tests.

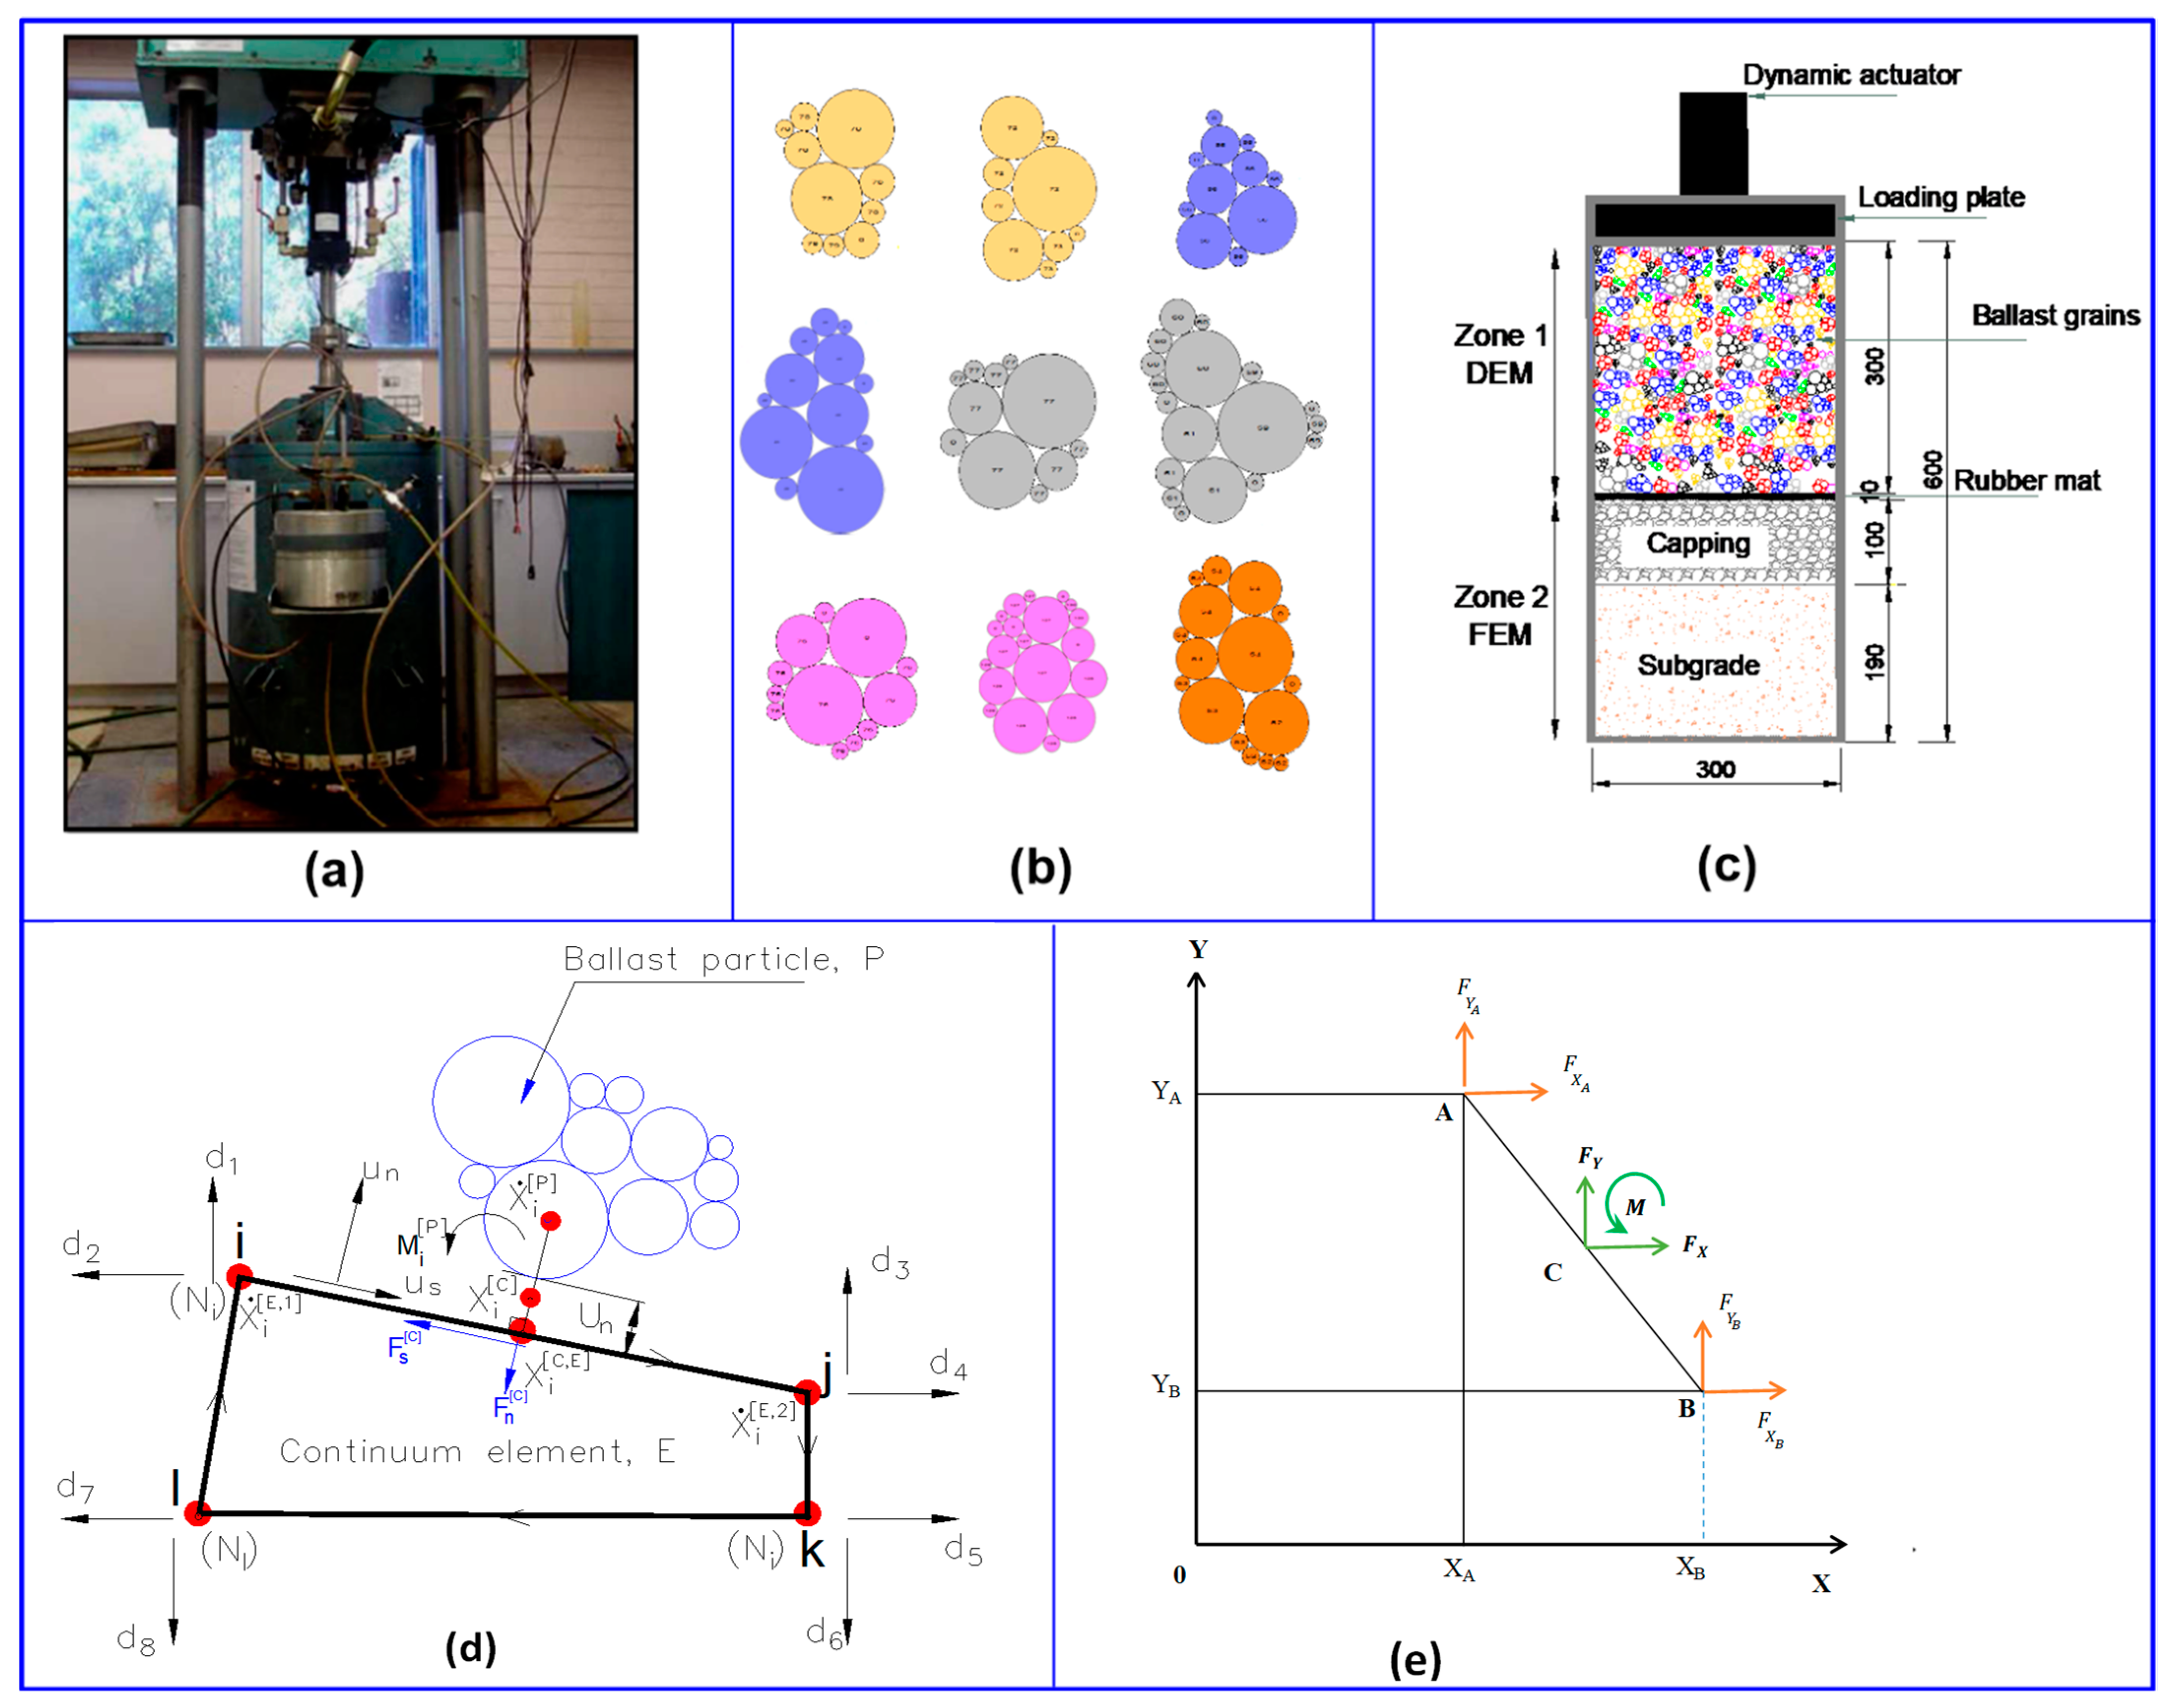
3. Discrete Element Modelling (DEM) of Ballasted Tracks Stabilised with Rubber Mats

The DEM was firstly proposed by Cundall and Strack [60] and is now widely used to explore the micromechanical response of ballast grains [5,34,61,62,63]. The pioneering work in applying the DEM to simulate ballast was conducted by McDowell and Bolton [64] at the Cambridge University; it then continued with researchers at Nottingham University [65], the University of Illinois [61], the University of Wollongong Australia [66], and at the Southwest Jiaotong University [34], among others. It is noteworthy that the macroscopic strength and load-deformation responses of ballast are associated with the internal arrangement of grains (i.e., the granular fabric). Yimsiri and Soga [67] found that this granular fabric influences the shear behaviour of the granular assembly such that once the material shears in the same direction as the major contact normals, it becomes stiffer, stronger, and more dilative [64,68,69]; however, this material will not be as stiff or dilative if it is sheared in an orthogonal direction. Cui and O’Sullivan [70] investigated the micro-scale parameters of granular materials and confirmed there are significant stress and strain non-uniformities within specimens subjected to shearing.

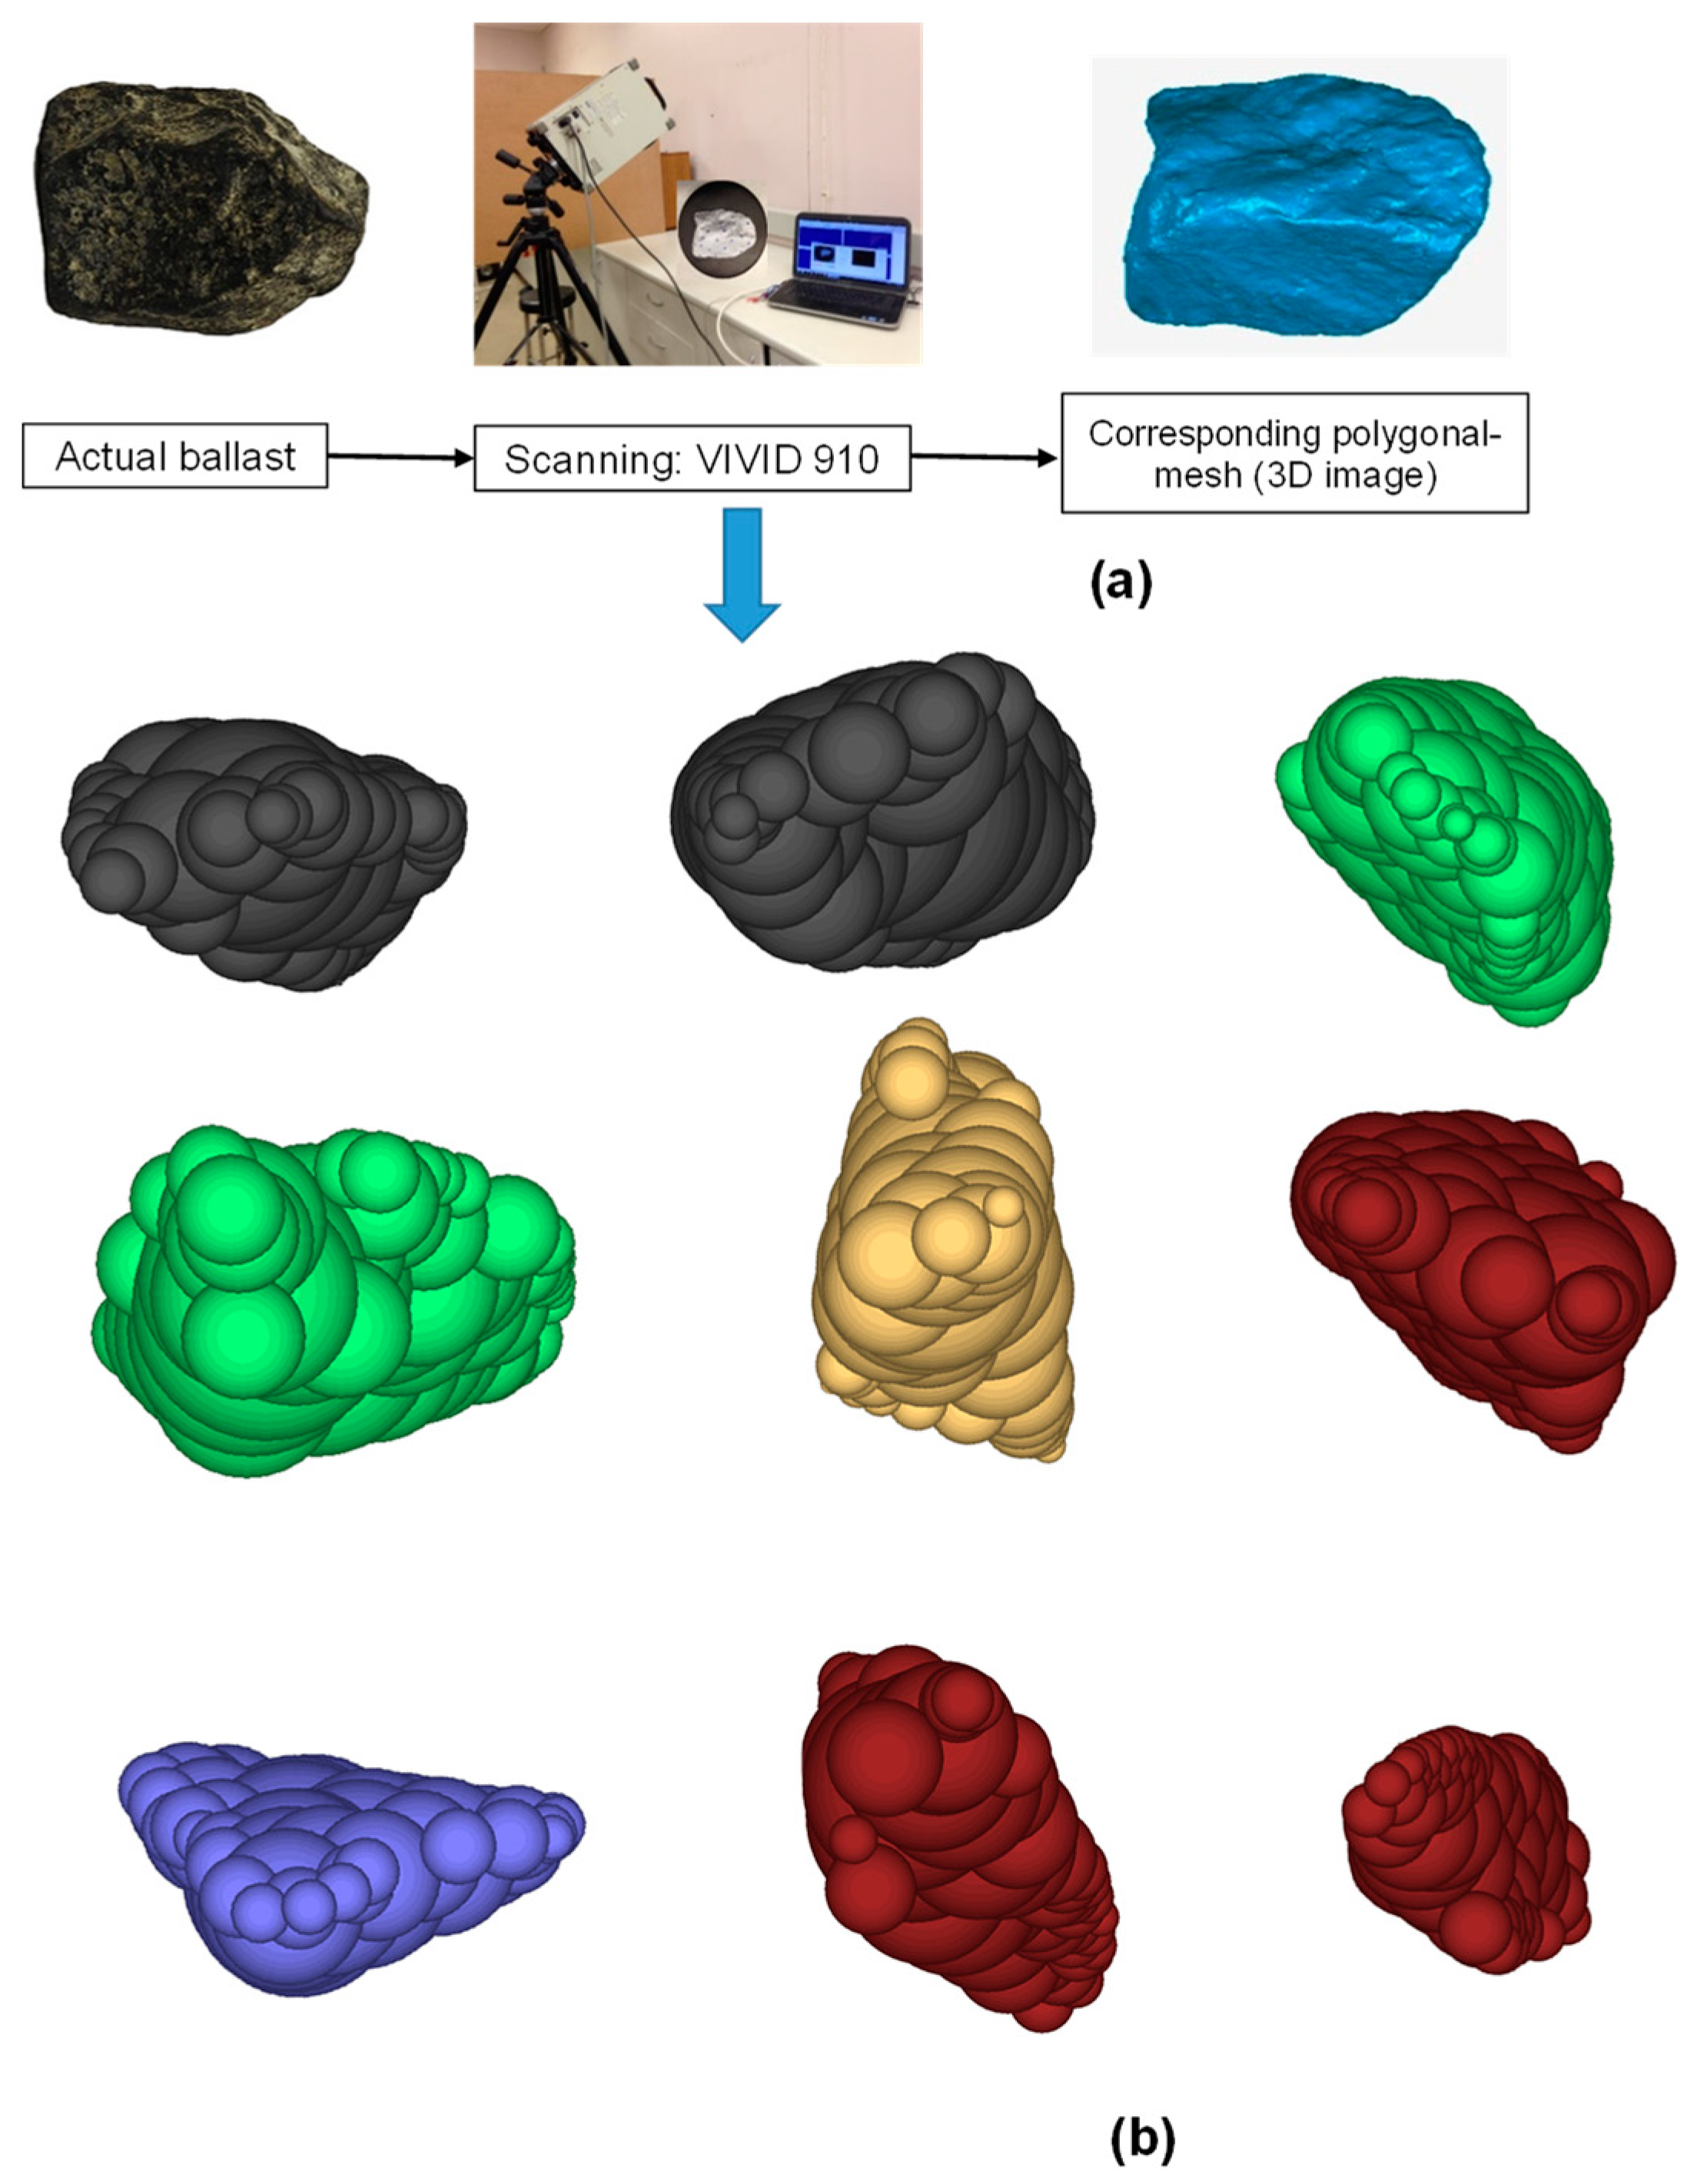
3.1. Modelling of Ballast Grains in DEM

It is well known that the size, shape, and angularity of particles influence the mechanical properties and stress-strain responses of ballast grains [64,71,72,73]. In this study, a 3D laser scanner was adopted to capture the actual shape, size and angularity of ballast. A number of representative ballast particles were chosen and scanned through the laser lights to form the polygonal-mesh, as shown in Figure 6a. Sub-routines were then programmed to build ballast particles in DEM by clumping many spheres together to fill up the polygonal-mesh (i.e., clump), as illustrated in Figure 6b. The parameters adopted for the DEM simulation of ballast were calibrated using the results obtained from laboratory tests for similar types of ballast grains. The input parameters were modified accordingly until the shear stress-strain behaviour predicted from the simulations agreed adequately with the experimental results.

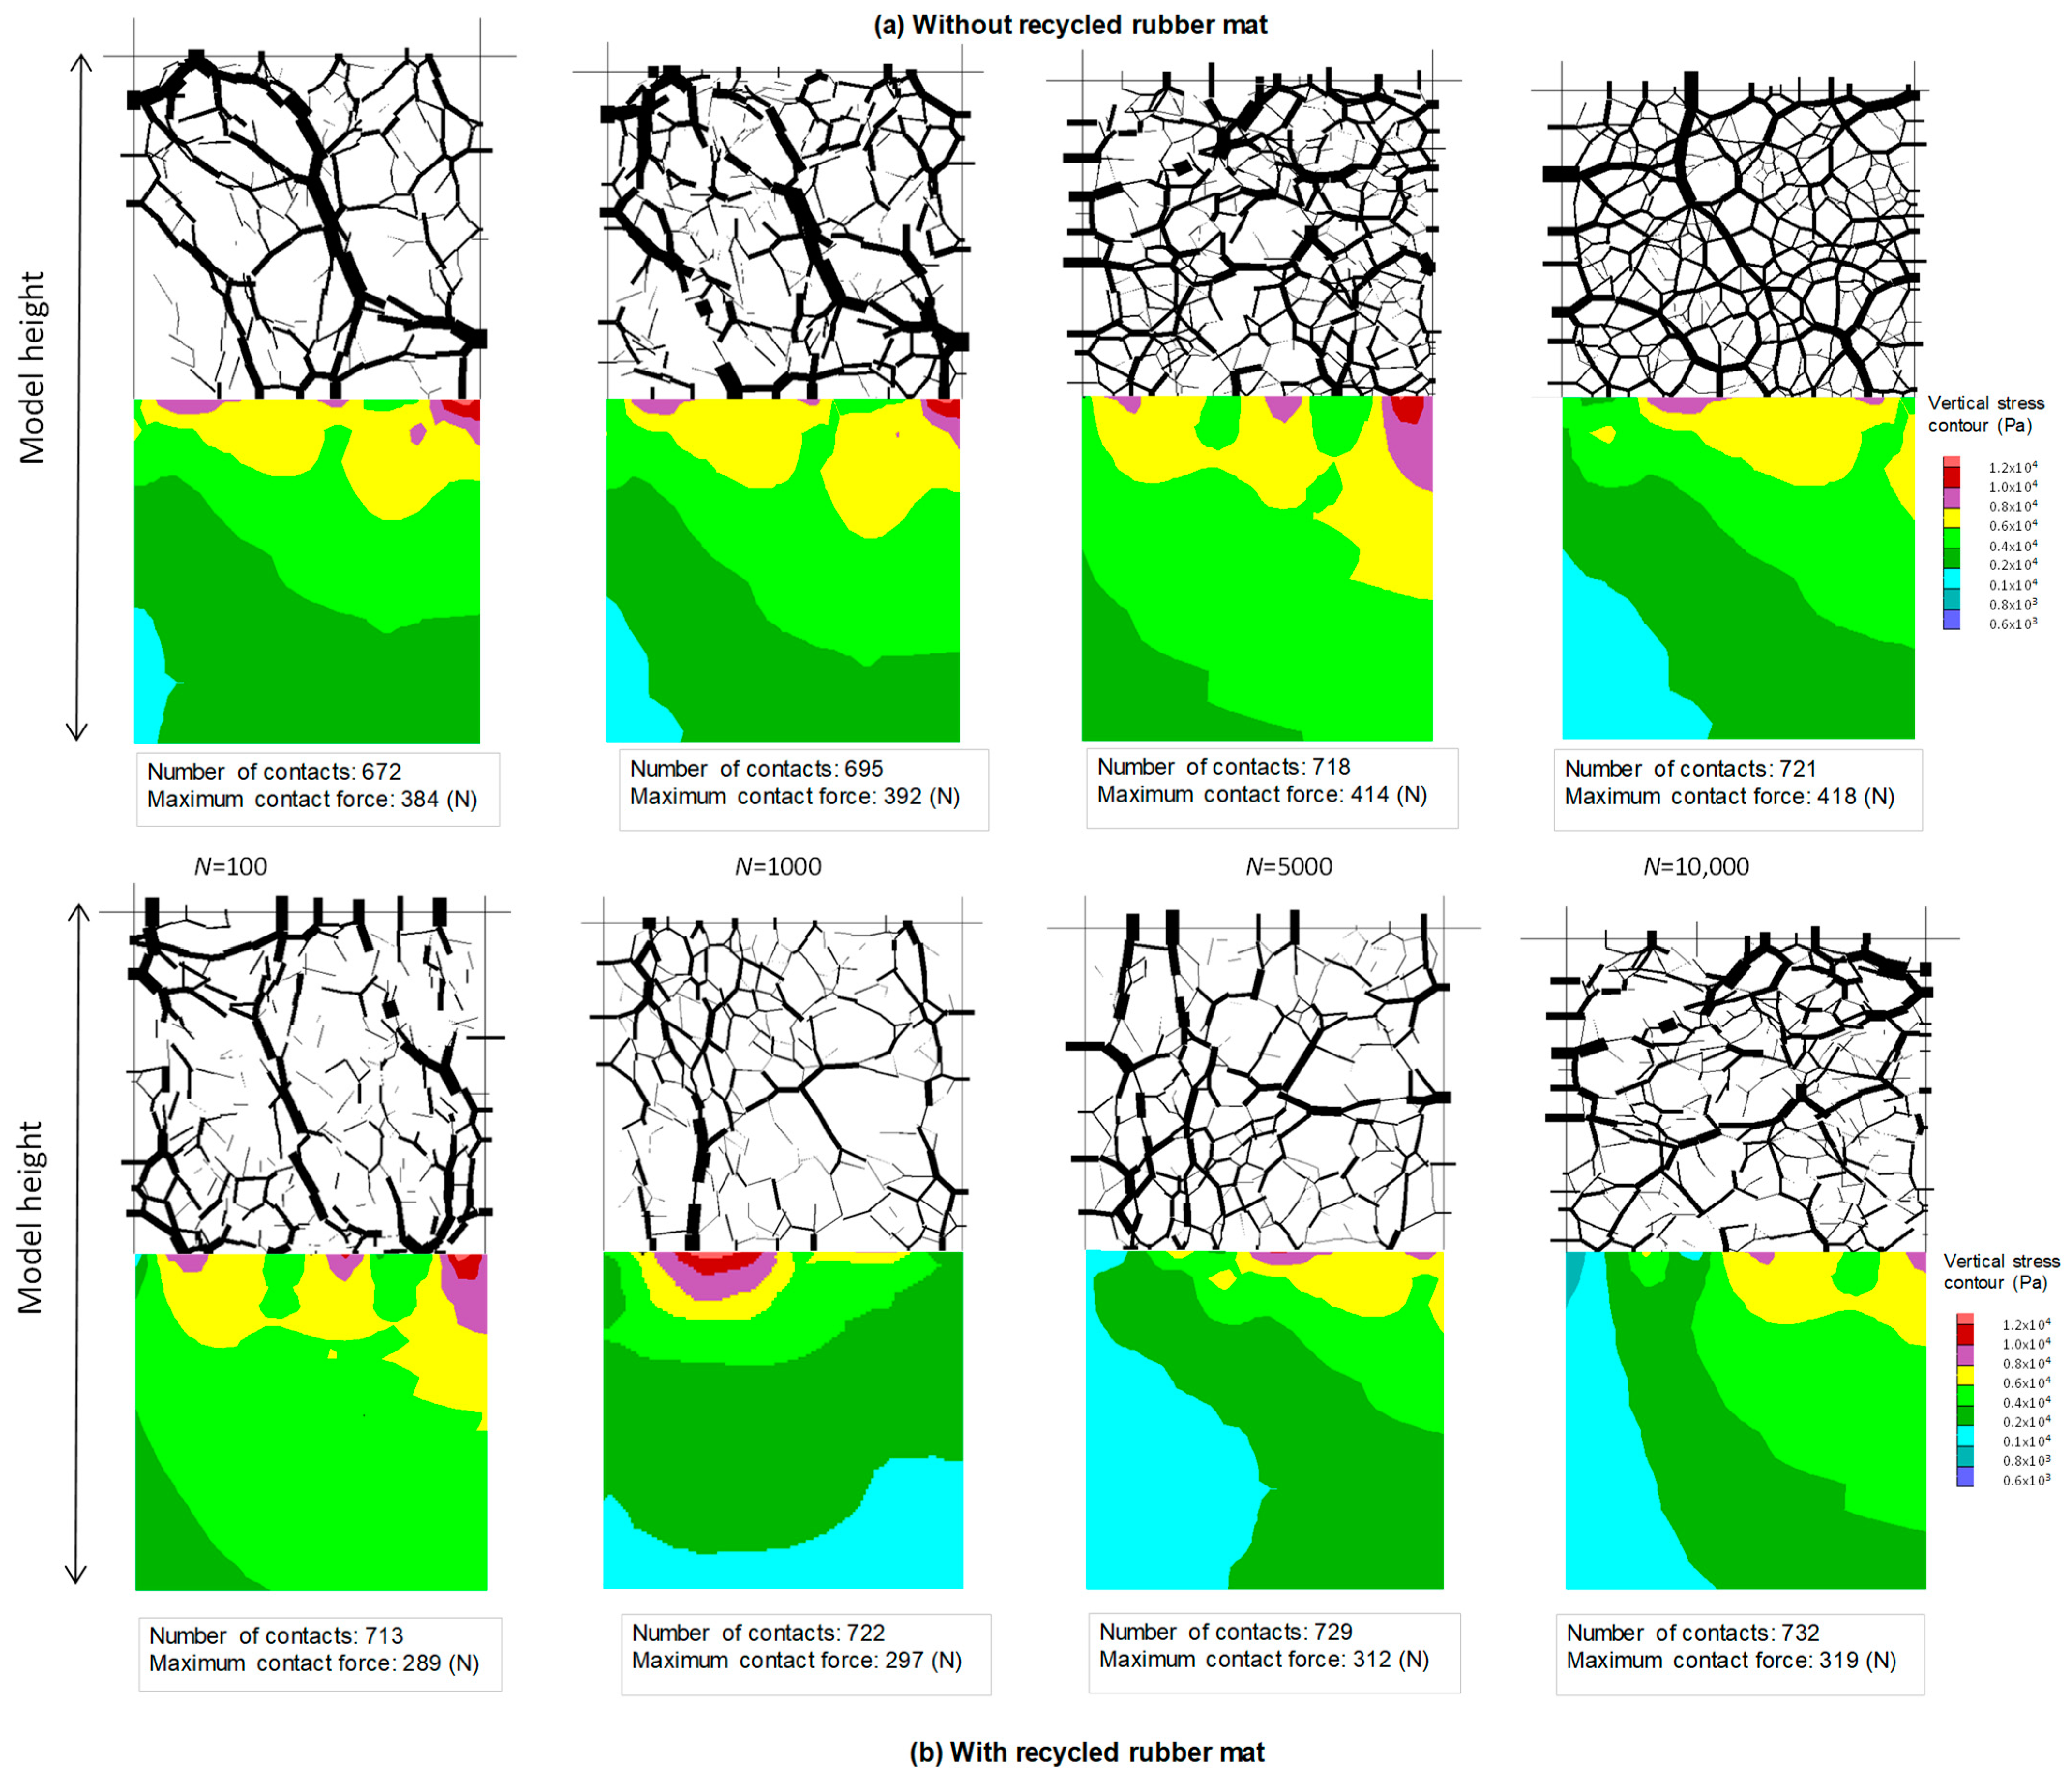
3.2. Coupled Discrete-Continuum Modelling (DEM-FEM) for Ballasted Tracks with Rubber Mats

Numerical modelling via the coupled DEM-FEM approach enables an insightful investigation of the mechanical response of ballast and how rubber mats reduce ballast breakage under cyclic loading, as also observed from laboratory tests using a large-scale cyclic triaxial equipment (Figure 7a) [74]. Ballast particles are modelled by bonding many disks with predetermined sizes together (Figure 7b), and ballast breakage is assumed to occur when those bonds are broken. Figure 7c illustrates a diagram of a combined DEM-FEM model of the whole test specimen, where the discrete grains are modelled in DEM and the layers of subgrade soil, capping, and rubber mat are modelled following the continuum approach. The thickness of the ballast layer was 300mm, and is typically used in Australian railway lines. The rubber mat was modelled as a linear-elastic material and the capping was simulated as an elastoplastic material adopting the Drucker-Prager model. The rubber mat used in this study was locally made by an Australian recycling company that has a thickness of 10mm. The performance of this recycled rubber mat was justified by previous laboratory tests [10]. The dynamic bedding modulus of the rubber mat used in the test was Cdyn = 0.107 (N/mm3). Material properties were determined from the laboratory tests on materials sourced from a local quarry [75]. It is noted that there is only one type of ballast (fresh basalt quarried in Bombo, NSW) following the Australian standard AS 2758.7-2015 [76] and was used in laboratory tests; therefore the effect of changes in ballast type on the performance of rubber mat was not studied. A series of large-scale laboratory tests were carried out under a stress-controlled mode where the maximum cyclic stress applied on the ballast sample was 230 kPa, which is equivalent to 16.25 kN vertical force applied by a dynamic actuator. It is noted that this force may not be exactly the same as the wheel-rail-sleeper-ballast interaction, as it was determined to generate an equivalent vertical stress in the model test. The laboratory test carried out in the laboratory was only considered vertical forces where lateral forces that were caused by a wheel impact on a locally bent rail and longitudinal force (e.g., braking force) have not been considered. The subgrade is simulated by a conventional Mohr Coulomb model whose parameters were predetermined in the laboratory. Note that the concept of coupled discrete-continuum has been established earlier by many studies [30,36,77] and adopted in many engineering problems, including stone columns, cellular geostructures, soil-structure interaction and railway engineering. As the main aim of this section is to review recent research work carried out by the authors in the context of ballasted track stabilisation using rubber mats, only the associated results were considered herein.
The coupled model was implemented by transferring the forces and displacements between the two domains. Figure 7d shows how this exchange of forces (Fn, Fs) and displacements ( X ˙ i [ E ] ) at their interfaces is facilitated. This figure shows that at a certain time Δt, contact forces in the DEM (Zone 1) were transferred to Zone 2 (continuum domain), and the displacements were transferred back to the DEM. This exchange of force and displacement can be performed using a mathematical framework and interface elements to distribute the forces and moments to nodal points (Figure 7e and Appendix A). This DEM-FEM model was adopted to simulate cyclic tests under different load frequencies (f = 10–40 Hz) and throughout N = 10,000 loading cycles.

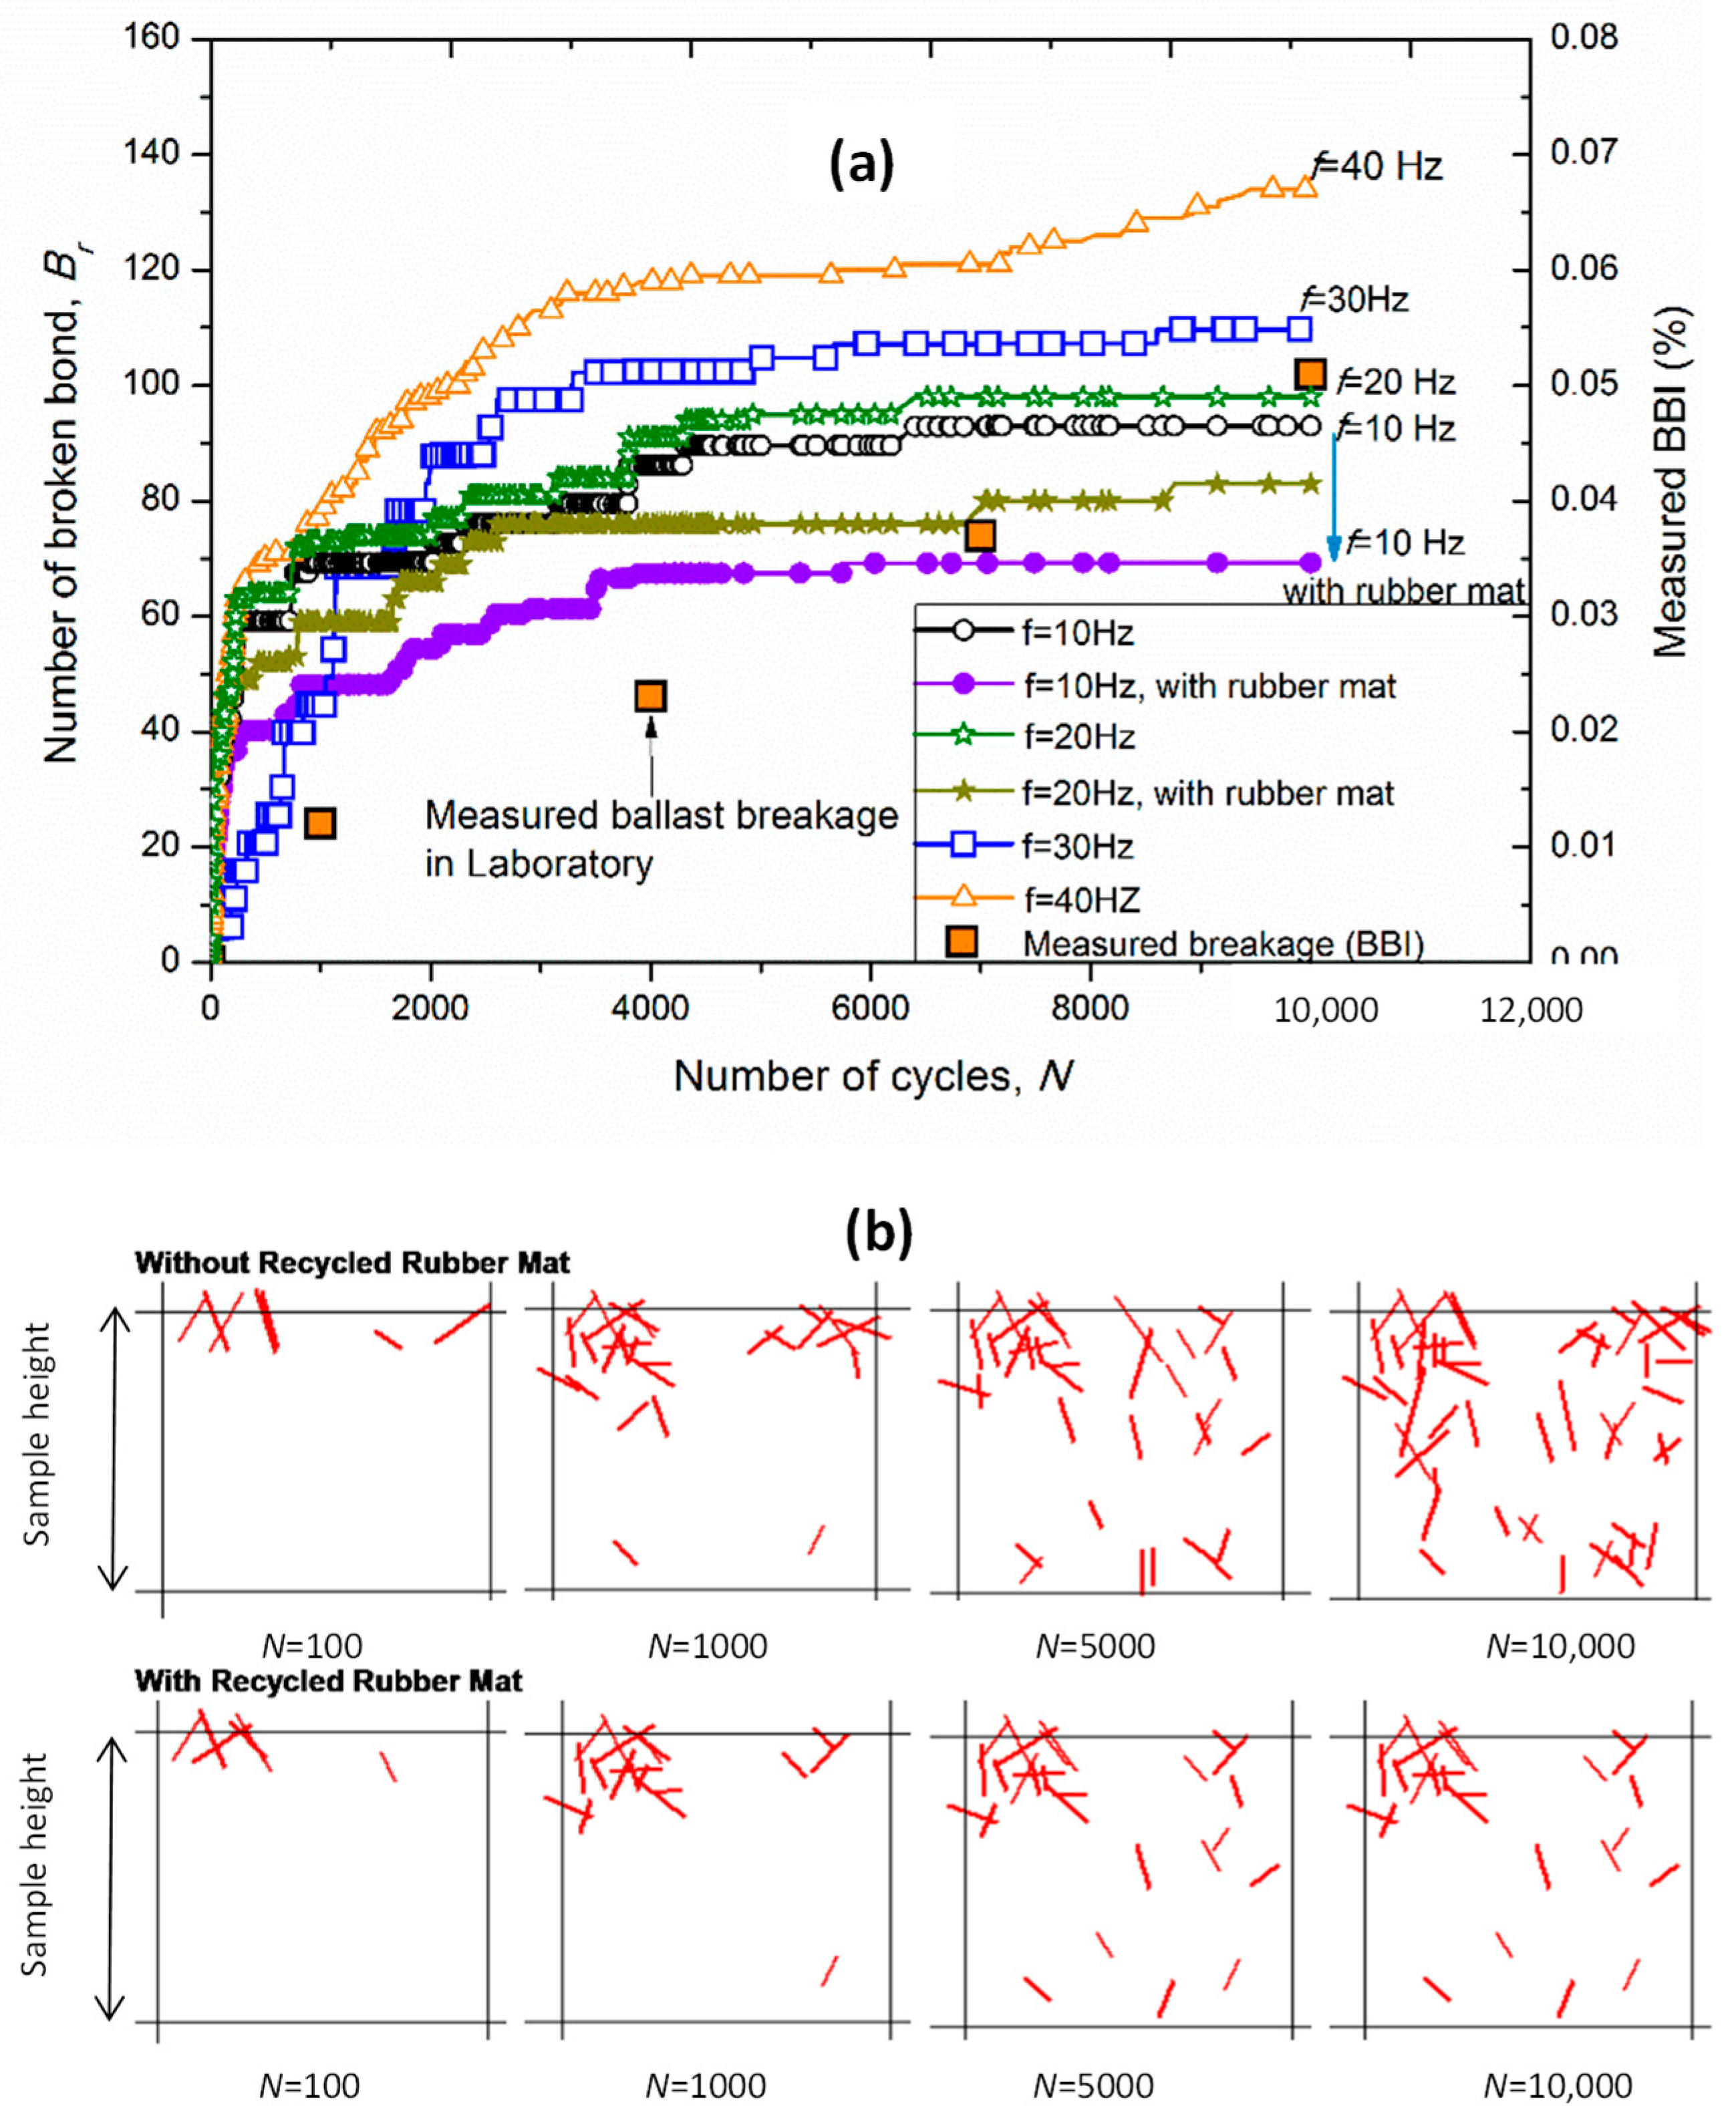
3.3. Particle Breakage

This coupled model can be used to predict the accumulated broken bonds (Br) as the load cycles N increase under varying frequencies (f = 10–40 Hz), as shown in Figure 8a. Here, Br increased as the frequency f increased; this trend agrees with the ballast breakage measured in the laboratory [78]. Br increased remarkably in the initial N = 5000 cycles, and remained nearly constant towards the end of the simulations. Placing a rubber mat under the ballast layer led to a decrease in Br, an observation that reinforces the energy-absorbing capacity of the rubber mat.
Figure 8b presents snapshots of broken bonds obtained at given numbers of load cycles (N) for f = 20 Hz. The number of broken bonds increased with N, however it reduced when a rubber mat is provided. It is seen that many bonds break directly under the top loading plate within the first N = 1000 cycles. Zhang et al. [34] studied the dynamic response of ballast and observed that ballast grains approximately 200 mm beneath the sleepers are more likely to experience higher stress levels and therefore undergo more pronounced breakage.
Figure 9 shows the changes of contact forces in ballast and the contours of predicted stress in the subgrade and capping layers captured at N = 100–10,000 cycles, and for f = 20 Hz. Note here that the imposed loads were transmitted to the ballast particles as chains of contact forces whose thickness is proportional to their magnitude. High contact forces were concentrated below the top-loading wall, and a large portion of the load was transferred vertically to the underlying layer of the subgrade. Increasing the number of load cycles N led to an increasing number of contacts, which may be related to the re-arrangement and breakage of particles. The inclusion of recycled rubber mats increases the contact area between the ballast and capping layer, reduces the maximum stresses, and also helps to attenuate the load. This, in turn, attenuates excessive contact forces and reduces the deformation and breakage of the ballast grains, which in practice would result in extended track longevity with associated technical, financial, and environmental benefits.

4. Conclusions

This paper presented salient outcomes based on recent mathematical and computational modelling of rail track foundation layers (i.e., subballast and ballast) incorporating marginal and recycled products, such as steel furnace slag (SFS), coal wash (CW), recycled rubber crumbs (RC) and rubber mats. A bounding surface constitutive model was established to predict the stress-strain behaviour of a blended waste matrix (SFS+CW+RC) expected to be adopted as an alternative sustainable capping layer. Computational modelling was then implemented using the discrete element method (DEM) and the combined discrete-continuum modelling approach (i.e., coupled DEM-FEM). The effect of recycled rubber mats (energy absorbing layer) placed beneath a layer of ballast was simulated under different cyclic loading frequencies (f = 10–20 Hz). The main conclusions from this study are summarised below:
  • A bounding surface model for SFS+CW+RC mixtures as a form of potential capping layer was introduced and validated based on laboratory data. The energy-absorbing characteristics of the mixture with different rubber contents were captured through an empirical relationship between the critical stress ratio ( M c s ) and the total work input ( W t o t a l ). The proposed model was also validated by considering other rubber-soil mixtures tested during previous studies [26,40]. The predicted stress-strain behaviour of the mixture was comparable with the laboratory observations. The observed properties of this compacted waste product could be considered favourable as an alternative capping medium to be adopted in railways, in lieu of traditional (geologic) materials.
  • The changes of broken bonds (representing ballast breakage) and the re-distribution and re-orientation of contact forces to support the external loads were captured via the coupled DEM-FEM modelling. The predicted results were in satisfactory agreement with the large-scale laboratory data. The inclusion of rubber mats reduced the broken bonds and the magnitude of maximum contact forces, hence reducing ballast deformation and degradation.
  • The constitutive and numerical modelling facilitated the analysis and investigation of track performance incorporating resilient recycled rubber materials (i.e., rubber crumbs and rubber shock mats). The proposed critical state surface capturing the energy-absorbing characteristics of the waste blends including RC is suitable for and can be extended to relevant studies on rubber-soil mixtures. The established DEM-FEM modelling provides a novel approach for further studies to look into the combined micro and macro-mechanical response of ballasted tracks considering ballast degradation. From an environmental sustainability perspective, the use of recycled waste products in track construction and rehabilitation will contribute not only to reduce waste disposal volumes to landfills, but also to more effective use of non-renewable natural resources, thereby reducing the carbon footprint of future rail infrastructure projects.

Author Contributions

Conceptualization, Y.Q., B.I. and T.N.; methodology, Y.Q. and T.N.; validation, Y.Q. and T.N.; formal analysis, Y.Q. and T.N.; investigation, Y.Q. and T.N.; writing—original draft preparation, Y.Q., T.N. and F.B.F.; supervision: B.I.; Funding: B.I.; writing—review and editing, Y.Q., T.N., B.I. and F.B.F. All authors have read and agreed to the published version of the manuscript.

Funding

This research was funded by Australian Research Council Discovery Project (ARC-DP180101916), Linkage Project (LP200200915) and ARC Industry Transformation Training Centre for Advanced Rail Track Technologies (ITTC-Rail IC170100006). Significant financial support from ACRI, SMEC, Bridgestone, RMS and other industry organisations over the years is gratefully appreciated. Internal research funding from UTS Transport Research Centre and UOW Centre for Geomechanics and Railway Engineering was significant. The last author wishes to acknowledge the financial support by: Project PTDC/ECI-EGC/30452/2017—POCI-01-0145-FEDER-030452—funded by FEDER funds through COMPETE2020—Programa Operacional Competitividade e Internacionalização (POCI) and by national funds (PIDDAC) through FCT/MCTES; and Programmatic funding—UIDP/04708/2020 of the CONSTRUCT—Instituto de I&D em Estruturas e Construções—funded by national funds through the FCT/MCTES (PIDDAC).

Data Availability Statement

The data presented in this study are openly available in reference number [38,74].

Acknowledgments

The authors wish to acknowledge the financial assistance provided by the Australian Research Council (ARC) Discovery Project (ARC-DP180101916), ARC Industry Linkage Project (LP200200915) and ARC Industry Transformation Training Centre for Advanced Rail Track Technologies (ARC-ITTC-Rail). The financial and technical assistance provided by various in-dustry partners over the years including Australasian Centre for Rail Innovation (ACRI), RMS and Sydney Trains, c/o Transport for NSW, SMEC, Bestech, Douglas Partners, ASMS, South 32, Ecoflex Australia, Bridgestone, and Tyre Crumbs Australia) is gratefully acknowledged.

Conflicts of Interest

The authors declare no conflict of interest.

Appendix A

Interface elements only receive forces at their end nodes (FXB, FYB and FXA, FYA,). Thus, it is required to transfer moments (M) and forces (FX, FY) from a grain to an element, as illustrated earlier in Figure 7e. By taking the equilibrium of forces, we can derive:
Horizontal   direction : F X = F X A + F X B
Vertical   direction :   F Y = F Y A + F Y B
The equilibrium of moment is derived as:
M = F Y A × ( X A X C ) + F Y B × ( B X C ) F X A × ( Y A Y C ) F X B × ( Y B Y C )
Equations (A1) and (A2) can be extended by:
F X = F X A + F X B = β × F X + ( 1 β ) × F X
and   F Y = F Y A + F Y B = β × F Y + ( 1 β ) × F Y
in which, the parameter β is given by:
F X A = β × F X   and   F Y A = β × F Y
F X B = ( 1 β ) × F X   and   F Y B = ( 1 β ) × F Y
Replacing the Equations (A6) and (A7) to Equation (A3) results in:
M = β × F Y × ( X A X C ) +   ( 1 β ) × F Y × ( X B X C ) β × F X × ( Y A Y C ) ( 1 β ) × F X × ( Y B Y C )
Rearranging Equation (A8) gives:
β = M     F Y   ×   ( X B X C )   +   F X   ×   ( Y B Y C ) F Y   ×   ( X A X B )     F X   ×   ( Y A Y B )
Equation (A9) can be used together with Equations (A6) and (A7) to exchange moment and forces between the DEM and FDM via user-defined subroutines developed in FISH language (ITASCA).

References

  1. Indraratna, B.; Lackenby, J.; Christie, D. Effect of confining pressure on the degradation of ballast under cyclic loading. Geotechnique 2005, 55, 325–328. [Google Scholar] [CrossRef]
  2. Zhai, W.; Wei, K.; Song, X.; Shao, M. Experimental investigation into ground vibrations induced by very high speed trains on a non-ballasted track. Soil Dyn. Earthq. Eng. 2015, 72, 24–36. [Google Scholar] [CrossRef] [Green Version]
  3. Indraratna, B.; Nimbalkar, S.S.; Ngo, T.; Neville, T. Performance improvement of rail track substructure using artificial inclusions—Experimental and numerical studies. Transp. Geotech. 2016, 8, 69–85. [Google Scholar] [CrossRef] [Green Version]
  4. Tennakoon, N.; Indraratna, B.; Rujikiatkamjorn, C.; Nimbalkar, S.; Neville, T. The Role of Ballast-Fouling Characteristics on the Drainage Capacity of Rail Substructure. Geotech. Test. J. 2012, 35, 629–640. [Google Scholar] [CrossRef] [Green Version]
  5. Huang, H.; Tutumluer, E. Discrete Element Modeling for fouled railroad ballast. Constr. Build. Mater. 2011, 25, 3306–3312. [Google Scholar] [CrossRef]
  6. Leng, J.; Gabr, M. Characteristics of Geogrid-Reinforced Aggregate Under Cyclic Load. Transp. Res. Rec. J. Transp. Res. Board 2002, 1786, 29–35. [Google Scholar] [CrossRef]
  7. Biabani, M.M.; Ngo, N.T.; Indraratna, B. Performance evaluation of railway subballast stabilised with geocell based on pull-out testing. Geotext. Geomembr. 2016, 44, 579–591. [Google Scholar] [CrossRef] [Green Version]
  8. Indraratna, B.; Qi, Y.; Tawk, M.; Heitor, A.; Rujikiatkamjorn, C.; Navaratnarajah, S.K. Advances in ground improvement using waste materials for transportation infrastructure. Proc. Inst. Civ. Eng. Ground Improv. 2020, 1–20. [Google Scholar] [CrossRef]
  9. Liu, C.; Indraratna, B.; Rujikiatkamjorn, C. An analytical model for particle-geogrid aperture interaction. Geotext. Geomembr. 2020, 49, 41–44. [Google Scholar] [CrossRef]
  10. Jayasuriya, C.; Indraratna, B.; Ngo, T. Experimental study to examine the role of under sleeper pads for improved performance of ballast under cyclic loading. Transp. Geotech. 2019, 19, 61–73. [Google Scholar] [CrossRef]
  11. Tawk, M.; Qi, Y.; Indraratna, B.; Rujikiatkamjorn, C.; Heitor, A. Behavior of a Mixture of Coal Wash and Rubber Crumbs under Cyclic Loading. J. Mater. Civ. Eng. 2021, 33, 04021054. [Google Scholar] [CrossRef]
  12. Koohmishi, M.; Azarhoosh, A. Hydraulic conductivity of fresh railway ballast mixed with crumb rubber considering size and percentage of crumb rubber as well as aggregate gradation. Constr. Build. Mater. 2020, 241, 118133. [Google Scholar] [CrossRef]
  13. Indraratna, B.; Ngo, N.T.; Nimbalkar, S.; Rujikiatkamjorn, C. Two Decades of Advancement in Process Simulation Testing of Ballast Strength, Deformation, and Degradation. In Railroad Ballast Testing and Properties; ASTM International: West Conshohocken, PA, USA, 2018; pp. 11–38. [Google Scholar] [CrossRef]
  14. Navaratnarajah, S.K.; Indraratna, B.; Ngo, N.T. Influence of Under Sleeper Pads on Ballast Behavior under Cyclic Loading: Experimental and Numerical Studies. J. Geotech. Geoenviron. Eng. 2018, 144, 04018068. [Google Scholar] [CrossRef]
  15. Leventhal, A.; de Ambrosis, L. Waste disposal in coal mining—A geotechnical analysis. Eng. Geol. 1985, 22, 83–96. [Google Scholar] [CrossRef]
  16. Qi, Y.; Indraratna, B.; Heitor, A.; Vinod, J.S. Closure to “Effect of Rubber Crumbs on the Cyclic Behavior of Steel Furnace Slag and Coal Wash Mixtures” by Yujie Qi, Buddhima Indraratna, Ana Heitor, and Jayan S. Vinod. J. Geotech. Geoenviron. Eng. 2019, 145, 07018035. [Google Scholar] [CrossRef] [Green Version]
  17. Xue, Y.; Wu, S.; Hou, H.; Zha, J. Experimental investigation of basic oxygen furnace slag used as aggregate in asphalt mixture. J. Hazard. Mater. 2006, 138, 261–268. [Google Scholar] [CrossRef] [PubMed]
  18. Malasavage, N.E.; Jagupilla, S.; Grubb, D.G.; Wazne, M.; Coon, W.P. Geotechnical Performance of Dredged Material—Steel Slag Fines Blends: Laboratory and Field Evaluation. J. Geotech. Geoenviron. Eng. 2012, 138, 981–991. [Google Scholar] [CrossRef]
  19. Khan, M.; Castel, A.; Akbarnezhad, A.; Foster, S.; Smith, M. Utilisation of steel furnace slag coarse aggregate in a low calcium fly ash geopolymer concrete. Cem. Concr. Res. 2016, 89, 220–229. [Google Scholar] [CrossRef]
  20. Yildirim, I.Z.; Prezzi, M. Geotechnical Properties of Fresh and Aged Basic Oxygen Furnace Steel Slag. J. Mater. Civ. Eng. 2015, 27, 04015046. [Google Scholar] [CrossRef]
  21. Chiaro, G.; Indraratna, B.; Tasalloti, S.A.; Rujikiatkamjorn, C. Optimisation of coal wash–slag blend as a structural fill. Proc. Inst. Civ. Eng. Ground Improv. 2015, 168, 33–44. [Google Scholar] [CrossRef] [Green Version]
  22. Qi, Y.; Indraratna, B.; Heitor, A.; Vinod, J.S. The Influence of Rubber Crumbs on the Energy Absorbing Property of Waste Mixtures. In Geotechnics for Transportation Infrastructure; Springer: Singapore, 2019; pp. 271–281. [Google Scholar] [CrossRef] [Green Version]
  23. Qi, Y.; Indraratna, B. Energy-Based Approach to Assess the Performance of a Granular Matrix Consisting of Recycled Rubber, Steel-Furnace Slag, and Coal Wash. J. Mater. Civ. Eng. 2020, 32, 04020169. [Google Scholar] [CrossRef]
  24. Kim, H.-K.; Santamarina, J.C. Sand–rubber mixtures (large rubber chips). Can. Geotech. J. 2008, 45, 1457–1466. [Google Scholar] [CrossRef] [Green Version]
  25. Mohajerani, A.; Burnett, L.; Smith, J.V.; Markovski, S.; Rodwell, G.; Rahman, T.; Kurmus, H.; Mirzababaei, M.; Arulrajah, A.; Horpibulsuk, S.; et al. Recycling waste rubber tyres in construction materials and associated environmental considerations: A review. Resour. Conserv. Recycl. 2020, 155, 104679. [Google Scholar] [CrossRef]
  26. Youwai, S.; Bergado, D.T. Strength and deformation characteristics of shredded rubber tire—Sand mixtures. Can. Geotech. J. 2003, 40, 254–264. [Google Scholar] [CrossRef]
  27. Indraratna, B.; Qi, Y.; Heitor, A. Evaluating the Properties of Mixtures of Steel Furnace Slag, Coal Wash, and Rubber Crumbs Used as Subballast. J. Mater. Civ. Eng. 2018, 30, 04017251. [Google Scholar] [CrossRef] [Green Version]
  28. Qi, Y.; Indraratna, B. The Influence of Rubber Inclusion on the Dynamic Response of Rail Track. J. Mater. Civ. Eng. 2021, in press. [Google Scholar] [CrossRef]
  29. Guo, Y.; Zhao, C.; Markine, V.; Jing, G.; Zhai, W. Calibration for discrete element modelling of railway ballast: A review. Transp. Geotech. 2020, 23, 100341. [Google Scholar] [CrossRef]
  30. Shi, C.; Zhao, C.; Zhang, X.; Guo, Y. Coupled discrete-continuum approach for railway ballast track and subgrade macro-meso analysis. Int. J. Pavement Eng. 2020, 1–16. [Google Scholar] [CrossRef]
  31. Huang, Z.-Y.; Yang, Z.-X.; Wang, Z.-Y. Discrete element modeling of sand behavior in a biaxial shear test. J. Zhejiang Univ. A 2008, 9, 1176–1183. [Google Scholar] [CrossRef]
  32. O’Sullivan, C.; Cui, L. Micromechanics of granular material response during load reversals: Combined DEM and experimental study. Powder Technol. 2009, 193, 289–302. [Google Scholar] [CrossRef] [Green Version]
  33. Wu, Q.; Spiryagin, M.; Cole, C.; McSweeney, T. Parallel computing in railway research. Int. J. Rail Transp. 2020, 8, 111–134. [Google Scholar] [CrossRef] [Green Version]
  34. Zhang, X.; Zhao, C.; Zhai, W. Importance of load frequency in applying cyclic loads to investigate ballast deformation under high-speed train loads. Soil Dyn. Earthq. Eng. 2019, 120, 28–38. [Google Scholar] [CrossRef]
  35. Ngo, T.; Indraratna, B. Analysis of Deformation and Degradation of Fouled Ballast: Experimental Testing and DEM Modeling. Int. J. Géoméch. 2020, 20, 06020020. [Google Scholar] [CrossRef]
  36. Nishiura, D.; Sakai, H.; Aikawa, A.; Tsuzuki, S.; Sakaguchi, H. Novel discrete element modeling coupled with finite element method for investigating ballasted railway track dynamics. Comput. Geotech. 2018, 96, 40–54. [Google Scholar] [CrossRef]
  37. Lim, N.-H.; Kim, K.-J.; Bae, H.-U.; Kim, S. DEM Analysis of Track Ballast for Track Ballast–Wheel Interaction Simulation. Appl. Sci. 2020, 10, 2717. [Google Scholar] [CrossRef] [Green Version]
  38. Qi, Y.; Indraratna, B.; Coop, M.R. Predicted Behavior of Saturated Granular Waste Blended with Rubber Crumbs. Int. J. Géoméch. 2019, 19, 04019079. [Google Scholar] [CrossRef] [Green Version]
  39. Qi, Y.; Indraratna, B.; Vinod, J.S. Behavior of steel furnace slag, coal wash, and rubber crumb mixtures with special relevance to stress–dilatancy relation. J. Mater. Civ. Eng. 2018, 30, 04018276. [Google Scholar] [CrossRef] [Green Version]
  40. Tasalloti, A.; Indraratna, B.; Rujikiatkamjorn, C.; Heitor, A.; Chiaro, G. A Laboratory Study on the Shear Behavior of Mixtures of Coal Wash and Steel Furnace Slag as Potential Structural Fill. Geotech. Test. J. 2015, 38, 361–372. [Google Scholar] [CrossRef] [Green Version]
  41. Dafalias, Y.F. Bounding Surface Plasticity. I: Mathematical Foundation and Hypoplasticity. J. Eng. Mech. 1986, 112, 966–987. [Google Scholar] [CrossRef]
  42. Carrera, A.; Coop, M.; Lancellotta, R. Influence of grading on the mechanical behaviour of Stava tailings. Géotechnique 2011, 61, 935–946. [Google Scholar] [CrossRef]
  43. Chávez, C.; Alonso, E. A Constitutive Model for Crushed Granular Aggregates Which Includes Suction Effects. Soils Found. 2003, 43, 215–227. [Google Scholar] [CrossRef] [Green Version]
  44. Zornberg, J.G.; Cabral, A.R.; Viratjandr, C. Behaviour of tire shred—Sand mixtures. Can. Geotech. J. 2004, 41, 227–241. [Google Scholar] [CrossRef]
  45. Russell, A.R.; Khalili, N. A bounding surface plasticity model for sands exhibiting particle crushing. Can. Geotech. J. 2004, 41, 1179–1192. [Google Scholar] [CrossRef]
  46. Fang, H.; Wang, W. A Three-Dimensional Multishear Bounding Surface Model of Granular Soil–Structure Interfaces under Monotonic and Cyclic Loading. J. Eng. Mech. 2020, 146, 04020068. [Google Scholar] [CrossRef]
  47. Wang, Z.-L. Bounding Surface Hypoplasticity Model for Granular Soils and Its Applications; University of California: Davis, CA, USA, 1990. [Google Scholar]
  48. Xiao, Y.; Sun, Z.; Stuedlein, A.; Wang, C.; Wu, Z.; Zhang, Z. Bounding surface plasticity model for stress-strain and grain-crushing behaviors of rockfill materials. Geosci. Front. 2020, 11, 495–510. [Google Scholar] [CrossRef]
  49. Kadivar, M.; Manahiloh, K.N.; Kaliakin, V.N. A Bounding Surface Based Constitutive Model for Unsaturated Granular Soils. Geo-Congress 2019: Geotechnical Materials, Modeling, and Testing; American Society of Civil Engineers: Reston, VA, USA, 2019. [Google Scholar]
  50. Kaliakin, V.N.; Dafalias, Y.F. Theoretical Aspects of the Elastoplastic-Viscoplastic Bounding Surface Model for Cohesive Soils. Soils Found. 1990, 30, 11–24. [Google Scholar] [CrossRef] [Green Version]
  51. Kan, M.E.; Taiebat, H.A.; Khalili, N. Simplified Mapping Rule for Bounding Surface Simulation of Complex Loading Paths in Granular Materials. Int. J. Géoméch. 2014, 14, 239–253. [Google Scholar] [CrossRef] [Green Version]
  52. Kan, M.E.; Taiebat, H.A. A bounding surface plasticity model for highly crushable granular materials. Soils Found. 2014, 54, 1188–1201. [Google Scholar] [CrossRef] [Green Version]
  53. Been, K.; Jefferies, M.G. A state parameter for sands. Géotechnique 1985, 35, 99–112. [Google Scholar] [CrossRef]
  54. Wroth, C.P.; Bassett, R.H. A Stress–Strain Relationship for the Shearing Behaviour of a Sand. Géotechnique 1965, 15, 32–56. [Google Scholar] [CrossRef]
  55. Li, X.S.; Dafalias, Y.F. Dilatancy for cohesionless soils. Géotechnique 2000, 50, 449–460. [Google Scholar] [CrossRef]
  56. Khalili, N.; Habte, M.; Zargarbashi, S. A fully coupled flow deformation model for cyclic analysis of unsaturated soils including hydraulic and mechanical hystereses. Comput. Geotech. 2008, 35, 872–889. [Google Scholar] [CrossRef]
  57. Sun, Y.; Xiao, Y.; Ju, W. Bounding surface model for ballast with additional attention on the evolution of particle size distribution. Sci. China Ser. E Technol. Sci. 2014, 57, 1352–1360. [Google Scholar] [CrossRef]
  58. Khalili, N.; Habte, M.A.; Valliappan, S. A bounding surface plasticity model for cyclic loading of granular soils. Int. J. Numer. Methods Eng. 2005, 63, 1939–1960. [Google Scholar] [CrossRef]
  59. Chen, J.Y.; Ummin, O.; Yu, T.; Qi, Y.J. Applications of Rayleigh Wave Detection Technique and Polymer Grouting Technology in Waterproof Construction. In Applied Mechanics and Materials; Trans Tech Publications Ltd.: Stafa-Zurich, Switzerland, 2013. [Google Scholar]
  60. Cundall, P.A.; Strack, O.D.L. A discrete numerical model for granular assemblies. Geotechnique 1979, 29, 47–65. [Google Scholar] [CrossRef]
  61. Tutumluer, E.; Qian, Y.; Hashash, Y.M.; Ghaboussi, J.; Davis, D.D. Discrete element modelling of ballasted track deformation behaviour. Int. J. Rail Transp. 2013, 1, 57–73. [Google Scholar] [CrossRef]
  62. Tran, K.M.; Bui, H.H.; Sánchez, M.; Kodikara, J. A DEM approach to study desiccation processes in slurry soils. Comput. Geotech. 2020, 120, 103448. [Google Scholar] [CrossRef]
  63. Tran, V.D.H.; Meguid, M.; Chouinard, L.E. Discrete Element and Experimental Investigations of the Earth Pressure Distribution on Cylindrical Shafts. Int. J. Géoméch. 2014, 14, 80–91. [Google Scholar] [CrossRef]
  64. McDowell, G.R.; Bolton, M.D. On the micromechanics of crushable aggregates. Geotechnique 1998, 48, 667–679. [Google Scholar] [CrossRef] [Green Version]
  65. Lu, M.; McDowell, G.R. Discrete element modelling of ballast abrasion. Geotechnique 2006, 56, 651–655. [Google Scholar] [CrossRef]
  66. Ngo, T.; Indraratna, B.; Rujikiatkamjorn, C. DEM simulation of the behaviour of geogrid stabilised ballast fouled with coal. Comput. Geotech. 2014, 55, 224–231. [Google Scholar] [CrossRef] [Green Version]
  67. Yimsiri, S.; Soga, K. Micromechanics-based stress–strain behaviour of soils at small strains. Geotechnique 2000, 50, 559–571. [Google Scholar] [CrossRef]
  68. Ngo, N.T.; Indraratna, B.; Rujikiatkamjorn, C. Micromechanics-based investigation of fouled ballast using large-scale triaxial tests and discrete element modeling. J. Geotech. Geoenviron. Eng. 2017, 143, 04016089. [Google Scholar] [CrossRef] [Green Version]
  69. Suhr, B.; Marschnig, S.; Six, K. Comparison of two different types of railway ballast in compression and direct shear tests: Experimental results and DEM model validation. Granul. Matter 2018, 20, 70. [Google Scholar] [CrossRef] [Green Version]
  70. Cui, L.; O’sullivan, C. Exploring the macro-and micro-scale response of an idealised granular material in the direct shear apparatus. Géotechnique 2006, 56, 455–468. [Google Scholar] [CrossRef]
  71. Li, H.; McDowell, G. Discrete element modelling of two-layered ballast in a box test. Granul. Matter 2020, 22, 76. [Google Scholar] [CrossRef]
  72. Cheng, Y.; Bolton, M.; Nakata, Y. Grain crushing and critical states observed in DEM simulations. P&G05 2005, 2, 1393–1397. [Google Scholar]
  73. Bhandari, A.; Han, J. Investigation of geotextile–soil interaction under a cyclic vertical load using the discrete element method. Geotext. Geomembr. 2010, 28, 33–43. [Google Scholar] [CrossRef]
  74. Indraratna, B.; Ngo, T.; Rujikiatkamjorn, C. Performance of Ballast Influenced by Deformation and Degradation: Laboratory Testing and Numerical Modeling. Int. J. Géoméch. 2020, 20, 04019138. [Google Scholar] [CrossRef] [Green Version]
  75. Indraratna, B.; Salim, W.; Rujikiatkamjorn, C. Advanced Rail Geotechnology-Ballasted Track; CRC Press: Boca Raton, FL, USA, 2011. [Google Scholar]
  76. AS:2758.7. Standard Australia, Aggregates and Rock for Engineering Purposes in Part 7. Railway Ballast. Australia. 2015. Available online: https://www.techstreet.com/standards/as-2758-7-2015?product_id=2058243 (accessed on 30 June 2015).
  77. Guo, N.; Zhao, J. A coupled FEM/DEM approach for hierarchical multiscale modelling of granular media. Int. J. Numer. Methods Eng. 2014, 99, 789–818. [Google Scholar] [CrossRef] [Green Version]
  78. Sun, Q.; Indraratna, B.; Ngo, N.T. Effect of increase in load and frequency on the resilience of railway ballast. Géotechnique 2019, 69, 833–840. [Google Scholar] [CrossRef] [Green Version]
Figure 1. The relationship of Γ and λ related to R b ( % ) for (a) SFS+CW+RC blends and (b) sand-RC blends; (c) Critical state surface of SFS+CW+RC matrix in e ln p R b space (adapted with permission from ref. [38]. Copyright 2021 American Society of Civil Engineers Journal).
Sustainability 13 09048 g001
Figure 2. The relationship of W t o t a l and M c s * .
Sustainability 13 09048 g002
Figure 3. Schematic illustration of the bounding surface and loading surface in p q plane (Reprinted with permission from ref. [38]. Copyright 2021 American Society of Civil Engineers Journal).
Sustainability 13 09048 g003
Figure 4. (a) Laboratory data vs. model predictions for SFS+CW+RC blends at σ 3 = 70   kPa (Reprinted with permission from ref. [38]. Copyright 2021 American Society of Civil Engineers Journal); (b) Laboratory data vs. model predictions for SFS+CW+RC blends with R b = 40%.
Sustainability 13 09048 g004
Figure 5. Laboratory data vs. model predictions for (a) a SFS-CW mixture, and (b) a sand-RC blend having 30% of RC under different effective confining pressures.
Sustainability 13 09048 g005
Figure 6. Typical ballast particles simulated in DEM: (a) photo of a ballast from scanning; (b) Ballast grains simulated in DEM.
Sustainability 13 09048 g006
Figure 7. (a) Large-scale cyclic triaxial apparatus; (b) Typical ballast modelled in DEM; (c) Dimensions of the DEM-FDM model (unit in mm); (d) Connection of a discrete grain with a continuum element; (e) Illustration of force and moment exchanges (adapted with permission from ref. [74]. Copyright 2021 American Society of Civil Engineers Journal).
Sustainability 13 09048 g007
Figure 8. (a) Contact bond broken with increased loading cycles; (b) Snapshots of broken bonds simulated in the coupled model (adapted with permission from ref. [74]. Copyright 2021 American Society of Civil Engineers Journal).
Sustainability 13 09048 g008
Figure 9. Evolutions of the predicted force distributions in ballast and contours of vertical stresses: (a) Without rubber mat; (b) With rubber mat (adapted with permission from ref. [74]. Copyright 2021 American Society of Civil Engineers Journal).
Sustainability 13 09048 g009
Table 1. Parameters related to critical state for the waste mixtures and sand-RC mixtures (modified after [39]).
Data SourceMixturesEffecive Confining Pressure
σ 3   ( kPa )
Critical State Ratio
M c s
Critical State Void Ratio e c s T o t a l   W o r k   I n p u t W t o t a l   ( kPa ) Critical State Parameters
Qi et al. [38]SFS:CW = 7:3, R b = 0 % 701.7390.28110.79 Γ 1 = 0.064
Γ 2 = 0.01
M 0 = 2.258
α = 0.117
λ 1 = 0.069
λ 2 = 0.003
SFS:CW = 7:3, R b = 10 % 701.5480.23531.18
SFS:CW = 7:3, R b = 20 % 701.510.19833.82
SFS:CW = 7:3, R b = 30 % 701.480.16238.58
SFS:CW = 7:3, R b = 40 % 101.80.3905.81
401.50.21623.28
701.430.14842.74
Tasalloti et al. [40]SFS:CW = 75:25, R b = 0 % 301.650.60110.0
601.520.58018.0
1201.50.54631.8
Youwai and Bergado [26]Sand:RC = 7:3501.360.39410.509 Γ 1 = 0.418
Γ 2 = 6.09 × 10 3
λ 1 = 1.64 × 10 3
λ 2 = 1.04 × 10 3
M 0 = 1.472
α = 0.035
1001.30.37437.408
2001.290.35356.59
Table 2. Model parameters for the materials studied in this paper.
Data SourceMixtures h 0 κ υ
Qi et al. [38]SFS:RC = 7:3, R b = 0%4.00.00200.29
SFS:RC = 7:3, R b = 10%2.50.00350.3
SFS:RC = 7:3, R b = 20%0.770.00480.31
SFS:RC = 7:3, R b = 30%0.880.00590.35
SFS:RC = 7:3, R b = 40%0.680.00630.35
Tasalloti et al. [59]SFS:RC = 75:25, R b = 0%4.580.00180.25
Youwai & Bergado [26]Sand:RC = 7:30.60.00530.33
Publisher’s Note: MDPI stays neutral with regard to jurisdictional claims in published maps and institutional affiliations.

