
Measuring the Urban Forms of Shanghai’s City Center and Its New Districts: A Neighborhood-Level Comparative Analysis


_Chen.png)
Abstract
:1. Introduction
2. Materials and Methods
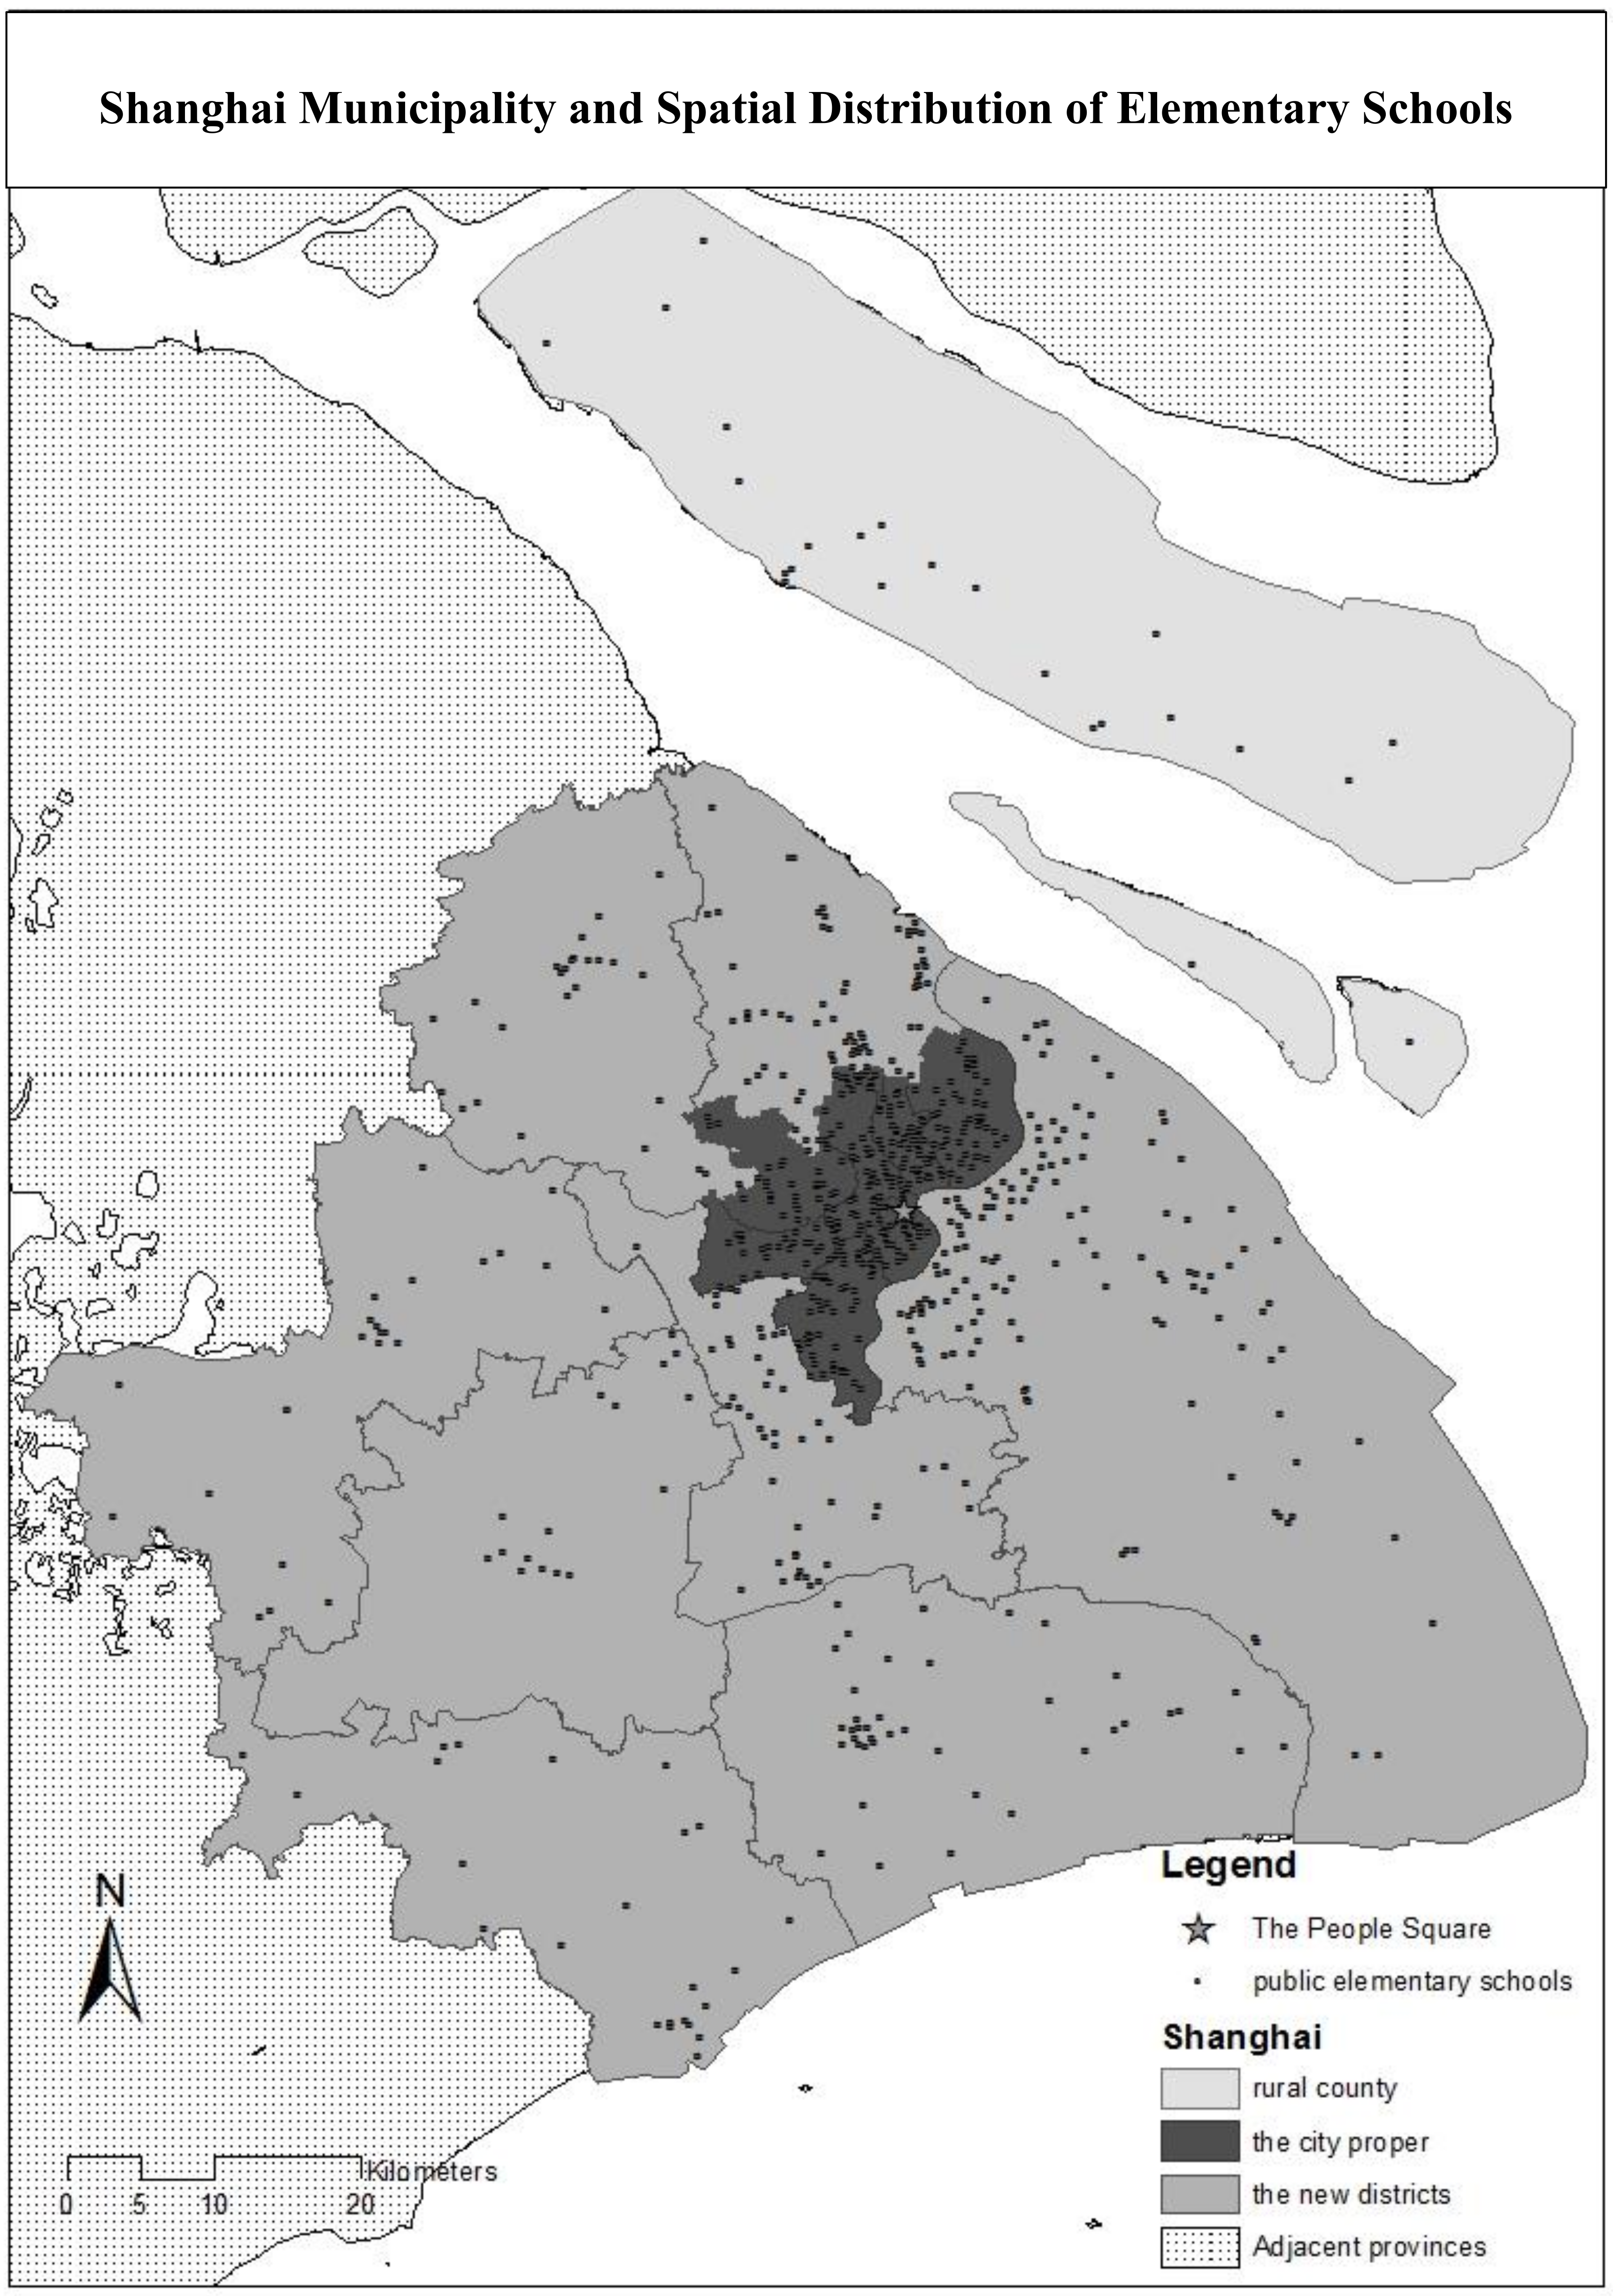
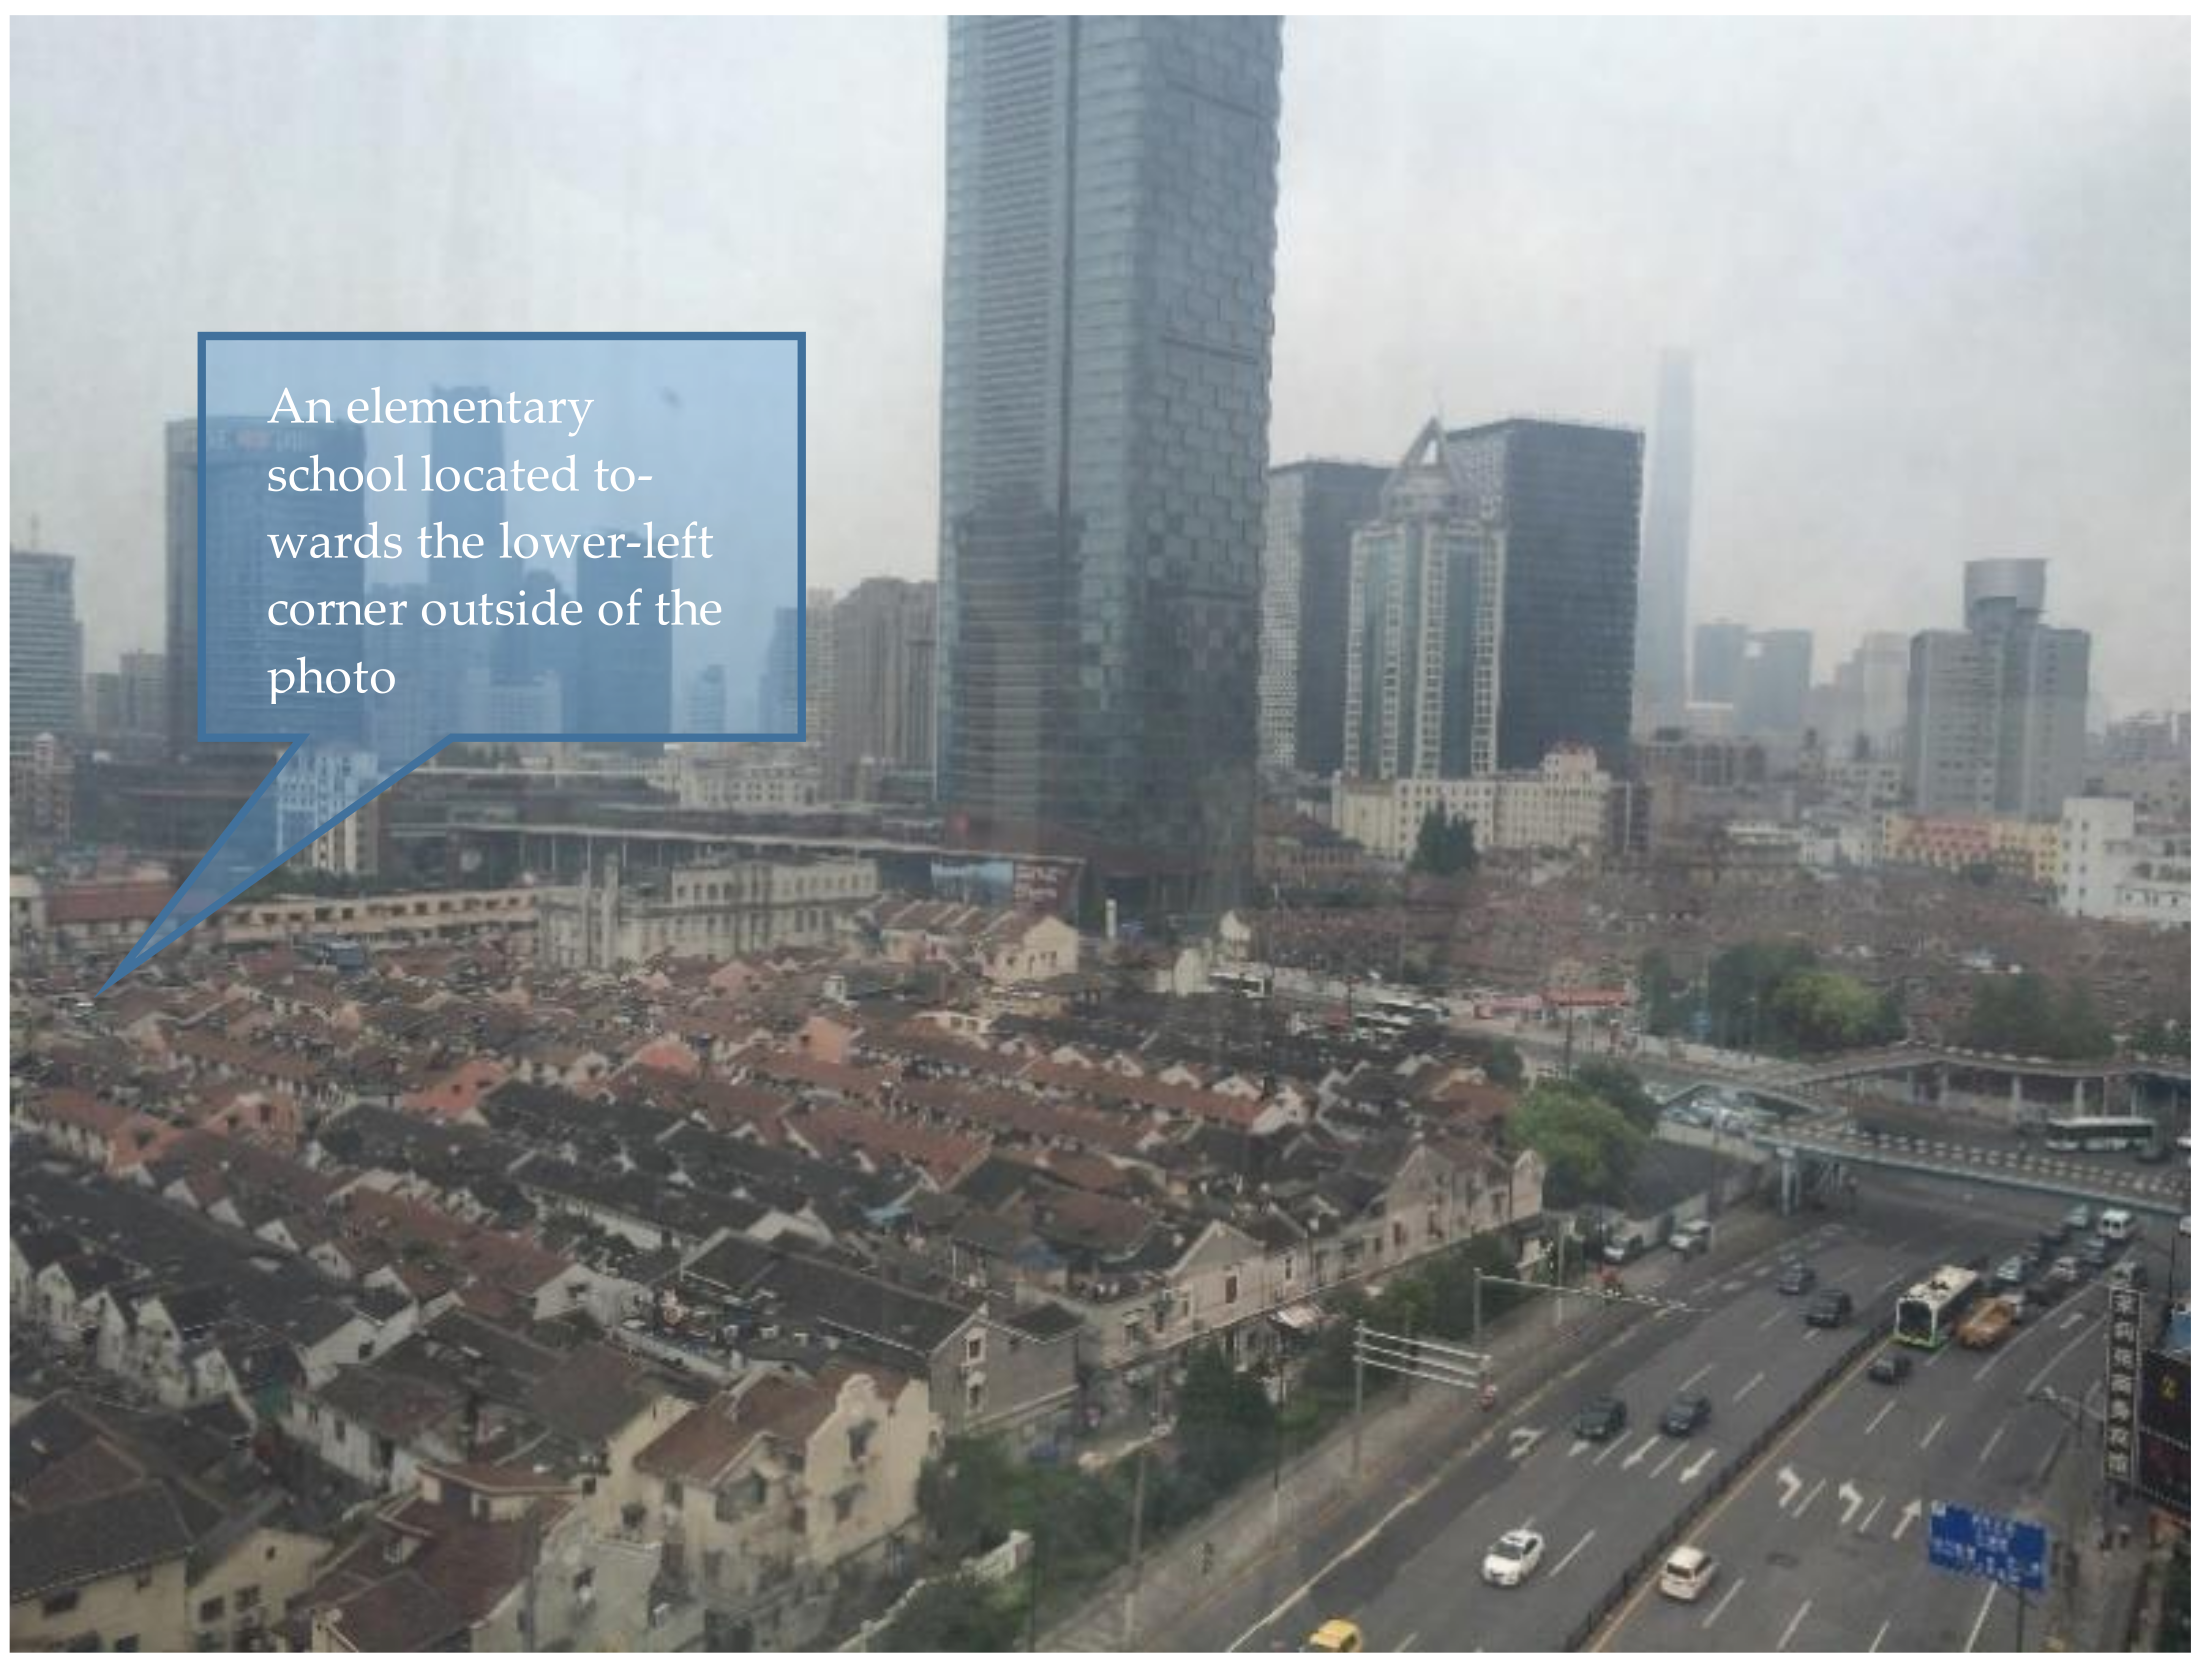
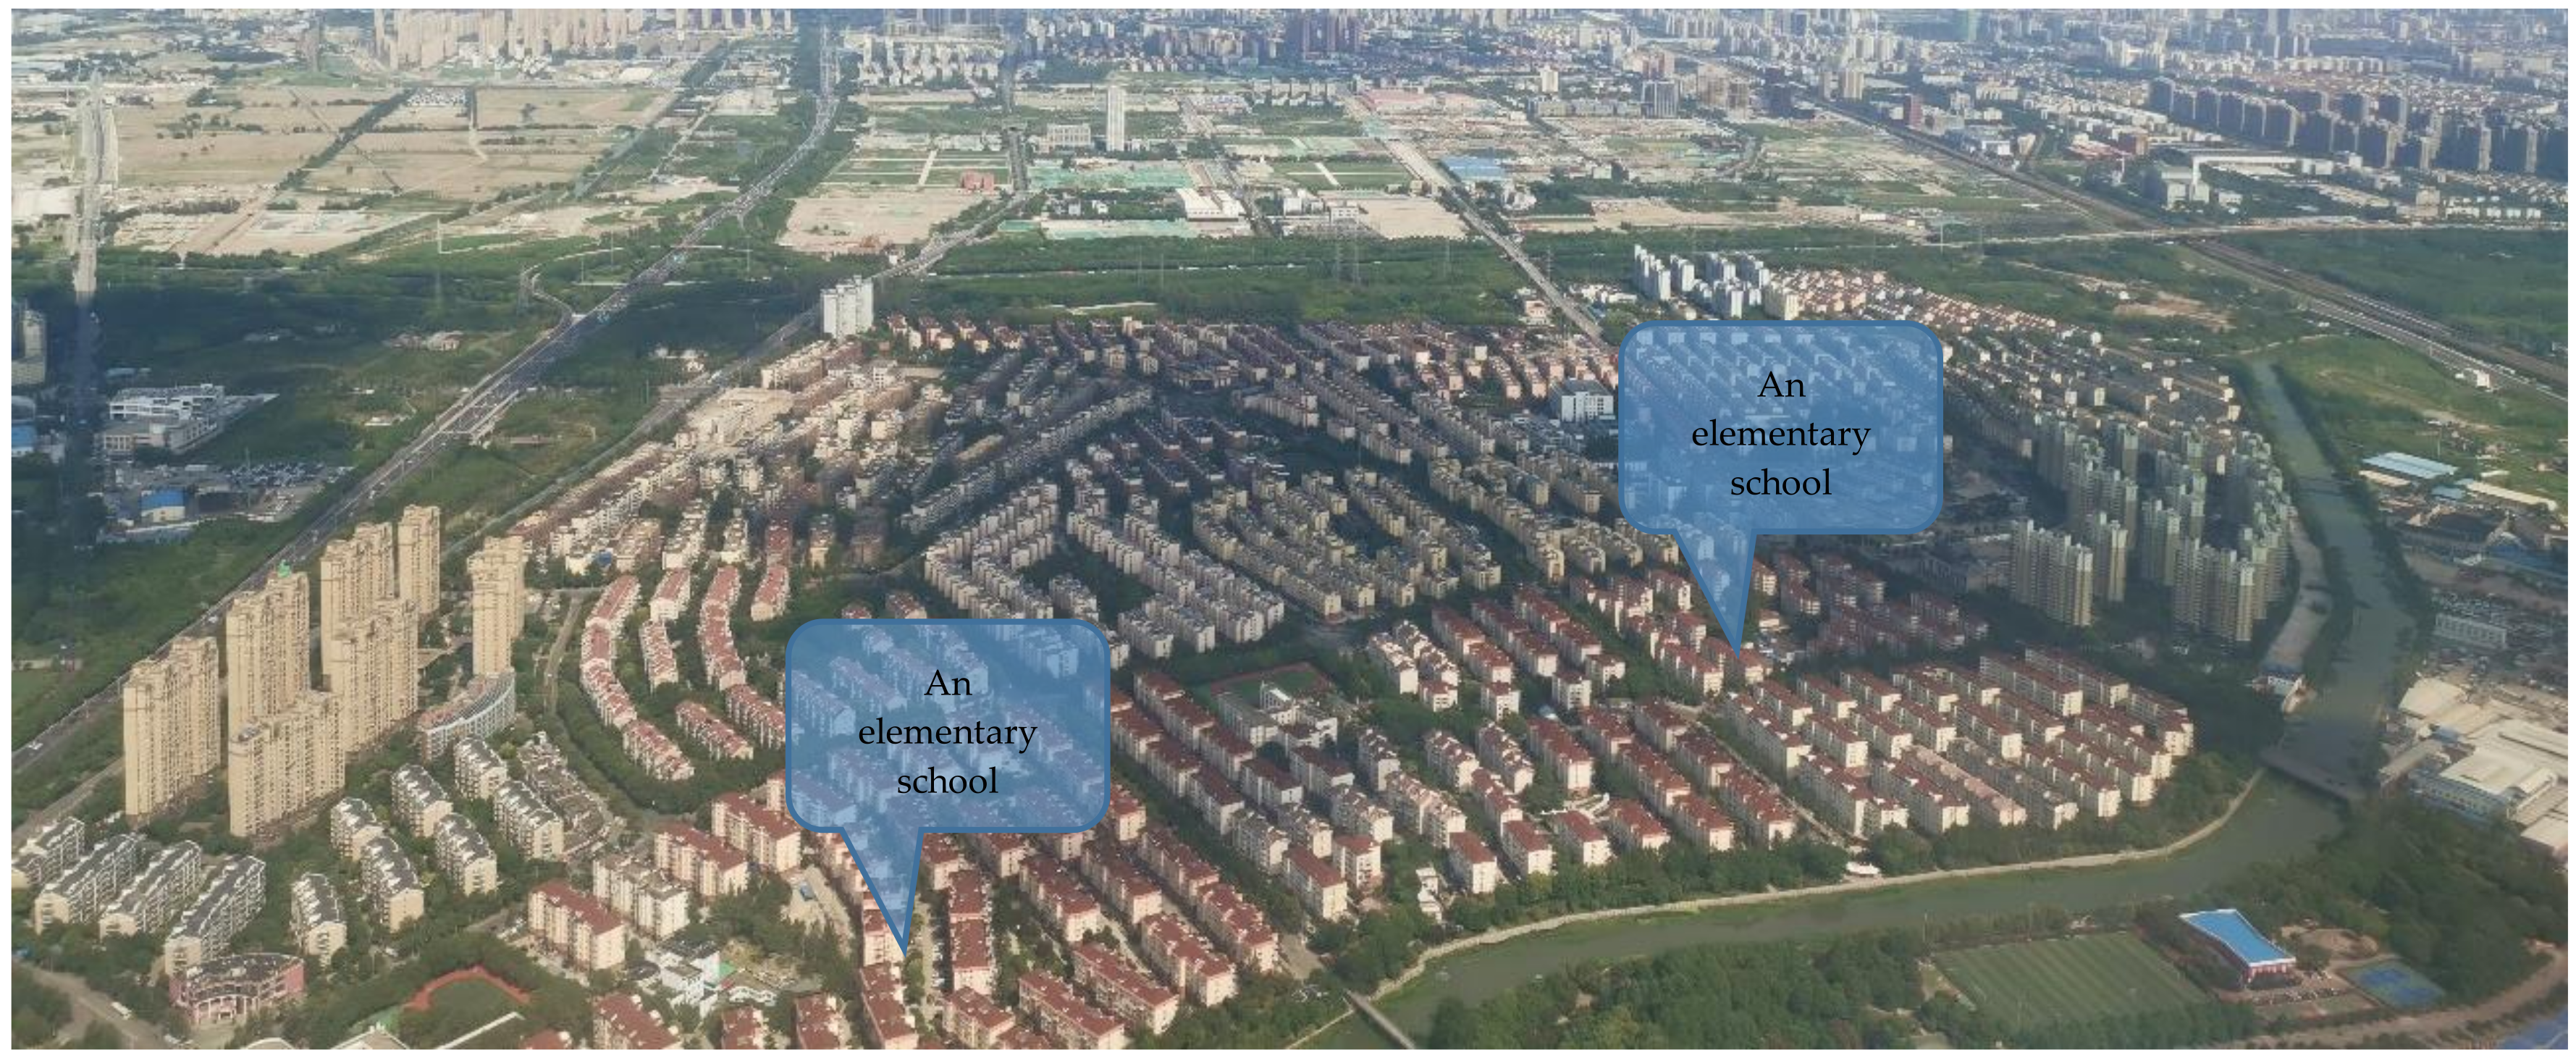
2.1. Study Area
2.2. Data
2.3. Built Environment Attributes
2.4. Regression Model Development
2.5. Models Selection
3. Results
3.1. Descriptive and Bivariate Statistics
3.2. Binary Logistic Regression Results
4. Discussion
5. Conclusions
Supplementary Materials
Author Contributions
Funding
Institutional Review Board Statement
Informed Consent Statement
Data Availability Statement
Acknowledgments
Conflicts of Interest
References
- Wu, W.; Gaubatz, P.R. The Chinese City; Routledge, Taylor & Francis Group: London, UK, 2013; p. 298. [Google Scholar]
- Bergère, M.-C. Shanghai: China’s Gateway to Modernity; Stanford University Press: Stanford, CA, USA, 2009; p. 497. [Google Scholar]
- Lai, K. Differentiated Markets: Shanghai, Beijing and Hong Kong in China’s Financial Centre Network. Urban Stud. 2012, 49, 1275–1296. [Google Scholar] [CrossRef]
- Lu, H. Beyond the Neon Lights: Everyday Shanghai in the Early Twentieth Century, Nachdr. ed.; University of California Press: Berkeley, CA, USA, 2008; p. 456. [Google Scholar]
- Pan, H.; Shen, Q.; Xue, S. Intermodal Transfer between Bicycles and Rail Transit in Shanghai, China. Transp. Res. Rec. 2010, 2144, 181–188. [Google Scholar] [CrossRef]
- Sha, Y.; Wu, J.; Ji, Y.; Chan, S.L.T.; Lim, W.Q. Evolution of Urban Planning and City Development of Shanghai: The Past Three Eras and the Present. In Shanghai Urbanism at the Medium Scale; Springer Berlin Heidelberg: Berlin/Heidelberg, Germany, 2014; pp. 9–18. [Google Scholar]
- Lu, D. Travelling Urban Form: The Neighbourhood Unit in China. Plan. Perspect. 2006, 21, 369–392. [Google Scholar] [CrossRef]
- Perry, C.A. The Neighborhood Unit; Regional New York and Its Environs: New York, NY, USA, 1929; Volume VII. [Google Scholar]
- Lu, X.-M.; Gu, X.-T. The Fifth Travel Survey of Residents in Shanghai and Characteristics Analysis. Urban Transp. China 2011, 9, 1–7. [Google Scholar]
- He, S.; Wu, F. Socio-spatial impacts of property-led redevelopment on China’s urban neighbourhoods. Cities 2007, 24, 194–208. [Google Scholar] [CrossRef]
- Wu, F.; Yeh, A.G.-O. Changing Spatial Distribution and Determinants of Land Development in Chinese Cities in the Transition from a Centrally Planned Economy to a Socialist Market Economy: A Case Study of Guangzhou. Urban Stud. 1997, 34, 1851–1879. [Google Scholar] [CrossRef]
- Ye, L. Urban regeneration in China: Policy, development, and issues. Local Econ. 2011, 26, 337–347. [Google Scholar] [CrossRef]
- Wu, F. The Global and Local Dimensions of Place-making: Remaking Shanghai as a World City. Urban Stud. 2000, 37, 1359–1377. [Google Scholar] [CrossRef]
- Leaf, M. Inner city redevelopment in China. Cities 1995, 12, 149–162. [Google Scholar] [CrossRef]
- Yang, Y.-R.; Chang, C.-h. An Urban Regeneration Regime in China: A Case Study of Urban Redevelopment in Shanghai’s Taipingqiao Area. Urban Stud. 2007, 44, 1809–1826. [Google Scholar] [CrossRef]
- Yin, J.; Yin, Z.; Zhong, H.; Xu, S.; Hu, X.; Wang, J.; Wu, J. Monitoring urban expansion and land use/land cover changes of Shanghai metropolitan area during the transitional economy (1979–2009) in China. Environ. Monit. Assess 2011, 177, 609–621. [Google Scholar] [CrossRef] [PubMed]
- Su, S.; Jiang, Z.; Zhang, Q.; Zhang, Y. Transformation of agricultural landscapes under rapid urbanization: A threat to sustainability in Hang-Jia-Hu region, China. Appl. Geogr. 2011, 31, 439–449. [Google Scholar] [CrossRef]
- Tan, M.; Li, X.; Xie, H.; Lu, C. Urban land expansion and arable land loss in China—A case study of Beijing–Tianjin–Hebei region. Land Use Policy 2005, 22, 187–196. [Google Scholar] [CrossRef]
- Gaubatz, P. China’s Urban Transformation: Patterns and Processes of Morphological Change in Beijing, Shanghai and Guangzhou. Urban Stud. 1999, 36, 1495–1521. [Google Scholar] [CrossRef] [PubMed]
- Guan, J.; Xu, C.; Fan, X.; Guan, Z. Travel Mode Choice Suppression in Large-Scale Residential Areas on the City Periphery: Case Study of Jinhexincheng, Shanghai, China. In Proceedings of the Transportation Research Board 96th Annual MeetingTransportation Research Board, Washington, DC, USA, 8–12 January 2017. [Google Scholar]
- Chaskin, R.J. Perspectives on Neighborhood and Community: A Review of the Literature. Soc. Serv. Rev. 1997, 71, 521–547. [Google Scholar] [CrossRef]
- Park, Y.; Rogers, G.O. Neighborhood Planning Theory, Guidelines, and Research: Can Area, Population, and Boundary Guide Conceptual Framing? J. Plan. Lit. 2015, 30, 18–36. [Google Scholar] [CrossRef]
- Jud, G.D.; Watts, J.M. Schools and Housing Values. Land Econ. 1981, 57, 459. [Google Scholar] [CrossRef]
- Tiebout, C.M. A Pure Theory of Local Expenditures. J. Political Econ. 1956, 64, 416–424. [Google Scholar] [CrossRef]
- Vitiello, D. Re-Forming Schools and Cities: Placing Education on the Landscape of Planning History. J. Plan. Hist. 2006, 5, 183–195. [Google Scholar] [CrossRef]
- Chen, C.; Uttal, D.H. Cultural Values, Parents’ Beliefs, and Children’s Achievement in the United States and China. Hum. Dev. 1988, 31, 351–358. [Google Scholar] [CrossRef]
- LeGates, R.T. Visions, scale, tempo, and form in China’s emerging city-regions. Cities 2014, 41, 171–178. [Google Scholar] [CrossRef]
- Zhang, M.; Chen, J. Unequal school enrollment rights, rent yields gap, and increased inequality: The case of Shanghai. China Econ. Rev. 2018, 49, 229–240. [Google Scholar] [CrossRef]
- Feng, H.; Lu, M. School quality and housing prices: Empirical evidence from a natural experiment in Shanghai, China. J. Hous. Econ. 2013, 22, 291–307. [Google Scholar] [CrossRef]
- Zheng, S.; Kahn, M.E. Land and residential property markets in a booming economy: New evidence from Beijing. J. Urban Econ. 2008, 63, 743–757. [Google Scholar] [CrossRef]
- Easton, S.; Ferrari, E. Children’s travel to school—The interaction of individual, neighbourhood and school factors. Transp. Policy 2015, 44, 9–18. [Google Scholar] [CrossRef] [Green Version]
- Azeredo, C.M.; de Rezende, L.F.M.; Canella, D.S.; Claro, R.M.; Peres, M.F.T.; Luiz, O.d.C.; França-Junior, I.; Kinra, S.; Hawkesworth, S.; Levy, R.B. Food environments in schools and in the immediate vicinity are associated with unhealthy food consumption among Brazilian adolescents. Prev. Med. 2016, 88, 73–79. [Google Scholar] [CrossRef] [PubMed]
- Ding, D.; Sallis, J.F.; Kerr, J.; Lee, S.; Rosenberg, D.E. Neighborhood Environment and Physical Activity Among Youth. Am. J. Prev. Med. 2011, 41, 442–455. [Google Scholar] [CrossRef]
- Cheng, J. Exploring urban morphology using multi-temporal urban growth data: A case study of Wuhan, China. Asian Geogr. 2011, 28, 85–103. [Google Scholar] [CrossRef]
- Schneider, A.; Chang, C.; Paulsen, K. The changing spatial form of cities in Western China. Landsc. Urban Plan. 2015, 135, 40–61. [Google Scholar] [CrossRef]
- Seto, K.C.; Fragkias, M. Quantifying Spatiotemporal Patterns of Urban Land-use Change in Four Cities of China with Time Series Landscape Metrics. Landsc. Ecol. 2005, 20, 871–888. [Google Scholar] [CrossRef]
- Wu, W.; Zhao, S.; Zhu, C.; Jiang, J. A comparative study of urban expansion in Beijing, Tianjin and Shijiazhuang over the past three decades. Landsc. Urban Plan. 2015, 134, 93–106. [Google Scholar] [CrossRef]
- Xu, X.; Min, X. Quantifying spatiotemporal patterns of urban expansion in China using remote sensing data. Cities 2013, 35, 104–113. [Google Scholar] [CrossRef]
- Yu, W.; Zhou, W. The Spatiotemporal Pattern of Urban Expansion in China: A Comparison Study of Three Urban Megaregions. Remote Sens. 2017, 9, 45. [Google Scholar] [CrossRef] [Green Version]
- Barke, M. The Importance of Urban Form as an Object of Study. In Teaching Urban Morphology; Oliveira, V., Ed.; Springer International Publishing: Cham, Switzerland, 2018; pp. 11–30. [Google Scholar]
- Liu, Y.; He, S.; Wu, F.; Webster, C. Urban villages under China’s rapid urbanization: Unregulated assets and transitional neighbourhoods. Habitat Int. 2010, 34, 135–144. [Google Scholar] [CrossRef]
- Whitehand, J.W.R.; Gu, K. Research on Chinese urban form: Retrospect and prospect. Prog. Hum. Geogr. 2006, 30, 337–355. [Google Scholar] [CrossRef]
- Whitehand, J.W.R.; Gu, K.; Conzen, M.P.; Whitehand, S.M. The Typological Process and the Morphological Period: A Cross-Cultural Assessment. Environ. Plann. B Plann. Des. 2014, 41, 512–533. [Google Scholar] [CrossRef]
- Zhang, C.; Chai, Y. Un-gated and integrated Work Unit communities in post-socialist urban China: A case study from Beijing. Habitat Int. 2014, 43, 79–89. [Google Scholar] [CrossRef]
- Zhao, W.; Zou, Y. Un-gating the gated community: The spatial restructuring of a resettlement neighborhood in Nanjing. Cities 2017, 62, 78–87. [Google Scholar] [CrossRef]
- Wan, Z. China’s scientific progress hinges on access to data. Nature 2015, 520, 587. [Google Scholar] [CrossRef] [Green Version]
- Peterson, M.P. Online Mapping with APIs. In Online Maps with APIs and WebServices; Peterson, M.P., Ed.; Springer: Berlin/Heidelberg, Germany, 2012; pp. 3–12. [Google Scholar]
- Liu, X.; Song, Y.; Wu, K.; Wang, J.; Li, D.; Long, Y. Understanding urban China with open data. Cities 2015, 47, 53–61. [Google Scholar] [CrossRef]
- Long, Y.; Zhai, W.; Shen, Y.; Ye, X. Understanding uneven urban expansion with natural cities using open data. Landsc. Urban Plan. 2018, 177, 281–293. [Google Scholar] [CrossRef] [Green Version]
- Li, J.; Long, Y.; Dang, A. Live-Work-Play Centers of Chinese cities: Identification and temporal evolution with emerging data. Comput. Environ. Urban Syst. 2018, 71, 58–66. [Google Scholar] [CrossRef]
- Zhang, Y.; Li, X.; Wang, A.; Bao, T.; Tian, S. Density and diversity of OpenStreetMap road networks in China. J. Urban Manag. 2015, 4, 135–146. [Google Scholar] [CrossRef] [Green Version]
- Zhang, X.; Ren, A.; Chen, L.; Zheng, X. Measurement and Spatial Difference Analysis on the Accessibility of Road Networks in Major Cities of China. Sustainability 2019, 11, 4209. [Google Scholar] [CrossRef] [Green Version]
- Shanghai Bureau of Statistics. Shanghai Statistical Yearbook 2015; Shanghai Bureau of Statistics: Shanghai, China, 2014. [Google Scholar]
- Mehaffy, M.W.; Porta, S.; Romice, O. The “neighborhood unit” on trial: A case study in the impacts of urban morphology. J. Urban. Int. Res. Placemaking Urban Sustain. 2015, 8, 199–217. [Google Scholar] [CrossRef]
- Zhang, M. Chinese Edition of Transit-Oriented Development. Transp. Res. Rec. 2007, 2038, 120–127. [Google Scholar] [CrossRef]
- Weinstein Agrawal, A.; Schlossberg, M.; Irvin, K. How Far, by Which Route and Why? A Spatial Analysis of Pedestrian Preference. J. Urban Des. 2008, 13, 81–98. [Google Scholar] [CrossRef]
- Rundle, A.; Neckerman, K.M.; Freeman, L.; Lovasi, G.S.; Purciel, M.; Quinn, J.; Richards, C.; Sircar, N.; Weiss, C. Neighborhood Food Environment and Walkability Predict Obesity in New York City. Environ. Health Perspect. 2009, 117, 442–447. [Google Scholar] [CrossRef] [PubMed]
- Graf, C. The Lawton Instrumental Activities of Daily Living Scale. AJN Am. J. Nurs. 2008, 108, 52–62. [Google Scholar] [CrossRef] [PubMed] [Green Version]
- Katz, S. Assessing Self-maintenance: Activities of Daily Living, Mobility, and Instrumental Activities of Daily Living. J. Am. Geriatr. Soc. 1983, 31, 721–727. [Google Scholar] [CrossRef] [PubMed]
- Lawton, M.P.; Brody, E.M. Assessment of Older People: Self-Maintaining and Instrumental Activities of Daily Living. Gerontologist 1969, 9, 179–186. [Google Scholar] [CrossRef]
- Romero-Ayuso, D.; Castillero-Perea, Á.; González, P.; Navarro, E.; Molina-Massó, J.P.; Funes, M.J.; Ariza-Vega, P.; Toledano-González, A.; Triviño-Juárez, J.M. Assessment of cognitive instrumental activities of daily living: A systematic review. Disabil. Rehabil. 2021, 43, 1342–1358. [Google Scholar] [CrossRef] [PubMed]
- Bedimo-Rung, A.L.; Mowen, A.J.; Cohen, D.A. The significance of parks to physical activity and public health. Am. J. Prev. Med. 2005, 28, 159–168. [Google Scholar] [CrossRef] [PubMed]
- Larson, L.R.; Jennings, V.; Cloutier, S.A. Public Parks and Wellbeing in Urban Areas of the United States. PLoS ONE 2016, 11, e0153211. [Google Scholar] [CrossRef] [PubMed]
- Xiong, Y. From racecourse to People’s Park and People’s Square: Historical transformation and symbolic significance. Urban Hist. 2011, 38, 475–490. [Google Scholar] [CrossRef]
- Cervero, R.; Kockelman, K. Travel demand and the 3Ds: Density, diversity, and design. Transp. Res. Part D Transp. Environ. 1997, 2, 199–219. [Google Scholar] [CrossRef]
- Schwarz, N. Urban form revisited—Selecting indicators for characterising European cities. Landsc. Urban Plan. 2010, 96, 29–47. [Google Scholar] [CrossRef]
- Song, Y.; Knaap, G.-J. Measuring Urban Form: Is Portland Winning the War on Sprawl? J. Am. Plan. Assoc. 2004, 70, 210–225. [Google Scholar] [CrossRef]
- Tratalos, J.; Fuller, R.A.; Warren, P.H.; Davies, R.G.; Gaston, K.J. Urban form, biodiversity potential and ecosystem services. Landsc. Urban Plan. 2007, 83, 308–317. [Google Scholar] [CrossRef]
- Tsai, Y.-H. Quantifying Urban Form: Compactness versus ‘Sprawl’. Urban Stud. 2005, 42, 141–161. [Google Scholar] [CrossRef]
- Dormann, F.C.; McPherson, M.J.; Araújo, B.M.; Bivand, R.; Bolliger, J.; Carl, G.; Davies, G.R.; Hirzel, A.; Jetz, W.; Daniel Kissling, W.; et al. Methods to account for spatial autocorrelation in the analysis of species distributional data: A review. Ecography 2007, 30, 609–628. [Google Scholar] [CrossRef] [Green Version]
- Burnham, K.P.; Anderson, D.R. Multimodel Inference: Understanding AIC and BIC in Model Selection. Sociol. Methods Res. 2004, 33, 261–304. [Google Scholar] [CrossRef]
- Deng, F.F.; Huang, Y. Uneven land reform and urban sprawl in China: The case of Beijing. Prog. Plan. 2004, 61, 211–236. [Google Scholar] [CrossRef]
- Feng, J.; Zhou, Y.; Wu, F. New Trends of Suburbanization in Beijing since 1990: From Government-led to Market-oriented. Reg. Stud. 2008, 42, 83–99. [Google Scholar] [CrossRef] [Green Version]
- Yue, W.; Liu, Y.; Fan, P. Measuring urban sprawl and its drivers in large Chinese cities: The case of Hangzhou. Land Use Policy 2013, 31, 358–370. [Google Scholar] [CrossRef]
- Zhou, Y.; Ma, L.J.C. Economic Restructuring and Suburbanization in China. Urban Geogr. 2000, 21, 205–236. [Google Scholar] [CrossRef]
- Hess, P.M. Measures of Connectivity [Streets: Old Paradigm, New Investment]. Places 1997, 11, 58–65. [Google Scholar]
- Owens, P.M. Neighborhood form and pedestrian life: Taking a closer look. Landsc. Urban Plan. 1993, 26, 115–135. [Google Scholar] [CrossRef]
- Saelens, B.E.; Sallis, J.F.; Black, J.B.; Chen, D. Neighborhood-Based Differences in Physical Activity: An Environment Scale Evaluation. Am. J. Public Health 2003, 93, 1552–1558. [Google Scholar] [CrossRef] [PubMed]
- Southworth, M.; Owens, P.M. The Evolving Metropolis: Studies of Community, Neighborhood, and Street Form at the Urban Edge. J. Am. Plan. Assoc. 1993, 59, 271–287. [Google Scholar] [CrossRef]
- He, S.; Wu, F. Property-Led Redevelopment in Post-Reform China: A Case Study of Xintiandi Redevelopment Project in Shanghai. J. Urban Aff. 2005, 27, 1–23. [Google Scholar] [CrossRef]
- He, S.; Wu, F. Neighborhood changes and residential differentiation in Shanghai. In China’s Emerging Cities; Routledge: London, UK, 2007. [Google Scholar]
- Wu, D.; Li, T. The Present Situation and Prospective Development of the Shanghai Urban Community. In The New Chinese City; Logan, J.R., Ed.; Blackwell Publishers Ltd.: Oxford, UK, 2001; pp. 22–36. [Google Scholar]
- Pan, H.; Zhang, M. Rail Transit Impacts on Land Use: Evidence from Shanghai, China. Transp. Res. Rec. 2008, 2048, 16–25. [Google Scholar] [CrossRef]
- Austin, S.B.; Melly, S.J.; Sanchez, B.N.; Patel, A.; Buka, S.; Gortmaker, S.L. Clustering of Fast-Food Restaurants Around Schools: A Novel Application of Spatial Statistics to the Study of Food Environments. Am. J. Public Health 2005, 95, 1575–1581. [Google Scholar] [CrossRef]
- Davis, B.; Carpenter, C. Proximity of Fast-Food Restaurants to Schools and Adolescent Obesity. Am. J. Public Health 2009, 99, 505–510. [Google Scholar] [CrossRef] [PubMed]
- Fleischhacker, S.E.; Evenson, K.R.; Rodriguez, D.A.; Ammerman, A.S. A systematic review of fast food access studies: Fast food access review. Obes. Rev. 2011, 12, e460–e471. [Google Scholar] [CrossRef] [PubMed]


| Categories | Items | Measures |
|---|---|---|
| Distance (Euclidian) | Distance to the city center | Distance to People’s Square |
| Buildings | Residential buildings | Counts in a 100 m buffer, 200 m buffer, 400 m buffer, and 800 m buffer |
| Office buildings | ||
| Transportation facility | Street network length | The total length of streets in a 100 m buffer, 200 m buffer, 400 m buffer, and 800 m buffer |
| Street intersection | Counts in a 100 m buffer, 200 m buffer, 400 m buffer, and 800 m buffer | |
| Bus stop | ||
| Subway station | ||
| Gas station | ||
| Train station | ||
| Parking lot | ||
| Land use | Regular restaurant | Counts in a 100 m buffer, 200 m buffer, 400 m buffer, and 800 m buffer |
| Fast food restaurant | ||
| Hotel | ||
| Retail store | ||
| Supermarket | ||
| Farmer’s market | ||
| Bank | ||
| Hospital | ||
| Drug store | ||
| Educational use | ||
| Park |
| City Center | New Districts | Total | p-Value | |||
|---|---|---|---|---|---|---|
| Distance to People’s Square | Distance in meters | 6217.11 ± 3211.97 | 26,658.49 ± 24,933.77 | 710 | 0.000 | |
| Distance natural log transformed | 8.57 ± 0.64 | 9.95 ± 0.67 | 710 | 0.000 | ||
| Residential building | 100 m buffer | 0 residential building | 15.5% | 84.5% | 310 | 0.000 |
| 1 to 10 residential buildings | 54.3% | 45.7% | 291 | |||
| 11 and more residential buildings | 76.1% | 23.9% | 109 | |||
| 200 m buffer | 0 residential building | 2.3% | 97.7% | 173 | 0.000 | |
| 1 to 10 residential buildings | 28.0% | 72.0% | 175 | |||
| 11 to 40 residential buildings | 57.7% | 42.3% | 182 | |||
| 41 and more residential buildings | 72.8% | 27.2% | 180 | |||
| 400 m buffer | 0 residential building | 15.7% | 84.3% | 102 | 0.000 | |
| 1 to 10 residential buildings | 3.7% | 96.3% | 164 | |||
| 11 to 99 residential buildings | 51.8% | 48.2% | 168 | |||
| 100 and more residential buildings | 65.2% | 34.8% | 276 | |||
| 800 m buffer | 1 to 10 residential buildings | 8.3% | 91.7% | 169 | 0.000 | |
| 11 to 99 residential buildings | 16.4% | 83.6% | 128 | |||
| 100 and more residential buildings | 61.5% | 38.5% | 413 | |||
| Office building | 100 m buffer | 0 office building | 37.5% | 62.5% | 666 | 0.000 |
| 1 and more office buildings | 88.6% | 11.4% | 44 | |||
| 200 m buffer | 0 office building | 34.2% | 65.8% | 600 | 0.000 | |
| 1 and more office buildings | 76.4% | 23.6% | 110 | |||
| 400 m buffer | 0 office building | 21.5% | 78.5% | 423 | 0.000 | |
| 1 and more office buildings | 69.0% | 31.0% | 287 | |||
| 800 m buffer | 0 office building | 11.2% | 88.8% | 241 | 0.000 | |
| 1 to 10 office buildings | 36.0% | 64.0% | 297 | |||
| 11 and more office buildings | 90.1% | 9.9% | 172 | |||
| Bus stop | 100 m buffer | 0 bus stop | 40.9% | 59.1% | 609 | 0.808 |
| 1 to 3 bus stops | 39.6% | 60.4% | 101 | |||
| 200 m buffer | 0 bus stop | 44.1% | 55.9% | 426 | 0.023 | |
| 1 to 5 bus stops | 35.6% | 64.4% | 284 | |||
| 400 m buffer | 2.41 ± 1.58 | 2.09 ± 1.65 | 710 | 0.010 | ||
| 800 m buffer | 9.56 ± 4.36 | 7.61 ± 4.77 | 710 | 0.000 | ||
| Subway station | 100 m buffer | 0 subway station | 40.7% | 59.3% | 710 | |
| 200 m buffer | 0 subway station | 40.7% | 59.3% | 703 | 0.907 | |
| 1 subway station | 42.9% | 57.1% | 7 | |||
| 400 m buffer | 0 subway station | 38.7% | 61.3% | 664 | 0.000 | |
| 1 and more subway stations | 69.6% | 30.4% | 46 | |||
| 800 m buffer | 0 subway station | 28.4% | 71.6% | 510 | 0.000 | |
| 1 and more gas stations | 72.0% | 28.0% | 200 | |||
| Gas station | 100 m buffer | 0 gas station | 40.5% | 59.5% | 708 | 0.087 |
| 1 gas station | 100.0% | 0.0% | 2 | |||
| 200 m buffer | 0 gas station | 40.4% | 59.6% | 698 | 0.210 | |
| 1 and more gas stations | 58.3% | 41.7% | 12 | |||
| 400 m buffer | 0 gas station | 38.5% | 61.5% | 650 | 0.000 | |
| 1 and more gas stations | 65.0% | 35.0% | 60 | |||
| 800 m buffer | 0 gas station | 32.4% | 67.6% | 479 | 0.000 | |
| 1 and more gas stations | 58.0% | 42.0% | 231 | |||
| Parking lot | 100 m buffer | 0 parking lot | 38.8% | 61.2% | 649 | 0.001 |
| 1 and more parking lots | 60.7% | 39.3% | 61 | |||
| 200 m buffer | 0 parking lot | 37.2% | 62.8% | 570 | 0.000 | |
| 1 and more parking lots | 55.0% | 45.0% | 140 | |||
| 400 m buffer | 0 parking lot | 23.5% | 76.5% | 327 | 0.000 | |
| 1 and more parking lots | 55.4% | 44.6% | 383 | |||
| 800 m buffer | 13.92 ± 10.57 | 3.86 ± 4.96 | 710 | 0.000 | ||
| Street network length | 100 m buffer | 0 m | 52.9% | 47.1% | 102 | 0.075 |
| 1 to 200 m | 42.5% | 57.5% | 134 | |||
| 200.01 to 400 m | 34.8% | 65.2% | 201 | |||
| 400.01 to 600 m | 40.1% | 59.9% | 142 | |||
| 600.01 to 800 m | 41.3% | 58.7% | 75 | |||
| 800.01 and more | 35.7% | 64.3% | 56 | |||
| 200 m buffer | Measured in km | 1.39 ± 0.79 | 1.52 ± 0.82 | 710 | 0.034 | |
| 400 m buffer | Measured in km | 5.07 ± 2.57 | 6.08 ± 2.52 | 710 | 0.000 | |
| 800 m buffer | Measured in km | 19.78 ± 8.94 | 24.15 ± 8.44 | 710 | 0.000 | |
| Street intersection | 100 m buffer | 0 intersections | 47.5% | 52.5% | 240 | 0.026 |
| 1 to 2 intersections | 35.9% | 64.1% | 237 | |||
| 3 and more intersections | 38.6% | 61.4% | 233 | |||
| 200 m buffer | 8.92 ± 7.49 | 9.75 ± 7.94 | 710 | 0.185 | ||
| 400 m buffer | 31.31 ± 22.85 | 38.29 ± 24.73 | 710 | 0.000 | ||
| 800 m buffer | 118.75 ± 78.21 | 150.36 ± 76.99 | 710 | 0.000 | ||
| City Center | New Districts | Total | p-Value | |||
|---|---|---|---|---|---|---|
| Regular restaurant | 100 m buffer | 0 restaurant | 30.7% | 69.3% | 398 | 0.000 |
| 1 and more than 1 restaurant | 53.5% | 46.5% | 312 | |||
| 200 m buffer | 0 restaurant | 39.4% | 60.6% | 241 | 0.000 | |
| 1 to 5 restaurants | 29.7% | 70.3% | 246 | |||
| 6 and more restaurants | 54.3% | 45.7% | 223 | |||
| 400 m buffer | fewer than 10 restaurants | 17.6% | 82.4% | 239 | 0.000 | |
| 10 to 19 restaurants | 33.8% | 66.2% | 148 | |||
| 20 to 29 restaurants | 48.4% | 51.6% | 124 | |||
| 30 to 39 restaurants | 51.4% | 48.6% | 70 | |||
| 40 to 49 restaurants | 70.0% | 30.0% | 40 | |||
| 50 and more restaurants | 82.0% | 18.0% | 89 | |||
| 800 m buffer | Fewer than 35 restaurants | 12.4% | 87.6% | 233 | 0.000 | |
| 36 to 99 restaurants | 36.2% | 63.8% | 243 | |||
| 100 and more restaurants | 73.5% | 26.5% | 234 | |||
| Fast food restaurant | 100 m buffer | 0 fast-food restaurant | 28.7% | 71.3% | 432 | 0.000 |
| 1 and more fast food restaurant | 59.4% | 40.6% | 278 | |||
| 200 m buffer | 0 fast-food restaurant | 35.1% | 64.9% | 291 | 0.000 | |
| 1 to 5 fast-food restaurants | 30.2% | 69.8% | 242 | |||
| 6 and more fast-food restaurants | 64.4% | 35.6% | 177 | |||
| 400 m buffer | 0 fast-food restaurant | 13.3% | 86.7% | 90 | 0.000 | |
| 1 to 5 fast-food restaurants | 15.0% | 85.0% | 140 | |||
| 6 to 10 fast-food restaurants | 30.9% | 69.1% | 110 | |||
| 11 to 15 fast-food restaurants | 46.2% | 53.8% | 78 | |||
| 16 to 20 fast-food restaurants | 45.3% | 54.7% | 64 | |||
| 21 to 25 fast-food restaurants | 58.5% | 41.5% | 53 | |||
| 26 to 30 fast-food restaurants | 52.5% | 47.5% | 40 | |||
| 31 to 45 fast-food restaurants | 71.8% | 28.2% | 71 | |||
| 46 and more fast-food restaurants | 84.4% | 15.6% | 64 | |||
| 800 m buffer | few than 10 fast-food restaurants | 9.7% | 90.3% | 144 | 0.000 | |
| 11 to 30 fast-food restaurants | 14.8% | 85.2% | 122 | |||
| 31 to 60 fast-food restaurants | 33.5% | 66.5% | 167 | |||
| 61 to 99 fast-food restaurants | 57.0% | 43.0% | 121 | |||
| 100 and more fast-food restaurants | 84.6% | 15.4% | 156 | |||
| Hotel | 100 m buffer | 0 hotel | 36.6% | 63.4% | 593 | 0.000 |
| 1 and more hotels | 61.5% | 38.5% | 117 | |||
| 200 m buffer | 0 hotel | 38.4% | 61.6% | 451 | 0.093 | |
| 1 and more hotels | 44.8% | 55.2% | 259 | |||
| 400 m buffer | 0 hotel | 23.5% | 76.5% | 170 | 0.000 | |
| 1 to 2 hotels | 31.8% | 68.2% | 214 | |||
| 3 to 5 hotels | 47.6% | 52.4% | 170 | |||
| 6 and more hotels | 64.1% | 35.9% | 156 | |||
| 800 m buffer | 19.96 ± 15.47 | 8.78 ± 8.01 | 710 | 0.000 | ||
| Retail store | 100 m buffer | 0 retail store | 40.3% | 59.7% | 699 | 0.119 |
| 1 and more retail stores | 63.6% | 36.4% | 11 | |||
| 200 m buffer | 0 retail store | 40.5% | 59.5% | 677 | 0.569 | |
| 1 and more retail stores | 45.5% | 54.5% | 33 | |||
| 400 m buffer | 0 retail store | 38.1% | 61.9% | 561 | 0.007 | |
| 1 and more retail stores | 50.3% | 49.7% | 149 | |||
| 800 m buffer | 0 retail store | 30.2% | 69.8% | 311 | 0.000 | |
| 1 and more retail stores | 48.9% | 51.1% | 399 | |||
| Supermarket | 100 m buffer | 0 supermarket | 39.8% | 60.2% | 600 | 0.270 |
| 1 and more supermarkets | 45.5% | 54.5% | 110 | |||
| 200 m buffer | 0 supermarket | 42.4% | 57.6% | 425 | 0.275 | |
| 1 and more supermarkets | 38.2% | 61.8% | 285 | |||
| 400 m buffer | 3.26 ± 2.33 | 2.47 ± 2.16 | 710 | 0.000 | ||
| 800 m buffer | 11.79 ± 5.03 | 7.89 ± 4.63 | 710 | 0.000 | ||
| Farmer’s market | 100 m buffer | 0 farmer’s market | 40.3% | 59.7% | 648 | 0.455 |
| 1 and more farmer’s market | 45.2% | 54.8% | 62 | |||
| 200 m buffer | 0 farmer’s market | 39.4% | 60.6% | 530 | 0.237 | |
| 1 and more farmer’s market | 44.4% | 55.6% | 180 | |||
| 400 m buffer | 0 farmer’s market | 27.3% | 72.7% | 227 | 0.000 | |
| 1 to 2 farmer’s markets | 40.8% | 59.2% | 294 | |||
| 3 and more farmer’s markets | 56.6% | 43.4% | 189 | |||
| 800 m buffer | 8.07 ± 5.44 | 4.24 ± 3.45 | 710 | 0.000 | ||
| Bank | 100 m buffer | 0 bank | 38.1% | 61.9% | 625 | 0.000 |
| 1 and more banks | 60.0% | 40.0% | 85 | |||
| 200 m buffer | 0 bank | 38.0% | 62.0% | 527 | 0.011 | |
| 1 and more banks | 48.6% | 51.4% | 183 | |||
| 400 m buffer | 0 bank | 24.0% | 76.0% | 233 | 0.000 | |
| 1 to 4 banks | 38.5% | 61.5% | 247 | |||
| 5 and more banks | 60.0% | 40.0% | 230 | |||
| 800 m buffer | 23.97 ± 17.97 | 9.14 ± 8.87 | 710 | 0.000 | ||
| Hospital | 100 m buffer | 0 hospital | 39.5% | 60.5% | 686 | 0.001 |
| 1 and more hospitals | 75.0% | 25.0% | 24 | |||
| 200 m buffer | 0 hospital | 38.0% | 62.0% | 634 | 0.000 | |
| 1 and more hospitals | 63.2% | 36.8% | 76 | |||
| 400 m buffer | 0 hospital | 27.7% | 72.3% | 458 | 0.000 | |
| 1 and more hospitals | 64.3% | 35.7% | 252 | |||
| 800 m buffer | 0 hospital | 12.1% | 87.9% | 207 | 0.000 | |
| 1 to 3 hospitals | 29.4% | 70.6% | 255 | |||
| 4 and more hospitals | 76.2% | 23.8% | 248 | |||
| Drug store | 100 m buffer | 0 drug store | 39.5% | 60.5% | 648 | 0.036 |
| 1 and more drug stores | 53.2% | 46.8% | 62 | |||
| 200 m buffer | 0 drug store | 38.8% | 61.2% | 505 | 0.107 | |
| 1 and more drug stores | 45.4% | 54.6% | 205 | |||
| 400 m buffer | 0 drug store | 28.4% | 71.6% | 190 | 0.000 | |
| 1 drug store | 39.9% | 60.1% | 223 | |||
| 2 and more drug stores | 49.2% | 50.8% | 297 | |||
| 800 m buffer | 6.84 ± 3.25 | 4.09 ± 3.02 | 710 | 0.000 | ||
| Educational use | 100 m buffer | 0 school | 27.8% | 72.2% | 198 | 0.000 |
| 1 school | 47.0% | 53.0% | 328 | |||
| 2 and more schools | 43.5% | 56.5% | 184 | |||
| 200 m buffer | 0 school | 52.3% | 47.7% | 149 | 0.000 | |
| 1 school | 28.4% | 71.6% | 264 | |||
| 2 schools | 37.6% | 62.4% | 178 | |||
| 3 and more schools | 58.0% | 42.0% | 119 | |||
| 400 m buffer | 5.57 ± 3.92 | 2.82 ± 2.93 | 710 | 0.000 | ||
| 800 m buffer | 18.64 ± 12.81 | 6.75 ± 6.84 | 710 | 0.000 | ||
| Park | 100 m buffer | 0 park | 40.4% | 59.6% | 705 | 0.073 |
| 1 and more parks | 80.0% | 20.0% | 5 | |||
| 200 m buffer | 0 park | 40.5% | 59.5% | 696 | 0.475 | |
| 1 and more parks | 50.0% | 50.0% | 14 | |||
| 400 m buffer | 0 park | 38.5% | 61.5% | 633 | 0.001 | |
| 1 and more parks | 58.4% | 41.6% | 77 | |||
| 800 m buffer | 0 park | 30.7% | 69.3% | 453 | 0.000 | |
| 1 and more parks | 58.4% | 41.6% | 257 |
| Model—100 m | Model—200 m | Model—400 m | Model—800 m | |||||||||
|---|---|---|---|---|---|---|---|---|---|---|---|---|
| Measures | ß | Sig. | Measures | ß | Sig. | Measures | ß | Sig. | Measures | ß | Sig. | |
| Constant | 33.793 | 0.000 | 32.997 | 0.000 | 35.054 | 0.000 | 36.449 | 0.000 | ||||
| Distance to the city center | Distance to the city center (natural log transformed) | −3.686 | 0.000 | Distance to the city center (natural log transformed) | -3.599 | 0.000 | Distance to the city center (natural log transformed) | −3.710 | 0.000 | Distance to the city center (natural log transformed) | −3.888 | 0.000 |
| Residential buildings | 0 residential buildings # | 0.000 | 0 residential buildings # | 0.000 | 0 residential buildings # | 0.000 | 1 to 10 residential buildings # | 0.000 | ||||
| 1 to 10 residential buildings | 0.565 | 0.063 | 1 to 10 residential buildings | 0.926 | 0.154 | 1 to 10 residential buildings | −1.228 | 0.069 | 11 to 99 residential buildings | 0.435 | 0.470 | |
| 11 and more residential buildings | 1.49 | 0.000 | 11 and 40 residential buildings | 1.519 | 0.014 | 11 and 99 residential buildings | −0.243 | 0.663 | 100 and more residential buildings | 1.260 | 0.008 | |
| 41 and more residential buildings | 1.893 | 0.002 | 100 and more residential buildings | 0.375 | 0.466 | |||||||
| Street network length | 0 m # | 0.000 | Street network length (continuous variable, measured in km) | −0.349 | 0.033 | Street network length (continuous variable, measured in km) | −0.206 | 0.000 | Street network length (continuous variable, measured in km) | −0.086 | 0.000 | |
| 1 to 200 m | −0.712 | 0.105 | ||||||||||
| 200.01 to 400 m | −0.933 | 0.020 | ||||||||||
| 400.01 to 600 m | −0.885 | 0.035 | ||||||||||
| 600.01 to 800 m | −0.434 | 0.394 | ||||||||||
| greater than 800 m | −0.926 | 0.076 | ||||||||||
| Bus stop | 0 bus stop # | 0.000 | Bus stop (continuous variable) | −0.002 | 0.981 | |||||||
| 1 to 3 bus stops | −0.112 | 0.754 | ||||||||||
| Educational use | 0 school # | 0.000 | ||||||||||
| 1 school | −1.706 | 0.000 | ||||||||||
| 2 schools | −1.159 | 0.004 | ||||||||||
| 3 and more schools | −0.813 | 0.069 | ||||||||||
| Total of observations | 710 | 710 | 710 | 710 | ||||||||
| −2 log likelihood | 404.617 | 364.402 | 387.914 | 375.674 | ||||||||
| −2 log Likelihood | # Parameters | # of Observations | BIC | AIC | |
|---|---|---|---|---|---|
| model—100 m | 404.617 | 4 | 710 | 430.878 | 412.617 |
| model—200 m | 364.402 | 4 | 710 | 390.663 | 372.402 |
| model—400 m | 387.914 | 4 | 710 | 414.175 | 395.914 |
| model—800 m | 375.674 | 3 | 710 | 395.370 | 381.674 |
Publisher’s Note: MDPI stays neutral with regard to jurisdictional claims in published maps and institutional affiliations. |
© 2021 by the authors. Licensee MDPI, Basel, Switzerland. This article is an open access article distributed under the terms and conditions of the Creative Commons Attribution (CC BY) license (https://creativecommons.org/licenses/by/4.0/).
Share and Cite
Lin, L.; Chen, X.; Moudon, A.V. Measuring the Urban Forms of Shanghai’s City Center and Its New Districts: A Neighborhood-Level Comparative Analysis. Sustainability 2021, 13, 8481. https://doi.org/10.3390/su13158481
Lin L, Chen X, Moudon AV. Measuring the Urban Forms of Shanghai’s City Center and Its New Districts: A Neighborhood-Level Comparative Analysis. Sustainability. 2021; 13(15):8481. https://doi.org/10.3390/su13158481
Chicago/Turabian StyleLin, Lin, Xueming (Jimmy) Chen, and Anne Vernez Moudon. 2021. "Measuring the Urban Forms of Shanghai’s City Center and Its New Districts: A Neighborhood-Level Comparative Analysis" Sustainability 13, no. 15: 8481. https://doi.org/10.3390/su13158481
APA StyleLin, L., Chen, X., & Moudon, A. V. (2021). Measuring the Urban Forms of Shanghai’s City Center and Its New Districts: A Neighborhood-Level Comparative Analysis. Sustainability, 13(15), 8481. https://doi.org/10.3390/su13158481