Abstract
To echo the United Nations formulated Sustainable Development Goals (SDGs), SDG 4 is to ensure inclusive and equitable quality education and promote lifelong learning opportunities for all. Furthermore, high-quality education is the base on which human lives can be improved and sustainable development can be accomplished. Therefore, the affective emotional tutoring system established in this study enables learning via mobile devices, which are indispensable in daily life. The real-time interactive agent in the system guides learners to turn negative emotions into positive ones. We explored the usability of and user satisfaction with the affective emotional tutoring system. Sixty-two students participated in the study which used a quantitative research design to explore a learning situation. The overall usability of the system was evaluated with the System Usability Scale (SUS), and the Questionnaire for User Interaction Satisfaction (QUIS) was used to evaluate user satisfaction with the different elements of the system. The results showed that both the usability of and satisfaction with the affective emotional tutoring system were high. The emotional feedback mechanism of the system can help learners turn negative emotions into positive ones.
1. Introduction
1.1. Research Background and Motivation
Online learning can help students flourish due to its advantages, its sustainable development, and the high utilization rate of mobile phones. With advances in mobile technology, mobile devices such as cellphones and tablets have become indispensable in daily life. In the field of education, emphasis is increasingly being placed on mobile learning systems that integrate mobile technology into the teaching environment [1,2,3,4]. Mobile learning has several advantages facilitating the sustainable development of education, including convenience, flexibility, repetition, a low threshold, high teaching resources, and autonomous learning [5]. A system capable of reacting to physiological and psychological changes in students, to reduce negative feelings during the learning process, would be highly beneficial.
Affective computing involves the use of sensors to monitor users’ emotional state, along with related physiological and psychological changes, allowing the system to respond appropriately [6]. The affective tutoring system (ATS) proposed by Kort [7] recognized, analyzed, and provided feedback throughout the learning process, thus establishing an intelligent tutoring system (ITS) that could be combined with affective computing. Recognition of user emotions and corresponding system responses, as well as guidance from the “emotional agent” on how to maintain positive emotions, facilitated learning goals [8,9,10,11]. Therefore, interactive mobile learning systems using mobile devices and affective computing can help learners achieve their learning goals.
1.2. Research Purpose
This study established an affective emotional tutoring system which combined mobile devices with the technique of affective computing. Subjects input the sentences. The Chinese semantic emotional system recognized subjects’ emotions which were expressed in the learning process and provided appropriate feedback to learners to enhance learners’ learning interests. When the system received users’ negative emotions, it would feed positive emotions back correspondingly to guide users to turn negative emotion into positive emotion in the learning process. According to system flow, this study would be divided into three points: (1) Recognition of subjects’ emotions. (2) Record history of learners’ emotional state. (3) Feedback mechanism of interactive agent with high interactivity.
This study used the affective emotional tutoring system to explore whether the system could bring the influence of positive emotion to learners. The research questions are below.
- How do learners feel about the usability of the affective emotional tutoring system which is established on mobile devices?
- How satisfied are subjects with the interaction of the affective emotional tutoring system?
2. Literature Review
2.1. Mobile Learning
As mobile devices are becoming more and more popular, besides the usage in daily life, the property of being unlimited by time and space causes mobile learning to become an important issue in the field of education. Mobile learning is to conduct e-learning through assistive devices, such as a personal digital assistant (PDA), mobile phone, portable notebook, tablet, and so on, which displays learning content and provides the wireless communication channel of bilateral interaction for instructors and learners [12,13]. Mobile devices are taken as the assistive tool of e-learning materials in mobile learning. Learners could learn in any time and place, as if creating a new learning environment and recording the whole process of learning [14,15].
The range of research on mobile learning is wide. For example, the interactive English learning system designed by Hung and Young [1] for six graders integrated the advantage of wireless handheld devices to lead learners to better immersion and interactivity. Due to the urban–rural gap, there is an obvious difference between the educational environment of city and country. Researchers have made use of the property of mobile technology that being the fact it is unlimited by time and space to explore if mobile learning could connect the environment of city and country more closely. The research indicated that mobile learning could shorten the gap of education, and children from different social backgrounds could benefit a great deal [3]. In the research on higher education, Kumar and Bervell [4] took Google classroom as the tool of mobile learning to explore learners’ usage intentions. The research found that the factors which influenced learners to accept Google classroom were habit, hedonic motivation, and performance expectation.
2.2. Intelligent Agent
In 2012, Chen proposed that the basic features which an intelligent agent should possess were autonomous, interactive, and reactivity. Therefore, an intelligent agent is able to make a simple judgment and interact simply with learners. Norman [16] indicated that it was difficult to make a learner form a conceptual model without feedback from the system. Learners had obvious emotional ups and downs based on whether an intelligent agent existed or not. Simultaneously, learners could improve learning effectiveness through the interaction with an intelligent agent and maintain a positive mental state to cope with continuous learning through compassion and encouragement of the agent. The function of an intelligent agent could influence students’ emotions on learning, guide learning, and detect their learning situation [17]. The research also showed that through the operation of an intelligent agent, it was able to strengthen learning motivation, learning interest, and learning attitude, leading to the improvement of learning effectiveness [18]. Mao [8] put forward a digital learning system which had an emotional agent. The emotional agent analyzed users’ emotions through the function of facial recognition, speech recognition, and character recognition to guide them to learn.
2.3. Emotional Tutoring System
In the process of learning, learners’ emotional change would influence learning behavior and even learning effectiveness. Emotion triggers diverse mental process in individuals due to specific external stimulus and generates continuous change as time goes on [19,20]. Through affective computing, an inanimate machine could analyze a human’s emotional message and feed corresponding results back. Picard [21], who is the representative person for affective computing, proposed the idea of affective computing and explained that related research on emotion and computers was divided into four directions, including emotion recognition, emotion expression, having emotions, and emotional intelligence. So far, affective computing has gradually attracted attention. Scholars carried out research through ontology to predict students’ emotions that were generated in the process of learning and pointed out that positive emotions allow it to go smoothly [22]. Through computer analysis, intelligent tutoring systems (ITS) let subjects learn in individualized courses and provide feedback to users immediately [6]. Much research related to emotional tutoring systems has indicated that system interfaces had positive emotional relevance to learners and could improve learning effectiveness [8,9,10,11,23].
Emotion classification is a basic issue in affective computing. There are two main classification methods: one is discrete categories, and the other is continuous vector space [21]. In discrete categories, Ekman, Friesen, and Ellsworth [24] defined six expressions of human faces based on facial muscles and facial features: happiness, anger, sadness, surprise, disgust, and fear. Metri, Ghropade, and Butalia [25] used Ekman’s FACS feature regulations to develop the Facial Expression Recognition System (FERS). In terms of the state of learning, learning emotions are divided into eight types, which include: pleasure, hope, pride, anger, anxiety, shame, hopelessness, and boredom. Positive emotions in learning (pleasure, hope, etc.) and negative emotions in learning (anger, anxiety, etc.) are all multiple emotions that will be experienced in learning [26]. In the emotion classification of continuous vector space, the most common one is James Russell’s Circumplex Model [27,28]. In this classification method, emotions are divided into two axes, “Arousal” and “Valence”, to form all possible emotions. The various discrete categories mentioned above are located in the quadrants formed by the two axes. The PAD three-dimensional emotional model is proposed by Mehrabian and Russell [29] based on environmental psychology and is mainly used to describe and quantify emotional states. Among them, the degree of pleasure (displeasure–pleasure) represents the positive and negative degree of the individual; the degree of arousal (nonarousal–arousal) represents the physiological arousal state of the individual; the degree of submissiveness (submissiveness–dominance) represents the degree of personal dominance over others; and the values of each degree are between from −1 to 1, so that the researcher can clearly define different emotions by the numerical value of the three dimensions. Most of the past studies only focused on the degree of pleasure and the degree of arousal, but some emotions cannot be effectively distinguished using two dimensions (such as fear and anger), so the degree of strength plays a very important role in the PAD three-dimensional emotional model. More advanced, Mendez-Alegria, Y. et al. [30] demonstrated the Wheel of Emotions of Geneva + instrument, which aims to evaluate the emotional state of the user during the execution of tasks in the interactive system. In this method, the author takes “Pleasant” and “Control” as the two axes and forms four facets: satisfied, dissatisfied, enthusiastic, and unenthusiastic. The above-mentioned various discrete categories are located in these four facets [30,31,32,33]. In this study, in order to comply with Figure 1, the process chart of emotional feedback guiding, a relatively simple emotion classification method is adopted, and we only divide it into positive and negative emotions. The decision tree composed of these two emotions constitutes the design of each emotion feedback. Judgment of affective factors can help learning. The system obtains learners’ emotions through facial and semantic emotion recognition, and guides learners to continue teaching activities with positive emotions through interactive agents. The research results show that the assistance of interactive agents can increase learning motivation [34,35,36]. In Figure 1, the system interface is three-column web page layout. The left side is course menu, the center is course information, and the right side is the control button of emotional agent interaction area and the questionnaire link area. The system displays the interactive learning question and learners can input the feedback in the emotional agent interactive area.
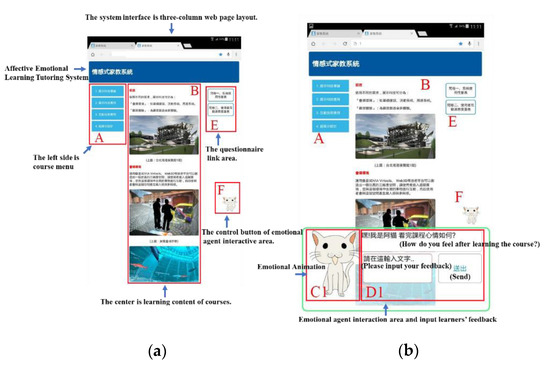
Figure 1.
System interface. (a) Three-column web page layout. (b) Emotional agent interactive area and input learners’ feedback.
3. Methods
The 62 students participated in an interactive technology course. The description of the experimental process was announced on the course. Students with the willingness to participate in the experiment and contacted us. The 62 participants were students from a university in Taiwan, including 33 males and 29 females. The participating students come from two classes in the same school and the same department, taking the same subject, “Interactive Design”. The experimental materials watched by the 62 students were all the same. The main content is interactive technology such as technological art, interactive vision, digital performing arts, wearable devices, light sculpture projection, network media, etc., combined with related online videos on Youtube to increase course richness. They operated the affective emotional tutoring system on tablets in a networked environment. The course was designed such that the subjects could interact freely with the affective emotional agent while they learned. The subjects use the affective emotional tutoring system while learning the content of the interactive technology course in the experimental period, after which the subjects completed a questionnaire regarding system usability and satisfactoriness. They interacted with the emotional agent through a user-operated floating frame. The system interface had a three-column web page layout with the course menu on the left, course information in the center, and emotional agent interaction area and questionnaire on the right.
3.1. Interface Design
The experimental devices were tablets. The function of interacting with the emotional agent was independent, which provided a floating frame for the user to operate. The system interface was a three-column web page layout. The left side was course menu, the center was course information, and the right side was emotional agent interaction area and questionnaire area.
As Figure 1a shows, area A was the course menu; area B was the content of the course; area E was the questionnaire; and area F was the control button of the agent. As Figure 1b shows, when users pushed the button of the agent, it would show area C1 of emotional agent and area D1 of Chinese semantic interaction. Area F was the control switch to show or hide area C1 and area D1 to learn the course, which was in a translucent frame to avoid crowding the page and influencing the learning of the course.
3.2. Course Model
The content of the teaching material in this experiment was interactive technology. The main courses were interactive technology such as wearable devices, projection mapping, and so on, which combined online videos related to interactive technology on Youtube to make the courses rich in content. Subjects watched the course for 5 to 10 min, which included online teaching materials and different learning units.
3.3. Emotional Feedback Guiding Model
Through affective computing, the emotional tutoring system judged users’ emotions and provided feedback via the emotional agent to achieve real-time interaction with users. By analyzing users’ positive or negative emotions, the final goal of affective computing was to maintain users’ positive emotions and guide negative emotion to positive emotion by the emotional feedback model.
This study designed different response models for the emotional feedback guiding model. The system could recognize users’ emotions and give a response of positive emotion, negative emotion, no emotion, or unrecognized. Later, it would show 150 related questions to positive and negative emotion in the text response area to maintain users’ positive emotions and guide negative emotion to positive emotion.
The process of the emotional feedback guiding model was that users answered the first preset emotional question in the course by inputting text, then the system recognized positive or negative emotion in the statement and fed the result of the change of the interactive emotional agent’s emotion and text recognition back to the user. When the result of the recognition was completed, if it presented positive emotion, the system would redisplay related questions to positive emotion for users to answer after 3 s and recognize emotion continuously to guide users to maintain positive emotions. The system continued to guide emotion until there appeared a positive tone or users ended up emotional recognizing themselves. If the system recognized that users had negative emotions, it would show related questions to positive emotion, and guide users to think about things related to positive emotion in order to turn their emotions from negative to positive. Figure 2 was the process chart of emotional feedback guiding.
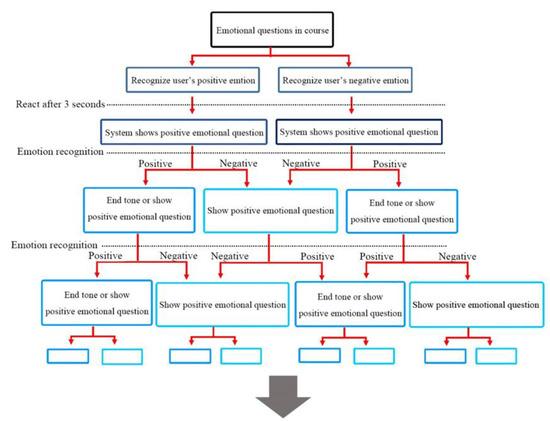
Figure 2.
The process chart of emotional feedback guiding.
3.4. Agent Model
The virtual agent could influence learners’ learning emotion, sensed subjects’ learning situation, and give corresponding emotional guidance. Therefore, this system set up the emotional agent as a bridge between learners and the system. In course, users input emotional sentences for the system to recognize. The system would feed corresponding sentences back and change the icon of the agent to strengthen users’ willing to operate. For example, when the system recognized positive emotion in learners’ sentences, the emotional agent would show motion graphics of positive emotion. On the contrary, when the system recognized negative emotion in learners’ sentences, the emotional agent would show motion graphics of negative emotion. If the sentence did not include emotional key words or the system could not recognize the input sentence, it would show image feedback of no emotion or being confused. Figure 3 below is the icon of the emotional agent’s positive and negative emotions.
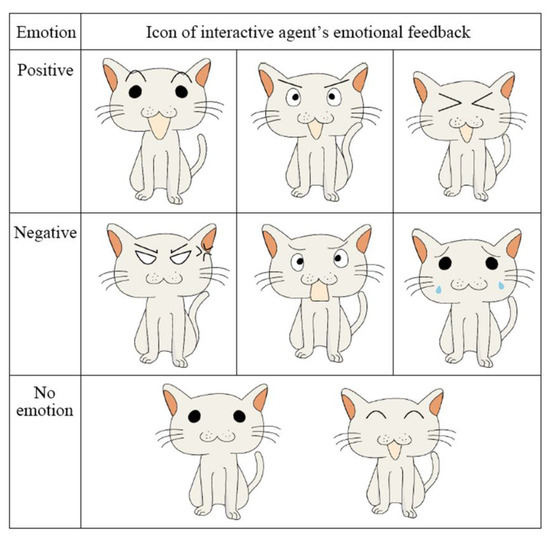
Figure 3.
The icon of the emotional agent’s positive and negative emotions.
4. Data Analysis and Results
4.1. Experimental Data Collection and Analysis
Users’ Emotional Data Collection
In the experiment of users testing the emotional semantic recognition of the system, subjects’ emotional data that the system collected were 363 messages in total, as Table 1 shows.

Table 1.
Users’ emotional data.
In the process of the experiment, since there was no limited range of sentences that users and the interactive agent could input, the system could not recognize some words. Table 1 is sorting data of users’ emotion. There were 189 pieces of data where users input positive emotional words, which accounted for 52% of all emotional data. There were 69 pieces of the data where users input negative emotional words, which accounted for 19% of all emotional data. For the unidentified words that the system could not recognize, there were 36 no emotion words, which accounted for 10% of all emotional data. There were 25 related words to the English alphabet, which accounted for 10% of all emotional data. There were 22 number and punctuation marks, which accounted for 6% of all emotional data.
4.2. System Usability Analysis
In order to analyze users’ usability of the system, this study conducted a statistical analysis through collecting a system usability scale that was filled out by the subjects. There were 62 subjects in total. However, there were two subjects who did not fill out the scale, which were determined as invalid scales.
4.2.1. System Usability Scale—Reliability Analysis
Reliability analysis of the system usability scale is as shown in Table 2. The higher Cronbach’s Alpha, the higher the reliability of the scale. The minimum acceptable reliability is Cronbach’s Alpha > 0.7 [37]. Cronbach’s Alpha of this scale was 0.809, higher than 0.7, which represented that there was high reliability of internal consistency in this scale.
Table 2.
Reliability analysis of system usability scale.
4.2.2. System Usability Scale—Descriptive Statistics
The statistical result of scores of every question in system usability scale is as Table 3, which showed that subjects’ feeling on using the system was 71.9%. Table 3 below is the statistical result of every question.
Table 3.
Descriptive statistics of system usability scale.
The sum of the highest and the second highest percentage of each question in the 5-point Likert scale represented Agree; the third highest percentage of each question in the 5-point Likert scale represented Neutral; and the sum of the lowest and the second lowest percentage of each question in the 5-point Likert scale represented Disagree. The analysis result is as below. For Q1, 40% of the subjects thought that they would often use the system; 45% of the subjects chose neutral; and 15% of the subjects disagreed. For Q2, 76.8% of the subjects thought that the system was not complicated; 18.3% of the subjects chose neutral; and only 5% of the subjects thought that the system was too complicated. For Q3, 88.3% of the subjects thought that the system was easy to use; 10% of the subjects chose neutral; and only 1.7% of the subjects disagreed. For Q4, 63.4% of the subjects thought that they did not need a technician’s help to use the system; 26.7% of the subjects chose neutral; and 10% of the subjects needed a technician’s help. For Q5, 50% of the subjects thought that all functions of the system were integrated well; 40% of the subjects chose neutral; and 10% of the subjects disagreed. For Q6, 58.4% of the subjects thought that there was not too much contradiction in the system; 26.7% of the subjects chose neutral; and 11.7% of the subjects thought that the system was contradictory. For Q7, 88.3% of the subjects thought that they could learn how to use the system fast; 11.7% of the subjects chose neutral. For Q8, 93.3% of the subjects thought that the system was not very difficult to use; only 6.7% of the subjects chose neutral. For Q9, 85% of the subjects thought that they were confident in using the system; 13.3% of the subjects chose neutral; and only 1.7% of the subjects disagreed. For Q10, 75% of the subjects thought that they did not have to learn other skills to use the system; 18.3% of the subjects chose neutral; and only 6.7% of the subjects thought that they had to learn other skills to use the system.
4.3. User Interaction Satisfaction Analysis
In order to analyze subjects’ interaction satisfaction on the usability of the system, the study collected the questionnaire for user interaction satisfaction that was filled out by the subjects. There were 62 subjects participating. Among them, there were two subjects who did not fill out the questionnaire, which were determined as invalid questionnaires.
4.3.1. Questionnaire for User Interaction Satisfaction Analysis—Reliability Analysis
Reliability analysis of system usability scale is as shown in Table 4. The higher Cronbach’s Alpha, the higher the reliability of the scale. Cronbach’s Alpha value of this scale was 0.809. The minimum acceptable reliability is Cronbach’s Alpha > 0.7 [37]. Cronbach’s Alpha of this scale was 0.941, higher than 0.7, which represented that there was high reliability of internal consistency in this scale.
Table 4.
Reliability analysis of questionnaire for user interaction satisfaction.
4.3.2. Questionnaire for User Interaction Satisfaction Analysis—Descriptive Statistics
The study analyzed the six dimensions of the questionnaire for user interaction satisfaction, including overall using reaction, screen presentation, terms and system information, learning factor, system performance, and availability and user interface. Percentages of five points to seven points in the 7-point Likert scale were added up as positive scores. The description of the results is below, as shown in Table 5.
Table 5.
Descriptive statistics of the questionnaire for user interaction satisfaction.
- 1.
- Overall using reaction
In Q1, 78.4% of the subjects considered that overall using reaction was good. In Q2, 90% of the subjects considered that overall using reaction was easy. In Q3, 79.9% of the subjects considered that overall using reaction was satisfactory. In Q4, 63.3% of the subjects considered that overall using reaction was high-efficient. In Q5, 70% of the subjects considered that overall using reaction was interesting. In Q6, 76.7% of the subjects considered that overall using reaction was flexible.
- 2.
- Screen presentation
In Q7, up to 88.3% of the subjects considered that the text on the screen of the system was easy to read. In Q8, up to 88.3% of the subjects considered that the message presentation on the screen of the system was helpful. In Q9, up to 90.1% of the subjects considered that overall planning of the system screen was clear. In Q10, up to 86.7% of the subjects considered that the presented style of the system screen was clear.
- 3.
- Terms and system information
In Q11, up to 85.1% of the subjects considered that the technical terms that the system used possessed consistency. In Q12, up to 75% of the subjects considered that the described position on the system screen was consistent. In Q13, up to 91.6% of the subjects considered that the prompt message on system screen was very clear. In Q14, up to 90% of the subjects considered that the prompt message on system screen was very clear. In Q15, up to 76.7% of the subjects considered that the message in which the system noticed users was consistent with actual operation. In Q16, up to 60% of the subjects considered that the prompt message of error could help improve operational problems.
- 4.
- Learning factor
In Q17, up to 98.3% of the subjects considered the system easy to use. In Q18, 83.4% of the subjects considered that they could learn new functions through trying to explore. In Q19, only 93.4% of the subjects considered that the name and the use of commands were easy to remember. In Q20, up to 96.7% of the subjects considered that the execution of tasks was easy to understand. In Q21, up to 81.6% of the subjects considered that the explanatory message on the screen was helpful.
- 5.
- System performance
In Q22, 91.7% of the subjects considered that the execution speed of the system was fast enough. In Q23, 85% of the subjects considered that the system was reliable.
- 6.
- Availability and user interface
In Q24, 93.3% of the subjects considered that the color matching of the system was good. In Q25, 81.6% of the subjects considered that the information and feedback of the system was good. In Q26, 60% of the subjects considered that the response to errors of the system was good. In Q27, 66.7% of the subjects considered that the information of the system was enriched enough. In Q28, only 31.6% of the subjects considered that the system was chaotic and that there was too much interference in user interface.
Then, this study analyzed the correlation of the six dimensions in the questionnaire for user interaction satisfaction. It used the Pearson correlation coefficient to analyze overall using reaction, screen presentation, terms and system information, learning factor, system performance, and availability and user interface.
Table 6 shows that the correlation coefficients of the six dimensions were all significant positive correlations. The highest correlation coefficient was screen presentation on terms and system information, which was 0.83. It represented that the better the screen presentation, the faster the user could get the hang of terms and system information. The lowest correlation coefficient was learning factor on overall using reaction, which was 0.31. On the whole, the system was highly satisfactory in user interaction satisfaction.
Table 6.
Correlation coefficient analysis of every dimension in user interaction satisfaction.
5. Discussion and Conclusions
This study established an interactive affective emotional tutoring system based on a web page for use with a mobile device. Real-time interaction of the user with the emotional agent provided emotional feedback and guidance. The system increased user interest in learning and provided a deeper learning experience. This study analyzed the usability of the system through the SUS and explored system satisfaction using the QUIS. The analysis showed that most users were satisfied with the usability of the system and considered it easy to operate. They learnt how to use the system quickly and could operate it confidently. Therefore, the interactive affective emotional tutoring system had good usability on a mobile device. The overall satisfaction of the learners was high. The users considered the system design to be clear and simple. Additionally, the learning process was engaging, which increased willingness to learn. Thus, this study certified the factors that influence learners’ continuous use of mobile devices in online education and benefit the sustainable future of mobile online learning in Taiwan.
Emotional balance represents an important state of mind. The balance means that there is a certain degree of constant energy in the human body, which tends to be evenly distributed. This volume represents the moderate tension in the human body, and the restoration to a moderate state represents balance. Many studies have included this dimension in the evaluation methods (such as questionnaires) to measure it [31,38] and although this study did not evaluate emotional balance, we try to achieve emotional balance through emotional feedback from the system. Norman [39,40] pointed out that for users to form a conceptual model, it is difficult to achieve it without systematic feedback. The user will have obvious emotional ups and downs due to the presence or absence of the intelligent agent. At the same time, the user can increase the efficiency of learning through interaction with the intelligent agent, and the more the agent’s compassionate and encouraging sentences can be used the more the mental state of the person remains positive and can cope with continuous learning. The function of intelligent agents can affect students’ learning emotions and can guide learning as well as detect students’ learning conditions [10,11]. An Affective Tutoring System (ATS) is a system that can provide users with appropriate teaching content through computer calculations and analysis and can directly give users instant feedback. The users give appropriate feedback, so the smart tutoring system has more advantages compared with traditional teaching [41,42].
We have made observations in the experiment and have the following findings: (1) Students from the field of science and engineering in high school have a higher acceptance of interactive technology. However, students from the humanities field in high school are more creative in design thinking. (2) Although boys have a high acceptance of interactive technology, girls show higher interest and curiosity in emerging technologies. (3) Since they come from the same experimental body and similar learning experience, we did not conduct sentiment analysis in terms of age, knowledge level, etc. (4) At present, only observation is used, and we expect to conduct quantitative analysis again. Regarding this part, we have added them into our future works.
6. Future Work
When faced with e-learning systems, the main task of users is to learn. This is a rather abstract process. Traditional user research focuses on objective parameters that are measurable and verifiable and ignores the hedonic component, and therefore cannot reflect the motivations of learners when using e-learning systems. Therefore, the evaluation expert user experience (UX) should significantly increase their efforts in such an environment when dealing with [31,32,33]. ISO/IEC 25010 provides a definition that is fully adapted to the user experience of human–machine systems, including computer systems in use and software products in use. In this standard, satisfaction is divided into four sub-features, which are designed to identify the needs of users when using the system in a specific use environment: utility, confidence, pleasure, and comfort. In the research of Aguirre, Villareal-Freire1, Gil, and Collazos [43], ISO/IEC 25010 was cleverly adopted to design the best UX experience evaluation method [31,32,33]. We will use this as a basis and explore UX evaluation in future research.
Author Contributions
Conceptualization, T.-H.W. and Y.-M.H.; methodology, T.-H.W. and H.-C.K.L.; software, H.-C.K.L.; formal analysis, T.-H.W. and W.-T.Y. writing—original draft preparation, T.-H.W., W.-T.Y. and H.-R.C.; writing—review and editing, T.-H.W., H.-R.C. and Y.-M.H.; funding acquisition, Y.-M.H. and C.-T.L.; data collection, T.-H.W. and W.-T.Y. All authors have read and agreed to the published version of the manuscript.
Funding
This research received no external funding.
Conflicts of Interest
The authors declare that the research was conducted in the absence of any commercial or financial relationships that could be construed as a potential conflict of interest.
References
- Hung, H.-C.; Young, S.S.-C. An Investigation of Game-Embedded Handheld Devices to Enhance English Learning. J. Educ. Comput. Res. 2015, 52, 548–567. [Google Scholar] [CrossRef]
- Khan, S.; Hwang, G.-J.; Azeem Abbas, M.; Rehman, A. Mitigating the Urban–Rural Educational Gap in Developing Countries through Mobile Technology-Supported Learning. Br. J. Educ. Technol. 2019, 50, 735–749. [Google Scholar] [CrossRef]
- Kumar, J.A.; Bervell, B. Google Classroom for Mobile Learning in Higher Education: Modelling the Initial Perceptions of Students. Educ. Inf. Technol. 2019, 24, 1793–1817. [Google Scholar] [CrossRef]
- Narayan, V.; Herrington, J.; Cochrane, T. Design Principles for Heutagogical Learning: Implementing Student-Determined Learning with Mobile and Social Media Tools. Australas. J. Educ. Technol. 2019, 35. [Google Scholar] [CrossRef]
- Li, Y.; Nishimura, N.; Yagami, H.; Park, H.-S. An Empirical Study on Online Learners’ Continuance Intentions in China. Sustainability 2021, 13, 889. [Google Scholar] [CrossRef]
- Hsu, K.-C.; Lin, K.H.-C.; Lin, I.-L.; Lin, J.-W. The Design and Evaluation of an Affective Tutoring System. J. Internet Technol. 2014, 15, 533–542. [Google Scholar]
- Kort, B.; Reilly, R.; Picard, R.W. An Affective Model of Interplay between Emotions and Learning: Reengineering Educational Pedagogy-Building a Learning Companion. In Proceedings of the IEEE International Conference on Advanced Learning Technologies, Madison, WI, USA, 6–8 August 2001; pp. 43–46. [Google Scholar]
- Mao, X.; Li, Z. Agent Based Affective Tutoring Systems: A Pilot Study. Comput. Educ. 2010, 55, 202–208. [Google Scholar] [CrossRef]
- Alepis, E.; Virvou, M. Automatic Generation of Emotions in Tutoring Agents for Affective E-Learning in Medical Education. Expert Syst. Appl. 2011, 38, 9840–9847. [Google Scholar] [CrossRef]
- Wang, C.-H.; Lin, H.-C.K. Constructing an Affective Tutoring System for Designing Course Learning and Evaluation. J. Educ. Comput. Res. 2018, 55, 1111–1128. [Google Scholar] [CrossRef]
- Mastorodimos, D.; Chatzichristofis, S.A. Studying Affective Tutoring Systems for Mathematical Concepts. J. Educ. Technol. Syst. 2019, 48, 14–50. [Google Scholar] [CrossRef]
- Topland, K.O. Mobile Learning: Technological Challenges on Multi-Channel e-Learning Services. Master’s Thesis, University of Agder, Kristiansand, Norway, 2002. [Google Scholar]
- Quinn, C. MLearning: Mobile, Wireless, in-Your-Pocket Learning. LiNE Zine 2000, 2006, 1–2. [Google Scholar]
- Lehner, F.; Nosekabel, H. The Role of Mobile Devices in E-Learning First Experiences with a Wireless E-Learning Environment. In Proceedings of the IEEE International Workshop on Wireless and Mobile Technologies in Education, Vaxjo, Sweden, 30 August 2002; pp. 103–106. [Google Scholar]
- Mikic, I.; Trivedi, M.; Hunter, E.; Cosman, P. Articulated body posture estimation from multi-camera voxel data. In Proceedings of the IEEE Computer Society Conference on Computer Vision and Pattern Recognition, Kauai, HI, USA, 8–14 December 2001. [Google Scholar]
- Norman, D. The Design of Future Things. Int. J. Hum. Comput. Interact. 2007, 24, 520–521. [Google Scholar]
- Wang, M. The Ability of College Students to Think Critically as Displayed in Online Discussion. Taiwan J. TESOL 2009, 6, 27–59. [Google Scholar]
- Chen, X.; Mitrovic, A.; Mathews, M. Investigating the Effect of Agency on Learning from Worked Examples, Erroneous Examples and Problem Solving. Int. J. Artif. Intell. Educ. 2019, 29, 396–424. [Google Scholar] [CrossRef]
- Lazarus, R.S.; Lazarus, R.S. Emotion and Adaptation; Oxford University Press: Oxford, UK, 1991. [Google Scholar]
- Schutz, P.A.; DeCuir, J.T. Inquiry on Emotions in Education. Educ. Psychol. 2002, 37, 125–134. [Google Scholar] [CrossRef]
- Picard, R.W. Future Affective Technology for Autism and Emotion Communication. Philos. Trans. R. Soc. B: Biol. Sci. 2009, 364, 3575–3584. [Google Scholar] [CrossRef]
- Eyharabide, V.; Amandi, A. Ontology-based user profile learning. Appl. Intell. 2012, 36, 857–869. [Google Scholar] [CrossRef]
- Moga, H.; Antonya, C.; Boboc, R.G. Affective Tutoring System Based on Extended Control-Value Emotional Agent and 3x5 RLO Matrix. Procedia-Soc. Behav. Sci. 2014, 141, 418–423. [Google Scholar] [CrossRef][Green Version]
- Ekman, P.; Friesen, W.V.; Ellsworth, P. Emotion in the Human Face; Elsevier: Amsterdam, The Netherlands, 1972. [Google Scholar]
- Metri, P.; Ghorpade, J.; Butalia, A. Facial Emotion Recognition Using Context Based Multimodal Approach, UNIR REVISTAS. Rev. IJIMAI 2011, 1, 1–15. [Google Scholar] [CrossRef]
- Pekrun, R.; Goetz, T.; Daniels, L.M.; Stupnisky, R.H.; Perry, R.P. Boredom in achievementsetting: Exploring control-value antecedents and performance outcomes of a neglected emotion. J. Educ. Psychol. 2010, 102, 531–549. [Google Scholar] [CrossRef]
- Russell, J.A. A circumplex model of affect. J. Personal. Soc. Psychol. 1980, 39, 1161–1178. [Google Scholar] [CrossRef]
- Russell, J.A. Core affect and the psychological construction of emotion. Psychol. Rev. 2003, 110, 145–172. [Google Scholar] [CrossRef]
- Mehrabian, A.; Russell, J.A. An. Approach to Environmental Psychology; The Massachusetts Institute of Technology: Cambridge, MA, USA, 1974; pp. 216–217. [Google Scholar]
- Mendez-Alegria, Y.; Collazos-Ordoñez, C.; Granollers, T.; Gil, R. Geneva Emotion Wheel +: User Emotions Assessment Instrument While Participating on Interactive Systems Evaluation. DYNA 2016, 91, 151–155. [Google Scholar]
- Al-Masri, A.R.I. Impulsive Buying Behavior and Its Relation to the Emotional Balance. Int. J. Psychol. Brain Sci. 2020, 5, 5–20. [Google Scholar] [CrossRef]
- Squires, D. Usability and educational software design: Special issue of interacting with computers. Interact. Comput. 1999, 11, 463–466. [Google Scholar] [CrossRef]
- Software Usability Measurement Inventory (SUMI). Human Factors Research Group, University College Cork (1993). Available online: http://sumi.uxp.ie (accessed on 22 January 2015).
- Lin, H.C.K.; Chen, N.S.; Sun, R.T.; Tsai, I.H. Usability of affective interfaces for a digital arts tutoring system. Behav. Inf. Technol. 2014, 33, 105–116. [Google Scholar] [CrossRef]
- Tsai, M.C.; Lin, H.C.K.; Lin, C. Usability Evaluation of the Game Based E-Book System on Natural Science Teaching System. In Proceedings of the International Conference on Innovative Technologies and Learning, Portoroz, Slovenia, 27–30 August 2018; pp. 463–472. [Google Scholar]
- Lin, H.-C.K.; Su, S.-H.; Chao, C.-J.; Hsieh, C.-Y.; Tsai, S.-C. Construction of a Multi-mode Affective Learning System: Using Affective Design as an Example. J. Educ. Technol. Soc. 2016, 19, 132–147. [Google Scholar]
- DeVellis, R.F. Scale Development: Theory and Applications; SAGE: New York, NY, USA, 2003. [Google Scholar]
- Lado, M.; Otero, I.; Jesús, F.S. Cognitive Reflection, Life Satisfaction, Emotional Balance and Job Performance. Psicothema 2021, 33, 118–124. [Google Scholar]
- Norman, D. The Design of Everyday Things: Revised and Expanded Edition 2013. Available online: http://books.google.com (accessed on 15 March 2021).
- Norman, D.; Euchner, J. Don Norman talks with Jim Euchner about the design of useful things, from everyday objects to autonomous vehicles. Res. Technol. Manag. 2016, 59, 15–20. [Google Scholar] [CrossRef]
- Anderson, J.R.; Corbett, A.T.; Koedinger, K.R.; Pelletier, R. Cognitive tutors: Lessons learned. J. Learn. Sci. 1995, 4, 167–207. [Google Scholar] [CrossRef]
- Sarrafzadeh, A.; Hosseini, H.G.; Fan, C.; Overmyer, S.P. Facial expression analysis for estimating learner’s emotional state in intelligent tutoring systems. In Proceedings of the IEEE International Conference on Advanced Learning Technologies, Athens, Greece, 9–11 July 2003; pp. 336–337. [Google Scholar]
- Aguirre, A.F.; Villareal-Freire, A.; Gil, R.; Collazos, C.A. Extending the Concept of User Satisfaction in E-Learning Systems from ISO/IEC 25010. Lect. Notes Comput. Sci. 2017, 10290, 167–179. [Google Scholar]
Publisher’s Note: MDPI stays neutral with regard to jurisdictional claims in published maps and institutional affiliations. |
© 2021 by the authors. Licensee MDPI, Basel, Switzerland. This article is an open access article distributed under the terms and conditions of the Creative Commons Attribution (CC BY) license (https://creativecommons.org/licenses/by/4.0/).