Abstract
Indoor air quality (IAQ) in educational buildings is a key element of the students’ well-being and academic performance. Window-opening behavior and air infiltration, generally used as the sole ventilation sources in existing educational buildings, often lead to unhealthy levels of indoor pollutants and energy waste. This paper evaluates the conditions of natural ventilation in classrooms in order to study how climate conditions affect energy waste. For that purpose, the impact of the air infiltration both on the IAQ and on the efficiency of the ventilation was evaluated in two university classrooms with natural ventilation in the Continental area of Spain. The research methodology was based on site sensors to analyze IAQ parameters such as CO2, Total Volatile Organic Compounds (TVOC), Particulate Matter (PM), and other climate parameters for a week during the cold season. Airtightness was then assessed within the classrooms and the close built environment by means of pressurization tests, and infiltration rates were estimated. The obtained results were used to set up a Computational Fluid Dynamics (CFD) model to evaluate the age of the local air and the ventilation efficiency value. The results revealed that ventilation cannot rely only on air infiltration, and, therefore, specific controlled ventilation strategies should be implemented to improve IAQ and to avoid excessive energy loss.
1. Introduction
Indoor air quality (IAQ) is essential to create healthy and comfortable spaces for users in which to carry out their daily activities, especially considering that people spend more than 90% of their time indoors [1]. There is a large volume of published studies describing the role of IAQ in the health of building users [2,3]. When the use of the building is academic, the importance of IAQ is higher because poor indoor air for long academic periods can have a negative impact on both the students’ health and intellectual performance [4,5].
The European ventilation standard (CEN) [6] establishes mechanical ventilation as the strategy to guarantee the minimum outdoor airflow to maintain adequate IAQ. In Spain, regulations established mandatory mechanical ventilation in educational buildings in 2007 [7]. A total of 90% of the compulsory educational buildings in Spain were built before 2007 when mechanical ventilation systems were not mandatory [8]. In the case of higher educational centers such as universities, the share of buildings constructed before ventilation systems were mandatory remains unknown. However, it could presumably be higher since they are often located in historical buildings. Therefore, educational buildings in Spain are mainly naturally ventilated. Ventilation (single-sided or cross ventilation) is only promoted by the occasional opening of windows when users consider it necessary, based on no objective IAQ indicator [9]. Thus, maintaining acceptable IAQ during the whole academic period remains a challenge [10]. This manual control of the openings is even more limited during the cold season since it causes uncomfortable airflows and a considerable drop in the classroom hygrothermal conditions.
In this scenario, air infiltration through cracks and other unintentional openings in the building envelope is the only mechanism that can provide the continuous renovation of the indoor air. For this reason, it is important to determine the airtightness of the building envelope, since it impacts directly on air infiltration, caused by pressures gradient [11].
This paper addresses the indoor conditions of a higher educational building with natural ventilation in the Continental climate area of Spain, considering different parameters such as temperature, relative humidity (RH), CO2, TVOC, and PM, assessing the ventilation performance through the analysis of the ventilation efficiency caused by air infiltration.
Background
In recent years, there has been an increasing amount of literature on indoor comfort in university buildings [12,13,14,15]. Although most of the previous research focuses only on IAQ, others have considered the Indoor Environmental Quality (IEQ), focusing also on physical parameters related to sound and visual comfort as well as user’s perception through questionnaires [16,17,18].
There is a wide range of airborne pollutants that can affect users inside buildings; among them is CO2, which is closely connected to human activity since it is mainly caused by users’ breath. Harmless as it may be considered, a high concentration of CO2 can have a negative impact on the attention of the students, hindering academic achievement [19]. It is important to highlight that CO2 concentration has been associated with the presence of other pollutants. Therefore, it is often considered as a good indicator of the air change capacity of the rooms and it is important to evaluate its performance avoiding unventilated areas. However, some sources warn that CO2 should not be considered as a unique IAQ indicator [20,21]. It has been suggested that other compounds such as particulate matter (PM) or total volatile organic compounds (TVOCs) should be also considered to assess IAQ [22].
Volatile organic compounds (VOCs) can be produced by the construction materials of the building, its furniture, as well as cleaning products and academic materials such as adhesives, paints, or office machinery [15]. Common sources of PM include human activity, the use of scholarly materials, or even the outdoor environment [23]. High concentrations of these pollutants can produce irritation of the mucous membranes, fatigue, headaches, or aggravation of asthma in the users, among others [24]. Previous research has suggested that TVOC concentration could be related to sick building syndrome (SBS) [25].
The relationship between airtightness and IAQ in educational buildings in Mediterranean countries with natural ventilation has already been addressed in previous research [9,26,27]. No direct relationship between airtightness and IAQ was found in a study that assessed 42 classrooms, especially if windows were open [9]. In this regard, previous research in southern European climates has revealed that air infiltration must be complemented with other ventilation mechanisms in order to maintain good IAQ [26,27].
However, air infiltration in buildings is usually not considered as part of the design of the ventilation system [1]. This causes a non-predictive air track model that entails an inhomogeneous air quality distribution through the indoor space, whose impact depends on the occupants’ location [28]. The distribution of the air quality can be evaluated by assessing the ventilation efficiency and age of the air [29], which can be modeled by knowing the air infiltration rate and the position of the air leakage paths using Computational Fluid Dynamics (CFD) software. Yet the existing literature has overlooked this approach, which relates air infiltration, the efficiency of ventilation, and IAQ to verify the suitability of air leakages as a ventilation source.
2. Materials and Methods
2.1. Site and Building
Two classrooms of the Campus “Duques de Soria” (Universidad de Valladolid), built in 2006, were assessed. The campus is located in a suburban area of Soria (Spain), which has a temperate climate type “Cfb” in the Köppen-Geiger classification. The summer is short and hot, and the winter is cold, long, and windy, both seasons being very dry. The average temperature during the summer is 23 °C and 10 °C during the winter. The wind has a predominant direction west–north–west, and its annual mean velocity is 10.8 km/h (type 2 in the Beaufort scale [30]).
The envelope of the building where the classrooms under study are located is made of sandstone boards that are fixed to 11.5 cm of perforated brick, thermal insulation of extruded polyethene, vertical air chamber, and an interior layer of 11.5 cm of double-hollow brick. The windows are made of aluminum profiles with double glazing. Rolling shutters, a typical mechanism used in Spain to provide shadow and protection, are built within a non-integrated box over the windows. The classrooms have a false ceiling 70 cm high made of acoustic panels of rigid plaster. The heating system has hot water radiators made of aluminum as terminal units.
For the purpose of the study, the most unfavorable classrooms of the building in terms of IAQ based on its configuration and use were determined. To that end, the type of ventilation, occupancy, volume, orientation, and nearby environment were considered. Concerning ventilation, all the classrooms of the building had natural ventilation, which is considered the most unfavorable scenario. The determination of the classrooms with higher levels of occupation over time was done according to the classrooms’ lesson schedules, considering the number of students and the classroom’s volume. Also, classrooms located near the car park were chosen due to the possible negative impact of vehicles on the outdoor air conditions. Orientation was considered, given its relationship with indoor temperature, because the heating system was homogeneously designed. Classrooms with the main façade facing south were expected to reach higher indoor temperatures and, therefore, have poorer conditions regarding IAQ. In this sense, it was first taken into account that high temperatures favor chemical reactions that lead to the production of certain pollutants such as VOCs or microorganisms [31]. Secondly, lower infiltration rates were expected as a result of a lower temperature gradient, causing a reduction of the stack effect [32] in these classrooms during the cold season.
After the analysis of the aforementioned parameters, it was determined that the block of classrooms A04 and A05 was the most unfavorable of the campus, with the following characteristics (Table 1 and Figure 1).

Table 1.
Classroom characteristics.
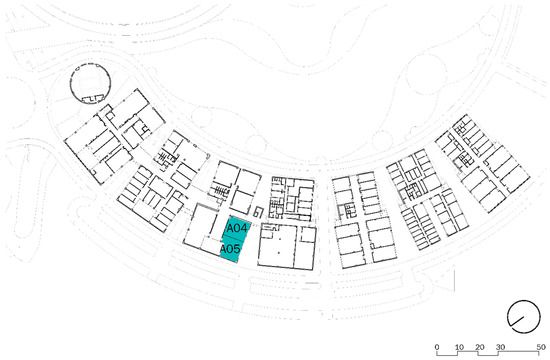
Figure 1.
Location of classrooms A04 and A05 within the building.
2.2. IAQ Equipment and Parameters
Air quality measurement stations were used to register variations in the levels of different air contaminants that are usually present in the air (CO2, TVOC, and PM1.0, PM2.5, and PM10.0). These parameters were chosen as indicators because of their presence in educational environments and their influence on the students [22]. Each device registered temperature, Relative Humidity (RH), and barometric pressure as well, saving all the information in the data logger of the station.
The devices integrated different sensors to determine the level of each parameter. Model K30 10,000 ppm was used to measure CO2, with a margin of error of ±30 ppm/±3% of the measured value. TVOC concentration was measured with an iAQ-Core Indoor Air Quality Sensor Module device, whereas PM was measured with a Digital Universal particle concentration sensor PMS5003 with a margin of error of ±10%. The temperature and RH sensor SHT2x had a margin of error of ±0.3 °C and ±1.8% RH.
Concerning the temperature and RH analysis, the ranges specified by Spanish regulations (RITE [33]) for the cold season were taken into account: temperature between 21 and 23 °C, and RH between 40 and 50%.
The CO2 analysis was done considering the values established in the Spanish regulations [33] as well. This regulatory framework establishes CO2 as an indicator of the human bio-effluent emissions, used to set the minimum ventilation airflow needed. RITE defines classrooms as places where good IAQ is needed and fixes a maximum corrected concentration of 500 ppm above the CO2 concentration in the outdoor air to reach acceptable conditions. Therefore, the corrected concentration is obtained by deducting the average CO2 concentration outdoors from the values registered inside the building. However, no consideration is made concerning TVOC or PM concentration by RITE. An acceptable range of up 500 ppb of TVOC concentration within the classroom environment was considered, according to several sources and recommendations [22,34,35]. In the case of PM, the maximum concentrations of PM2.5 and PM10.0 were set at 25 and 50 µg/m3, respectively [36].
2.3. IAQ Monitoring
Measurements were carried out between February and March for a week. The data collection was done simultaneously in classrooms A04, A05, the adjacent corridor, and the exterior of the building. Measurements were taken for approximately 5 s every minute during the whole academic period, although the subsequent analysis of the data focused on times when evidence of occupation in the classroom was found, which corresponds to the highlighted parts of the schedule: this was 21 h in classroom A04 and 28 h in classroom A05 (Figure 2).
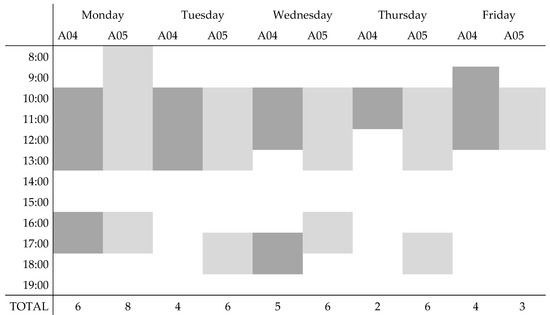
Figure 2.
Classroom schedule.
The location of the devices inside the classrooms was determined to avoid distortions: separated from the usual traffic areas of the students and the teacher, and one meter away from doors or windows. The devices were fixed to the wall 1.2 m above the floor so that the samples were taken at the height of the breathing zone of a seated person. Two devices were installed in both classrooms to guarantee data collection during the test.
The device in the corridor was fixed to the wall where the entrances to the classrooms were located. It was positioned more than one meter away from both doors, far from the waiting zones, and 2.5 m high to assure its security, while possible distortions caused by users’ activity were avoided. The specific location of each device can be seen in Figure 3 and Figure 4.
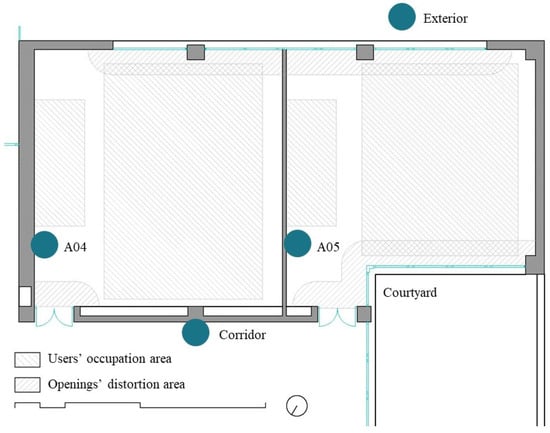
Figure 3.
Locations of the measurement devices during the test.
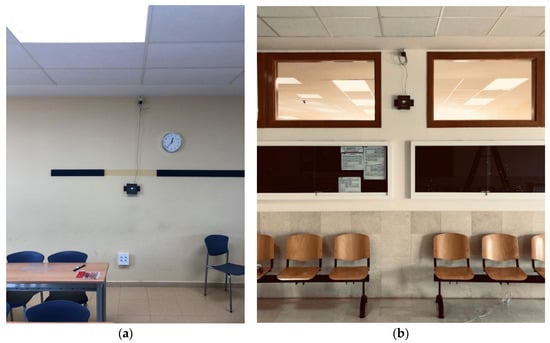
Figure 4.
Locations of the measurement devices in (a) A04, (b) corridor.
The measurement devices inside the building were fixed to the wall using a plastic casing made of polylactide (PLA) in 3D printing. The device used to measure the outdoor conditions was placed on the roof of the building using a support that raised it 0.5 m from the deck. It was protected from weather conditions with a perforated casing, so air circulation was enabled.
The students, teachers, and administrative staff were only informed about the general functioning of the devices and were asked to stay away from them to avoid distortions. In this way, users’ behavior was not conditioned concerning ventilation performance in order to maintain normal operational conditions.
2.4. Airtightness and Air Infiltration
Pressurization tests were performed in classrooms A04 and A05 according to ISO 9972 [37] in order to assess the airtightness of the building envelope that allows infiltration airflows. Indications described for Method 2, which tested the airtightness of the building envelope, were followed. For this purpose, only windows and doors were closed since the classrooms had no other kind of intentional openings or air conditioning system. Semi-automatic tests were carried out generating both an overpressure and a depression in the spaces to be tested. The air change rate (n50), the air permeability rate (q50), and the pressure exponent n, which can be considered as an indicator of the airflow regime, were obtained from the power law equation [38]. The correct calibration of the equipment was ensured to maintain accuracy specifications of 1% of sampling, or 0.15 Pa.
To characterize both the global airtightness and interzonal leakages, three tests were performed for each classroom: individual classroom test (A04 and A05), guard-zone pressure test (simultaneously pressurizing the upper classroom, 1.04 and 1.05), and guard-zone test (simultaneously pressurizing the adjacent classroom). Airflow rates of the guard-zone tests were deducted from those of the single-unit test in order to determine the proportion of leakages between classrooms. However, it was not possible to carry out guard-zone tests in circulation areas due to technical limitations. Consequently, the rate of air leakage of the external envelope and walls in contact with circulation areas could not be discriminated.
Air infiltration under natural conditions was estimated from the airtightness results using a simplified model [39] that assumed a linear relationship between the air change rate at 50 Pa (n50) and the mean annual air change rate (ACH). The model was adapted to the climate characteristics of the location under study and building parameters. Interzonal leakages were considered negligible due to similar pressure and temperature conditions and taking into account that interzonal airflows cannot be considered a contribution to ventilation.
2.5. Ventilation Efficiency
The ventilation efficiency of classroom A04 was analyzed using CFD software Ansys Fluent 19.0. The evaluation of the ventilation efficiency encompasses the age of the air of the masses that move around the space, identifying air stagnation areas within the room. The air inside a building is progressively polluted from its inlet to its exhaust as a consequence of different sources such as occupants’ breathing, furniture, equipment, or other pollutants emissions.
The method used to obtain the values of the mean age of the air and the local age of the air in the exhaust surface was defined by [40,41]. The ventilation efficiency ε was obtained from the relationship between both values [42] (Equation (1)).
The isothermal model used for this purpose was preprocessed using the parameters described in Table 2. The obtained mesh had a skewness of over 90%.
Table 2.
Mesh parameters.
Reynolds-averaged Navier Stokes (RANS) equations [43] were applied to simulate the airflow and air mass movement along the classroom. The numerical simulation was carried out in a four-stage approximation, using the k-ε equations with Standard Wall Treatment proceeding, Renormalization Group (RNG) with standard and near wall approximation, and Realizable with Enhanced Wall Treatment. Each step was accepted after convergence criteria of 10−4 for air velocity, momentum and turbulence parameters (k-ε). The values of the local age of the air were also obtained by applying the physics related to the characterization of the model through User Defined Functions (UDFs). Convergence criteria for the age-of-the-air value defined by the UDF was fixed under 10−5. The final simulation took approximately 18,000 iterative cycles. The isothermal setting accuracy had been previously validated [44].
Boundary conditions of the model were defined according to the built model. Walls, ceiling, and floor were defined as ideally airtight boundaries, while envelope window perimeters were defined as velocity inlet and the gap under the door as pressure outlet. Velocity inlet boundary type was set up as a vectorial air velocity, including a maximum turbulence distortion length of 14 mm according to the gap.
The airflow consigned to the classroom was obtained from the annual air change rate estimated from the airtightness tests results, excluding interzonal leakages. The air inlets were located along the envelope window perimeters, according to leakage identification through thermal imaging. The openings (windows and doors) of the classrooms were assumed to be closed, and all the architectural elements (leakage paths, materials, and envelope) were assumed the most unfavorable conditions.
3. Results
3.1. IAQ Results
The average IAQ values registered in both classrooms during the occupied period are shown in Table 3.
Table 3.
Average values of Indoor Air Quality (IAQ) parameters.
A relationship between the increase in the levels of pollutants and occupation in the classrooms during teaching hours can be observed, especially concerning CO2 and TVOC concentration. The temperature also increased slightly when the classrooms were occupied.
The average temperature was 23.4 and 22.6 °C for classrooms A04 and A05, respectively. In the case of classroom A05, the temperature was within the range set by RITE [33]. The scenario was different in classroom A04, where the average temperature was above the limit value. Temperatures were under 21 °C for less than 1% of the whole time in the case of classroom A04 and 22% of the time in classroom A05. The maximum temperature limit was exceeded for 74.5% of the time in classroom A04, and 22% in classroom A05.
In the case of RH, the average values registered during the week were 40.5% for classroom A04 and 42.9% for classroom A05. RH was under the optimal range [33] for 53% of the time when classroom A04 was occupied and 26% in the case of classroom A05. The limits were exceeded less than 1% of the time in the case of classroom A04 and 12% in classroom A05.
The CO2 concentration outside the building was between 369 and 441 ppm, and the average concentration throughout the week was 386 ppm. In order to obtain a more accurate CO2 correction, the CO2 average per day was used. The average CO2 concentration registered in the corridor was 608 ppm. Users’ behavior regarding the opening of both doors and windows can be observed in the results since it caused the decrease of the concentration of the pollutants even when the classroom was occupied. It was possible to observe this reduction or stabilization even during the breaks between lessons.
The average values of CO2 corrected concentration were 1017 ppm in the case of classroom A04 and 1328 ppm in classroom A05, although Spanish regulations set a maximum value of 500 ppm [33]. This means that the values exceeded the maximum limit for 88% of the time in classroom A04 and 74% in the case of A05. Values that doubled the maximum allowed limits were reached 62% of the time, reaching even four times above the limits for 25% of the time that the students were inside classroom A05. The highest value registered during the week was on Wednesday in classroom A05 at 11:50, only two hours after the beginning of the classes, when the CO2 corrected concentration was 2871 ppm.
The values registered in the case of PM were not significant. The mean concentration of PM1.0, PM2.5, and PM10.0 was below 7 µg/m3 in both classrooms during the whole duration of the measurements when the classrooms were occupied. However, it should be highlighted that PM levels registered outdoors were slightly higher than indoors, likely motivated by other activities surrounding the building, such as a construction site. The peak values registered outside the building, especially on Friday, had an impact on the registered PM results inside the classrooms, which were in any case within acceptable ranges.
The average values registered in the case of TVOC concentration were 540 and 562 ppb in classrooms A04 and A05, respectively. During the teaching period, the concentration of this pollutant was over 500 ppb 64% of the time in classroom A04 and 57% in classroom A05. The highest values registered were 973 ppb in classroom A04 and 1044 ppb in classroom A05, both registered on Monday.
3.2. Airtightness and Air Infiltration Results
The airtightness results obtained for the individual classroom tests (A04 and A05), guard-zone tests with the adjacent classroom (A04-A05 and A05-A04), and guard-zone tests with the upper classroom (A04-1.04 and A05-1.05) are shown in Table 4. Blank values are results discarded due to invalid tests that did not comply with the measurement standard.
Table 4.
Pressurization tests results.
In the individual tests carried out in each classroom, the average air change rate at a reference pressure of 50 Pa () obtained in classroom A04 was 19.7 h−1, while in classroom A05 it was considerably higher: 27.4 h−1. The dispersion of the results obtained at depression and overpressure should be highlighted. Additionally, great variability of the pressure exponent n could be observed (between 0.64 and 0.86).
Results regarding the interzonal airflow rates obtained from the guard-zone pressurization tests are shown in Table 5.
Table 5.
Guard-zone pressurization results.
The proportion of the infiltration rate at 50 Pa between classrooms A04 and A05 was between 53.5 and 63.8%. In the case of interzonal infiltration between the classrooms under study and the upper floor classrooms, the proportion seemed to be significantly reduced to an average of 1%. Therefore, the infiltration rate between adjacent classrooms represented up to 65.3% of the total air infiltration.
The air change rate under natural pressure conditions [h−1] due to air infiltration obtained, excluding infiltration between classrooms, was 0.44 h−1 in classroom A04 and 0.49 h−1 in classroom A05.
Thermal images taken during the depressurization stage of the airtightness test were used to locate air leakage paths of the building envelope (Figure 5). Air infiltration was identified in the perimeter of exterior windows, especially in rolling-shutter boxes and joint window–wall. In view of the numerical results obtained, air leakage paths were also expected to be found around interior windows. However, this kind of leakage could not be thermally identified given the lack of temperature gradient.
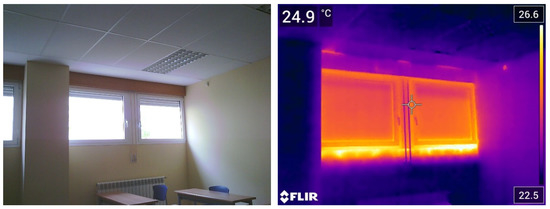
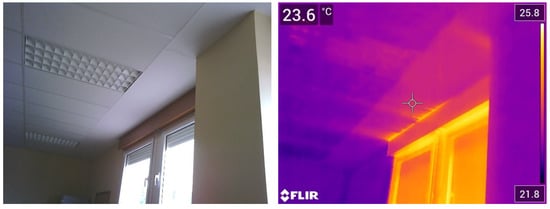
Figure 5.
Air leakage paths in classroom A04 via infrared images.
3.3. Ventilation Efficiency Results
The ventilation efficiency for classroom A04 was assessed by means of CFD simulation of the isothermal model considering the estimated annual air change rate obtained (0.44 h−1). This means that 44% of the air volume of the classroom (309 m3) was changed every hour through the leakages of the envelope. Therefore, an airflow of 136 m3/h was set up, reaching an air velocity of 2.89 m/s close to the infiltration paths (Figure 6). The model revealed that the worst scenario was detected in the wall opposite the windows, where the age of the air reached a value of 9000 s (Figure 7).
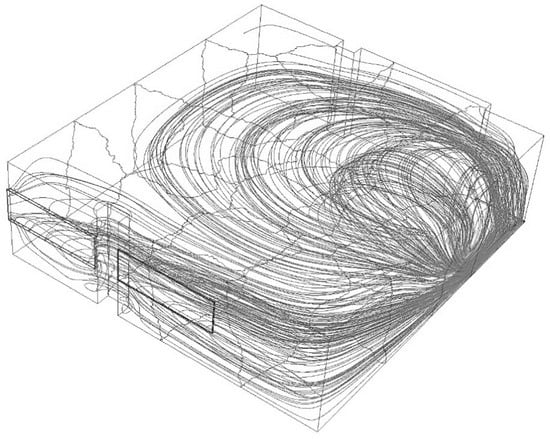
Figure 6.
Air path assessment in classroom A04.
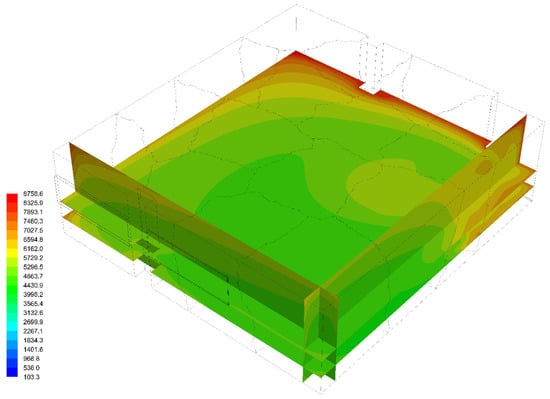
Figure 7.
Age-of-the-air assessment in classroom A04.
This means that the stagnated air in this region took 2.5 h to renew, increasing the pollutants’ concentration, and thus affecting the quality of the air that occupants breathe in this zone. The ventilation efficiency of the classroom obtained from the model was 53.25%. A ventilation efficiency value close to 50% represents a perfect mixing flow model, where the incoming fresh air uniformly mixes with the interior air mass, whose average residence time is twice the transit time [45,46]. The amount of 53.25% indicated that the ventilation flow rate could be reduced while maintaining the IAQ. However, the natural ventilation solution of the classroom and the poor IAQ values registered inhibited that reduction. Figure 7 shows that most of the occupied space is reached by the ventilation airflow, so the problem regarding distribution and dilution of contaminants was considered solved.
4. Discussion
According to the high levels of pollutant concentration registered and the observation of the graphs during the teaching period, it could be deduced that the windows were hardly ever opened to ventilate the occupied classrooms in order to reduce the pollutant concentration associated with the use of some materials during academic activity and human presence.
CO2 concentration monitoring offered valuable information as an indicator of ventilation performance. High values were reached in both classrooms even though the occupation of both spaces was kept below their maximum capacity, highlighting the poor ventilation performance. The data showed that windows were not opened during the teaching period despite the high values reached. The CO2 concentration graphs (Figure 8) show its rapid increase after the students entered the classrooms, registering high values during the entire teaching period, which can constitute a risk for the health and academic performance of the students. It was possible to observe as well the rapid reduction of CO2 concentration due to the opening of doors and, in some cases, windows, and when the students left the classroom. In spite of that, the decrease did not mean the recovery of acceptable values, and there was an increase in the pollutant when the classroom was occupied again.
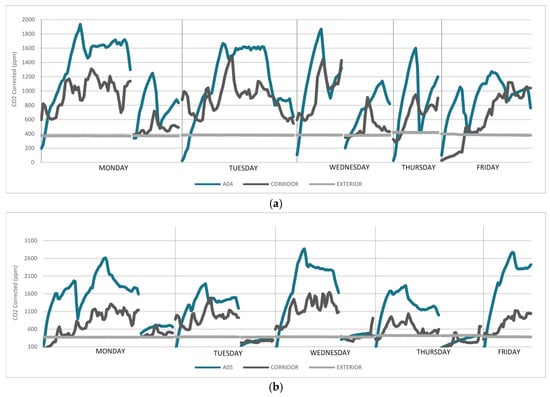
Figure 8.
CO2 measurements during the week in (a) A04 (b) A05.
At the end of the day and during the lunch break, there was a decrease of the CO2 levels registered in the classroom, being below or equal to the outside CO2 concentration. This means that the concentration at the beginning of each shift was adequate under the maximum accepted values and there was no accumulation of the pollutants from one day to the following one. Therefore, only poor ventilation of the spaces was responsible for these high values registered when the classrooms were occupied (Figure 8).
This was a consequence of the randomness of natural ventilation due to two factors. The first one was that natural ventilation depends on physical conditions such as interior and exterior temperature or wind direction. The second factor was that it depends as well on the users’ decisions, which are not based on objective criteria. Another problem associated with natural ventilation and air infiltration was energy loss during the cold season. This was probably one of the reasons users decided not to open the windows.
In the case of TVOC concentration, trends were similar to CO2 concentration, registering strong increases when students occupied the classrooms. However, more variations and peaks were registered. The TVOC concentration inside classes at the beginning of each day as well as at the beginning of the first class in the afternoon was equal to or lower than the outdoor concentration, and TVOC concentration in the corridor remained higher (Figure 9).
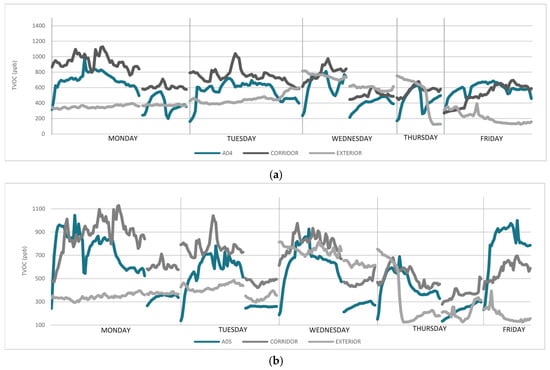
Figure 9.
Total Volatile Organic Compounds (TVOC) concentration measurements during the week (a) A04 (b) A05.
Pressurization tests performed in both classrooms revealed that the airtightness of the building envelope in both classrooms was rather poor, with values of the air change rate greater than 20 h−1 (except for the depressurization mode in classroom A04). The interzonal leakage between classrooms on the same floor was very high, constituting an average of 58% of the total airflow at 50 Pa, while leakages between floors could be considered negligible. Although this significant permeability between classrooms did not impact the energy demand, it must be considered in terms of pollutant transmission, comfort, and noise.
The infiltration air change rate ( of the classrooms, around 0.47 h−1, contributed to the renewal of the air in the classrooms. However, despite the poor airtightness of the envelope, air infiltration is an uncontrolled phenomenon and hence cannot be relayed as a single ventilation source confirmed by poor IAQ results. According to ventilation requirements established in the Spanish regulations for educational buildings based on theoretical occupation, air infiltration should contribute less than 5% of the total required ventilation rate [33]. Nevertheless, the ventilation efficiency obtained guaranteed a good homogeneity of the airflow along the classroom, assuming a perfect mix of the air (ε ≈ 50%) due to the inlets and exhaust location.
5. Conclusions
The IAQ of two classrooms with a natural ventilation system was assessed during the cold season. PM levels were always within acceptable ranges, while CO2 and TVOC concentration exceeded recommended concentration levels. Their increase was related to the occupation of the classrooms by the students.
The CO2 concentration was within the accepted range only 26% of the time, while TVOC concentration was only acceptable 43% of the time in the most favorable scenario. These results are worrying, especially if it is considered that both classrooms were below their maximum capacity. The opening of doors and windows favors a decrease of the concentration of the pollutants, but users rarely opened them during the teaching period. Even though the acceptable limits recovered every day after the users left the building, it only took a few minutes to exceed them when the classes started the following day.
Therefore, it is undeniable that the air renewal contributed by natural ventilation and air infiltration was not enough to maintain good IAQ. However, the obtained ventilation efficiency of one of the analyzed classrooms (53.25%) was adequate for its current configuration. The ventilation performance was poor due to the randomness of both air infiltration and natural ventilation, which also encompass energy loss during the cold season, whose estimation was not the object of this study.
All things considered, the improvement of the ventilation performance of the classrooms and the airtightness of the envelope should be pursued, maintaining at the same time temperature and RH comfort conditions, to guarantee the health and good academic performance of the students. Implementing a specific controlled ventilation system adapted to the case would improve IAQ and contribute to reducing the energy demand as a consequence of a minoration of the airflow needed.
The best scenario assumes an equilibrated model, in which the inlet air and exhaust air have the same flow. Inlet and exhaust positions should promote cross ventilation, reducing the stagnation and contributing to avoid air infiltration. Nevertheless, it must be acknowledged that any change in the conditions would alter the air pattern affecting the ventilation efficiency, so a further evaluation of the ventilation system would be needed.
Author Contributions
Conceptualization, I.P.-C. and A.M.; methodology, M.Á.P.-M.; formal analysis, I.P.-C.; investigation, R.G.-V.; resources, R.G.-V.; data curation, A.M.; writing—original draft preparation, R.G.-V. and I.P.-C.; writing—review and editing, M.Á.P.-M.; visualization, A.M.; supervision, M.Á.P.-M.; project administration, M.Á.P.-M.; funding acquisition, M.Á.P.-M. All authors have read and agreed to the published version of the manuscript.
Funding
This research was funded by the University of Valladolid in collaboration with ARCOR, S.L., and Hermanos Rubio Grupo Constructor HERCE, S.L.U., grant number 18IQBC. The APC was funded by the same team.
Acknowledgments
This work was supported by the University of Valladolid under the research project “REVEDUVa: Energy recovery through ventilation of university classrooms”, framed within the R&D projects on energy efficiency measures and the application of renewable energies in the operation of the university buildings of the University of Valladolid in collaboration with ARCOR, S.L., and Hermanos Rubio Grupo Constructor HERCE, S.L.U. The authors would also like to thank the University of Valladolid for the funding of the doctoral program of one of the authors.
Conflicts of Interest
The authors declare no conflict of interest.
References
- Awbi, H.B. Ventilation of Buildings; Spon Press: London, UK, 2004. [Google Scholar] [CrossRef]
- Bakke, J.V.; Norbäck, D.; Wieslander, G.; Hollund, B.E.; Florvaag, E.; Haugen, E.N.; Moen, B.E. Symptoms, complaints, ocular and nasal physiological signs in university staff in relation to indoor environment—Temperature and gender interactions. Indoor Air 2008, 18, 131–143. [Google Scholar] [CrossRef] [PubMed]
- Tham, K.W. Indoor air quality and its effects on humans—A review of challenges and developments in the last 30 years. Energy Build. 2016, 130, 637–650. [Google Scholar] [CrossRef]
- Mujan, I.; Anđelković, A.S.; Munćan, V.; Kljajić, M.; Ružić, D. Influence of indoor environmental quality on human health and productivity—A review. J. Clean. Prod. 2019, 217, 646–657. [Google Scholar] [CrossRef]
- Wargocki, P.; Porras-Salazar, J.A.; Contreras-Espinoza, S.; Bahnfleth, W. The relationships between classroom air quality and children’s performance in school. Build. Environ. 2020, 173, 106749. [Google Scholar] [CrossRef]
- CEN (European Committee for Standardization). Ventilation for Non-Residential Buildings—Performance Requirements for Ventilation and Room Conditioning Systems; CEN: Brussels, Belgium, 2008; pp. 1–75. [Google Scholar]
- Ministerio de Industria Energía y Turismo del Gobierno de España. Real Decreto 1826/2009, de 27 de Noviembre, por el que se modifica el Reglamento de Instalaciones Térmicas en Los Edificios, Aprobado Por Real Decreto 1027/2007, de 20 de Julio. 2009. Available online: https://www.boe.es/eli/es/rd/2009/11/27/1826 (accessed on 17 June 2021).
- Ministerio de Transportes Movilidad y Agenda Urbana del Gobierno de España, ERESEE 2020. Actualización 2020 de la Estrategia a largo Plazo para la Rehabilitación Energética en el Sector de la Edificación en España. 2020. Available online: https://www.mitma.gob.es/el-ministerio/planes-estrategicos/estrategia-a-largo-plazo-para-la-rehabilitacion-energetica-en-el-sector-de-la-edificacion-en-espana (accessed on 17 June 2021).
- Fernández-Agüera, J.; Campano, M.Á.; Domínguez-Amarillo, S.; Acosta, I.; Sendra, J.J. CO2 Concentration and Occupants’ Symptoms in Naturally Ventilated Schools in Mediterranean Climate. Buildings 2019, 9, 197. [Google Scholar] [CrossRef]
- Krawczyk, D.A.; Rodero, A.; Gładyszewska-Fiedoruk, K.; Gajewski, A. CO2 concentration in naturally ventilated classrooms located in different climates—Measurements and simulations. Energy Build. 2016, 129, 491–498. [Google Scholar] [CrossRef]
- Turner, W.J.N.; Sherman, M.H.; Walker, I.S. Infiltration as Ventilation: Weather-Induced Dilution. HVAC&R Res. 2012, 18, 1122–1135. [Google Scholar] [CrossRef]
- Gomes, J.F.; Bordado, J.C.M.; Sarmento, G.; Dias, J. Measurements of Indoor Air Pollutant Levels in a University Office Building. J. Green Build. 2007, 2, 123–129. [Google Scholar] [CrossRef]
- Burdova, E.K.; Vilcekova, S.; Meciarova, L. Investigation of Particulate Matters of the University Classroom in Slovakia. Energy Procedia 2016, 96, 620–627. [Google Scholar] [CrossRef]
- di Giulio, M.; Grande, R.; di Campli, E.; di Bartolomeo, S.; Cellini, L. Indoor air quality in university environments. Environ. Monit. Assess. 2010, 170, 509–517. [Google Scholar] [CrossRef]
- Righi, E.; Aggazzotti, G.; Fantuzzi, G.; Ciccarese, V.; Predieri, G. Air quality and well-being perception in subjects attending university libraries in Modena (Italy). Sci. Total Environ. 2002, 286, 41–50. [Google Scholar] [CrossRef]
- Astolfi, A.; Corgnati, S.P.; Verso, V.R.M.L. Environmental comfort in university classrooms—thermal, acoustic, visual and air quality aspects. Res. Build. Phys. 2020, 945–957. [Google Scholar] [CrossRef]
- Lee, M.C.; Mui, K.W.; Wong, L.T.; Chan, W.Y.; Lee, E.W.M.; Cheung, C.T. Student learning performance and indoor environmental quality (IEQ) in air-conditioned university teaching rooms. Build. Environ. 2012, 49, 238–244. [Google Scholar] [CrossRef]
- Sarbu, I.; Pacurar, C. Experimental and numerical research to assess indoor environment quality and schoolwork performance in university classrooms. Build. Environ. 2015, 93, 141–154. [Google Scholar] [CrossRef]
- Satish, U.; Mendell, M.J.; Shekhar, K.; Hotchi, T.; Sullivan, D.; Streufert, S.; Fisk, W.J. Is CO2 an Indoor Pollutant? Direct Effects of Low-to-Moderate CO 2 Concentrations on Human Decision-Making Performance. Environ. Health Perspect. 2012, 120, 1671–1677. [Google Scholar] [CrossRef]
- Ramalho, O.; Wyart, G.; Mandin, C.; Blondeau, P.; Cabanes, P.-A.; Leclerc, N.; Mullot, J.-U.; Boulanger, G.; Redaelli, M. Association of carbon dioxide with indoor air pollutants and exceedance of health guideline values. Build. Environ. 2015, 93, 115–124. [Google Scholar] [CrossRef]
- Asif, A.; Zeeshan, M. Indoor temperature, relative humidity and CO2 monitoring and air exchange rates simulation utilizing system dynamics tools for naturally ventilated classrooms. Build. Environ. 2020, 180, 106980. [Google Scholar] [CrossRef]
- Becerra, J.A.; Lizana, J.; Gil, M.; Barrios-Padura, A.; Blondeau, P.; Chacartegui, R. Identification of potential indoor air pollutants in schools. J. Clean. Prod. 2020, 242, 118420. [Google Scholar] [CrossRef]
- Dorizas, P.V.; Assimakopoulos, M.-N.; Helmis, C.; Santamouris, M. An integrated evaluation study of the ventilation rate, the exposure and the indoor air quality in naturally ventilated classrooms in the Mediterranean region during spring. Sci. Total Environ. 2015, 502, 557–570. [Google Scholar] [CrossRef] [PubMed]
- Perez, P.P. Documentos Técnicos de Instalaciones en la Edificación. DITE 2.02. Calidad de Aire Interior; ATECYR: Madrid, Spain, 2006. [Google Scholar]
- Daisey, J.M.; Angell, W.J.; Apte, M.G. Indoor air quality, ventilation and health symptoms in schools: An analysis of existing information. Indoor Air 2003, 13, 53–64. [Google Scholar] [CrossRef] [PubMed]
- Almeida, R.M.S.F.; Pinto, M.; Pinho, P.G.; de Lemos, L.T. Natural ventilation and indoor air quality in educational buildings: Experimental assessment and improvement strategies. Energy Effic. 2017, 10, 839–854. [Google Scholar] [CrossRef]
- Heracleous, C.; Michael, A. Experimental assessment of the impact of natural ventilation on indoor air quality and thermal comfort conditions of educational buildings in the Eastern Mediterranean region during the heating period. J. Build. Eng. 2019, 26, 100917. [Google Scholar] [CrossRef]
- Lee, K.S.; Choi, S.H. Effect of geometric parameters on ventilation performance in a dry room. Dry. Technol. 2002, 20, 1445–1461. [Google Scholar] [CrossRef]
- Li, X.; Wang, X.; Li, X.; Li, Y. Investigation on the relationship between flow pattern and air age. In Proceedings of the Sixth International IBPSA Conference-Building Simulation, Kyoto, Japan, 13–15 September 1999; Volume 99, pp. 423–429. [Google Scholar]
- Met Office, National Meteorological Library and Archive Fact sheet 6—The Beaufort Scale. 2010. Available online: https://www.metoffice.gov.uk/binaries/content/assets/metofficegovuk/pdf/research/library-and-archive/library/publications/factsheets/factsheet_6-the-beaufort-scale.pdf (accessed on 17 June 2021).
- Farrás, J.G. Control ambiental en interiores. In Encicl. La Salud y Segur. en el Trab; Instituto Nacional de Seguridad e Higiene en el Trabajo (INSHT): Madrid, España, 2012. [Google Scholar]
- American Society of Heating Refrigerating and Air-Conditioning Engineers. ASHRAE Handbook—Fundamentals; American Society of Heating, Refrigerating and Air-Conditioning Engineers: Atlanta, GA, USA, 2009. [Google Scholar]
- Ministerio de Industria Energía y Turismo del Gobierno de España. Reglamento de Instalaciones Térmicas en los Edificios. 2013. Available online: https://www.boe.es/diario_boe/txt.php?id=BOE-A-2013-3905 (accessed on 17 June 2021).
- Umweltbundesamtes, B.; der Ad-hoc-arbeitsgruppe, H.; Innenraumlufthygiene-kommission, D. Beurteilung von Innenraumluftkontaminationen mittels Referenz- und Richtwerten. Bundesgesundheitsblatt Gesundheitsforsch. Gesundheitsschutz. 2007, 50, 990–1005. [Google Scholar] [CrossRef] [PubMed]
- Abdul–Wahab, S.A.A.; En, S.C.F.; Elkamel, A.; Ahmadi, L.; Yetilmezsoy, K. A review of standards and guidelines set by international bodies for the parameters of indoor air quality. Atmos. Pollut. Res. 2015, 6, 751–767. [Google Scholar] [CrossRef]
- World Health Organization. Air Quality Guidelines; Global Update 2005; World Health Organization: Copenhagen, Denmark, 2006. [Google Scholar] [CrossRef]
- International Organization for Standardization, ISO 9972:2015 Thermal Performance of Buildings. Determination of Air Permeability of Buildings. Fan Pressurization Method. 2015. Available online: https://www.iso.org/standard/55718.html (accessed on 17 June 2021).
- American Society of Heating Refrigerating and Air-Conditioning Engineers. ASHRAE Handbook—Fundamentals. 2001. Available online: https://www.ashrae.org/technical-resources/ashrae-handbook/description-2017-ashrae-handbook-fundamentals (accessed on 17 June 2021).
- Sherman, M.H. Estimation of infiltration from leakage and climate indicators. Energy Build. 1987, 10, 81–86. [Google Scholar] [CrossRef]
- Meiss, A.; Feijó, J. Influencia de la ubicación de las aberturas en la eficiencia de la ventilación en viviendas. Inf. Construcción 2011, 63, 53–60. [Google Scholar] [CrossRef]
- Sandberg, M.; Sjöberg, M. The use of moments for assessing air quality in ventilated rooms. Build. Environ. 1983, 18, 181–197. [Google Scholar] [CrossRef]
- Etheridge, D.; Sandberg, M. Building Ventilation: Theory and Measurement; Wiley: Chichester, UK, 1996. [Google Scholar]
- Yakhot, V.; Orszag, S.A. Renormalization group analysis of turbulence. I. Basic theory. J. Sci. Comput. 1986, 1, 3–51. [Google Scholar] [CrossRef]
- Meiss, A.; Feijó-Muñoz, J.; García-Fuentes, M.A. Age-of-the-air in rooms according to the environmental condition of temperature: A case study. Energy Build. 2013, 67, 88–96. [Google Scholar] [CrossRef]
- Liddament, M.W. Technical Note AIVC 21. A Review and Bibliography of Ventilation Effectiveness-Detinitions, Measurements, Design and Calculation; International Energy Agency: Bracknell, UK, 1987. [Google Scholar]
- Skaret, E. Ventilation by Displacement—Characterization and Design Implications, Vent. ’85 (Chemical Eng. Monogr. 24). 1986, pp. 827–841. Available online: https://www.aivc.org/resource/ventilation-displacement-characterization-and-design-implications (accessed on 17 June 2021).


Publisher’s Note: MDPI stays neutral with regard to jurisdictional claims in published maps and institutional affiliations. |
© 2021 by the authors. Licensee MDPI, Basel, Switzerland. This article is an open access article distributed under the terms and conditions of the Creative Commons Attribution (CC BY) license (https://creativecommons.org/licenses/by/4.0/).