Article

The Role of Renewable Energy in Regional Energy Transitions: An Aggregate Qualitative Analysis for the Partner Regions Bavaria, Georgia, Québec, São Paulo, Shandong, Upper Austria, and Western Cape

1
Energieinstitut, Johannes Kepler University, Altenberger Straße 69, 4040 Linz, Austria
2
Bavarian Research Alliance, Prinzregentenstraße 52, 80538 Munich, Germany
3
Department of Mechanical Engineering, Technical University of Munich, Boltzmannstraße 15, 85748 Garching, Germany
4
Department of Mechanical Engineering, Université Laval, Québec, QC G1V 0A6, Canada
5
Department of Energy, Mechanical Engineering Faculty, University of Campinas, Campinas CP 6122, Brazil
6
International Energy Initiative, Av. José Rocha Bomfim 214, Campinas CEP: 13080-900, Brazil
7
GreenCape, 18 Roeland Street, Cape Town 8001, South Africa
*
Author to whom correspondence should be addressed.
Sustainability 2021, 13(1), 76; https://doi.org/10.3390/su13010076
Submission received: 25 November 2020 / Revised: 18 December 2020 / Accepted: 21 December 2020 / Published: 23 December 2020
(This article belongs to the Section Energy Sustainability)

Abstract

:
The study aims to identify the strengths, weaknesses, opportunities, and threats (SWOT) of renewable energy deployment in regional energy transitions for the regions of Bavaria, Georgia, Québec, São Paulo, Shandong, Upper Austria, and Western Cape, which comprise a political and scientific network called the Regional Leaders’ Summit (RLS) and RLS-Sciences, respectively. The results classify current renewable energy usage for electricity, heat and fuel production, existing renewable energy potentials, sound legal frameworks to support renewable energy, ongoing research and development activities and expertise in renewable energy conversion and storage as strengths. That fossil fuels still hold a significant share in gross inland energy consumption, energy-intensive industrial structures continue to be supported by fossil fuels and grid access is limited for renewables are identified as weaknesses. The main opportunities are green economies, climate change mitigation and technological innovations. Associated threats are demographic developments, lack of social acceptance and renewable energy resource volatility. We conclude that these regions’ energy systems could potentially enable the realization of a strong integration of renewables and cover partially distributed, decentralized energy systems with embedded energy storage, and the application of smart technologies. Furthermore, we discover that the role of governments in guiding and managing regional energy transitions is highly important.

1. Introduction

The transition of the world’s energy systems towards carbon-neutrality, with a significant increase of renewable energy, is a global trend with outstanding dynamics. Furthermore, the high cost and limited sources of fossil fuels, in addition to the necessity to diminish greenhouse gas emissions, have strengthened the role of renewable resources in energy-intensive economies. Renewable energy resources provide a vast potential to satisfy the world’s energy demand and are projected to have a significant share in the future global energy portfolio [1]. The share of renewables in final energy consumption continues to increase globally with some technologies developing very fast [2,3,4]. The average annual growth rate of modern renewables in final energy consumption over the past decade was 5.4% [5]. Further, at the end of 2018, global renewable generation capacity totaled 2351 GW [6], which implies an increase in renewable capacity of 7.9% during 2018.
Regions—here meaning subnational governance areas such as federal states or provinces—play a key role in the transformation of global energy systems [7,8]. Within the transition process, they face a variety of challenges via the structural changes brought by a low-carbon transition. Advancing the transition to a climate-neutral economy requires decarbonizing traditional production and consumption structures, implying investments in both energy efficiency and renewable energy. This transitioning to a climate-neutral energy system also involves effective multilevel governance practices, especially with respect to alignment among levels of government and stakeholder engagement [9]. Regional governments have implemented a number of policies to boost the deployment of renewable energy. A closer look at these developments at the regional level allows us to identify the factors that influence the effectiveness of an energy system transformation.
In international cooperation, best practice exchanges at and across different governance levels, fields, and jurisdictions have become increasingly popular as a method to support and improve actions and outcomes, particularly related to climate action. Recent examples have included the United Nations Framework Convention on Climate Change (UNFCCC) supported “Talanoa Dialogue” in 2018 [10,11], which drew best practice examples from international, national, subnational, municipal, NGO and industry actors, the European Climate Initiative [12], which works within the EU, the G20 Country Experiences on Climate and Energy [13], which was derived by the G20 Climate Sustainability Working Group, the Vertical Integration and Learning for Low-Emission Development in Africa and Southeast Asia project [14], which targets the subnational and municipal levels, or the International Council for Local Environmental Initiatives (ICLEI)-sponsored California–China Urban Climate Collaborative [15], which is focused on cities.
The Regional Leaders’ Summit (RLS) is a multilateral political forum of seven partner regions: Bavaria (Germany), Georgia (USA), Quebec (Canada), São Paulo (Brazil), Shandong (China), Upper Austria (Austria) and the Western Cape (South Africa). The first meeting took place in 2002 and since then the heads of government of the RLS regions meet every two years in the framework of a political summit. During the summit meetings of the RLS regions, perspectives and strategies for a sustainable world under the guiding theme “Policy for Generations” are discussed [16]. The seven RLS partner regions consider themselves to be leading players in their countries and continents with important technical, scientific and especially renewable energy resources. They choose to engage with one another as peers in the subnational context in the frame of the Regional Leaders Summit.
On April 12th, 2012, on the occasion of the sixth Regional Leaders Summit in São Paulo, the RLS partner regions adopted a Final Declaration which included the following commitment (Item 12):
‘‘In order to increase the proportion of renewable energy in the total energy consumption, as well as contribute to the security of energy supply and to promote renewable energy on a global scale, we invite our universities, research institutes, and industrial clusters to join forces in the formation of a network, centered on renewable energy and energy efficiency, so that innovations and new products will be developed to achieve these goals. This initiative will be led by the Government of the State of São Paulo until 2014. The intensification of the cooperation in research is necessary to implement these technologies in renewable energy sources and energy efficiency broadly and at a reduced cost.’’
[17]
As a result of this commitment, a scientific network of interdisciplinary energy researchers from all seven RLS partner regions was created in 2013. This is known as the RLS-Energy Network. The RLS-Energy Network was mandated to exchange on a research and innovation level, and began working to build up a network of key stakeholders in the energy research and innovation ecosystems in each of the RLS regions through annual workshops and exchanges. In 2016, the network was well established and created a Joint Roadmap, to specify future work to be conducted. This included, among other activities, the collection and analysis of data relevant for energy transitions at the regional level in the RLS regions. At the ninth RLS Conference in 2018, the heads of governments and representatives of the political level signed “The Québec Joint Declaration on Energy Transition” [18,19]. This declaration highlighted the political commitment at the regional level to an energy transition, with a goal for the regions to become leaders in energy transition by 2030. The document refers specifically to renewable energy and energy efficiency with the further aim of building a “new, strong, low-carbon economy’’. The declaration references not only the economy to be changed as a result of energy policies, but health and quality of life as well. The political leaders mandated the RLS-Energy Network to undertake work to support such a transition, identifying three main tasks: first, the sharing and exchange of expertise and information regarding renewable energy and energy efficiency, including expanding the dialogue around these topics [19]; second, “identify opportunities for cooperation between the regions’’; and, third, “suggest actions energy leaders can take’’ before the 10th RLS Conference in 2020 [19].
In order to fulfil these political mandates, the authors, who are part of the RLS-Energy Network, undertook a qualitative and descriptive study which aims at identifying and analyzing strengths, weaknesses, opportunities and threats (SWOT) for the role of renewable energy deployment in RLS regions’ energy transitions. This represented a first effort to identify, collect, aggregate, and analyze information about energy transitions across the seven regions. Although the analysis is specific to the seven RLS partner regions, the findings can be relevant to other areas, with appropriate calibration. Further, the paper highlights the complex energy systems’ structures in the RLS regions and supports energy-related decision making.
The article is structured as follows: First, Section 2 will briefly comment on sustainable energy transitions and offer an overview about the RLS regions’ characteristics and energy landscapes. Second, we present our methodological approach, a SWOT analysis framework, in Section 3. The main results are then described in Section 4. The focus is placed on results which can be supported by empirical data and publicly available information from the RLS regions. The article discusses the results and their contribution to the analysis of regional energy transitions. Section 5 concludes. In the recommendations we finally aim at offering findings for the political levels of the RLS regions.

2. Research Design

2.1. Conceptual Underpinning and Analytical Framework

Markarda et al. [20] define sustainability transitions as “long-term, multidimensional and fundamental transformations of large sociotechnical systems towards more sustainable modes of production and consumption’’. However, sustainability has no universally agreed upon definition, and is a normative concept; all sustainability transitions, regardless of scale or system, will involve value choices and trade-offs. Geels [21] shows that, in navigating decisions about a collective future, “sustainability transitions will be full of debates about the relative importance of various environmental problems, which entail deep-seated values and beliefs”. In this framework, the intersection between science and policy becomes increasingly important, and “public authorities and civil society will therefore be crucial drivers for sustainability transitions” [21]. While science can provide information about the likely outcomes of particular choices or pathways of society, it is important to acknowledge the role of the political and civil society actors in such transitions, particularly in light of these value trade-offs.
The energy transition can be argued to be an example of a sustainability transition, specifically a transition of a sociotechnical system. Sociotechnical systems, which are made of established technologies, “highly intertwined with user practices and life styles, complementary technologies, business models, value chains, organizational structures, regulations, institutional structures, and even political structures”, tend to undergo “incremental rather than radical changes” [20]. The high level of interconnectivity, coupled with existing lock-ins and path dependencies, mean that navigating sustainability transitions and changes to sociotechnical systems must address “sunk investments, behavioral patterns, vested interests, infrastructure, favorable subsidies and regulations” [22]. In order to create relevant information for societies navigating these transitions, the systems must therefore be addressed in research from an interdisciplinary perspective.
Political systems are an integral part of sociotechnical systems, and are instrumental aspects of sustainability transitions. This analysis addresses the subnational territorial level, and it should be acknowledged that these systems are both embedded within larger national and international structures, as well as framing smaller local systems. In navigating the complexities of the many systems related to a sustainability transition, it is important to acknowledge the link between science and policy, but also between the various levels of governance that make up the systems themselves. The concept of multilevel governance describes the distribution of power and the relationships between actors in governance both vertically and horizontally within these systems [23]. Vertical power distribution in governance can be seen in the relationship between “nested” or hierarchical levels of government in supranational, federal, subnational, and municipal governments [23]. Comparatively, horizontal power describes the relationships between the government and various nonstate actors within the system who are at the same level, but have different roles, such as civil society actors, economic actors, and academic actors [23]. Regional energy transitions are therefore influenced by both vertical and horizontal frameworks in multilevel governance.

2.2. Profiles of the RLS Partner Regions: Energy and Policy

The research focus is on the seven RLS partner regions and their processes, including with regard to policy, in their regional energy systems transitions. Key data are provided in Table 1 and in Section 2.2.1 to Section 2.2.7 for each region.
It is important to note that the availability (both existence and frequency of production), type, breadth, and source of energy-systems-related data varies from region to region. A lack of data on a particular technology or policy aspect does not mean that it does not exist, but may mean that it has not (yet) been measured. However, without this measurement, it is difficult to differentiate between aspects which do not exist and those which have not been measured. Since the authors did not have the means to independently generate data, we worked with what had already been produced. This created challenges for the analysis, but also provided insights into which aspects of energy transitions did have commonalities, which was the aim of the aggregated SWOT analysis. In future work, the authors may assess if more data is generated and which kinds, particularly since the 2018 Final Declaration on Energy Transition, and what implications or relations this has for and to policy shifts.

2.2.1. Bavaria

The state of Bavaria is the largest of all German federal states in terms of area, and is second largest in terms of both gross regional product and population. Bavaria is an especially strong region in terms of economy, with a low unemployment rate and consistent growth. Neighboring countries include Austria, the Czech Republic, Switzerland (across Lake Constance), while neighboring German states include Baden-Wuerttemberg, Hesse, Thuringia and Saxony.
In 2011, German energy policy, including that of Bavaria, was altered to begin moving away from nuclear power. This effort, known as the “Energiewende” or energy transition, aimed to transition away from nuclear power and towards more renewable energy. In Bavaria, this effort, along with other initiatives for energy, was outlined in the 2011 Bavarian Energy Concept, “Energie innovativ” [45]. In 2015, a new policy plan for energy in Bavaria was released, entitled “Bayerisches Energieprogramm für eine sichere, bezahlbare und umweltverträgliche Energieversorgung“ [46] or the Bavarian energy programme for secure, affordable and environmentally sound energy supply. This programme built upon the 2011 policy and identified quantitative and qualitative targets for the region to reach by 2025.
Following the four-year trend, the next energy policies from the Bavarian government were published in 2019. The “Bayerisches Aktionsprogramm Energie” [47] or energy action programme, which covered the legislative period from 2019 until 2022, was the first of two key pieces of legislation for energy policy. The other, adopted by the Bavarian cabinet in November of 2019, was the “Bayerisches Klimaschutzgesetz” [48] or Bavarian climate protection act. Both introduced new targets and new deadlines for a series of energy and climate related efforts, adding to the existing targets of earlier policies. In the case of the energy action programme, the aim was concrete targets for expanding renewable energies by 2022, whereas, with the climate protection act, the Bavarian government adopted the goal of reducing GHG emissions by 55% (compared to 1990 levels) by 2030. In a longer-term policy, climate neutrality is to be achieved in Bavaria by 2050. The act also requires public administration in the state, including the state government and municipalities to become climate neutral by 2030, with the aim of leading by example.
Bavaria, like much of Germany, has already undergone changes to its energy utility system as the energy transition in the region has progressed. Previously, the market was dominated by a few major, centralized power providers [49]. However, beginning in the 1990s and 2000s, these were undercut continuously by a series of events and factors, including the decrease of renewable energy technology costs, political incentives for decentralized production especially through renewables, the 2008 financial crisis, a cultural preference for localized production, and the Fukushima nuclear accident, among others. These factors together created a trend towards the “remunicipalization“ and “new municipalization” of grid control and power production, as well as the smaller but still relevant rise of citizen energy cooperatives. Now, Germany’s largest utility provider is a municipal public utility, or “Stadtwerke” in Bavaria: Stadtwerke München (SWM). SWM invests widely in renewable power generation; starting in 2008, it began to work towards the goal of being the first to offer 100% renewable energy production for a city with over 1 million inhabitants [50]. At present, SWM has a green electricity generation capacity of 5.67 billion kWh, covering the needs of all private households, and the city’s transit systems [51]. The aim by 2025 is to have 7 billion kWh.

2.2.2. Georgia

Georgia is a state in the south-eastern United States, bordered by the Atlantic Ocean and South Carolina to the east, Florida to the south, Alabama to the west and Tennessee and North Carolina to the north. The economic structure is very diverse, with particular expertise in the areas of aerospace, agro-business, automotive, energy, logistics and clean technologies [16].
Georgia’s total energy consumption ranks among the ten leading states of the USA. Within Georgia, the transport sector has the highest sectoral final energy consumption, and the industrial sector the second highest. Georgia’s energy-intensive industry includes companies producing food, beverages and tobacco, chemicals and paper, and agriculture and forestry. The per capita energy consumption of households is higher than the national average due to the intensive use of air conditioning systems caused by the warm and humid climate [52].
Georgia Power (owned and operated by Southern Company) is an investor-owned private company with ownership shares held by stockholders. Further, there exist publicly owned companies which are overseen by co-op boards and municipal governments. Renewable energies have a share of approx. 8% in electricity generation. Biomass, hydropower and solar energy are the main sources of renewable energy in Georgia [52].
In the state of Georgia, there is no regulatory framework that requires the use of renewable energy. However, financial incentives are provided by state utilities for the implementation of energy efficiency measures and renewable energy production. There are public, private, philanthropic partnerships which use state assets to assess and implement pioneering technologies and verify commercial potentials in the areas of renewable energy, transportation and sustainability. Additionally, trade organizations promote renewable energy and sustainability in Georgia (e.g., Georgia Solar Energy Association, Green Chamber of the South, Clean Cities of Georgia). Georgia has energy standards for public buildings as well as interconnection guidelines and solar easement regulations. Further, utilities are allowed to offer net metering [52].

2.2.3. Québec

The province of Québec is the largest Canadian province by area, and second largest by population. It is bordered by three other Canadian provinces (Ontario, New Brunswick, and Newfoundland and Labrador), as well as by the four American states (Maine, New Hampshire, New York and Vermont). Québec is characterized by its abundant hydropower resources and the resulting low price of electricity [53]. Québec’s electricity sector is dominated by Canada’s largest utility, government-owned Hydro-Québec.
The final nationalization of the electricity sector in the early 1960s was one of the pillars of the “Révolution tranquille” or Quiet Revolution, a period of Québec’s history marked by intense reforms to modernize the province. Over the decades that followed, major hydropower projects were developed, in particular in the north of the province, sometimes clashing with Indigenous nations in the area, and thus forcing governments to negotiate settlements (e.g., James Bay and Northern Quebec Agreement in 1975) and eventually establishing a nation-to-nation dialogue.
In 2013, Québec adopted an ambitious action plan on climate changes (Plan d’action 2013–2020 sur les changements climatiques [54]). The plan presents a series of priorities to address that are related to energy in order to reduce the greenhouse gases emissions, such as developing the bioenergy sector, integrating renewables in buildings, improving energy efficiency in the industrial sector and promoting green mobility. Québec adhered to the Western Climate Initiative, a North American carbon cap and trade system implemented to reduce GHG emissions of participating Canadian provinces and American states.
In 2016, the government of Québec updated its energy policy with a document called “L’énergie des Québécois: Source de croissance” or “The Energy of Quebecers: Source of Growth” [55]. The policy outlines the objectives of the government in terms of energy transition over the 2030 horizon, including an increase of energy efficiency by 15%, a reduction of 40% of the petroleum products consumption, an increase of 25% of production from renewables and of 50% for bioenergy (compared to 2013). In 2017, the organization “Transition énergétique Québec” was launched by the government to support, stimulate and promote energy transition, innovation and energy efficiency.
Recently, a stricter energy regulation for commercial, institutional and large housing buildings came into effect, aiming to reduce their energy consumption by 25% compared to the previous standards [56].

2.2.4. São Paulo

Brazil’s most populous state São Paulo, with approximately 22% of the national population, has one of the highest demographic densities in the country. São Paulo concentrates the major industrial production of Brazil, and has the highest GRP among all Brazilian states, accounting for 32% of the national GDP [57]. In addition, it has the country’s second highest Human Development Index [58] and the second highest GDP per capita [59].
Renewable sources constitute a significant amount of the state’s energy mix, especially through biomass facilities and hydroelectric plants. Biomass from sugarcane alone accounts for 25% of all electricity production in the state and all biomass facilities together correspond to 40% of the installed capacity for biomass in Brazil [32]. São Paulo is also responsible for producing 13 million m3 of sugar cane ethanol, representing 48% of the country’s total production [60].
Regarding solar and wind energy, the state does not have the same potential as the Northeastern Brazilian states to develop these energy sources on a large scale [61]. On the other hand, there is strong interest, especially from the policy level, in promoting biomass energy, betting on bioelectricity, switching polluting energy sources for green fuels, as well as rationalizing the transportation energy mix and the generation of energy through solid waste according to the “São Paulo State’s Energy Plan—PPE 2020” [57]. The government guidelines focus on the industrial and transportation sectors, which were responsible for 86% of the state’s GHG emissions (28% and 58% respectively). Despite this, the government has endorsed tax incentives for both the wind and PV industries for a number of years [61,62]. On the other hand, even though biomass is explicitly the state’s supply-side priority to meet PPE 2020 goals, its share in electricity generation and in biomass-based fuels in the transport sector remains almost constant over 2015 to 2017 [32,60].
The energy sector’s long-term plans and objective public policies are elaborated by the State Council for Energy Policy (CEPE), which was responsible for the São Paulo state energy plan. There is a policy, established in 2009, that guarantees the consistency of proposed guidelines to the climate change policy, known as PEMC. The latest plan for the energy sector, “São Paulo State’s Energy Plan 2030”, has been in revision since 2016 to set long-term goals to induce the delivery of less pollutant and climate warming energy sources and the improvement of energy efficiency [63]. São Paulo, as with the rest of Brazil, has experienced a change in the make-up of electricity and power providers and distributors since the 1990s. In the 1990s, the electricity market was deregulated. In the 2000s, electricity was still primarily produced by government owned companies, such as Electrobras at the national level and CESP at the São Paulo state level. Today, generation capacity remains mainly government-owned—at around 75% in 2016—but distribution has been privatized to a much larger extent, nearing 80% in 2016 [64].
Finally, the state hosts the country’s main energy-focused research and development institutes and universities [63].

2.2.5. Shandong

Shandong Province is situated in eastern China and has a 3000-km coastline on the Yellow Sea. After Guangdong and Jiangsu, it is the province with the third highest gross regional product in the Chinese economy and has the second largest regional population in China after Guangdong.
Shandong’s energy consumption accounts for about 10% of China’s energy consumption. Eighty percent of the region’s energy consumption is covered by coal [65]. The Shandong Energy Group Company is a wholly state-owned coal-mining company and owns numerous coal and oil shale-fired power stations. Additionally, the development of nuclear, wind and solar power is handled by this company. The high amount of coal on Shandong’s energy mix leads to the fact that decoupling in the power sector is an important future goal of the region, which should lead to a reduction of energy-related CO2 emissions. Measures within the framework of a regional energy transition include a gradual increase in the use of natural gas and renewable energy resources, the promotion of a multichannel energy supply network and the use of cleaner coal technology [65]. In 2017, around 5% of all electricity was generated by hydro, wind and solar power.
Currently, Shandong province aims to reduce emissions and save energy while developing and restructuring its industry. This is to be supported through a proactive fiscal policy and the promotion of science [16].

2.2.6. Upper Austria

Upper Austria is an Austrian federal state, the fourth largest in terms of area and the third largest in terms of population. It borders Bavaria (Germany), South Bohemia (Czech Republic) and, within Austria, Lower Austria, Styria and the province of Salzburg.
As Austria’s leading industrial state by industrial production and exports, Upper Austria is characterized by very strong dynamics and economic stability. Strong employment growth and low unemployment are the result of the competitive strength of the region and its companies. A quarter of Austria’s industrial production and exports take place in Upper Austria. Traditional hydropower, modern and highly efficient gas power stations, biomass plants, photovoltaic and geothermal energy use create what the state government describes as a future-oriented mixture of energy sources [66]. The Upper Austrian energy companies Energie AG (its majority owner is the province of Upper Austria) and Linz AG (public utility) are important players both in the regional energy market and beyond.
Since the mid-1990s, Upper Austria has had strategies in place to promote energy efficiency, renewable energies and other innovative energy technologies. In particular, the Upper Austrian energy strategy “Energiezukunft 2030” set targets for transformative climate protection measures in a number of sectors. On the basis of this strategy, Upper Austria aims to cover the entire electrical energy consumption and space heating by 2030 through renewable energy production [66]. This strategy was expanded by the new, equally climate and location-oriented energy strategy “Energie-Leitregion OÖ 2050”. The vision of this current strategy is the establishment of Upper Austria as a leading region with regard to the improvement of energy efficiency, the application of new technologies (Upper Austria as the first “smart region” in Europe) and international technology leadership in selected core areas of energy and environmental technology [66,67].

2.2.7. Western Cape

Located in the southwest of South Africa, the Western Cape is a coastal province. In terms of size, it is the fourth largest of the nine South African provinces and third largest by population. The Western Cape is bordered by the South African provinces of the Northern Cape and the Eastern Cape, as well as the Atlantic Ocean and Indian Ocean. Western Cape is one of the stronger provincial economies in South Africa, typically outperforming the national average for growth [43]. In terms of key sectors, Western Cape’s finance, business services and real estate, combined, contribute 28% to the gross GDP, with the financial services and insurance sectors taking on key roles in the economy.
The Western Cape has long sought to improve its energy resilience. As with most federal nations, policy powers are divided between the national and provincial governments in South Africa. Since energy is considered a national responsibility in South Africa, the Western Cape has no constitutional mandate for energy generation [68]. South Africa’s nationalized energy provider, Eskom, has had a near-monopoly on electricity provision, and is the largest electricity producer on the continent and one of the largest in the world [69]. Despite this, the Western Cape government has found a variety of ways to work on the energy system within the province.
A key strategy of the Western Cape government has been to work through economic avenues to incentivize renewable investment and development in the province. The stated aim is to support economic empowerment to all citizens, including the most disadvantaged, through the opportunities associated with a green economy [70]. To achieve this goal, the Western Cape provincial government and the city of Cape Town established the sector development agency GreenCape in 2010. GreenCape facilitates all types of renewable energy projects by unblocking regulatory hurdles, providing a lobbying platform for the industry, and creating an attractive environment for investment in the sector [71]. Then, in June 2012, the Western Cape government announced 110% Green, a call to action for all organizations to commit to the green economy, and to act of their commitment to make an impact [72]. 110% Green aims to stimulate activities that will manifest the Western Cape as a green and CO2-free economic center of South Africa. This is a central and economic strategic goal of the Western Cape government [72]. Diversifying and securing the energy supply as part of the “Energy Security Game Changer” has involved the Western Cape government in working with municipalities and businesses to increase the penetration of rooftop solar in the province, with the objective of 10% of Western Cape’s electricity to be generated from alternative sources by 2020 [68]. Recent developments have seen 70% of South African renewable energy manufacturing taking place in the Western Cape, along with 60% of the country’s utility-scale project developers [72]. The newly established Atlantis Special Economic Zone aims to further support the Western Cape as a capital of green economy through supporting the development of green technologies [72].

3. Methodology

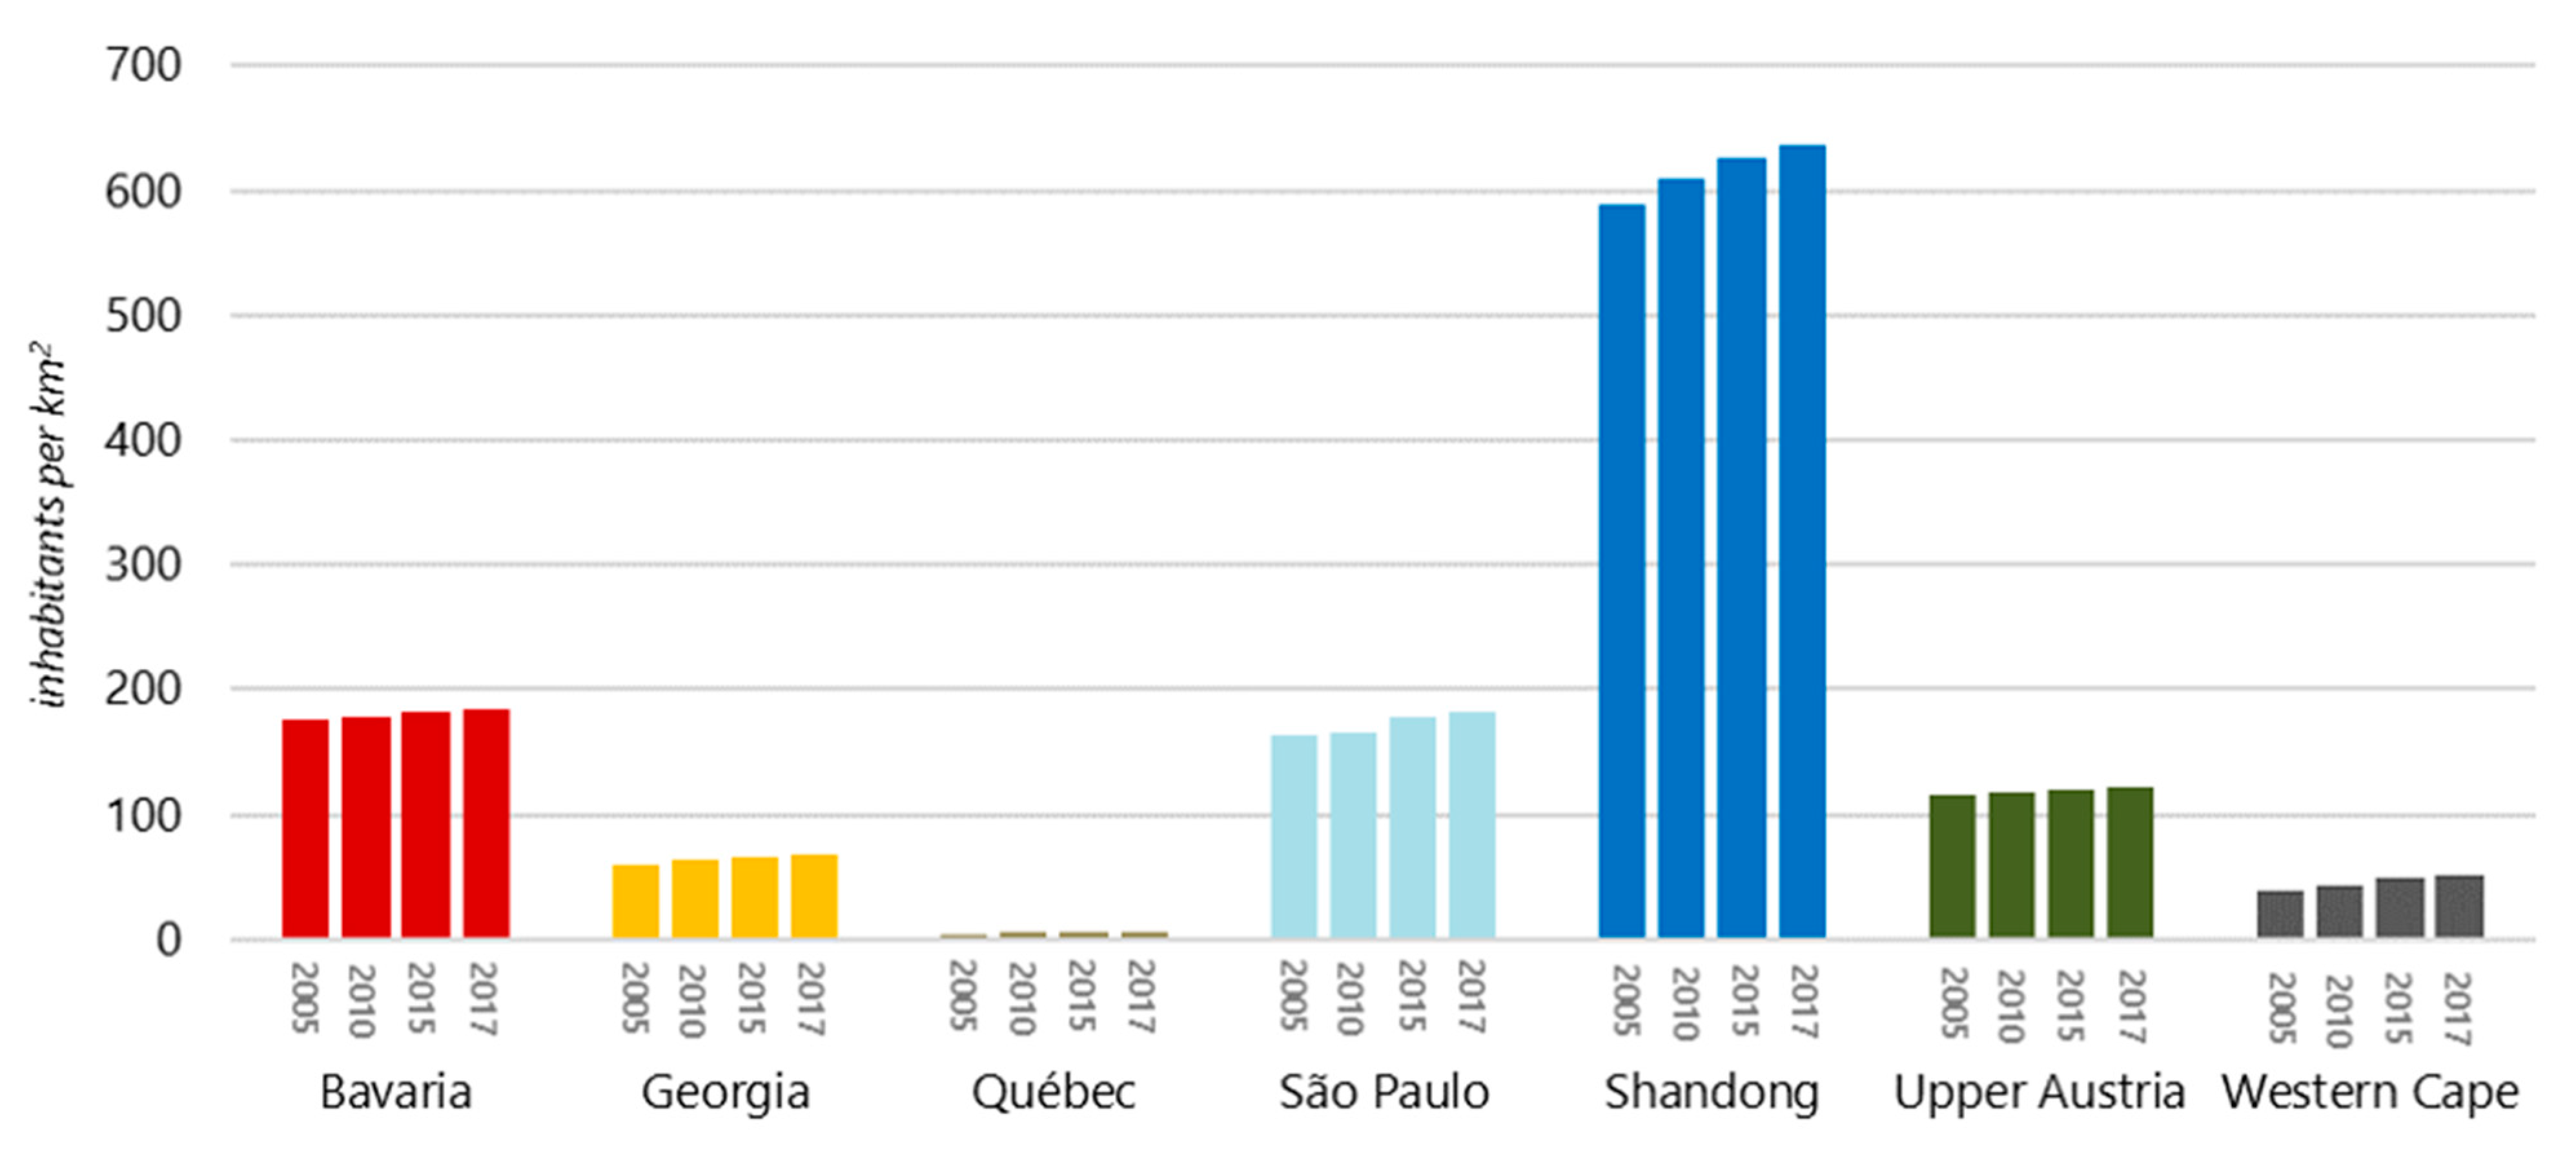
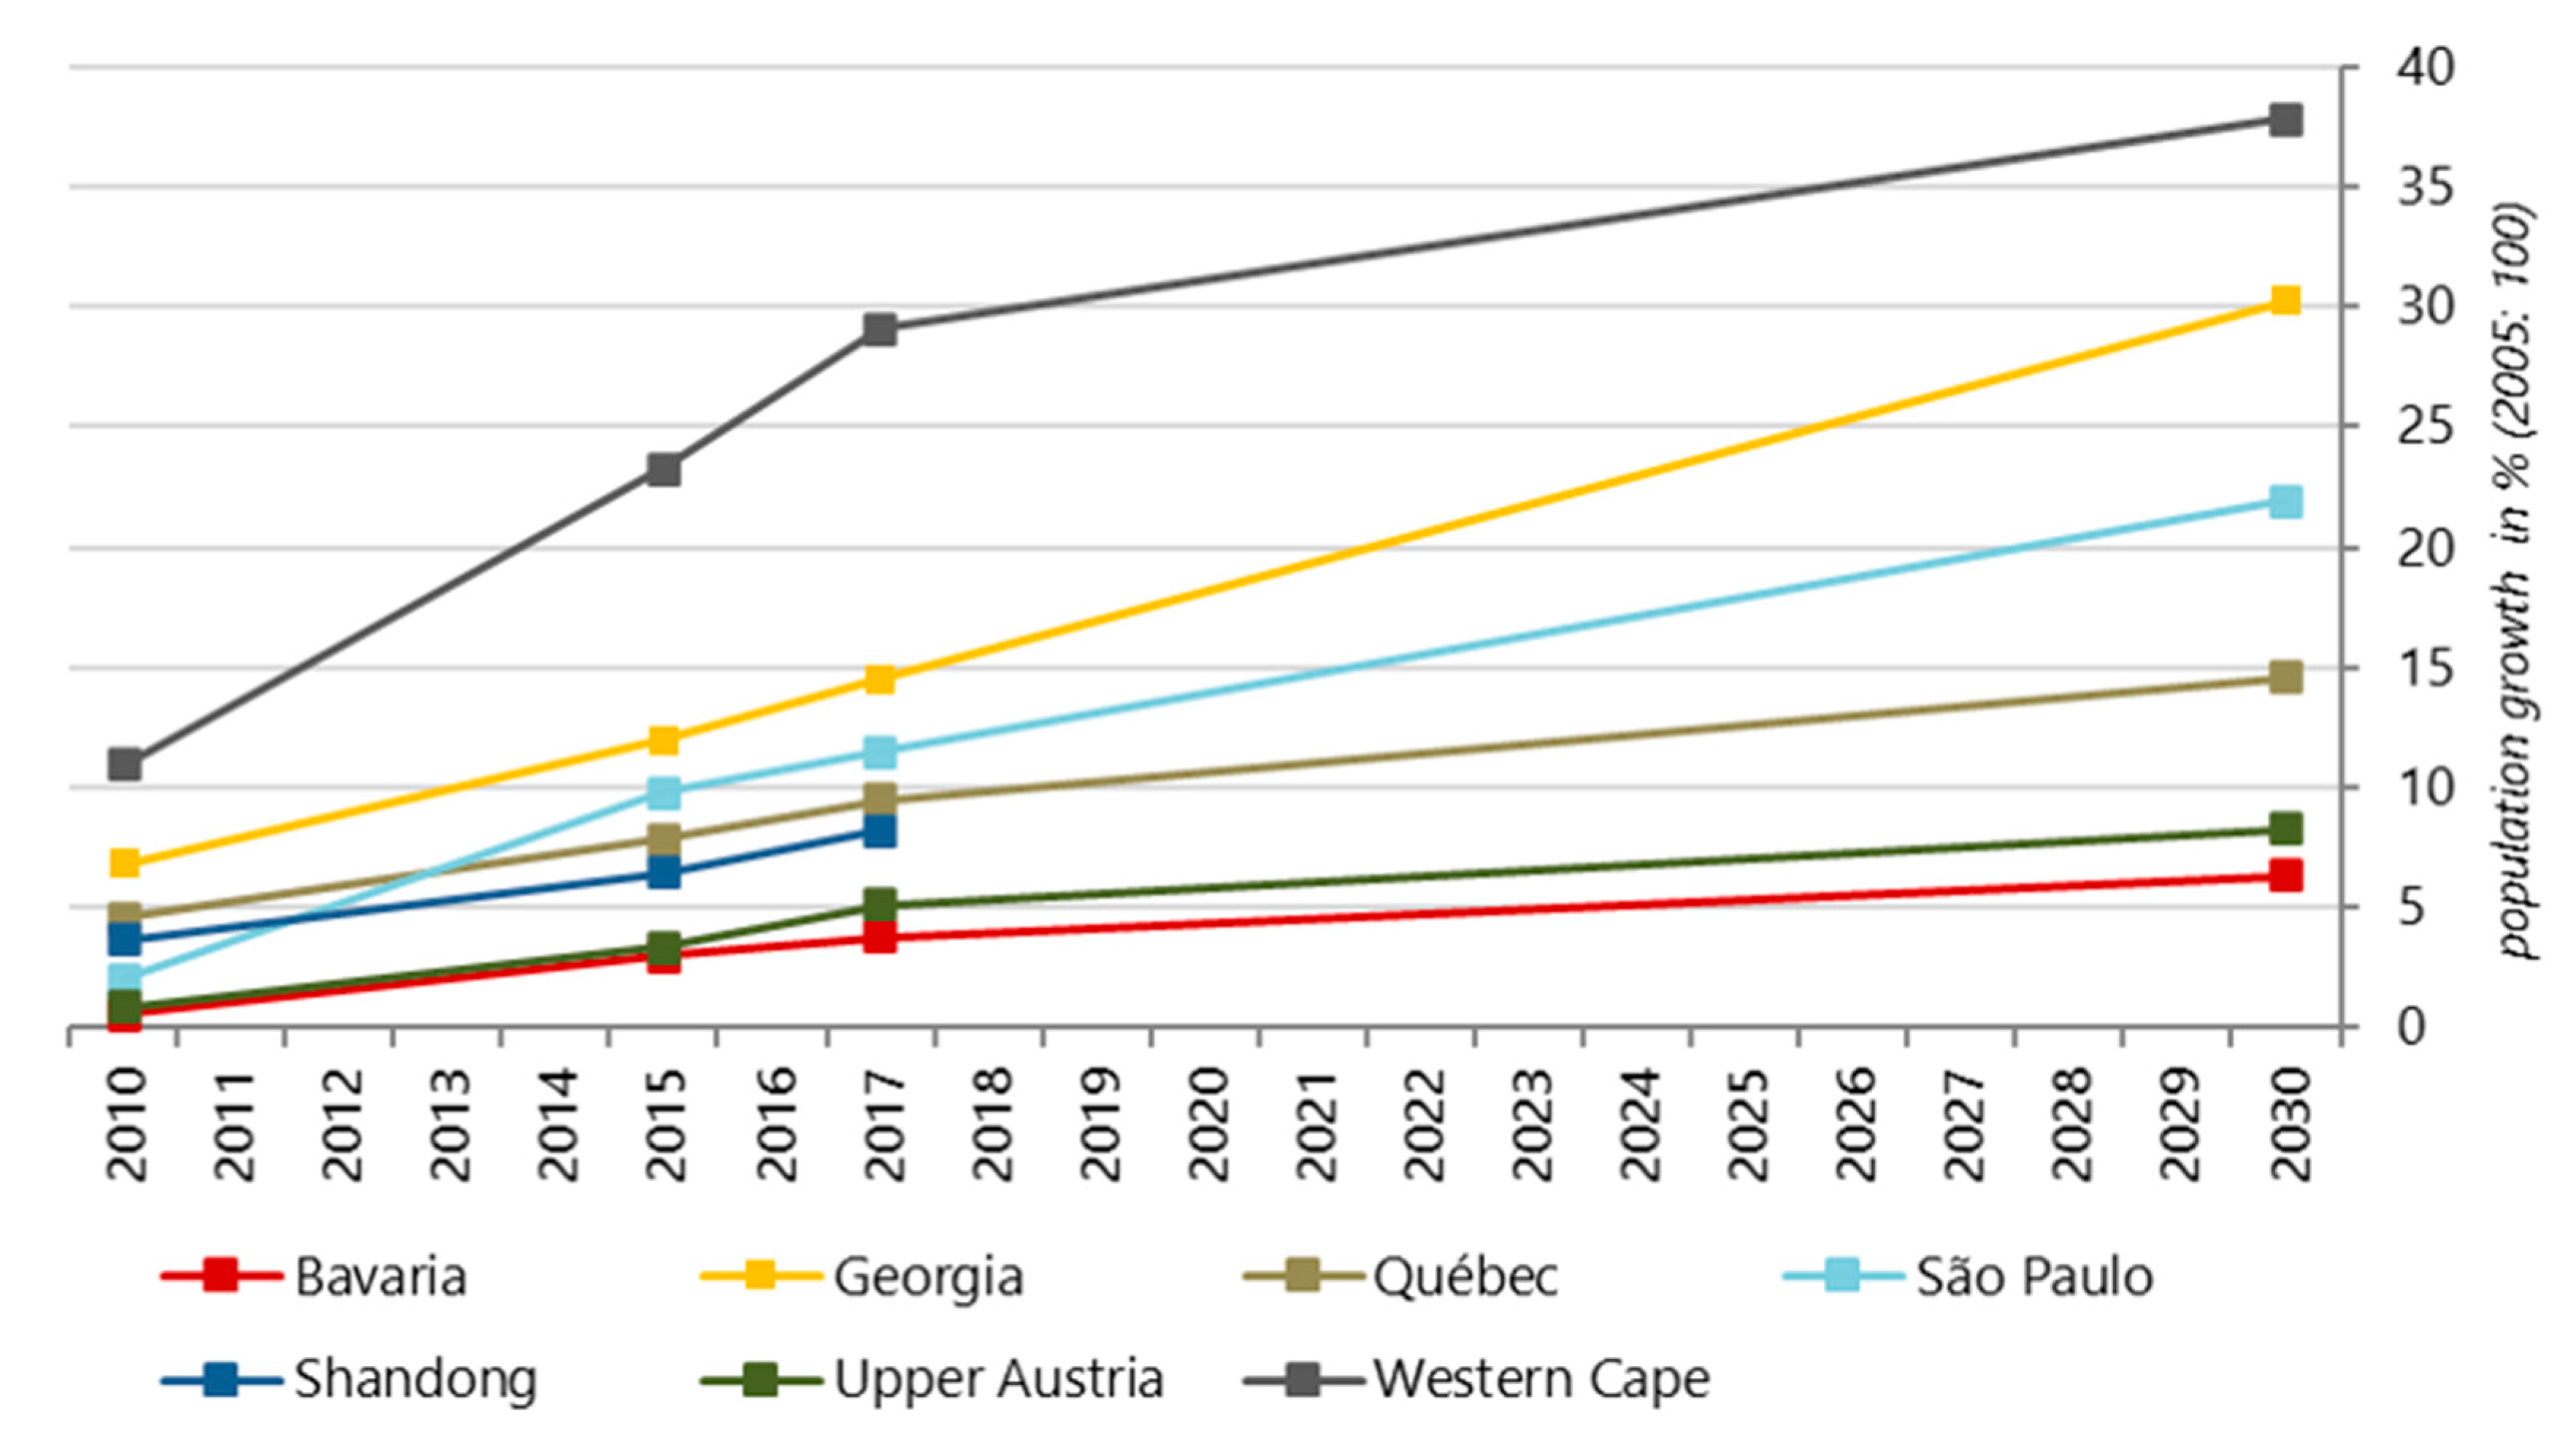
The above key data and outlines of the regions and their energy systems show that the population, geographic area, and economic, social and political characteristics of the RLS regions differ greatly. This naturally results in differences between the individual regional energy systems. Nevertheless, these systems face common challenges, namely how renewable energies can be integrated in regional energy policy. With this in mind, the study employs a SWOT analysis to highlight the role of renewable energy in the RLS regions’ energy transitions. The present analysis is not so much a question of defining singular steps, but of identifying common characteristics in the regional visions with regard to global transformation and thus further accelerating it. Through multilateral structure and multilevel governance within the RLS-Energy network, best practice approaches can be presented holistically and they can help to assess how regions can learn from each other.
A SWOT analysis is a type of planning method which is applied to assess the strengths (S), weaknesses (W), opportunities (O), and threats (T) associated with a project or a business venture [73]. To undertake a complete SWOT analysis, it is necessary that the overall objective of the business venture or project is clearly defined, and internal and external factors that are advantageous and disadvantageous to accomplish that objective have to be evaluated.
SWOT analyses are often used as part of a strategic or business planning process, but can be suitable in understanding a situation and decision-making for all types of circumstances [74,75,76]. It enables a state description to be determined by considering internal (strengths and weaknesses) and external factors (opportunities and threats). Based on this, the aim is to derive suitable measures to achieve the overall objective. Hence, the intention is to maximize the benefits from strengths and opportunities and minimize the losses from weaknesses and threats. For this purpose, combinations are searched for in a targeted manner, then it is asked which initiatives and measures can be derived from them:
  • Strengths: attributes of the project that imply a competitive advantage;
  • Weaknesses: attributes of the project that imply a competitive disadvantage;
  • Opportunities: factors and developments in the environment that can be beneficial;
  • Threats: factors and developments in the environment that could endanger the project or be disadvantageous.
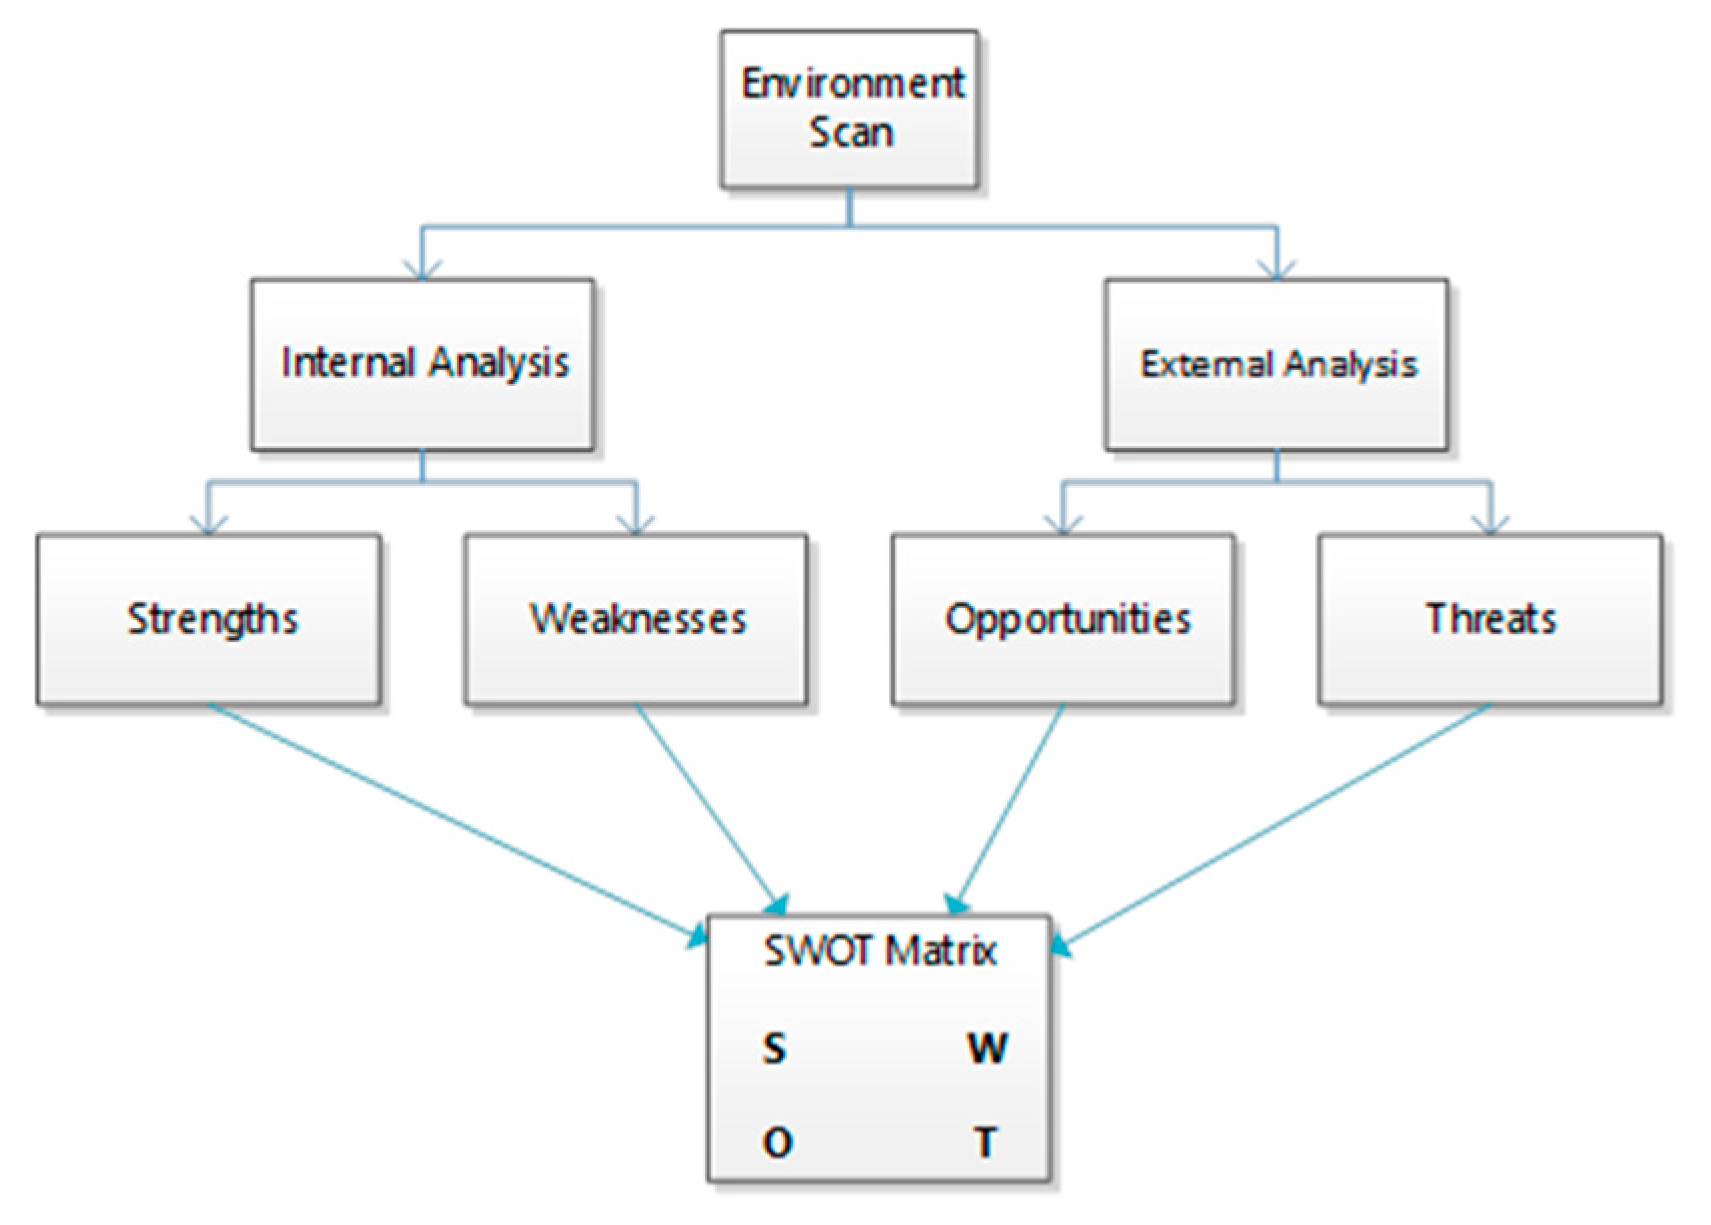
The basis for a SWOT analysis is therefore a systematic process that allows for the space to identify factors that influence a strategy or a product. In addition to the collection of data and information, these are subjectively evaluated and logically ordered. This finally makes the presentation, interpretation, discussion and derivation of decisions more feasible. It builds upon the outcome of an environment scan [77,78] as displayed in Figure 1.
It should be noted that the SWOT approach comprises no methods of analytically defining the weight of the factors or of evaluating the decision alternatives with regard to the factors [79]. Recent studies link SWOT with the analytic hierarchical process concept in order to compare more detailed elements and provide a quantitative basis in the strategic planning process. The analytic hierarchical process concept is an effective decision-making technique primarily when subjectivity is present and it is appropriate problem-solving where the decision factors can be organized hierarchically and divided into sub-sections [80].
The SWOT analysis technique has already been applied to energy research including renewable energy policy planning and review [81,82,83,84,85,86], which focus some similar questions to the present study, but in different regional frameworks. The objective in the SWOT analysis being undertaken for the RLS regions is to identify the role of renewable energy within the energy transitions envisaged by the RLS regions. Our analysis is based on a matrix. The starting point is a blank matrix, which is divided into four segments (strengths, weaknesses, opportunities, threats) as displayed in Table 2.
Standard SWOT analysis methodology shows that filling in the sections can be done by interviews with experts, brainstorming, data analysis and literature reviews. We rely on the consultations with scientific and policy expert stakeholders from the seven partner regions through strategic conference calls and meetings [87] of the RLS-Energy Network and the RLS Energy Network’s monitoring report [88] which illustrates data and information on renewable energy with regard to the regulatory framework, status quos, potentials and research and development activities in the RLS regions. The consultations with scientific experts on regional energy transitions included requests for and the provision of regional data, review and completion of the SWOT matrix, expert presentations of energy transitions in the regions, and exchanges on the analysis throughout its development. In some cases policy stakeholders from the regions were engaged during dedicated science-policy interface meetings, while in others they were asked to provide data, review the SWOT matrix, and offer feedback on the development of the SWOT analysis.

4. Results and Discussion

In Section 4.1 to 4.4, related arguments for the SWOT analysis are summarized and categorized according to their significance, starting with the most significant argument. The listings of arguments, as well as their ranking, are subjective but they nevertheless reflect the collected data and information for the RLS regions.

4.1. Internal Strengths

4.1.1. Usage of Renewable Energy for Electricity, Heat and Fuels

A central strength is that the RLS partner regions, as they seek to move towards a cleaner and more sustainable energy mix, exhibit an intensified use of renewable energies. As outlined in Section 2, the regions are very diverse in terms of their population, geography and size, and their economic, social and political characteristics, and, therefore, in their energy systems. A monitoring of publicly available data and information revealed that the RLS partner regions include all main renewable energy sources in their collective energy portfolio and have already implemented large capacities at high growth rates in the past [88]. The RLS regions integrate wind, solar, biomass, hydro and geothermal resources into their regional energy systems and, thereby, generate electricity (Table 3), heat (Table 4) and fuel (Table 5) [88]. This shows that the RLS regions’ energy systems have common strengths as they make progress in the implementation of renewable energy technologies.

4.1.2. Potentials of Renewable Energy Resources

In addition to the current status of renewable energy endowment and deployment, untapped renewable energy sources are also a strength for the supporting role of renewable energy in a regional energy transition. The availability of certain renewable energy resources allows for long-term planning with regard to the regional energy transitions. Within the monitoring activities, potentials for particular renewable energy sources were detected. Following Verbruggen et al. [97], most studies favor theoretical, geographical, or technical potentials, and their evaluation of policy relevant potentials is minimal. A specific concept of renewable energy resource potentials could not be applied in this case due to limited data availability. The displayed potentials in Table 6 refer mainly to targets of particular renewable energy sources within regional strategies.

4.1.3. Legal Frameworks and Instruments for Renewable Energy

The governments of several RLS partner regions intend to implement incentives for the use of renewable energies and have installed programs and instruments to this end. Research and development programs as well as political strategies have been created to support the achievement of these targets (see Table 7). The targets aim at increasing the share of renewable or low-carbon energy in the power generation mix. These targets relate to specific technologies or general objectives and are integrated, for example, in existing legislation and are defined in roadmaps and policy documents [88]. The motivation in supporting the expansion of renewable energy by governments is the contribution of renewable energy to national and regional energy supply, economic growth and employment through the establishment or consolidation of a regional renewable energy industry and the simultaneous reduction of greenhouse gas emissions and other associated environmental benefits.

4.1.4. Research and Development

Research and development (R&D) play a significant role in the expansion of renewable energy and its cost efficiency. The combination of research and concrete demonstration activities, e.g., by industry, can strengthen the use of renewable energy as a strategy for avoiding climate change and satisfying the growing demand for energy. In order to achieve the ambitious targets for renewable energy, numerous R&D activities have been implemented in the RLS partner regions [88]. The monitoring report on renewable energies in the RLS partner regions [88] outlines these activities. It shows that R&D activities by stakeholders from science and industry take place in the field of renewable energies focusing on technology development, environmental impacts and socioeconomic issues.

4.1.5. Expertise in Renewable Energy Storage and System Integration

Energy transitions, in which the expansion of renewable energy is an important pillar, must take into account all components of the energy system—starting with generation through to usage and ending with storage.
The success of the transition depends not only on how cost-efficiently electricity and heat can be produced by renewable energy sources as their storage of renewable energies is also crucial. This storage of renewable energy can take place using pumped storage, batteries (as short-term storage), chemical storage, power-to-gas and green hydrogen. For heat, highly efficient storage is a possibility. The integration of renewable energy and sufficient storage components can minimize the costs of the transition to a renewable energy-led future and lead to an acceleration of the process [105,106]. A look at the potentials and possible uses of bioenergy shows that bioenergy can be used where alternatives for direct electrification are lacking. These include, for example, the generation of process heat in industry and biofuels for heavy-duty, marine or air traffic. Bioenergy is thus a strong link between the electricity, heating, transport and industrial sectors. In addition, bioenergy plants can generate heat and electricity according to demand. The optimal role of energy storage depends on the current energy system landscape and future developments in the individual RLS partner regions [88].
In order to increase the efficiency of the energy system and develop storage possibilities, a stronger coupling of the energy, heating and transport sectors is indispensable. The aim is that not only the electricity sector will switch to renewable energies, but also the heating and transport sectors will place greater emphasis on the use of renewable energies. Future scenarios for the provision of energy, where energy needs are mainly covered by renewable sources, are based on the assumption that there is a strong link between electricity, gas and/or heat. The idea of these hybrid grids is that losses in one energy system are a possible usable source for another grid [107,108]. Power-to-gas and fuel cells are examples of technologies that enable stronger interconnections between particular grids. Based on these, there are possibilities for storage and grid balancing in a system with intermittent power generation [109,110,111]. Hence, the concept of hybrid grids is built on energy network components which allow the integration of different grids and the bidirectional interaction, if technically feasible [112].
For the successful operation and development of hybrid grids, however, it is important that energy nodes (transitions from one network to another) are implemented and function effectively. Based on the monitoring report on energy transition in the RLS regions [88], the following technologies qualify for this:
  • Electrolysis plants for producing hydrogen from water
  • Storage of hydrogen in gas storages
  • Methanation as part of carbon capture and utilization
  • High temperature heat pumps
  • Seasonal thermal storage for the integration of waste heat
  • Battery storage
  • Installations for the recovery of biogenic waste materials for the production of electricity, heat and fuels
  • Information and communication infrastructures, for example to facilitate demand-side management.
The Monitoring Report of the RLS-Energy Network [88] offers an overview of the renewable energy capacities across the seven RLS partner regions, based on existing data. It demonstrates, that research and development activities with regard to new and developing technologies, i.e., advanced storage, fuel cells and grid systems are taking place in all of the seven partner regions and take a significant part in the transformation of the regions’ energy systems. The further development and existing partial use of these components and technologies in the RLS regions is taking place on the basis of research and real applications [88].

4.2. Internal Weaknesses

4.2.1. Dependence on Fossil Energy

Fluctuating oil and gas commodity prices have impacts on economies that import fossil fuels, and can affect balance of payments and increase vulnerability in terms of both economic and energy security. Security of energy supply can be threatened by unstable energy markets due to geopolitical events or other external shocks. A high concentration of fossil energy in the final energy consumption further increases this risk. Hence, renewable energy can contribute to enhancing security of supply when displacing fossil fuels. The examination of gross energy consumption reveals certain levels of fossil energy dependence in selected RLS regions due to a share of fossil energy within their energy consumption as displayed in Figure 2.

4.2.2. Energy-Intensive Industrial Structures

Currently, the energy-intensive industry accounts for about one third of global energy consumption, while producing aluminum, steel, building materials, paper, glass, fertilizers and plastics. They contribute significantly to industrial processes which are responsible for the global emission of 37.1 billion tons of CO2 in 2018 [115]. According to Allwood et al. [116], demand for manufactured goods is expected to at least double by 2050. This results in a strong discrepancy between the desired reduction of CO2 emissions in and the simultaneously increasing demand for goods from energy-intensive industries. Therefore, the integration of low CO2 technology into energy-intensive industries seems to be essential.
As outlined in Nabernegg et al. [117], there exist various options to decarbonize energy-intensive industries, including: (i) intensifying energy efficiency; (ii) switching from fuel combustion to electricity; (iii) substituting fossil fuels by renewables; (iv) replacing raw material inputs or by changing the process itself; (v) product innovations; and (vi) carbon sequestration and reuse. The best available energy efficiency technologies can only diminish CO2 emissions by 15–30% in energy-intensive industries, even if they are implemented on a large scale [118]. For an even greater reduction, the use of “breakthrough technologies” in core processes of energy-intensive industry or the provision of the resulting investments would be necessary. Continuous investments and technical development are necessary to make these technologies technically and financially feasible in the future [119].
As displayed in Figure 3, industries contribute significantly to the final energy consumption of selected RLS regions. For example, the data for Upper Austria indicates a high share of the energy-intensive sector on final energy consumption. Similarly, in Québec, the extremely energy-intensive aluminum and nonferrous metals industry accounts for 31% of the energy consumption of the industrial sector [93].

4.2.3. Limited Grid Access for Renewables

The integration of large amounts of electricity from renewable sources to the grid requires new approaches to grid expansion and operation. Since renewable resources are highly variable due to weather fluctuations, they can generate uncertainties in capacity. Even today, network expansion is not keeping pace with the expansion of renewable energy generation capacity. Insufficient network capacities lead to bottlenecks in the transport network, which in turn often leads to “redispatch measures”. This involves shutting down cost-efficient power plants in parts of the grid with excess electricity and ramping up expensive power plants in parts of the grid with a shortage of electricity. The preferred approach is to balance the potential of decentralized regenerative feed-in via efficient and flexible distribution networks (keyword: smart grids) and modern transport networks. In addition to pure electricity networks, gas and heat networks and their interactions with the electricity network will gain in importance in the future as renewable energies continue to be integrated at ever higher rates (see Section 4.1.5).

4.3. External Opportunities

4.3.1. Green Economy

Economic growth and employment are currently on top of the political agendas of the RLS regions. The green economy is an economic system oriented towards ecological sustainability, economic profitability and social inclusion that does not exceed physical limits in the medium and long term and secures employment. To achieve this, the transformation of the economic system into a sustainable economy that is both competitive and sustainable must be environmentally and socially compatible as well. This “greening” of the current economic system is a first important step towards ecological, economic and social sustainability and achieving social objectives [120].
The major theme of the green economy is economic activities aimed at preserving and restoring the ecological system. Products and services of a green economy are (i) environmentally friendly and sustainable, (ii) based on renewable energies, (iii) include environmentally friendly fuels and modes of transport and (iv) are energy efficient. Further, the following criteria apply to the processes by which these products and services are produced: (i) energy-efficient production, distribution and design, (ii) reduction of energy, materials and water consumption through high efficiency and (iii) change from CO2-intensive technologies to technologies which are less so.
In order to achieve the medium- to long-term climate objectives, an immediate and permanent decoupling of economic development and greenhouse gas emissions is necessary. Such a decoupling, which also creates sufficient employment (see Section 4.3.2), is difficult to achieve without a fundamental transformation of the energy, economic and social system. By implementing the strategies of the green economy, using a targeted and intelligent mix of environmental framework conditions, long-term, ecologically oriented employment relationships can be created or maintained.
As displayed in Table 8, the data for Upper Austria in 2017 in the area of environmentally-oriented production and services show an environmental turnover of €6.9 billion.

4.3.2. Green Jobs

Renewable energy has a verified impact on job creation. The positive effect on job creation of renewable energy is a consequence of long and diverse supply chains, labor intensity, and high net profit margins [122,123]. OECD’s work on small and medium-sized enterprises (SMEs), entrepreneurship and innovation [124] indicates that there will be a requirement for new types of skills to match novel categories of employment, as industry shifts to a low-carbon economy. The number of green and silver jobs—those which work in sectors which support ageing demographics—is estimated to increase and there will be a noticeable change towards business services jobs in advanced economies [125]. These high-level green skills will be required to adapt to the green transformation of the economy. Green skills comprise specific skills to adapt products, services or operations due to climate change.
Of course, as the demand for energy from renewable sources grows, a corresponding decrease in the demand for oil, coal, and gas can be expected. However, studies demonstrate that renewable energy projects can counterbalance job losses from a decline in extractive industries and can in turn create a net employment expansion [126]. Ortega et al. [127] explains that the additional jobs created can be measured as gross jobs or net jobs. Gross jobs are the total number of jobs created. Net jobs take into account jobs lost in other sectors (which use competing generation technologies) as well as jobs created. It is important to note that in cases where this has been successful, targeted policy approaches have included a sensitivity towards the geographic and demographic concentrations of workers in fossil fuel intensive industries, and have included dedicated efforts to support these workers and regions in their transitions to green economy activities [126]. Such efforts are often referred to as a “just transition”, which is generally defined as an effort not only to prevent large scale job losses and severe economic consequences for areas with industries which are no longer in operation, but to improve quality of life and work for those in the area while securing a sustainable future for generations to come [128]. In this way, the green economy concept is comprehensive in its targeting of economic, social, and environmental aspects.
As displayed in Section 4.1, renewable energy is a major key for the undergoing energy transitions in the RLS regions and is being extended continuously. These developments have led to an increase in employment in the renewable energy sector. As an example, current data of renewable energy employment and green jobs for Bavaria [129] and Upper Austria [121] are displayed in Table 9 and Table 10. Further, in Québec, the public utility managing the generation, transmission and distribution of electricity (Hydro-Québec) employs nearly 20,000 people [130] and the wind turbine sector employs around 5000 people [131]. An estimation of 3600 permanent jobs is envisioned from the development of the biomass heating value chain [132]. For Shandong, the renewable energy equipment manufacturing industry will provide more than 300,000 jobs [100].

4.3.3. Contributions to Climate Protection

Renewable energy plays a key role in the decarbonization process of energy systems and the mitigation of resulting climate change effects. Demand for energy and related services, particularly to support social and economic development, as well as to advance human welfare and health, is growing Energy is used by humans to cover basic needs, e.g., lighting, cooking, space heating, mobility, communication, and is utilized in production processes. The consumption of fossil fuels has increased since 1850, which has led to an increase in global anthropogenic greenhouse gas emissions [133]. CO2 emissions of the RLS regions are displayed in Table 11 and Figure 4.
There are multiple options for lowering greenhouse gas emissions from the RLS energy systems while still satisfying energy demands. Besides options such as energy conservation and efficiency, fossil fuel switching, nuclear energy and carbon capture and storage, the deployment of renewable energy is a major strategy. For example, in Bavaria the state government has committed public administration at the state and municipal levels to climate neutrality by 2030, and plans to achieve this via the integration of increased renewable energy and renovations. Specifically, solar photovoltaic installations are to be added onto public buildings to provide renewable power [134].

4.3.4. Technological Innovation and Industry 4.0

Technological innovations, which comprise for example higher efficiencies of solar photovoltaic modules and wind turbines, have played a central role in speeding up the implementation of renewables in the electricity sector. As indicated by the International Renewable Energy Agency [139,140], opportunities to integrate renewable energy more into energy-intensive sectors arise, for example, from next-generation biofuels and green hydrogen. Furthermore, developments in the areas of digitalization and energy storage must also be taken into account [141]. Digital technologies and concepts such as blockchain, smart grid, artificial intelligence or big data offer great opportunities for this. Opportunities exist above all for renewable energies, because digital technologies make it possible to analyze weather and consumption data and thus increase the security of supply from solar and wind energy. Intelligent storage systems will automatically store energy when it is needed and at the same time automatically deliver energy to consumers, but also to the energy system when energy is needed to balance or maintain the grid voltage. Another focus is on decentralized energy supply and energy trading, which is where digitalization can play an increasing role. Consumers and producers can use digital technologies to negotiate the price of renewable electricity with each other at any time of day and in any weather, independent of a centralized system.
Industry 4.0. plays an important role in combating climate change and supporting economic progress by providing access to clean energy. As pointed out by the United Nations Industrial Development Organization [142], the sustainable energy transition and Industry 4.0 share central characteristics that can be combined to implement a sustainability transition: both are stimulated by technological innovation, rely on the progress of new appropriate infrastructures and regulations and provide possibilities for new business models. The new technologies in the framework of Industry 4.0 may offer opportunities for the increased utilization of renewable energy in manufacturing, abatement of carbon emissions, enhanced energy-use, increased productivity and cost savings at a large scale. A wide-ranging change in manufacturing, production, energy efficiency and renewable energy can be achieved by two development concepts: “transforming” and “leapfrogging” [142]. Transforming towards Industry 4.0 includes modernizing existing industrialized systems with Industry 4.0 technologies that offer more sustainable solutions. Standardization, partnerships and liable regulations can be enabled to maximize the economic, social and environmental possibilities of Industry 4.0. Alternatively, leapfrogging may offer an opportunity to push forward industrialization in developing regions without running the risks of historical development paths. Regions that are less developed can develop, for example, smart factories or decentralized microgrids, among other examples of leapfrogging possibilities [142]. In the case of leapfrogging, technology transfer and capacity building are key examples of where international cooperation, including at the regional level, can have important impacts [143,144]. Both technology transfer and capacity building have been included in the Kyoto Protocol and the Paris Agreement as important mechanisms to support sustainable development while working to mitigate climate change. The digital transition offers an important opportunity to benefit from these synergies.
The concept of Industry 4.0 is generally relevant for every industrial sector. However, we argue that the energy industries in the RLS regions will be one of the industrial sectors most affected, as they will be in a transition phase in the coming years. Due to these energy transitions taking place in the RLS regions, intelligent, flexible and decarbonized energy systems are needed that can support and balance increasing energy demand. This will require a comprehensive redesign of the system, which will be complemented by the expansion of the system’s digital components. A number of RLS regions are already making this connection explicit. For example, in Bavaria, the state government announced that clean tech was one of its four key priorities in its 2 billion EUR High Tech Agenda 2020. Clean technology priorities will receive 80 million EUR in funding, alongside other separately funded priorities such as quantum technology and aerospace. Major investments are planned in Québec over the next decade to modernize the electricity grid with new technologies relying on artificial intelligence and enhanced connectivity, in line with the Industry 4.0 trends [145,146].

4.4. External Threats

4.4.1. Demographic Developments

Demand for energy in RLS regions may increase rapidly in the future due to population and economic growth (especially in emerging market economies), as displayed in Figure 5 and Figure 6. Energy security concerns can arise as more consumers require ever more energy resources. This can be compounded by increasing climate variability, as resources are required at greater levels both in terms of intensity and scale.

4.4.2. Lack of Social Acceptance

In addition to technical feasibility and economic efficiency, it is crucial that social factors that influence the social acceptance of renewable energy technologies are also analyzed. Technologies that are technically and economically reasonable may not be well applied due to the lack of awareness of the technology. If society does not adopt the energy turnaround and the associated technologies and projects, ecological goals, such as reducing CO2 emissions, will be harder to achieve.
All electricity production technologies include negative impacts, even if these impacts might be smaller than with other technologies. As decentralized renewable energy plants are being installed more often in a wider variety of locations, there may be conflicts with local communities [149,150,151]. The acceptance of renewable energy technologies depends on general and external factors. Hofmann and van der Gaast [152] argue that wind power, for example, may have a low level of acceptance because it is generally considered inefficient or too expensive and also due to local externalities (noise, landscape changes, ecological effects). It follows that social acceptance should be taken into account in planning in order not to hinder the development of renewable technologies through the lack of social acceptance [152]. In addition, since sociotechnical transitions are in nature a question of societal values, the values of a community are an important aspect of any transition process. Failing to consider these aspects reduces the transition to a technical process, rather than a comprehensive effort addressing the nature of the deep integration of technologies into society.
Assuming that the successful implementation of low-carbon technologies and processes profoundly relies on the society’s acceptance leads to the need to be aware of the factors that influence social approval or resistance. Hofmann and van der Gaast [152] classify these elements as follows: (i) “awareness of climate change and knowledge of the technology (such as renewable energy)”, (ii) “fairness of the decision-making process”; (iii) “overall evaluation of costs, risks and benefits of a technology”; (iv) “local context” and (v) “trust in decision-makers and other relevant stakeholders”. With regard to (iv) and (v), recent studies find that in some cases, trust in the government can be decisive for acceptance and public participation and consequently also for the success of energy system transformation [149,153]. For example, Azarova et al. [149] examine in particular whether the acceptance of renewable energy technologies is influenced by statements from political decision-makers, distinguishing between the local, national and EU levels of politics. For Switzerland, they find empirically that local governments can generate a positive effect on social acceptance by means of declarations. This means that if a Swiss mayor advocates a certain alternative energy technology, the probability that the recommended joint renewable energy project will be favored increases by 2.2%.
Finally, the current RLS regions’ energy transitions induce the necessity of a reconsideration of ethical dilemmas on how to distribute the benefits and costs of scarce energy resources among the citizens. In this context, the concept of energy justice [154,155] should also be mentioned. Energy justice provides a framework by which decisions can be made with regard to energy policy, energy distribution, energy security and climate change. As an alternative to focusing on variables such as economic growth, energy justice theory considers moral aspects on how such decisions might affect individuals now and in the future. It reflects environmental impacts, and also accounts for the social and environmental costs that those decisions might generate. The energy justice framework explicitly and normatively addresses aspects identified in sustainability transitions, namely the value trade-offs and associated consequences of those choices. As outlined in Allen et al. [156], this concept reflects different effects on health and wellbeing of fossil fuel-based energy, inequalities in access to renewable energy, environmental racism, and disproportionate impacts of climate change on vulnerable populations and women. Energy justice focuses on how issues of climate justice, fairness and equity can be incorporated into energy systems’ transitions [157].

4.4.3. Volatility of Renewable Energy Resources

A significant part of the fight against climate change can be fulfilled by integrating renewable energy into the electricity sector. This requires very large amounts of renewable energy, and the volatility of those can pose major challenges. The currently most economically efficient and ecologically effective technologies (wind and solar) are highly alternating, so that a considerable periodic imbalance between energy demand and supply can arise. In order to ensure system security in the future, further grid expansion is necessary at all grid levels, so that regions can be interconnected. In addition to the expansion of renewable energy, there is a simultaneous need to install pumped storage power plants, new gas-fired power plants and new storage technologies for renewable electricity (e.g., battery storage, Power-to-X technologies—See Section 4.1.5.) and to keep conventional power plants as a reserve.

5. Conclusions

The results of the qualitative SWOT analysis for the support of renewable energy within the RLS regions’ energy transitions are summarized in Table 12.
Our study reveals that the (i) current usage of renewable energy for electricity, heat and fuel production, (ii) existing renewable energy potentials, (iii) sound legal frameworks and instruments to support renewable energy, (iv) ongoing research and development activities and (v) the expertise in renewable energy conversion and storage all strengthen the role of renewables within RLS regions’ energy transitions. On the other hand, the fact that (i) fossil fuels still hold a significant share in gross inland energy consumption, (ii) energy-intensive industrial structures continue to be supported by fossil fuels and (iii) grid access is limited for renewables constitute weaknesses. The evaluation of external factors revealed that the deployment of renewable energy in order to facilitate energy transitions may lead to opportunities for (i) implementing or further strengthening regional green economies, (ii) contributing to mitigate climate change and (iii) inducing technological innovations. However, (i) demographic developments, (ii) lack of social acceptance and (iii) the volatility of renewable energy resources threatens the significance of renewable energy in RLS regions’ energy transitions.

6. Recommendations for Policymakers

The role of the RLS governments in guiding and managing regional energy transitions is highly important. The future will likely display an interesting and heterogeneous interaction between regional policies and their planned or already implemented future energy transitions. In addition, each region will be navigating these changes within the larger framework of their federal level legislation and policies, and the international commitments of their national governments. Simultaneously, the choices the regional level of government makes will be impacted by other actors in the sociotechnical system, including civil society actors, industry actors, and research and development and academia. Further, as members of the Regional Leaders Summit and the RLS-Energy Network, the RLS partner regions have the opportunity to exchange with their peers on their experiences with energy transition and share best practices, challenges, and lessons learned while preparing for further shifts.
Regional renewable energy targets and policies across the RLS partner regions vary extensively. On the one hand, the importance of climate action at the national and at the regional levels is increasingly translating into actions to support renewable energy. On the other hand, access to energy, energy security, and industrial development can be key reasons for renewable energy policy and actions. In all RLS partner regions, a focus on regional competitiveness, economic welfare and job creation often shapes policies. Among the political leaders of the RLS partner regions, there is broad agreement on these benefits and the promise brought forward by renewable energy.
The development towards renewable energies has made great progress in recent years, although support at the political level can still be expanded. Additional efforts must be made in order to achieve climate targets through the use of renewable energy, together with energy efficiency measures. In order to make even greater use of the potential of political support, it is essential that the policy measures focus on issues such as technology development, costs, financing, awareness raising, social acceptance and regulatory and institutional arrangements.
Above all, a combination of political measures is needed that are directly related to the use of renewable energy and its integration into the existing energy system. Direct political support for renewable energies in the electricity and end-consumer sectors can be target-oriented, since both account for a large share of final energy consumption and energy-related CO2 emissions.
In general, there is no single instrument that would automatically and equally meet the renewable energy targets in different regions. Political instruments must be defined in such a way that regional and national requirements are taken into account. It should be noted that a long-term approach to these policies generates planning security and trust, which in turn can trigger long-term growth. Hence, the dialogue on best-practice examples of energy policies within the RLS-Energy Network adds value to the RLS regions energy system planning and governance.
At the same time, political decision-makers should take into account developments in market conditions. This helps to remain competitive and continuously integrate renewables into the energy system. During the energy transition, it is essential to constantly consider its effects on society, public and private institutions and the economy in order to counteract obstructive developments in these segments. For this reason, energy system transformations require comprehensive and effective cooperation between all actors.
Competition between renewable energies and subsidized fossil fuels exists in many regions. It results that renewables should be given effective framework conditions for growth. Politicians should therefore ensure that renewables are offered the same framework conditions for further development, production and consumption as other technologies.
In addition, during the transformation process of the energy system, renewable energies must find a place in the daily lives of end users. This can be achieved by measures to promote behavioral changes, e.g., by raising awareness of energy options and use and building resilient livelihoods.

6.1. Conclusions and Recommendations for R&D

The RLS regions’ energy systems, driven by regional energy transitions, could potentially enable the realization of a strong integration of renewables and could cover partially distributed, decentralized energy systems with embedded energy storage, demand side management, and the application of smart technologies. It may also likely contain a large role for electric and renewable hydrogen mobility charged from regional renewable energy sources. Energy transitions are also intricately linked to efforts to enhance energy efficiency of buildings, industries and transportation.
Further progress in the utilization of renewable energy technologies may lead to even more economically efficient and ecologically effective alternatives to fossil energy production. The use of the existing potential (technical, economic) of renewables to meet the energy demand in the RLS regions can trigger economic growth and employment as well as investments in R&D.

6.2. Recommendations with Regard to Green Economy Issues

Alternative economic approaches, which change the current connection between economic growth and fossil energy consumption, are required in the long term to accomplish the necessary decarbonization of the society, regardless of growth limitations. The aim of the green economy is to support and form this transformation via technological, social and economic innovations. The possibilities for this in the RLS regions include many fields of action, such as the careful use of energy, raw materials and other resources, alternative consumer behavior up to and including sustainable mobility and infrastructure.
Hence, growth and employment should focus above all on those sectors that can make significant contributions to a green economy and the associated socioecological transformation. In order to achieve these objectives, a comprehensive green economy strategy should be drawn up and an implementation plan should be drawn up. Monitoring on the basis of reliable indicators (e.g., on the basis of existing OECD recommendations [158]) should also allow regions to check whether the objectives of a comprehensive green economy strategy are being achieved.
In the regional RLS environmental technology industries, successful export initiatives should be continued. Regions should advocate for long-term, ambitious environmental and climate policy objectives should be defined at the national and international levels in order to create suitable framework conditions for companies in the environmental technology industry, while simultaneously developing their own long-term objectives where applicable.
Existing and proven promotional and educational instruments, especially in the field of research and development, should be continued to a greater extent in order to further promote the environmental economy and the environmental technology industries. In order to exploit the opportunities offered by digitization for a more resource-efficient, climate-friendly economy, corresponding research priorities should be set and innovations promoted.
In order to measure the efforts of research and policy, the generation of high-quality data on all relevant aspects of regional energy transitions is suggested. This is ongoing in all regions, and can be expanded to further support evidence-based policy making and the measurement of the regional energy transition across all RLS regions. Data collection is a critical component for tracking energy transitions and the impacts thereof across all aspects.

6.3. Recommendations with Regard to Social Acceptance

Bearing in mind that the realization of renewable energy projects depends to a large extent on their social acceptance, it is crucial to evaluate the social effects of setting up and expanding certain technologies of renewable energy as part of a wider energy transition. With regard to renewable energy project planning and development, societal acceptance should be taken in to account by the project developers, as well as related local and regional RLS government policy makers. A higher level of social acceptance can be triggered via participation of the regional community in organizational and development processes, or even through (co-)ownership [152]. Further, policymakers should consider social acceptance as one of the crucial aspects in the predictableness of clean energy technology investments. Instruments for creating and further strengthening social acceptance include public campaigns, strategies for information and transparency, and direct support measures.

Author Contributions

Conceptualization, S.G. and F.R.; methodology, S.G.; validation, S.G., F.R., S.F., L.G., G.M.J., R.D.M.G., S.M.S.S. and R.W.; investigation, S.G., F.R., S.F., L.G., G.M.J., R.D.M.G., S.M.S.S. and R.W.; data curation, S.G., F.R., S.F., L.G., G.M.J., R.D.M.G., S.M.S.S. and R.W.; writing—original draft preparation, S.G. and F.R.; writing—review and editing, S.G., F.R., S.F., L.G., G.M.J., R.D.M.G., S.M.S.S. and R.W.; visualization, S.G.; supervision, S.G.; project administration, S.G. and F.R. All authors have read and agreed to the published version of the manuscript.

Funding

The author from Upper Austria gratefully acknowledge the financial support of the RLS-Energy Network’s roadmap by the Upper Austrian Government and the Energieinstitut at the Johannes Kepler University of Linz.

Data Availability Statement

The region-specific data can be assessed from the cited references and the Monitoring Report on Renewable Energy in the RLS Regions [88].

Acknowledgments

The authors would like to thank Florence Gauzy, Ralf Ludwig, Reinhart Schwaiberger, Costas Simoglou, Simon Barnabé, Kodjo Agbossou, Keng Chung, Manuela Prieler, Robert Tichler, Lauren Basson and the RLS-Sciences political coordinators for their valuable contributions and discussions through strategic conference calls and expert meetings of the RLS-Energy Network in São José dos Campos in May 2019 and Québec City in November 2019. The authors also acknowledge two anonymous reviewers for helpful comments on an earlier version of the paper.

Conflicts of Interest

The authors declare no conflict of interest.

References

  1. IEA. Renewables 2019; International Energy Agency: Paris, France, 2019. [Google Scholar]
  2. IRENA. Renewable Energy Target Setting; International Renewable Energy Agency: Abu Dhabi, UAE, 2015. [Google Scholar]
  3. IRENA. Untapped Potential for Climate Action: Renewable Energy in Nationally Determined Contributions; International Renewable Energy Agency: Abu Dhabi, UAE, 2017. [Google Scholar]
  4. IRENA. Opportunities to Accelerate National Energy Transitions Through Advanced Deployment of Renewables (Report to the G20 Energy Transitions Working Group); International Renewable Energy Agency: Abu Dhabi, UAE, 2018. [Google Scholar]
  5. REN21. Renewables 2018 Global Status Report; REN 21 Secretariat: Paris, France, 2018. [Google Scholar]
  6. IRENA. Renewable Capacity Highlights; International Renewable Energy Agency: Abu Dhabi, UAE, 2019. [Google Scholar]
  7. Smith, A. Emerging in between: The multi-level governance of renewable energy in the English regions. Energ Policy 2007, 35, 6266–6280. [Google Scholar] [CrossRef]
  8. Truffer, B.; Murphy, J.; Raven, R. The geography of sustainability transitions: Contours of an emerging theme. Environ. Innov. Soc. Transit. 2015, 17, 63–72. [Google Scholar] [CrossRef]
  9. IRENA. Climate Change and Renewable Energy: National Policies and the Role of Communities, Cities and Regions (Report to the G20 Climate Sustainability Working Group (GCSWG)); International Renewable Energy Agency: Abu Dhabi, UAE, 2019. [Google Scholar]
  10. 2018 Talanoa Dialogue Platform. Available online: https://unfccc.int/process-and-meetings/the-paris-agreement/the-paris-agreement/2018-talanoa-dialogue-platform (accessed on 17 January 2020).
  11. United Nations Climate Change Secretariat. Global Climate Action 2018—Examples of Good Practice; United Nations Climate Change Secretariat: Bonn, Germany, 2018. [Google Scholar]
  12. The European Climate Initiative (EUKI). Available online: https://www.euki.de/en/ (accessed on 17 January 2020).
  13. CSWG. G20 Experiences on Climate and Energy; G20 Climate Sustainability Working Group: Buenos Aires, Argentina, 2018. [Google Scholar]
  14. The Vertical Integration and Learning for Low-Emission Development (V-LED) Project. Available online: https://www.localclimateaction.org/ (accessed on 17 January 2020).
  15. Energy Innovation Partners with China-California Collaboration on Cities and Climate. Available online: https://energyinnovation.org/2015/02/27/energy-innovation-partners-with-china-california-collaboration-on-cities-and-climate/ (accessed on 20 February 2020).
  16. RLS-SCIENCES. Available online: https://www.rls-sciences.org/ (accessed on 20 February 2020).
  17. RLS International Seminar on Biomass, Biogas and Energy Efficiency in São Paulo. Available online: https://www.rls-sciences.org/uploads/5/5/4/4/55448469/report-_international_seminar_on_biomass_biogas_and_energy_efficiency.pdf (accessed on 17 January 2020).
  18. The Regional Leaders Summit. Available online: https://www.mrif.gouv.qc.ca/en/relations-du-quebec/regions-et-etats-federes/relations-multilaterales/regions-partenaires (accessed on 17 January 2020).
  19. Conferences. Available online: https://www.mrif.gouv.qc.ca/content/documents/fr/Declaration-joint-ninth-conference-05-18.pdf (accessed on 17 January 2020).
  20. Markada, J.; Raven, R.; Truffer, B. Sustainability transitions: An emerging field of research and its prospects. Res. Policy 2012, 41, 955–967. [Google Scholar] [CrossRef]
  21. Geels, F. Ontologies, socio-technical transitions (to sustainability), and the multi-level perspective. Res. Policy 2010, 39, 495–510. [Google Scholar] [CrossRef]
  22. Unruh, G. Understanding carbon lock-in. Energ Policy 2000, 28, 817–830. [Google Scholar] [CrossRef]
  23. Bache, I.; Flinders, M. Multi-Level Governance; Oxford University Press: Oxford, UK, 2004. [Google Scholar] [CrossRef]
  24. Statistik, D.A. Available online: https://www.statistik.bayern.de/statistik/index.html (accessed on 10 May 2020).
  25. Current Population Survey. Available online: https://www.census.gov/programs-surveys/cps.html (accessed on 10 May 2020).
  26. Regional Data: GDP & Personal Income. Available online: https://apps.bea.gov/iTable/index_regional.cfm (accessed on 10 May 2020).
  27. State Carbon Dioxide Emissions Data. Available online: https://www.eia.gov/environment/emissions/state/ (accessed on 10 May 2020).
  28. Estimations de la Population (Septembre 2019). Adapté par l’institut de la Statistique du Québec. Available online: http://www.environnement.gouv.qc.ca/changements/ges/ (accessed on 10 May 2020).
  29. Gross Domestic Product (GDP) at Basic Prices¹ by Industry, Montréal and All of Québec, 2013–2017. Available online: https://www.stat.gouv.qc.ca/statistiques/profils/profil06/econo_fin/conj_econo/cptes_econo/pib_induindus06_an.htm/ (accessed on 10 May 2020).
  30. Inventaire québécois des Émissions de Gaz à Effet de Serre en 2016 et Leur Évolution Depuis 1990. Available online: http://www.environnement.gouv.qc.ca/changements/ges/ (accessed on 10 May 2020).
  31. Population Estimates Sent to TCU with Reference Date. 2017. Available online: https://www.ibge.gov.br/estatisticas/sociais/populacao/9103-estimativas-de-populacao.html?edicao=16985&t=resultados (accessed on 10 May 2020).
  32. Secretariat for Infrastructure and Environment. Energy Balance of the State of São Paulo 2019; Government of the State of São Paulo: São Paulo, Brazil, 2019.
  33. Gross Domestic Product. Available online: https://www.ibge.gov.br/explica/pib.php (accessed on 10 May 2020).
  34. Sistema de Estimativas de Emissões de Gases de Efeito Estufa. 2018. Available online: https://plataforma.seeg.eco.br/total_emission (accessed on 10 May 2020).
  35. Annual by Province. Available online: http://data.stats.gov.cn/english/index.htm (accessed on 10 May 2020).
  36. Li, L.; Yang, J. A new method of energy-related carbon dioxide emissions estimation at the provincial-level: A case study of Shandong Province, China. Sci. Total Environ. 2020, 700, 134384. [Google Scholar] [CrossRef]
  37. Shan, Y.; Huang, O.; Guan, D.; Hubacek, K. China CO2 emission accounts 2016-2017. Sci. Data 2020, 54, 1–9. [Google Scholar] [CrossRef] [Green Version]
  38. Volkszählungen, Registerzählung, Abgestimmte Erwerbsstatistik. Available online: https://www.statistik.at/web_de/statistiken/menschen_und_gesellschaft/bevoelkerung/volkszaehlungen_registerzaehlungen_abgestimmte_erwerbsstatistik/index.html (accessed on 10 May 2020).
  39. Regionales BIP und Hauptaggregate Nach Wirtschaftsbereichen und Bundesländern. Available online: https://www.statistik.at/web_de/statistiken/wirtschaft/volkswirtschaftliche_gesamtrechnungen/regioregi_gesamtrechnungen/nuts2-regionales_bip_und_hauptaggregate/index.html (accessed on 10 May 2020).
  40. Dell, G. OÖ Energiebericht—Berichtsjahr 2018; Land Oberösterreich: Linz, Austria, 2019. [Google Scholar]
  41. Umweltbundesamt. Klimaschutzbericht 2019; Umweltbundesamt GmbH: Vienna, Austria, 2019. [Google Scholar]
  42. World Population Day. Available online: https://www.westerncape.gov.za/general-publication/world-population-day (accessed on 10 May 2020).
  43. Western Cape Government. Provincial Economic Review and Outlook; The Provincial Treasury: Cape Town, South Africa, 2019.
  44. Western Cape Government. Energy Consumption and CO2 Emissions Database; The Provincial Treasury: Cape Town, South Africa, 2018.
  45. Bayerisches Staatsministerium für Wirtschaft und Medien, Energie und Technologie. Bayerisches Energiekonzept "Energie innovativ. Available online: https://www.stmwi.bayern.de/fileadmin/user_upload/stmwi/Publikationen/2019/2019-09-03_Bayerisches_Energiekonzept.pdf (accessed on 10 May 2020).
  46. Bayerische Staatsregierung, Bayerisches Energieprogramm. Bayerisches Energieprogramm für Eine Sichere, Bezahlbare und Umweltverträgliche Energieversorgung; Bayerisches Staatsministerium für Wirtschaft und Medien, Energie und Technologie: Munich, Germany, 2015.
  47. Bayerische Staatsregierung. Bayerisches Aktionsprogramme Energie: Energie für die Menschen mit den Menschen; Bayerisches Staatsministerium für Wirtschaft und Medien, Energie und Technologie: Munich, Germany, 2019.
  48. Bayerische Staatsregierung. Bayerische Klimaschutzgesetz; Bayerisches Staatsministerium für Umwelt und Verbraucherschutz: Munich, Germany, 2019. [Google Scholar]
  49. Kungl, G.; Geels, F.W. Sequence and alignment of external pressures in industry destabilisation: Understanding the downfall of incumbent utilities in the German energy transition (1998–2015). Environ. Innov. Soc. Transit. 2018, 26, 78–100. [Google Scholar] [CrossRef]
  50. Radzi, A. 1.5—The 100% Renewable Energy Metropolis: Governing the Design of Cities for Renewable Energy Infrastructures. In Urban Energy Transition (Second Edition); Droege, P., Ed.; Elsevier: Amsterdam, The Netherlands; Oxford, UK; Cambridge, MA, USA, 2018; pp. 85–113. [Google Scholar] [CrossRef]
  51. Stadtwerke München GmbH. Annual Report 2019; Stadtwerke München GmbH: Munich, Germany, 2020. [Google Scholar]
  52. Profile Analysis. Available online: https://www.eia.gov/state/analysis.php?sid=GA (accessed on 10 May 2020).
  53. Hydro Québec. Available online: https://www.hydroquebec.com/international/en/ (accessed on 10 May 2020).
  54. Plan D’actions 2013–2020 sur les Changements Climatiques. Available online: http://www.environnement.gouv.qc.ca/changementsclimatiques/plan-action-fonds-vert.asp (accessed on 10 May 2020).
  55. Politique Énergétique. Available online: https://mern.gouv.qc.ca/energie/politique-energetique/ (accessed on 10 May 2020).
  56. COMMUNIQUÉ—Entrée en Vigueur de Nouvelles Normes Écoénergétiques. Available online: https://www.rbq.gouv.qc.ca/salle-de-presse/les-nouvelles/nouvelles-detail/item/2020-06-26-communique-entree-en-vigueur-de-nouvelles-normes-ecoenergetiques.html (accessed on 10 May 2020).
  57. PIB. Available online: https://www.investe.sp.gov.br/por-que-sp/economia-diversificada/pib/ (accessed on 15 July 2020).
  58. Human Development Atlas in Brazil. Available online: http://www.atlasbrasil.org.br/2013/en/home/ (accessed on 15 July 2020).
  59. IBGE. Sistema de Contas Regionais: Brasil 2017; Instituto Brasileiro de Geografia e Estatística: Rio de Janeiro, Brazil, 2019.
  60. EPE. National Energy Balance 2018—Base Year 2017; Empresa de Pesquisa Energética: Rio de Janeiro, Brasil, 2018.
  61. Photovoltaic Sector Incentives. Available online: https://www.infraestruturameioambiente.sp.gov.br/infraestrutura/coordenadorias/coordenadoria-de-energias-eletrica-e-renovaveis/solar/ (accessed on 15 July 2020).
  62. Wind Sector Incentives. Available online: https://www.infraestruturameioambiente.sp.gov.br/infraestrutura/coordenadorias/coordenadoria-de-energias-eletrica-e-renovaveis/eolica/ (accessed on 15 July 2020).
  63. Bradshaw, A.; Jannuzzi, G.M. Governing energy transitions and regional economic development: Evidence from three Brazilian states. Energy Policy 2019, 126, 1–11. [Google Scholar] [CrossRef]
  64. BRAZIL. Available online: https://www-pub.iaea.org/MTCD/Publications/PDF/cnpp2018/countryprofiles/Brazil/Brazil.htm (accessed on 18 December 2020).
  65. Zhang, Y.; Liu, C.; Li, K.; Zhou, Y. Strategy on China’s regional coal consumption control: A case study of Shandong province. Energy Policy 2018, 112, 316–327. [Google Scholar] [CrossRef]
  66. Landesenergiestrategie ENERGIELEITREGION OÖ 2050. Available online: https://www.land-oberoesterreich.gv.at/186952.htm (accessed on 15 January 2020).
  67. Dell, G. Oberösterreichische Energiestrategie "Energie Leitregion OÖ; Amt der oberösterreichischen Landesregierung: Linz, Austria, 2017. [Google Scholar]
  68. Provincial Strategic Plan 2014—2019. Available online: https://www.westerncape.gov.za/text/2015/October/western_cape_provincial_strategic_plan_2014-2019.pdf (accessed on 15 July 2020).
  69. Lawrence, A. Eskom and the Dual Character of the South African State. In South Africa’s Energy Transition, Progressive Energy Policy; Palgrave Pivot: Cham, Switzerland, 2020; pp. 59–83. [Google Scholar] [CrossRef]
  70. Western Cape Government. Green Economy Report; The Provincial Treasury: Cape Town, South Africa, 2015.
  71. GreenCape—Supporting the Business of Green. Available online: https://www.green-cape.co.za/about-us/ (accessed on 15 July 2020).
  72. 110% Green. Available online: https://www.westerncape.gov.za/110green/ (accessed on 15 July 2020).
  73. Villa, A.; Antonelli, D. A Road Map to the Development of European SME Networks: Towards Collaborative Innovation; Springer Science & Business Media: London, UK, 2008. [Google Scholar] [CrossRef]
  74. Weihrich, H. The TOWS matrix: A tool for situational analysis. Long Range Plan. 1982, 15, 54–66. [Google Scholar] [CrossRef]
  75. Hill, T.; Westbrook, R. SWOT analysis: It’s a product recall. Long Range Plan. 1997, 30, 46–52. [Google Scholar] [CrossRef]
  76. Valentin, E. SWOT analysis from resource-based view. J. Mark. Theory Pract. 2001, 9, 54–68. [Google Scholar] [CrossRef]
  77. Kahraman, C.; Demirel, N.; Demirel, C.; Ates, N. A SWOT-AHP application using fuzzy concept: E-government in Turkey. In Fuzzy Multi-Criteria Decision Making; Kahraman, C., Ed.; Springer: Boston, MA, USA, 2008; pp. 85–117. [Google Scholar] [CrossRef]
  78. Görener, A.; Toker, K.; Ulucay, K. Application of Combined SWOT and AHP: A Case Study for a Manufacturing Firm. Procedia Soc. Behav. Sci. 2012, 6, 1525–1534. [Google Scholar] [CrossRef] [Green Version]
  79. Kangas, J.; Kurtilla, M.; Kajanus, M.; Kangas, M. Evaluating the management strategies of a forestland estate—The S-O-S approach. J. Environ. Manag. 2003, 69, 349–358. [Google Scholar] [CrossRef]
  80. Saaty, T. The Analytical Hierarchy Process; McGraw-Hill: New York, NY, USA, 1980. [Google Scholar] [CrossRef]
  81. Terrados, J.; Almonacid, G.; Hontoria, L. Regional energy planning through SWOT analysis and strategic planning tools. Impact on renewables development. Renew. Sustain. Energy Rev. 2007, 11, 1275–1287. [Google Scholar] [CrossRef]
  82. Markoska, N.; Taseska, V.; Pop-Jordanov, J. SWOT analyses of the national energy sector for sustainable energy development. Energy 2009, 34, 752–756. [Google Scholar] [CrossRef]
  83. Inglinski, B.; Piechota, G.; Chichosz, M.; Buczkowski, R. The study on the SWOT analysis of renewable energy sector on the example of the Pomorskiw Voivodeship (Poland). Clean Tech. Environ. Policy 2016, 18, 45–61. [Google Scholar] [CrossRef]
  84. Chen, W.M.; Kim, H.; Yamaguchi, H. Renewable energy in Eastern Asia: Renewable energy policy review and comparative SWOT analysis for promoting renewable energy in Japan, South Korea, and Taiwan. Energy Policy 2014, 74, 319–329. [Google Scholar] [CrossRef]
  85. Shi, X. The future of ASEAN energy mix: A SWOT analysis. Renew. Sustain. Energy Rev. 2016, 53, 672–680. [Google Scholar] [CrossRef]
  86. Kamran, M.; Fazal, M.; Mudassar, M. Towards empowerment of the renewable energy sector in Pakistan for sustainable energy evolution: SWOT analysis. Renew. Energy 2020, 146, 543–558. [Google Scholar] [CrossRef]
  87. RLS-ENERGY NETWORK. Available online: https://www.rls-energynetwork.org/ (accessed on 31 January 2020).
  88. Goers, S.; Prieler, M.; Steinmüller, H. Monitoring Report on Renewable Energy in the RLS Regions; Energieinstitut at the Johannes Kepler University of Linz: Linz, Austria, 2018. [Google Scholar]
  89. Department of Energy. Independent Power Producers Procurement Programme (IPPPP); IPPPP Office: Centurion, South Africa, 2019. [Google Scholar]
  90. Bayerisches Staatsministerium für Wirtschaft, Landesentwicklung und Energie. Monitoringbericht zum Umbau der Energieversorgung Bayerns; Bayerisches Staatsministerium für Wirtschaft, Landesentwicklung und Energie: Munich, Germanay, 2019.
  91. Electricity. Available online: https://www.eia.gov/electricity/ (accessed on 31 March 2020).
  92. Production de L’énergie Électrique, Production Mensuelle Selon le Type D’électricité. Available online: https://www150.statcan.gc.ca/t1/tbl1/fr/cv.action?pid=2510001501#timeframe (accessed on 31 January 2020).
  93. Whitmore, J.; Pineau, P.O. État de L’énergie au Québec 2019; Chaire de Gestion du Secteur de L’énergie, HEC Montréal: Montréal, QC, Canada, 2019. [Google Scholar]
  94. EPE. National Energy Balance 2016—Base Year 2015; Empresa de Pesquisa Energética: Rio de Janeiro, Brazil, 2016.
  95. Shandong 2017 Newly Installed New Energy Capacity Surges 81.85% YoY. Available online: http://www.sxcoal.com/news/4567035/info/en (accessed on 21 January 2020).
  96. Department of Energy Statistics. China Energy Statistical Yearbook 2018; China Statistics Press: Beijing, China, 2018.
  97. Verbruggen, A.F.M.; Moomaw, W.; Weir, T.; Nadaï, A.; Nilsson, L.; Nyboer, J.; Sathaye, J. Renewable energy costs, potentials, barriers: Conceptual issues. Energy Policy 2010, 38, 850–861. [Google Scholar] [CrossRef]
  98. Vereinigung der Bayerischen Wirtschaft. Monitoring der Energiewende; Vereinigung der Bayerischen Wirtschaft: Munich, Germany, 2020. [Google Scholar]
  99. de Energia, S. Plano Paulista De Energia: PPE 2020; Secretaria de Energia: São Paulo, Brazil, 2012.
  100. Liu, H.; Chi, Y.; Xue, L.; Xu, D.; Li, J. Research on Renewable Energy in Shandong Province. Adv. Eng. Res. 2017, 112, 79–83. [Google Scholar]
  101. Austrian Energy Agency. Energie-Leitregion OÖ 2050—Analyse zum Stand der Umsetzung und Optionen für die Strategische Weiterentwicklung, Sowie Potenzial für Zusätzliche Stromerzeugung aus Erneuerbaren; Austrian Energy Agency: Vienna, Austria, 2018. [Google Scholar]
  102. Gesetz für den Ausbau Erneuerbarer Energien. Available online: http://www.gesetze-im-internet.de/eeg_2014/ (accessed on 31 January 2020).
  103. Energy policy in Georgia. Available online: https://ballotpedia.org/Energy_policy_in_Georgia (accessed on 31 January 2020).
  104. Bundesrecht Konsolidiert: Gesamte Rechtsvorschrift für Ökostromgesetz 2012, Fassung vom 19.03.2020. Available online: https://www.ris.bka.gv.at/GeltendeFassung.wxe?Abfrage=Bundesnormen&Gesetzesnummer=20007320 (accessed on 31 January 2020).
  105. Kittner, N.; Lill, F.; Kammen, D. Energy storage deployment and innovation for the clean energy transition. Nat. Energy 2017, 2, 17125. [Google Scholar] [CrossRef]
  106. Child, M.; Bogdanov, D.; Breyer, C. The role of storage technologies for the transition to a 100% renewable energy system in Europe. Energy Procedia 2018, 155, 44–60. [Google Scholar] [CrossRef]
  107. McKenna, R.; Bchini, Q.; Weinand, J.; Michaelis, J.; König, S.; Köppel, W.; Fichtner, W. The future role of Power-to-Gas in the energy transition: Regional and local techno-economic analyses in Baden-Württemberg. Appl. Energy 2018, 212, 386–400. [Google Scholar] [CrossRef]
  108. Qadrdan, M.; Abeysekera, M.; Chaudry, M.; Wu, J.; Jenkins, N. Role of power-to-gas in an integrated gas and electricity system in Great Britain. Int. J. Hydrog. Energy 2015, 40, 5763–5775. [Google Scholar] [CrossRef]
  109. Dawood, F.; Anda, M.; Shafiullah, G. Hydrogen production for energy: An overview. Int. J. Hydrog. Energy 2020, 45, 3847–3869. [Google Scholar] [CrossRef]
  110. Ghaib, K.; Ben-Fares, F.Z. Power-to-Methane: A state-of-the-art review. Renew. Sustain. Energy Rev. 2018, 81, 433–446. [Google Scholar] [CrossRef]
  111. Blanco, H.; Faaij, A. A review at the role of storage in energy systems with a focus on Power to Gas and long-term storage. Renew. Sustain. Energy Rev. 2018, 81, 1049–1086. [Google Scholar] [CrossRef]
  112. Krishna, K.; Kumar, K. A review on hybrid renewable energy systems. Renew. Sustain. Energy Rev. 2015, 52, 907–916. [Google Scholar] [CrossRef]
  113. Energie. Available online: https://www.statistik.bayern.de/statistik/bauen_wohnen/energie/index.html (accessed on 31 January 2020).
  114. Report on Energy Supply and Demand in Canada. Available online: https://www150.statcan.gc.ca/n1/en/catalogue/57-003-X (accessed on 31 January 2020).
  115. Global Industrial Carbon Emissions to Reach All-Time High in 2018. Available online: https://www.nature.com/articles/d41586-018-07666-6#:~:text=Global%20industrial%20emissions%20of%20carbon,international%20consortium%20of%20sscientist%20reports (accessed on 31 January 2020).
  116. Allwood, J.; Cullen, M.; Stephens, J. Options for Achieving a 50% Cut in Industrial Carbon Emissions in 2050. Environ. Sci. Technol. 2010, 44, 1888–1894. [Google Scholar] [CrossRef] [PubMed]
  117. Nabernegg, S.; Bednar-Friedl, B.; Wagner, F.; Schinko, T.; Cofala, J.; Clement, Y. The Deployment of Low Carbon Technologies in Energy Intensive Industries: A Macroeconomic Analysis for Europe, China and India. Energies 2017, 10, 360. [Google Scholar] [CrossRef] [Green Version]
  118. Fischedick, M.; Roy, J.; Abdel-Aziz, A.; Acquaye, A.; Allwood, J.; Ceron, J.P.; Geng, Y.; Kheshgi, H.; Lanza, A.; Perczyk, D.; et al. Industry. In Climate Change 2014: Mitigation of Climate Change. Contribution of Working Group III to the Fifth Assessment Report of the Intergovernmental Panel on Climate Change; Cambridge University Press: Cambridge, NY, USA, 2014. [Google Scholar]
  119. Åhman, M.; Nilsson, L.; Johansson, B. Global climate policy and deep decarbonization of energy-intensive industries. Clim. Policy 2017, 17, 634–649. [Google Scholar] [CrossRef] [Green Version]
  120. OECD. Towards Green Growth; Organisation for Economic Co-operation and Development: Paris, France, 2011. [Google Scholar]
  121. Umweltorientierte Produktion und Dienstleistung—EGSS. Available online: http://www.statistik.at/web_en/statistics/EnergyEnvironmentInnovationMobility/energy_environment/environment/eco_industries_environmentally_goods_and_services/index.html (accessed on 31 January 2020).
  122. ILO. World Employment and Social Outlook 2018: Greening with Jobs; International Labour Organization: Geneva, Switzerland, 2019. [Google Scholar]
  123. UNEP. Towards A Green Economy: Pathways to Sustainable Development and Poverty Eradication—A Synthesis for Policy Makers; United Nations Environment Programme: Nairobi, Kenya, 2011. [Google Scholar]
  124. OECD. Greening Jobs and Skills; Organisation for Economic Co-operation and Development: Paris, France, 2019. [Google Scholar]
  125. ILO; OECD. New Job Opportunities in An Ageing Society; International Labour Organization; Organization for Economic Co-operation and Development: Tokyo, Japan, 2019. [Google Scholar]
  126. OECD. Employment Implications of Green Growth: Linking Jobs, Growth, and Green Policies. OECD Report for the G7 Environment Ministers; Organisation for Economic Co-operation and Development: Paris, France, 2017. [Google Scholar]
  127. Ortega, M.; del Río, P.; Ruiz, P.; Thiel, C. Employment effects of renewable electricity deployment. A novel methodology. Energy 2015, 91, 940–951. [Google Scholar] [CrossRef]
  128. ILO. Guidelines for A Just Transition Towards Environmentally Sustainable Economies and Societies for All; International Labour Organization: Geneva, Switzerland, 2015. [Google Scholar]
  129. Ulrich, P.; Lehr, U. Erneuerbar Beschäftigt in den Bundesländern. Bericht zur Aktualisierten Abschätzung der Bruttobeschäftigung 2016 in den Bundesländern; GWS: Osnabrück, Germany, 2016. [Google Scholar]
  130. Hydro-Québec. Annual Report 2019—Setting New Sights with Our Clean Energy; Hydro-Québec: Montreal, QC, Canada, 2020. [Google Scholar]
  131. Énergie Éolienne. Available online: https://aqper.com/fr/energie-eolienne (accessed on 30 June 2020).
  132. Qu’est-ce que Vision Biomasse Québec? Available online: https://visionbiomassequebec.org/ (accessed on 30 June 2020).
  133. IPCC. Summary for Policymakers. In IPCC Special Report on Renewable Energy Sources and Climate Change Mitigation; Cambridge University Press: Cambridge, NY, USA, 2011. [Google Scholar]
  134. Bayerische Klimaschutzoffensive. Available online: https://www.stmuv.bayern.de/themen/klimaschutz/klimaschutzgesetz/index.htm (accessed on 4 May 2020).
  135. Bevölkerungsstand. Available online: https://www.statistik.bayern.de/statistik/gebiet_bevoelkerung/bevoelkerungsstand/index.html#link_2 (accessed on 4 May 2020).
  136. Population. Available online: https://www.ibge.gov.br/en/statistics/social/population.html (accessed on 4 May 2020).
  137. Bevölkerung. Available online: https://www.statistik.at/web_de/statistiken/menschen_und_gesellschaft/bevoelkerung/index.html (accessed on 10 May 2020).
  138. Statistics South Africa. Mid-Year Population Estimates 2019; Stats SA: Pretoria, South Africa, 2019.
  139. IRENA. Innovation Outlook: Advanced Liquid Biofuels; International Renewable Energy Agency: Abu Dhabi, UAE, 2017. [Google Scholar]
  140. IRENA. Hydrogen from Renewable Power: Technology Outlook for the Energy Transition; International Renewable Energy Agency: Abu Dhabi, UAE, 2018. [Google Scholar]
  141. IRENA. A New World. The Geopolitics of Energy Transition; International Renewable Energy Agency: Abu Dhabi, UAE, 2019. [Google Scholar]
  142. UNIDO. Accelerating Clean Energy through Industry 4.0: Manufacturing the Next Revolution; United Nations Industrial Development Organization: Vienna, Austria, 2017. [Google Scholar]
  143. Carrillo, J. Technology Transfer and Sustainable Development in Emerging Economies; Instituto de Empresa: Madrid, Spain, 2003. [Google Scholar]
  144. Mulamula, G.; Amadi-Echendu, J. Leveraging technology transfer, information communication technology and capacity building for sustainable development. In Proceedings of the 2015 IEEE International Conference on Engineering, Technology and Innovation/ International Technology Management Conference, Belfast, UK, 22–24 June 2015. [Google Scholar] [CrossRef]
  145. Énergie 4.0: Des Centaines de Milliards D’investissements. Available online: https://www.lesaffaires.com/secteurs-d-activite/general/energie-40--des-centaines-de-milliards-dinvestissements/613444 (accessed on 18 May 2020).
  146. Hydro-Québec. Plan Stratégique 2020–2024; Hydro-Québec: Montreal, QC, Canada, 2019. [Google Scholar]
  147. National Population Projections. Available online: https://demographics.coopercenter.org/national-population-projections (accessed on 31 January 2020).
  148. Institut de la Statistique du Québec. Perspectives Démographiques du Québec et des Régions, 2016–2066; Gouvernement du Québec: Quebec City, QC, Canada, 2019.
  149. Azarova, V.; Cohen, J.; Friedl, C.; Reichl, J. Designing local renewable energy communities to increase social acceptance: Evidence from a choice experiment in Austria, Germany, Italy, and Switzerland. Energy Policy 2019, 132, 1176–1183. [Google Scholar] [CrossRef] [Green Version]
  150. Cohen, J.; Moeltner, K.; Reichl, J.; Schmidthaler, M. An empirical analysis of local opposition to new transmission lines across the EU-27. Energy J. 2016, 37, 59–82. [Google Scholar] [CrossRef]
  151. Cohen, J.; Moeltner, K.; Reichl, J.; Schmidthaler, M. Linking the value of energy reliability to the acceptance of energy infrastructure: Evidence from the EU. Resour. Energy Econ. 2016, 45, 124–143. [Google Scholar] [CrossRef]
  152. Hofman, E.; van der Gaast, W. Acceleration of Clean Technology Deployment within the EU: The Role of Social Acceptance. POLIMP 1st Policy Brief; JIN Climate and Sustainability: Groningen, The Netherlands, 2014. [Google Scholar]
  153. Kollmann, A.; Reichl, J. How trust in governments influences the acceptance of environmental taxes. In Political Economy and Instruments of Environmental Politics; Schneider, F., Kollmann, A., Reichl, J., Eds.; MIT Press Ltd: Cambridge, MA, USA, 2015; pp. 53–69. [Google Scholar] [CrossRef]
  154. Heffron, R.; McCauley, D. The concept of energy justice across the disciplines. Energy Policy 2017, 105, 658–667. [Google Scholar] [CrossRef] [Green Version]
  155. Jenkins, K.; McCauley, D.; Heffron, R.; Stephan, H.; Rehner, R. Energy justice: A conceptual review. Energy Res. Soc. Sci. 2016, 11, 74–182. [Google Scholar] [CrossRef] [Green Version]
  156. Allen, E.; Lyons, H.; Stephens, J. Women’s leadership in renewable transformation, energy justice and energy democracy: Redistributing power. Energy Res. Soc. Sci. 2019, 57, 101223. [Google Scholar] [CrossRef]
  157. Newell, P.; Mulvaney, D. The political economy of the ‘just transition’. Geogr. J. 2013, 179, 132–140. [Google Scholar] [CrossRef]
  158. OECD. Green Growth Indicators 2017; OECD Publishing: Paris, France, 2017. [Google Scholar]
Figure 1. Framework of strengths, weaknesses, opportunities and threats (SWOT) analysis. Sources: [77,78].
Sustainability 13 00076 g001
Figure 2. Absolute and per capita gross inland energy consumption in selected RLS partner regions. (a) Bavaria; (b) Québec; (c) Upper Austria. Sources: [40,88,113,114].
Sustainability 13 00076 g002
Figure 3. Final energy consumption by sectors in selected RLS partner regions. Sources: [40,88,113,114].
Sustainability 13 00076 g003
Figure 4. CO2 emissions per capita in selected RLS partner regions. * CO2e emissions, energy-related. Sources: [25,27,28,30,34,35,36,37,40,41,44,113,134,135,136,137,138].
Sustainability 13 00076 g004
Figure 5. Demographic development in the RLS partner region. Sources: [25,28,35,135,136,137,138].
Sustainability 13 00076 g005
Figure 6. Demographic development in the RLS partner regions, 2010–2030. Sources: [25,28,35,42,135,136,137,138,147,148].
Sustainability 13 00076 g006
Table 1. Overview of the Regional Leaders’ Summit (RLS) regions’ key data.
Bavaria (2017)Georgia (2017)Québec (2017)São Paulo (2017)Shandong (2017)Upper Austria (2017)Western Cape (2016)
CountryGermanyUSACanadaBrazilChinaAustriaSouth Africa
Population (m persons)12.910.48.345.1100.11.56.5
Area (1000 km2)70.5154.01542.1248.2157.111.9129.4
GRP (bn 2013 USD)804.7450.7373.4899.41181.084.144.0
CO2 emissions (m tCO2)79132798911022139 *
CO2 emissions (tCO2/capita)6.112.79.62.011.013.86.0 *
* CO2e emissions, energy-related. Sources: [24,25,26,27,28,29,30,31,32,33,34,35,36,37,38,39,40,41,42,43,44].
Table 2. Blank SWOT matrix.
Internal StrengthsInternal Weaknesses
Positive—helpful for strengthening the role of renewable energy in RLS regions’ energy transitionsNegative—harmful for strengthening the role of renewable energy in RLS regions’ energy transitions
External OpportunitiesExternal Threats
Positive—helpful for strengthening the role of renewable energy in RLS regions’ energy transitionsNegative—harmful for strengthening the role of renewable energy in RLS regions’ energy transitions
Table 3. Electricity generation in selected RLS partner regions, 2017.
BavariaGeorgiaQuébecSão PauloShandongUpper Austria
Total (TWh)84.6127.5202.072.6486.015.5
Fossil55.9%93.4% *1.4%10.2%94.8%27.7%
Renewable44.1%6.6%98.6%89.8%5.2%72.3%
Biomass10.6%3.9%0.9%27.9%0.0%6.2%
Hydro14.4%0.9%93.4%61.9%3.4%63.9%
Wind5.4%0.0%4.2%0.0%1.5%0.6%
Solar13.3%1.7%0.0%0.0%0.3%1.6%
Other0.5%0.0%0.0%0.0%0.0%0.0%
* Incl. nuclear power. For the Western Cape, no detailed data with regard to renewable energy generation could be identified. The Department of Energy’s Renewable Energy Independent Power Producers Procurement Programme (REIPPPP) reported that, until June 2019, cumulatively 4934 GWh of electricity has been generated from renewables in the Western Cape. Sources: [40,60,88,89,90,91,92,93,94,95,96].
Table 4. Heat generated from biomass in selected RLS partner regions, 2017.
BavariaQuébecSão PauloUpper Austria
Solid biomass (PJ)10912792242
Liquid and gaseous biomass (PJ)151143318
Total (PJ)123136135560
Sources: [40,60,90,93].
Table 5. Usage of biofuels for transportation in selected RLS partner regions, 2017.
BavariaQuébecSão PauloUpper Austria
Total consumption of biofuels for transportation (PJ)18.482573.7
Share of renewable fuels (%)3.81.526.95.3
Sources: [40,60,90,93].
Table 6. Existing potentials and targets of renewable energy resources in selected RLS partner regions.
BavariaSão PauloShandongUpper Austria
WindEP2022: 10 TWhIC2030: +603 MWIC2020: 14 GWIC2020: +30 MW
IC2030: 23 GW
PhotovoltaicEP2022: +3200 MWIC2020: 10 GWEP2030: up to 2600 GWh
IC2030: +14 GWIC2030: 25 GW
BiomassEP2022: +1 GWHP2020: 2000 TWhIC2020: 2 GW
EP2020: 87 TWhIC2030: 5 GW
HydroEP2022: 1 TWhIC2020: 1 GWEP2030: +488 GWh
IC2030: 8 GW
IC = installed capacity; EP = electricity production; HP = heat production; “+” = additional; “−“ = no particular potential/target. Sources: [88,98,99,100,101].
Table 7. Policy frameworks for renewable energy in the RLS partner regions.
Legislation/Programs
Bavaria
  • Bavarian Energy Concept [45]
  • Bavarian Energy Programme [46]
  • Bavarian Energy Action Programme [47]
  • Bavarian Climate Protection Act [48]
  • Renewable Energy Law (national) [102]
Georgia
  • Public, private, philanthropic partnerships that utilize state assets to test innovative technologies and test business models in the areas of renewable energy, transportation and sustainability [103]
Québec
  • Politique énergétique 2030 (PE2030) [55]
  • Plan d’actions 2013–2020 sur les changements climatiques [54]
São Paulo
  • São Paulo State Energy Plan—PPE/2020 [99]
Shandong
  • Shandong province electric power development plan in the 13th Five-Year Plan
Upper Austria
  • Climate and location-oriented Upper Austrian Energy Strategy ‘Energie-Leitregion OÖ 2050’ [67]
  • Green Electricity Regulation (national) [104]
Western Cape
  • Renewable Energy Independent Power Producers Procurement Programme [89]
  • Program Integrated Energy Plan/Integrated Resources Plan (national)
Table 8. Turnover in the green economy and resource management sector in Upper Austria.
2014201520162017
Total turnover (m €)6196620265636911
Relative to GRP (nominal) (%)10.810.610.810.9
Environmental services (m €)1986194219032168
Environmental goods (m €)2629267229122862
Environmental technologies (m €)1581158817481882
GRP = gross regional product. Source: [121].
Table 9. Renewable energy jobs in Bavaria.
Renewable Energy Jobs in Bavaria2016
Total (employees)50,650
Wind (employees)12,920
Solar (employees)8740
Bioenergy (employees)21,270
Source: [129].
Table 10. Green jobs in Upper Austria.
Green Jobs in Upper Austria2016
Green jobs—total (employees)35,572
Relative to total employees (%)5.6
Environmental services (employees)11,164
Environmental goods (employees)17,727
Source: [121].
Table 11. CO2 emissions in the RLS partner regions.
20052010201520162017
Bavariam tCO28181767879
Georgiam tCO2184171136135132
Québecm tCO28781797979
São Paulom tCO27595978889
Shandongm tCO257885393210971102
Upper Austriam tCO22121202021
Western Capem tCO2e---39 *-
* CO2e emissions, energy-related. Sources: [27,30,34,35,36,37,40,41,44,113].
Table 12. SWOT analysis for the support of renewable energy in RLS regions’ energy transitions.
Internal StrengthsInternal Weaknesses
  • Usage of RE for electricity, heat and fuels
  • RE potentials
  • Sound legal RE frameworks and instruments
  • RE research and development
  • Expertise in RE conversion and storage
  • Dependence on fossil energy
  • Energy-intensive industrial structures (which require stable energy supply historically supported by fossil fuels)
  • Limited grid access for RE
External OpportunitiesExternal Threats
  • Green economy
  • Employment (green jobs)
  • Economic growth
  • Contributions to climate protection
  • Technological innovation and Industry 4.0
  • Demographic developments
  • Lack of social acceptance
  • Volatility of RE resources
RE: renewable energy.
Publisher’s Note: MDPI stays neutral with regard to jurisdictional claims in published maps and institutional affiliations.

