Transport Mode and the Value of Accessibility–A Potential Input for Sustainable Investment Analysis


Abstract
1. Introduction
2. Literature Review
3. Methodological Framework and Data
3.1. Methodological Framework
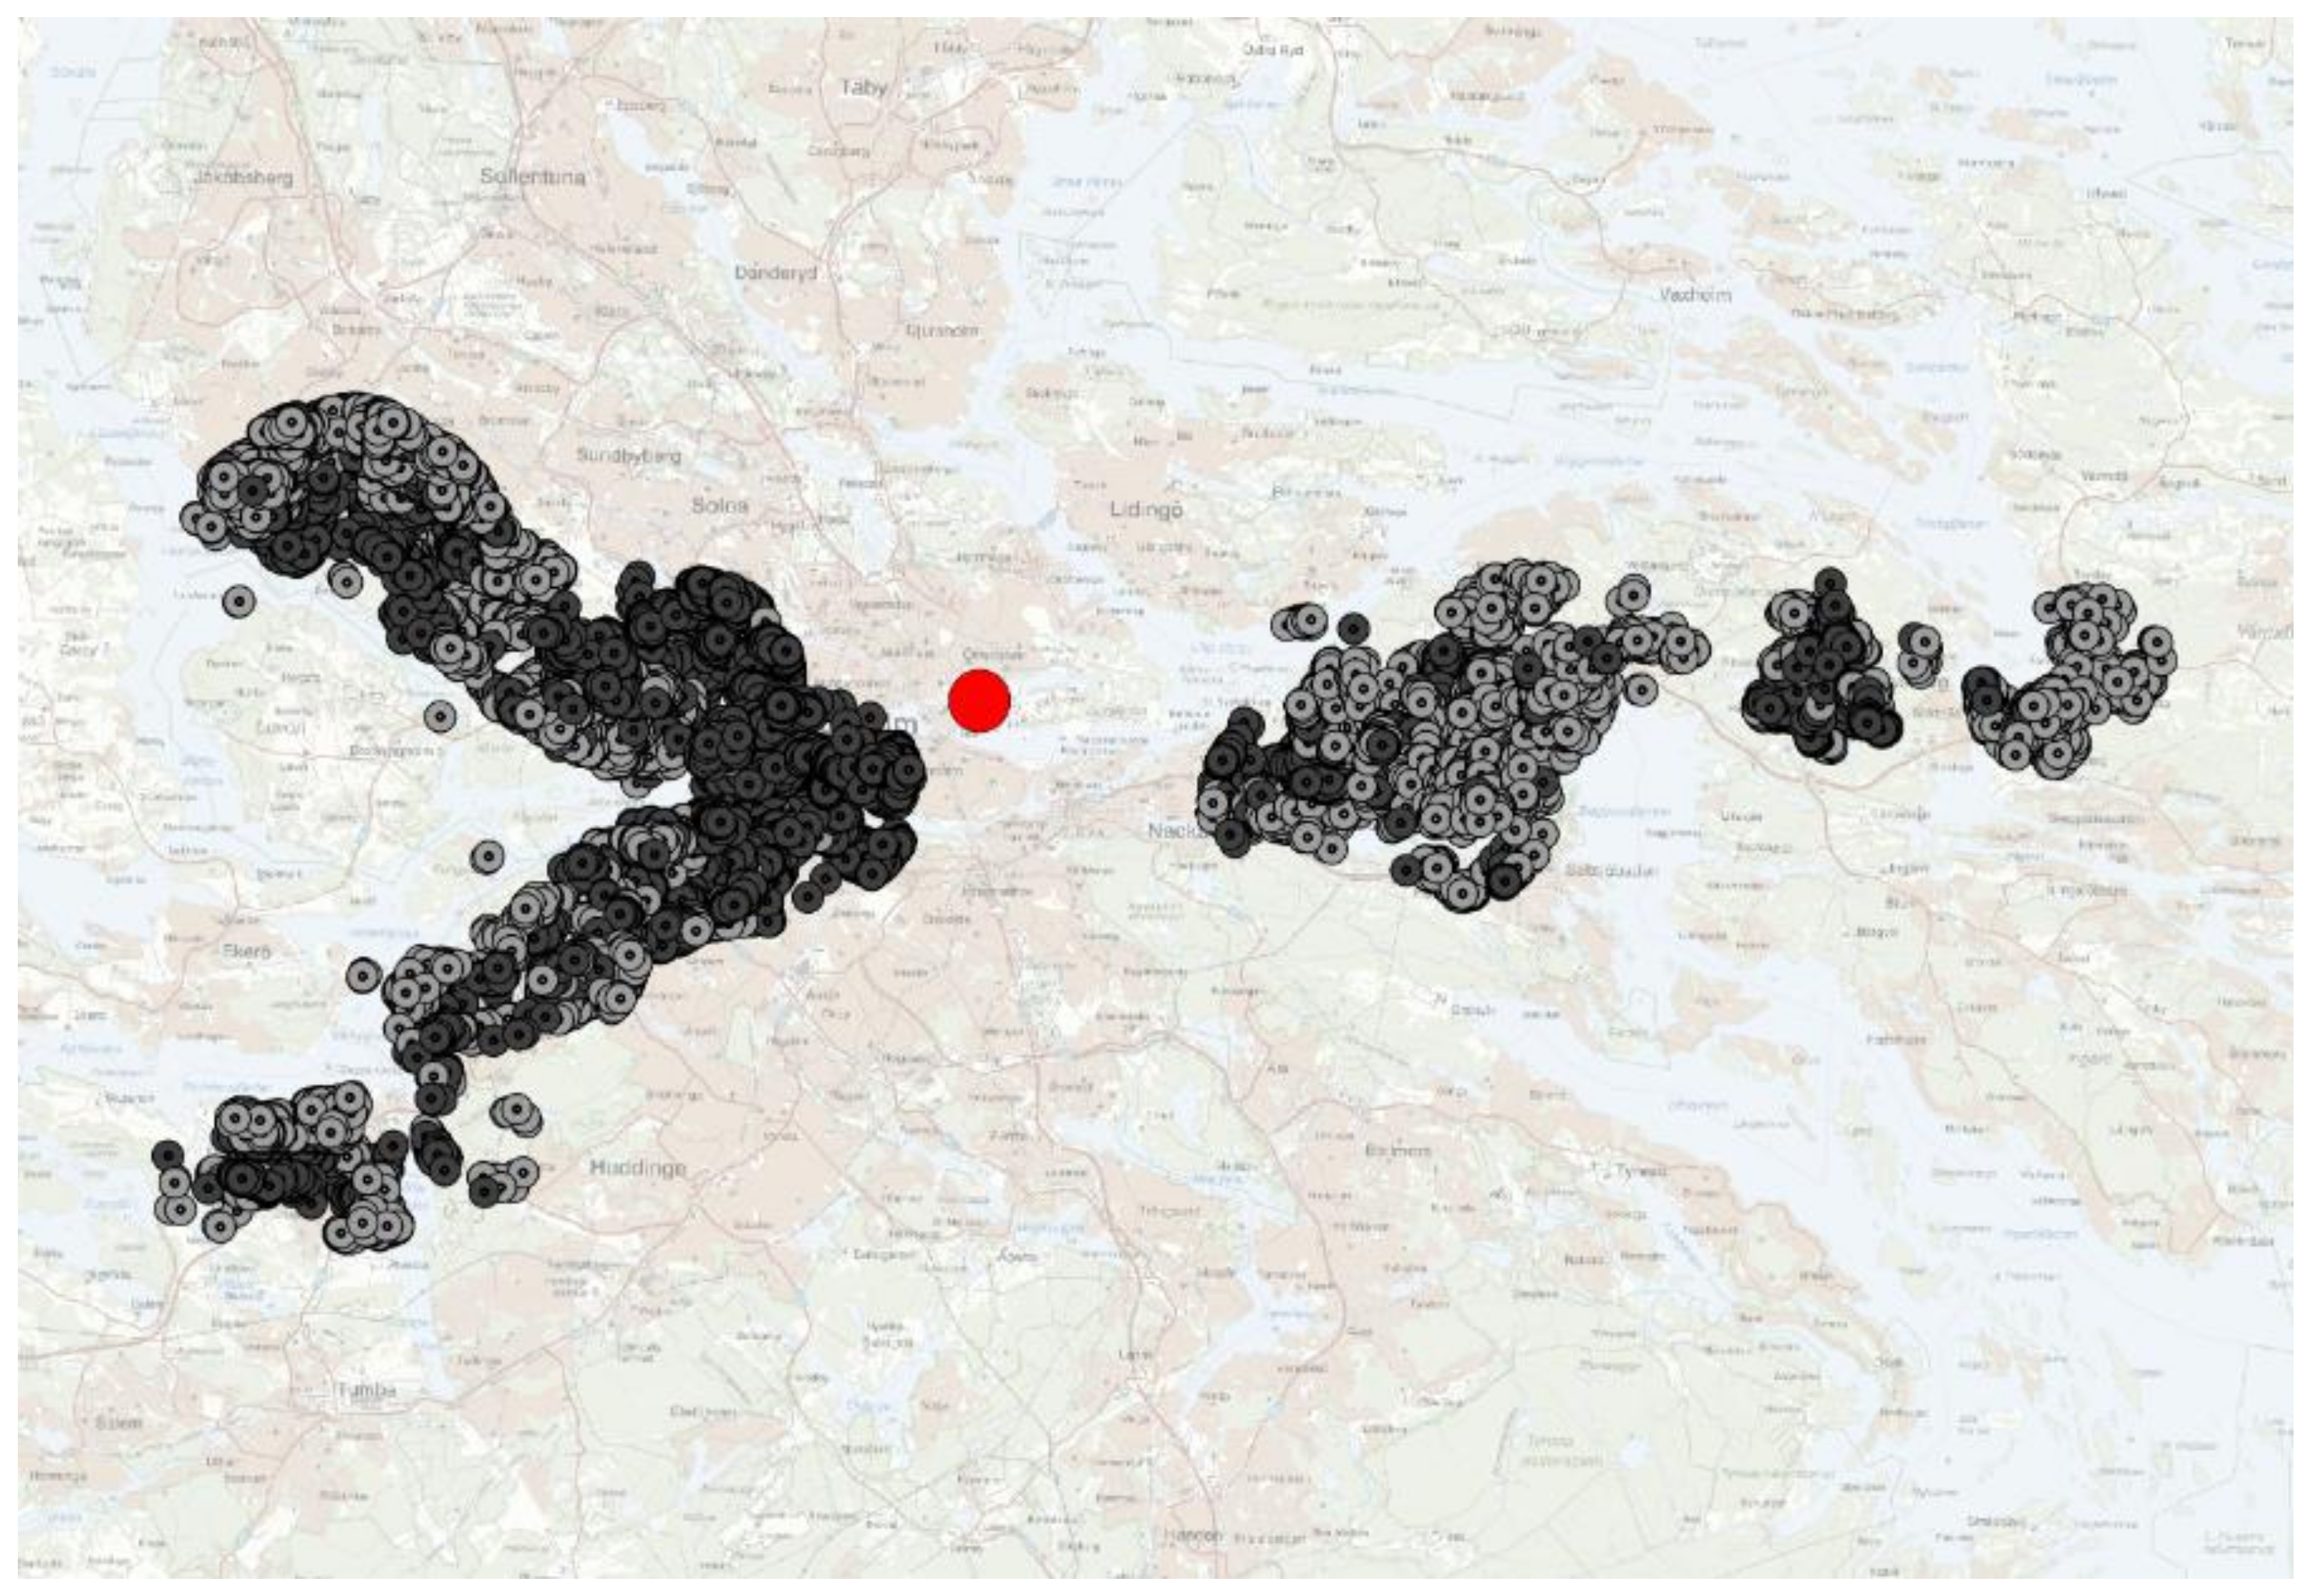
3.2. Data
4. Results
5. Discussion and Conclusions
Author Contributions
Funding
Acknowledgments
Conflicts of Interest
References
- Alonso, W. Location and land use. Toward a general theory of land rent. In Location and Land Use: Toward a General Theory of Land Rent; Harvard University Press: Cambridge, MA, USA, 1964. [Google Scholar]
- Johansson, E.; Winslott Hiselius, L.; Koglin, T.; Wretstrand, A. Evaluation of public transport: Regional policies and planning practices in Sweden. Urban Plan. Transp. Res. 2017, 5, 59–77. [Google Scholar] [CrossRef]
- Zheng, S.; Hu, X.; Wang, J.; Wang, R. Subways near the subway: Rail transit and neighborhood catering businesses in Beijing. Transp. Policy 2016, 51, 81–92. [Google Scholar] [CrossRef]
- Bowes, D.R.; Ihlanfeldt, K.R. Identifying the impacts of rail transit stations on residential property values. J. Urban Econ. 2001, 50, 1–25. [Google Scholar] [CrossRef]
- Daziano, R.A.; Rizzi, L.I. Analyzing the impact of a fatality index on a discrete, interurban mode choice model with latent safety, security, and comfort. Saf. Sci. 2015, 78, 11–19. [Google Scholar] [CrossRef]
- Von Thünen, J.H. Der Isolierte Staat in Beziehung auf Nationalökonomie und Landwirtschaft; Gustav Fischer: Stuttgart, Germany, 1826; reprinted 1966. [Google Scholar]
- Kopsch, F. Winners, Losers and Optimal Re-location of a Mining Town: An Approach Using Alonso Bid-Rent Functions. Eur. Plan. Stud. 2015, 23, 2483–2496. [Google Scholar] [CrossRef]
- Downes, T.A.; Zabel, J.E. The impact of school characteristics on house prices: Chicago 1987–1991. J. Urban Econ. 2002, 52, 1–25. [Google Scholar] [CrossRef]
- Gibbons, S.; Machin, S. Valuing English primary schools. J. Urban Econ. 2003, 53, 197–219. [Google Scholar] [CrossRef]
- Davidoff, I.; Leigh, A. How much do public schools really cost? Estimating the relationship between house prices and school quality. Econ. Rec. 2008, 84, 193–206. [Google Scholar] [CrossRef]
- Thaler, R. A note on the value of crime control: Evidence from the property market. J. Urban Econ. 1978, 5, 137–145. [Google Scholar] [CrossRef]
- Gibbons, S. The costs of urban property crime. Econ. J. 2004, 114, F441–F463. [Google Scholar] [CrossRef]
- Ceccato, V.; Wilhelmsson, M. The impact of crime on apartment prices: Evidence from Stockholm, Sweden. Geogr. Ann. Ser. B Hum. Geogr. 2011, 93, 81–103. [Google Scholar] [CrossRef]
- Luttik, J. The value of trees, water and open space as reflected by house prices in the Netherlands. Landsc. Urban Plan. 2000, 48, 161–167. [Google Scholar] [CrossRef]
- Wilhelmsson, M. The impact of traffic noise on the values of single-family houses. J. Environ. Plan. Manag. 2000, 43, 799–815. [Google Scholar] [CrossRef]
- Theebe, M.A. Planes, trains, and automobiles: The impact of traffic noise on house prices. J. Real Estate Financ. Econ. 2004, 28, 209–234. [Google Scholar] [CrossRef]
- Debrezion, G.; Pels, E.; Rietveld, P. The impact of railway stations on residential and commercial property value: A meta-analysis. J. Real Estate Financ. Econ. 2007, 35, 161–180. [Google Scholar] [CrossRef]
- Rosen, S. Hedonic prices and implicit markets: Product differentiation in pure competition. J. Political Econ. 1974, 82, 34–55. [Google Scholar] [CrossRef]
- Dubé, J.; Des Rosiers, F.; Thériault, M.; Dib, P. Economic impact of a supply change in mass transit in urban areas: A Canadian example. Transp. Res. Part A Policy Pract. 2011, 45, 46–62. [Google Scholar] [CrossRef]
- Chen, Z.; Heynes, K. Impact of high speed rail on housing values: An observation from the Beijing–Shanghai line. J. Transp. Geogr. 2015, 43, 91–100. [Google Scholar] [CrossRef]
- Hess, D.B.; Almeida, T.M. Impact of proximity to light rail rapid transit on station-area property values in Buffalo, New York. Urban Stud. 2007, 44, 1041–1068. [Google Scholar] [CrossRef]
- Cervero, R.; Kang, C.D. Bus rapid transit impacts on land uses and land values in Seoul, Korea. Transp. Policy 2011, 18, 102–116. [Google Scholar] [CrossRef]
- Geng, B.; Bao, H.; Liang, Y. A study of the effect of a high-speed rail station on spatial variations in housing price based on the hedonic model. Habitat Int. 2015, 49, 333–339. [Google Scholar] [CrossRef]
- Deng, T.; Ma, M.; Nelson, J.D. Measuring the impacts of Bus Rapid Transit on residential property values: The Beijing case. Res. Transp. Econ. 2016, 60, 54–61. [Google Scholar] [CrossRef]
- Bohman, H.; Nilsson, D. The impact of regional commuter trains on property values: Price segments and income. J. Transp. Geogr. 2016, 56, 102–109. [Google Scholar] [CrossRef]
- Mulley, C. Accessibility and residential land value uplift: Identifying spatial variations in the accessibility impacts of a bus transitway. Urban Stud. 2014, 51, 1707–1724. [Google Scholar] [CrossRef]
- Rodriguez, D.A.; Targa, F. Value of accessibility to Bogotá’s bus rapid transit system. Transp. Rev. 2004, 24, 587–610. [Google Scholar] [CrossRef]
- Munoz-Raskin, R. Walking accessibility to bus rapid transit: Does it affect property values? The case of Bogotá, Colombia. Transp. Policy 2010, 17, 72–84. [Google Scholar] [CrossRef]
- Voith, R. Transportation, sorting and house values. Real Estate Econ. 1991, 19, 117–137. [Google Scholar] [CrossRef]
- Dewees, D.N. The effect of a subway on residential property values in Toronto. J. Urban Econ. 1976, 3, 357–369. [Google Scholar] [CrossRef]
- Ceccato, V. Safety on the move: Crime and perceived safety in transit environments. Secur. J. 2014, 27, 127–131. [Google Scholar] [CrossRef]
- Schuetz, J. Do rail transit stations encourage neighbourhood retail activity? Urban Stud. 2014, 52, 2699–2723. [Google Scholar] [CrossRef]
- Zhang, X.; Zheng, Y.; Sun, L.; Dai, Q. Urban structure, subway system and housing price: Evidence from Beijing and Hangzhou, China. Sustainability 2019, 11, 669. [Google Scholar] [CrossRef]
- Dziauddin, M.F. Estimating land value uplift around light rail transit stations in Greater Kuala Lumpur: An empirical study based on geographically weighted regression (GWR). Res. Transp. Econ. 2019, 74, 10–20. [Google Scholar] [CrossRef]
- Forouhar, A.; Hasankhani, M. The effect of Tehran metro rail system on residential property values: A comparative analysis between high-income and low-income neighbourhoods. Uran Stud. 2018, 55, 3503–3524. [Google Scholar] [CrossRef]
- Li, J.; Huang, H. Effects of transit-oriented development (TOD) on housing prices: A case study in Wuhan, China. Res. Transp. Econ. 2020, in press. [Google Scholar] [CrossRef]
- Yu, H.; Pang, H.; Zhang, M. Value-added effects of transit-oriented development: The impact of urban rail on commercial property values with consideration of spatial heterogeneity. Pap. Reg. Sci. 2018, 97, 1375–1396. [Google Scholar] [CrossRef]
- Zhang, M. Bus versus rail: Meta-analysis of cost characteristics, carrying capacities, and land use impacts. Transp. Res. Record 2009, 2110, 87–95. [Google Scholar] [CrossRef]
- Beser, M.; Algers, S. SAMPERS—The new Swedish national travel demand forecasting tool. In National Transport Models; Springer: Berlin/Heidelberg, Germany, 2002; pp. 101–118. [Google Scholar]
- Sveder, G.J. The new Swedish national model—SAMPERS: System and validation. In National Transport Models; Springer: Berlin/Heidelberg, Germany, 2002; pp. 93–100. [Google Scholar]
- Ben-Akiva, M.E.; Lerman, S.R. Discrete Choice Analysis: Theory and Application to Travel Demand; MIT Press: Cambridge, MA, USA, 1985; Volume 9. [Google Scholar]
- Eliasson, J.; Mattsson, L.G. A model for integrated analysis of household location and travel choices. Transp. Res. Part A Policy Pract. 2000, 34, 375–394. [Google Scholar] [CrossRef]


| Author | Mode of Transportation | Accessibility Measure | Result |
|---|---|---|---|
| Bowes and Ihlanfeldt (2001) [4] | Rail | Discrete distance | Between -18.7% (within a quarter-mile of station) and 3.5% within the 2-3 mile radius of a station. |
| Gibbons and Machin (2005) [12] | Rail | Continuous distance | 9.3% in proximity to new stations. |
| Dubé et al. (2011) [19] | Bus | Discrete distance | Between 2.6% and 6.4% increase for properties receiving a rapid bus transit line. |
| Hess and Almeida (2007) [21] | Rail | Continuous distance | 2% to 5% of median home values if within a quarter-mile of the station, but different for different stations. |
| Cervero and Kang (2011) [22] | Bus | Continuous distance | Land price premiums of 5% to 10% within 300 m of bus rapid transit. |
| Geng et al. (2015) [23] | Rail | Continuous distance | Negative impact on prices within the first 500 m from station, positive and diminishing impact between 500 m and 11 km. |
| Deng et al. (2016) [24] | Bus | Continuous distance | 1.32% to 1.39% per additional 100 m closer to bus rapid transit station. |
| Bohman and Nilsson (2016) [25] | Rail | Continuous distance | Large negative effect of being very close. Low price segments value proximity higher (~1% per meter compared to ~0.4% for high price segment). |
| Mulley (2014) [26] | Bus | Travel time, minutes | 4.2% per extra decrease in minute access time to a motorway, 0.7 to shops, and employment. |
| Rodriguez and Targa (2004) [27] | Bus | Walking time, minutes | Between 6.8% and 9.3% decrease in rent for each additional 5 min walking time to the station. |
| Munuz-Raskin (2010) [28] | Bus | Discrete walking time | 8.7% price premiums for dwelling within 5 min compared to 5 to 10 min walking distance of the station. |
| Total | Subway | Bus | ||||
|---|---|---|---|---|---|---|
| Variables | Average | St.dev. | Average | St.dev. | Average | St.dev. |
| Apartment specific variables | ||||||
| Price | 1793,136 | 859,129 | 1809,062 | 869,425 | 1725,156 | 810,297 |
| Living area | 67.43 | 22.33 | 66.72 | 21.82 | 70.47 | 24.15 |
| Monthly fee | 3751.39 | 1295.01 | 3691.79 | 1252.44 | 4005.80 | 1435.47 |
| Number of rooms | 2.6 | 1.0 | 2.6 | 1.0 | 2.6 | 1.1 |
| Year built | 1972 | 26 | 1972 | 28 | 1972 | 17 |
| Accessibility measures | ||||||
| Distance station | 196.48 | 109.13 | 200.30 | 110.92 | 180.19 | 99.50 |
| Accessibility – Public transport | 111.42 | 3.02 | 111.93 | 2.96 | 109.27 | 2.21 |
| Accessibility - Car | 112.95 | 5.28 | 113.19 | 5.16 | 111.88 | 5.61 |
| Neighborhood specific variables | ||||||
| Proportion built area | 0.48 | 0.17 | 0.49 | 0.16 | 0.42 | 0.16 |
| Proportion high rise | 0.63 | 0.33 | 0.66 | 0.32 | 0.54 | 0.34 |
| Proportion low rise | 0.27 | 0.32 | 0.24 | 0.31 | 0.39 | 0.35 |
| Proportion single family | 0.18 | 0.30 | 0.17 | 0.29 | 0.22 | 0.33 |
| Nobs | 22,660 | 18,359 | 4301 | |||
| Total | Subway | Bus | ||||
|---|---|---|---|---|---|---|
| Variables | Average | St.dev. | Average | St.dev. | Average | St.dev. |
| House specific variables | ||||||
| Price | 4223,525 | 2248,949 | 4064,700 | 2252,218 | 4714,003 | 2166,959 |
| Living area | 124.72 | 35.40 | 123.53 | 33.41 | 128.40 | 40.72 |
| Additional area | 37.71 | 36.24 | 40.45 | 35.88 | 29.27 | 36.07 |
| Year built | 1962 | 21 | 1959 | 20 | 1970 | 23.95 |
| Quality points | 28.52 | 3.80 | 28.28 | 3.69 | 29.23 | 4.01 |
| Terrace house | 0.12 | 0.33 | 0.12 | 0.33 | 0.13 | 0.34 |
| Semi detached house | 0.36 | 0.48 | 0.39 | 0.49 | 0.27 | 0.44 |
| Sea | 0.002 | 0.048 | 0.000 | 0.019 | 0.008 | 0.92 |
| Sea view | 0.031 | 0.172 | 0.018 | 0.133 | 0.069 | 0.25 |
| Plot size | 592.34 | 967.57 | 509.21 | 1018.40 | 849.05 | 733.11 |
| Accessibility measures | ||||||
| Distance station | 266.74 | 175.39 | 262.69 | 175.52 | 279.24 | 174.43 |
| Accessibility – Public transport | 108.77 | 3.08 | 109.45 | 3.02 | 106.70 | 2.23 |
| Accessibility – Car | 120.40 | 3.80 | 121.48 | 3.37 | 117.09 | 3.06 |
| Neighborhood specific variables | ||||||
| Proportion built area | 0.62 | 0.19 | 0.63 | 0.19 | 0.60 | 0.19 |
| Proportion high rise | 0.04 | 0.12 | 0.04 | 0.13 | 0.04 | 0.10 |
| Proportion low rise | 0.92 | 0.15 | 0.93 | 0.15 | 0.88 | 0.16 |
| Proportion single family | 0.88 | 0.19 | 0.89 | 0.17 | 0.83 | 0.24 |
| Nobs | 10,482 | 7918 | 2564 | |||
| Apartments | Single-Family Houses | |||
|---|---|---|---|---|
| Variables | Coefficient | t-Value | Coefficient | t-Value |
| Constant | 2.0223 | 13.18 | 15.0523 | 47.64 |
| Living area | 0.0143 | 86.14 | 0.0038 | 55.89 |
| Monthly fee | −0.0002 | −92.04 | - | |
| Number of rooms | 0.0875 | 28.98 | - | |
| Year built | 0.0014 | 22.09 | −0.0026 | −20.00 |
| Additional area | - | 0.0011 | 15.41 | |
| Quality points | - | 0.0035 | 5.52 | |
| Terrace house | - | −0.2104 | −26.42 | |
| Semi-detached house | - | −0.3367 | −54.52 | |
| Sea | - | 0.6484 | 14.55 | |
| Sea view | - | 0.1815 | 14.17 | |
| Plot size | - | −0.0000 | −1.55 | |
| Distance station | 0.0002 | 13.69 | 0.0003 | 23.54 |
| Accessibility–Public transport | 0.0713 | 87.78 | 0.0377 | 23.54 |
| Accessibility–Car | 0.0023 | 393 | 0.0018 | 0.86 |
| Accessibility–Public transport* Bus only | −0.0111 | −15.80 | −0.0288 | −10.46 |
| Accessibility – Car * Bus only | 0.0127 | 18.61 | 0.0286 | 11.43 |
| Proportion built area | 0.1499 | 14.58 | 0.1480 | 11.43 |
| Proportion high rise | 0.1740 | 17.35 | −0.0009 | −0.02 |
| Proportion low rise | 0.0707 | 5.98 | 0.0425 | 1.69 |
| Proportion single family | 0.1186 | 9.95 | −0.0779 | −2.86 |
| Nobs Time fixed effects | 21993 Yes | 10443 Yes | ||
| VIF (average) | 123 | 141 | ||
| R2 | 0.769 | 0.7878 |
| 6–10 Km | 10–18 Km | |||
|---|---|---|---|---|
| Variables | Coefficient | t-Value | Coefficient | t-Value |
| Distance station | 0.0003 | 17.63 | 0.0000 | 5.11 |
| Accessibility–Public transport | 0.0089 | 4.58 | 0.0727 | 79.34 |
| Accessibility–Car | 0.0151 | 14.49 | −0.0105 | −9.35 |
| Accessibility–Public transport* Bus only | −0.0099 | −9.33 | −0.0231 | −23.86 |
| Accessibility–Car * Bus only | 0.0099 | 9.63 | 0.0237 | 26.54 |
| Nobs | 13,244 | 8749 | ||
| R2 | 0.7593 | 0.8264 |
| 6–10 Km | 10–18 Km | |||
|---|---|---|---|---|
| Variables | Coefficient | t-Value | Coefficient | t-Value |
| Distance station | 0.0004 | 19.70 | −0.0000 | −0.15 |
| Accessibility–Public transport | −0.0586 | −9.61 | 0.0262 | 13.87 |
| Accessibility–Car | 0.0397 | 9.32 | −0.0154 | −6.45 |
| Accessibility–Public transport* Bus only | 0.0324 | 7.30 | −0.0425 | −13.28 |
| Accessibility–Car * Bus only | −0.0286 | −7.07 | 0.0406 | 13.90 |
| Nobs | 4206 | 6236 | ||
| R2 | 0.7524 | 0.8190 |
| Apartments | Single-Family Houses | |||
|---|---|---|---|---|
| Variables | Coefficient | t-Value | Coefficient | t-Value |
| Distance station | 0.0067 | 10.21 | 0.0003 | 24.77 |
| Accessibility–Public transport | 0.0559 | 41.04 | 0.0268 | 10.88 |
| Accessibility–Car | 0.0067 | 10.21 | 0.0128 | 4.89 |
| Accessibility–Public transport* Bus only | −0.0108 | −15.55 | −0.0515 | −16.41 |
| Accessibility–Car * Bus only | 0.0117 | 17.29 | 0.0486 | 17.16 |
| Nobs | 14513 | 7989 | ||
| R2 | 0.7847 | 0.7957 |
| Apartments | Single-Family Houses | |||
|---|---|---|---|---|
| Variables | Coefficient | t-Value | Coefficient | t-Value |
| Distance station | −0.0000 | −1.26 | 0.0000 | 0.13 |
| Accessibility–Public transport | 0.0786 | 72.17 | 0.0713 | 25.72 |
| Accessibility–Car | −0.0023 | −2.33 | −0.0454 | −15.53 |
| Accessibility–Public transport* Bus only | −0.0229 | −28.92 | −0.0380 | −12.80 |
| Accessibility–Car * Bus only | 0.0249 | 32.28 | 0.0371 | 13.78 |
| Nobs | 11,669 | 5021 | ||
| R2 | 0.8230 | 0.8226 |
© 2020 by the authors. Licensee MDPI, Basel, Switzerland. This article is an open access article distributed under the terms and conditions of the Creative Commons Attribution (CC BY) license (http://creativecommons.org/licenses/by/4.0/).
Share and Cite
Eliasson, J.; Kopsch, F.; Mandell, S.; Wilhelmsson, M. Transport Mode and the Value of Accessibility–A Potential Input for Sustainable Investment Analysis. Sustainability 2020, 12, 2143. https://doi.org/10.3390/su12052143
Eliasson J, Kopsch F, Mandell S, Wilhelmsson M. Transport Mode and the Value of Accessibility–A Potential Input for Sustainable Investment Analysis. Sustainability. 2020; 12(5):2143. https://doi.org/10.3390/su12052143
Chicago/Turabian StyleEliasson, Jonas, Fredrik Kopsch, Svante Mandell, and Mats Wilhelmsson. 2020. "Transport Mode and the Value of Accessibility–A Potential Input for Sustainable Investment Analysis" Sustainability 12, no. 5: 2143. https://doi.org/10.3390/su12052143
APA StyleEliasson, J., Kopsch, F., Mandell, S., & Wilhelmsson, M. (2020). Transport Mode and the Value of Accessibility–A Potential Input for Sustainable Investment Analysis. Sustainability, 12(5), 2143. https://doi.org/10.3390/su12052143