1. Introduction
This paper proposes a reflection on income inequality in its spatial characterization at the municipal level, starting from the classification of the National Strategy for Inner Areas (NSIA) proposed in Italy [
1,
2]. The contribution has a dual purpose. In the first place, it aims to highlight the consistency and diffusion of the phenomenon investigated at the municipal level, following the geographical divisions and the NSIA classification. A second aim is to understand the role that the territory plays in analyzing the causes of income inequality.
The recently endorsed Sustainable Development Goals (SDGs) agenda unanimously agrees on the need to focus on inclusive development and on the importance of managing often complex human well-being impacts. The contrast to inequalities falls within objective 10 of the Agenda 2030 on reducing inequalities within and between countries; in this context, the analysis of its territorial dimension represents a key element.
The inequality that currently—sometimes in a synthetic way—refers to the concentration of incomes in the hands of a small number of individuals has multiple dimensions [
3,
4,
5,
6,
7,
8,
9]. To income inequality, it is possible to add not only inequalities in access to the economic, social, and environmental resources of the territories but also differences with respect to rights, political powers, and more generally to opportunities, which end up having an economic dimension. It can be said, as widely highlighted by Sen [
7] with his capacity approach, that inequality is a multidimensional concept: none of the single factors can fully grasp its global aspect.
Economic inequalities are, however, the most investigated. More generally, while world income inequality is estimated to have decreased since the 1980s [
10], all indicators of income inequality in Western nations show a worsening [
11,
12].
The spatial dimension plays a central role in understanding inequalities and their effects. At a territorial level, in fact, the multiple forms of inequality are linked to a continuous process of redefining the borders, especially those that delimit the functional entities. Rural urban divide and centre periphery are just some of the possible spatial applications of the analysis of inequalities where peripherality in its geographic and social dimensions is concerned.
Despite the socio-spatial perspective, the territorial dimension of development has not always found adequate consideration in traditional political action and thought [
13]. This has been noted also in the context of some intervention addresses of international institutions that supported the idea that regional disparities would be reduced by the mobility of people and the spread of growth [
9,
14].
The consolidation of territorial disparities, such as those resulting from strong international integration [
15] and the current financial crisis and then recession [
16,
17,
18,
19], entailed huge social, economic, and political-institutional costs that could jeopardize the functioning of advanced democracies [
20].
In the European Union (EU) context, the increase in territorial inequalities and the role of cohesion policies are widely documented by various studies [
21,
22]. Some emergent study fields on inner periphery contributions have examined the causes [
5,
23,
24,
25], tracing them back to changes in the social and economic system [
9]. The widening of the analysis of issues related to peripherality has given rise to new research perspectives in the work on regional development. Wójcik et al. [
5] within a large European project have recently offered some evidence on the concept of inner peripheries in Europe, through some territorial case studies.
Examining the results of Atkinson’s analysis [
11] with reference to the national framework, it emerges that the trend of the indicators for Italy shows particularly significant variations in comparison with the European countries. For example, the relationship between private wealth and income has tripled from the 1970s to present day. The most significant figure, however, is the incidence of territorial gaps, which emerges clearly from the second half of the 1990s to current events.
Italy has significant territorial differences [
26] attributable, in addition to the dual pattern of the North South divide [
27,
28], to the imbalanced development between cities and rural areas [
29,
30], between plains and mountains [
31], between coastal and inner areas [
32], and between centers and inner areas [
1,
33]. These territorial differences are then reflected in inequality [
34,
35,
36], which may depend on the presence and differentiated access to resources—economic, social, and environmental—and to the services offered in a certain territory.
For some years, the inner areas have been the subject of specific policies that find their main reference in NSIA, which was accepted by the European Union in 2014 in the framework of the 2014–2020 Partnership Agreement [
1,
37].
The classification of inner areas uses descriptive indicators that refer to the level of spatial periphery of these territories with respect to accessibility to essential services, in the hypothesis that this may condition the quality of life of citizens, their level of social inclusion, as well as their economic potential. Therefore, the identification of the inner areas starts from a polycentric reading of the Italian territory, characterized by a network of municipalities or aggregations of municipalities (service offer centers) around which gravitate areas characterized by different levels of spatial periphery with respect to the rights of citizenship.
The proposed methodology consists of two main phases [
1]:
- I.
The identification of the hubs according to a criterion of ability to offer some essential services
- II.
The classification of the remaining municipalities into 4 types of areas: peri-urban areas, intermediate areas, peripheral areas, and ultraperipheral areas, based on the distances from the hubs measured in travel times
The NSIA starts from the observation that the impact of EU investments is profoundly differentiated on a territorial scale. Hence, the success of the interventions is conditioned by the characteristics of the context (i.e., production specialization, urban quality, cultural atmosphere, and quality of local institutions). The approach has the aim of implementing a long-term strategy aimed at addressing the persistent underutilization of resources and at reducing the persistent social exclusion in specific places through external interventions and multi-level governance.
According to the authors, the territory plays a key role in the analysis of disparities, in particular at the geographical scale, the analysis at municipal level crosses with specific functional units. This approach can help address some crucial issues in the regional studies debate.
This contribution presents a spatial analysis of inequalities on a territorial scale and represents an advance compared to previous studies conducted at the national level limited to the north–south comparison [
34,
38,
39] or to some geographical areas [
2,
40,
41,
42].
The starting hypothesis assumes that, in the territories where there are more opportunities, there are more inequalities because the abilities to take advantage of such opportunities are different. On the other hand, the Italian inner areas have fewer opportunities, and consequently, there are fewer inequalities.
In
Section 2, we offer a summary framework of the literature on the analysis of the relationships between inequalities and territory. In
Section 3, the variables used, the main descriptive statistics, and the construction of the regression model are discussed. The analysis of the economic and spatial dynamics of the phenomenon was carried out through the construction of the Gini coefficient. The regression model is used to estimate the effects of the determinants of the phenomenon. The results are summarized in
Section 4 and discussed in
Section 5.
2. The Theoretical Framework
The evolutionary measurement and analysis effort of economic inequalities and their territorial impacts in the twentieth century has seen a relevant boost in recent years, also linked to the need to study the relationship between income inequalities and the economic crisis. Starting from the pioneering contributions of Atkinson [
11,
43,
44,
45] and Piketty [
9,
46,
47], other scholars [
18,
48,
49] studied the disparities in the concentration of incomes and wealth on a global scale. This fruitful theoretical corpus has found further analytical consolidation within the International Inequalities Institute of the London School of Economics and more recently of the World Inequality Lab, linked to the Paris School of Economics, which investigate on a global scale and in an interdisciplinary perspective the themes of social and economic disparities.
The issue is also receiving renewed attention in multilateral institutions, which detect the links between growing inequalities, market distortions, technological changes, and other factors, together with the role of globalization processes and the difficulties of public policies in adequately addressing these changes.
The contributions of Atkinson and Piketty [
9,
43] and other scholars [
10,
18,
19] have shown that, since the postwar period, high-income growth has spread to all Organisation for Economic Co-operation and Development (OECD) countries, but this represented an exception rather than the norm of the global economy. The 1980s, in fact, marked the end of this dynamic with a sharp increase in higher incomes, the stagnant trend of average incomes, and the progressive decline of the weaker segments.
Rosés and Wolf [
48,
49] have investigated the economic trend of European regions over the past 110 years, building a data set of 173 regions to understand the evolution of growth in terms of employment structure, regional GDP, and per capita GDP, with the same purchasing power in the long run. What emerges is, in the first instance, that the level and growth of per capita GDP can be explained taking into account geographical and institutional factors, according to central–periphery relations. However, in evolutionary terms, data shows something more: in the long run, there is a noticeable variation within states and the role of the profound changes that have taken place since 1980. The share of the variation in per capita GDP due to the differences within individual countries went from around 30% in 1900 to over 50% in 2010. From 1980 onwards, there has been a growing disconnection between neighboring regions, presenting “islands” of prosperity concentrated around metropolitan areas and with the rest of the territories showing conditions of marked fragility. On the other hand, some metropolitan regions have been hit hard by the crisis, while some rural and intermediate regions have shown greater resilience [
50]. The overall result consists of a territorial framework articulated with income and labor-force participation gaps between countries and regions, within the regions themselves, between central and peripheral areas, and between prosperous metropolitan and less prosperous territories—as documented widely by Iannarino et al. [
22].
The reflections and joint action of globalization processes, technological change, and the direction of public policies have contributed to the generation of new geographies [
22,
51]. Numerous rural regions and some medium–small metropolitan areas with a past of prosperity as well as some manufacturing cities have experienced a decline in employment, labor force participation, and the same per capita income; the surrounding suburban or rural portions are characterized by stagnating economic conditions—incomes in particular. In places where employment registered a relative increase, this was of modest quality, including relatively less skilled jobs.
The most relevant evidence in this development is the U-shape of the model of regional inequality, similar to the trend of income inequalities [
47]. After 1900, growth and convergence between regions increased until around 1980, when the divide between regions and spatial concentration increased again. Lastly, it is worth pointing out that the U-shaped trend between Europe and the United States tends to be parallel, as a consequence of the reversal of public policies, in particular the redistributive ones due to the contraction of the negotiating power of labor.
The Atkinson research group [
11], starting from the contribution of Atkinson and Morelli [
17], has reconstructed the evolution in the last century of five different dimensions of economic inequality (namely, incomes higher than the median value, income inequality, percentage of people living in households with a disposable income inferior than 60% of the median, share of 1% of net wealth, and share of 1% of the highest incomes) for twenty-five countries representing more than two thirds of the world population.
From a spatial perspective, the analysis of inequalities must disarticulate considering the different forms related not only to economic disparities but also to social and recognition ones. Economic disparities concern the differences in income, private wealth, and working conditions and in the consequent material conditions of life, social differences [
52,
53], and gender differences [
54]. Furthermore, inequality affects disparity in access and in the quality of essential services; in accessibility to knowledge [
55], to cultural services, and to places of socialization; and in the possibility of accessing and enjoying common goods and natural resources. It must take into account environmental issues and the different forms of pollution. In this direction, some scholars [
56] point out that it is no longer possible to separate the dimensions: it is ineffective to reason around social and economic disparities without considering the implications related to state inequalities.
Recognition inequalities [
57,
58] are those for which people’s roles, abilities, skills, and aspirations are not considered by society, preventing the effective realization of individuals, mortifying their dignity, and determining a sense of deep fracture in the collective dimension. These forms of inequality, still not very much studied due to the complexity linked to their measurement, find in labor the main and widest form of declination.
The spatial dimension has a marked centrality in social and recognition inequalities, which represent a powerful lever of fear and anger and, for example, find a recognizable expression in the acts of vote and preference. Spatial disparities concern, for example, rural areas, where about a quarter of the EU28 population lives in Europe and North America: they present a higher risk of poverty and social exclusion of urban areas [
23], although, as mentioned, the gap has narrowed in recent years. These areas, more disadvantaged in terms of social differences, show significant weight in political and electoral terms.
Andrés Rodríguez-Pose [
59] in a recent essay titled “The revenge of the places that don’t matter” discusses the political and territorial conflicts related to the 2016 Brexit vote in the United Kingdom; the 2016 Donald Trump election in the United States; the Austrian presidential elections in 2016; and the French and German presidential elections in 2017. Rodríguez-Pose analyzes the “revenge” of the “places that don’t matter” to assign centrality to the role of the spatial dimension and to the role played by economic disparities in guiding the election results as well as the risks in terms of authoritarian drifts.
In this interpretation, the urban and geographical suburbs on a global scale converge within a common representation that moves from the articulation of social and economic disparities.
Building maps of income inequality in Italy and Europe is important in order to be able to describe territorial differentiations, a particularly relevant objective in Italy. In this country, for many economic indicators, the territorial gaps are much greater than those recorded in comparison with other European countries [
26]. In this context, the choice of the disaggregation of data at the municipal level and the role of the NSIA classification—which focuses on the role of citizenship rights, overcoming the traditional dichotomous urban rural reading linked to density and concentration—are placed in an attempt to provide measures and mappings that enrich the reflection on inequalities by integrating the centrality of the spatial perspective.
3. Data Set and Methods
Inequality was measured with the Gini’s concentration coefficient (G) in its traditional formulation [
60]. Since the exact distribution of incomes is not known.
The index was constructed by classes according to the progressive categories of gross income, assigning the average category income to each class. The data used is the one reported in the IRPEF (Imposta sul Reddito delle Persone Fisiche, Tax on Income of Physical Persons) declarations and published by the Ministry of Economy and Finance on a municipal basis. The use of this data obviously requires some caution due to the level of tax evasion, which involves an underestimation of real incomes [
61], but nevertheless allows us to grasp the dimensions of the phenomenon investigated. In any case, the coefficient represents a partial indicator as a measure of the well-being of a society that, for example, omits the income associated with the use of goods available in nature or the result of family work.
The Gini coefficient calculated on gross income is higher than the one that would be obtained by taking into account the tax levy, which normally has redistributive effects. Due to the partial harmonization of the tax systems present in the various Italian administrative realities, for the sake of methodological simplicity and in order to avoid distortions, it was decided to consider gross income. Furthermore, the changes in the Gini coefficient compared to 2008 were calculated, the year closest to the beginning of the recession on a global scale (that also involved Italy in particular) for which income statistics are available on a municipal basis.
The Gini coefficient was used to measure inequality at the level of NSIA categories mentioned above and at the municipal level. In the latter case, the index values expressed in quantiles were represented on a cartographic basis through the application of Geographic Information Systems (GIS) methodologies.
The spatial autocorrelation analysis (Exploratory Spatial Data Analyis, ESDA) was carried out in order to identify atypical locations and outliers, to verify the presence of clusters or hot spots of locations with similar behavior, and therefore to suggest the presence of spatial patterns. The data has been arranged in a matrix that gives an account of its spatial ordering in terms of territorial contiguity:
, with
if two municipalities
i and
j are contiguous, otherwise
, where
ni is the number neighboring municipalities in a given area
i. Subsequently, the well-known Moran index of spatial autocorrelation, I [
62], on a global scale and the Local Moran index (LM) [
63] were calculated at the municipal level in order to highlight the municipalities that contribute in a meaningful way to global spatial autocorrelation.
With the aid of a multivariate analysis model, it is possible to attempt an estimate of the effects of each cause or spatial variable on the Gini coefficent, used as a measure of the degree of inequality.
Gini coefficient is the dependent variable in the regression analysis, while explanatory variables have been selected in consideration of their aptitude to explain the role that the territory can play in analyzing the causes of inequality. Their identification is part of the theoretical methodological guidelines attributable to NSIA and of the line of investigation connected to a place-based approach [
1,
13,
22,
64]. The variables are summarized in
Table 1.
Recalling the information content of the Gini coefficent, if we compare territories with very different demographic dimensions and similar inequality values, it is intuitive that, overall, the part of individuals or classes of the larger areas predominates. In the Italian case, the average size of the municipalities is less than 5000 inhabitants but more than half the population lives in cities of at least 60,000 inhabitants [
65]. It follows that, when comparing the municipal data on inequality, it is appropriate to implement a weighted OLS procedure to take into account the different demographic weights.
Income Y is identified as an indicator of the level of local development, following the contributions that have analyzed income inequalities starting from tax data [
26,
34,
35,
66].
Along with a view of inserting multidimensional aspects that go beyond the mere consideration of the difference in population density in the analysis of rural urban divides [
16], population density is identified as an indicator of the level of urbanization and rurality of the territory and considered in the framework of an analysis of the settlement features of the territories in the context of the specificities of the Italian case [
1,
67].
The seniority index is used to check the composition of the population and the redistributive effects of pensions [
68,
69].
Following the analytical approach linked to NSIA, the presence of municipalities is classified as “hubs” in accordance with the strategy itself as an indicator of the presence of services and employment opportunities.
The share of the population having access to broadband is identified as an indicator to control the effect of the so-called “skill-biased technological change” as well as to measure intangible access and connectivity and the digital divide. These are considered conditions related to citizenship services, to access to knowledge, and to the exchange in their social and economic values [
9,
51,
70,
71]. These specifications have been expanded with the introduction of variables related to mobility [
72] such as accessibility by altimetric area, the class of distance from the capital, and the presence of railway stations with ground staff.
Finally, it was decided to introduce variables related to hydrogeological risk, with the measurement of the class of population exposed to landslides [
28,
64,
73] and the seismic risk index to assess resilience of the territory with respect to natural disasters.
The working hypotheses to be empirically tested are the following:
- I.
Inequality should be greater in urban centers, where income levels are high and the incidence of tertiary activities is significant.
- II.
Inequality should be greater in easily accessible territories, where the spread of new technologies is higher.
- III.
Inequality should be greater in territories that are densely populated and characterized by environmental risk.
The 2012 variables change slowly over time, and consequently, they can be used to adapt the model to further analysis.
Table 2 shows the main descriptive statistics relating to the indicated variables. Sensitive differences between average and median values are mainly due to asymmetry in data distributions.
Income (Y) has the lowest relative variability in the set of variables: the highest values are recorded in some municipalities in the metropolitan city of Milan, home to luxury residential districts. While the lowest values are registered in some mountain municipalities on the border with Switzerland, in reality, most of the residents work and pay taxes in the Swiss territory.
The average value of the population density (D, 300 inhab./square km) is typical of densely urbanized countries but with considerable differences between small mountain municipalities in which the surface is mainly occupied by natural areas and municipalities with very high population density in the metropolitan belt of Naples. The former can have a very high seniority rate (Ag) due to the emigration of families and the consequent very low birth rate, while the latter is often found for younger municipalities with a ratio of about two teenagers (under 14) for each elderly (over 65).
With regard to the remaining variables, it should be noted that the municipalities (Hub) represent only 3% of the total, while on average, the coverage of broadband from the fixed and mobile networks (Div) is approximately 20% and the presence of stations railway with ground staff (R) concerns only one municipality in ten. From a geographical and environmental point of view, most of the municipalities fall within the inner hilly belt (alt, the coastal mountain is not very widespread) and are slightly more numerous in the north (geo is positive). The share of the population on average exposed to landslides (L) varies from 75 to 250 inhabitants, while the median value is 5 inhabitants per municipality. This value is to be taken as a reference, since the limit value of 5000 has been attributed conventionally for the class with a threshold greater than 3000 inhabitants. The middle class of seismic risk (T) is a representative synthetic value which, of course, tends to increase in the passage from the plain areas towards the mountains, especially along the Apennine mountains.
The equation of the linear model used for the estimation, in the explicit form, is as follows:
where the meaning of the abbreviations of the variables is reported in
Table 1.
The difficulty of collecting data at the municipal level made it impossible to create a panel data set. Consequently, it was impossible to apply models used in other inequality studies [
74,
75,
76,
77,
78]. Even if the evolution of the variables considered can be considered stationary at least in the short to medium term, the adoption of the cross-sectional model will not allow to interpret the results in terms of randomness. For this reason, a potential limit of the analysis lies in the fact that the results will be interpreted as associations.
4. Results
Average incomes and Gini coefficient by NSIA area are shown in
Table 3. Between centers and inner areas, there is a gradient in the average and median levels of incomes. The “urban” character of the centers proposes the same dichotomous structure along the transversal city–countryside dimension that is observed on a national scale between the northern and southern regions [
34].
The asymmetrical distribution of services is in fact reflected in a gap in job opportunities, which leads to an increase in the inequality index especially in the hubs, namely, in the places where the opportunities are greatest, with a decrease up to a minimum in the municipalities belt followed by a slight increase and trend towards stabilization in the municipalities of the internal areas. This minimum can be explained by the relative concentration of families of commuters in the municipalities closest to hubs, where the cost of rents or housing is lower and is compatible with an average level of wages and with salaries less dispersed than the distribution queues (i.e., the middle class composed of workers and employees predominates).
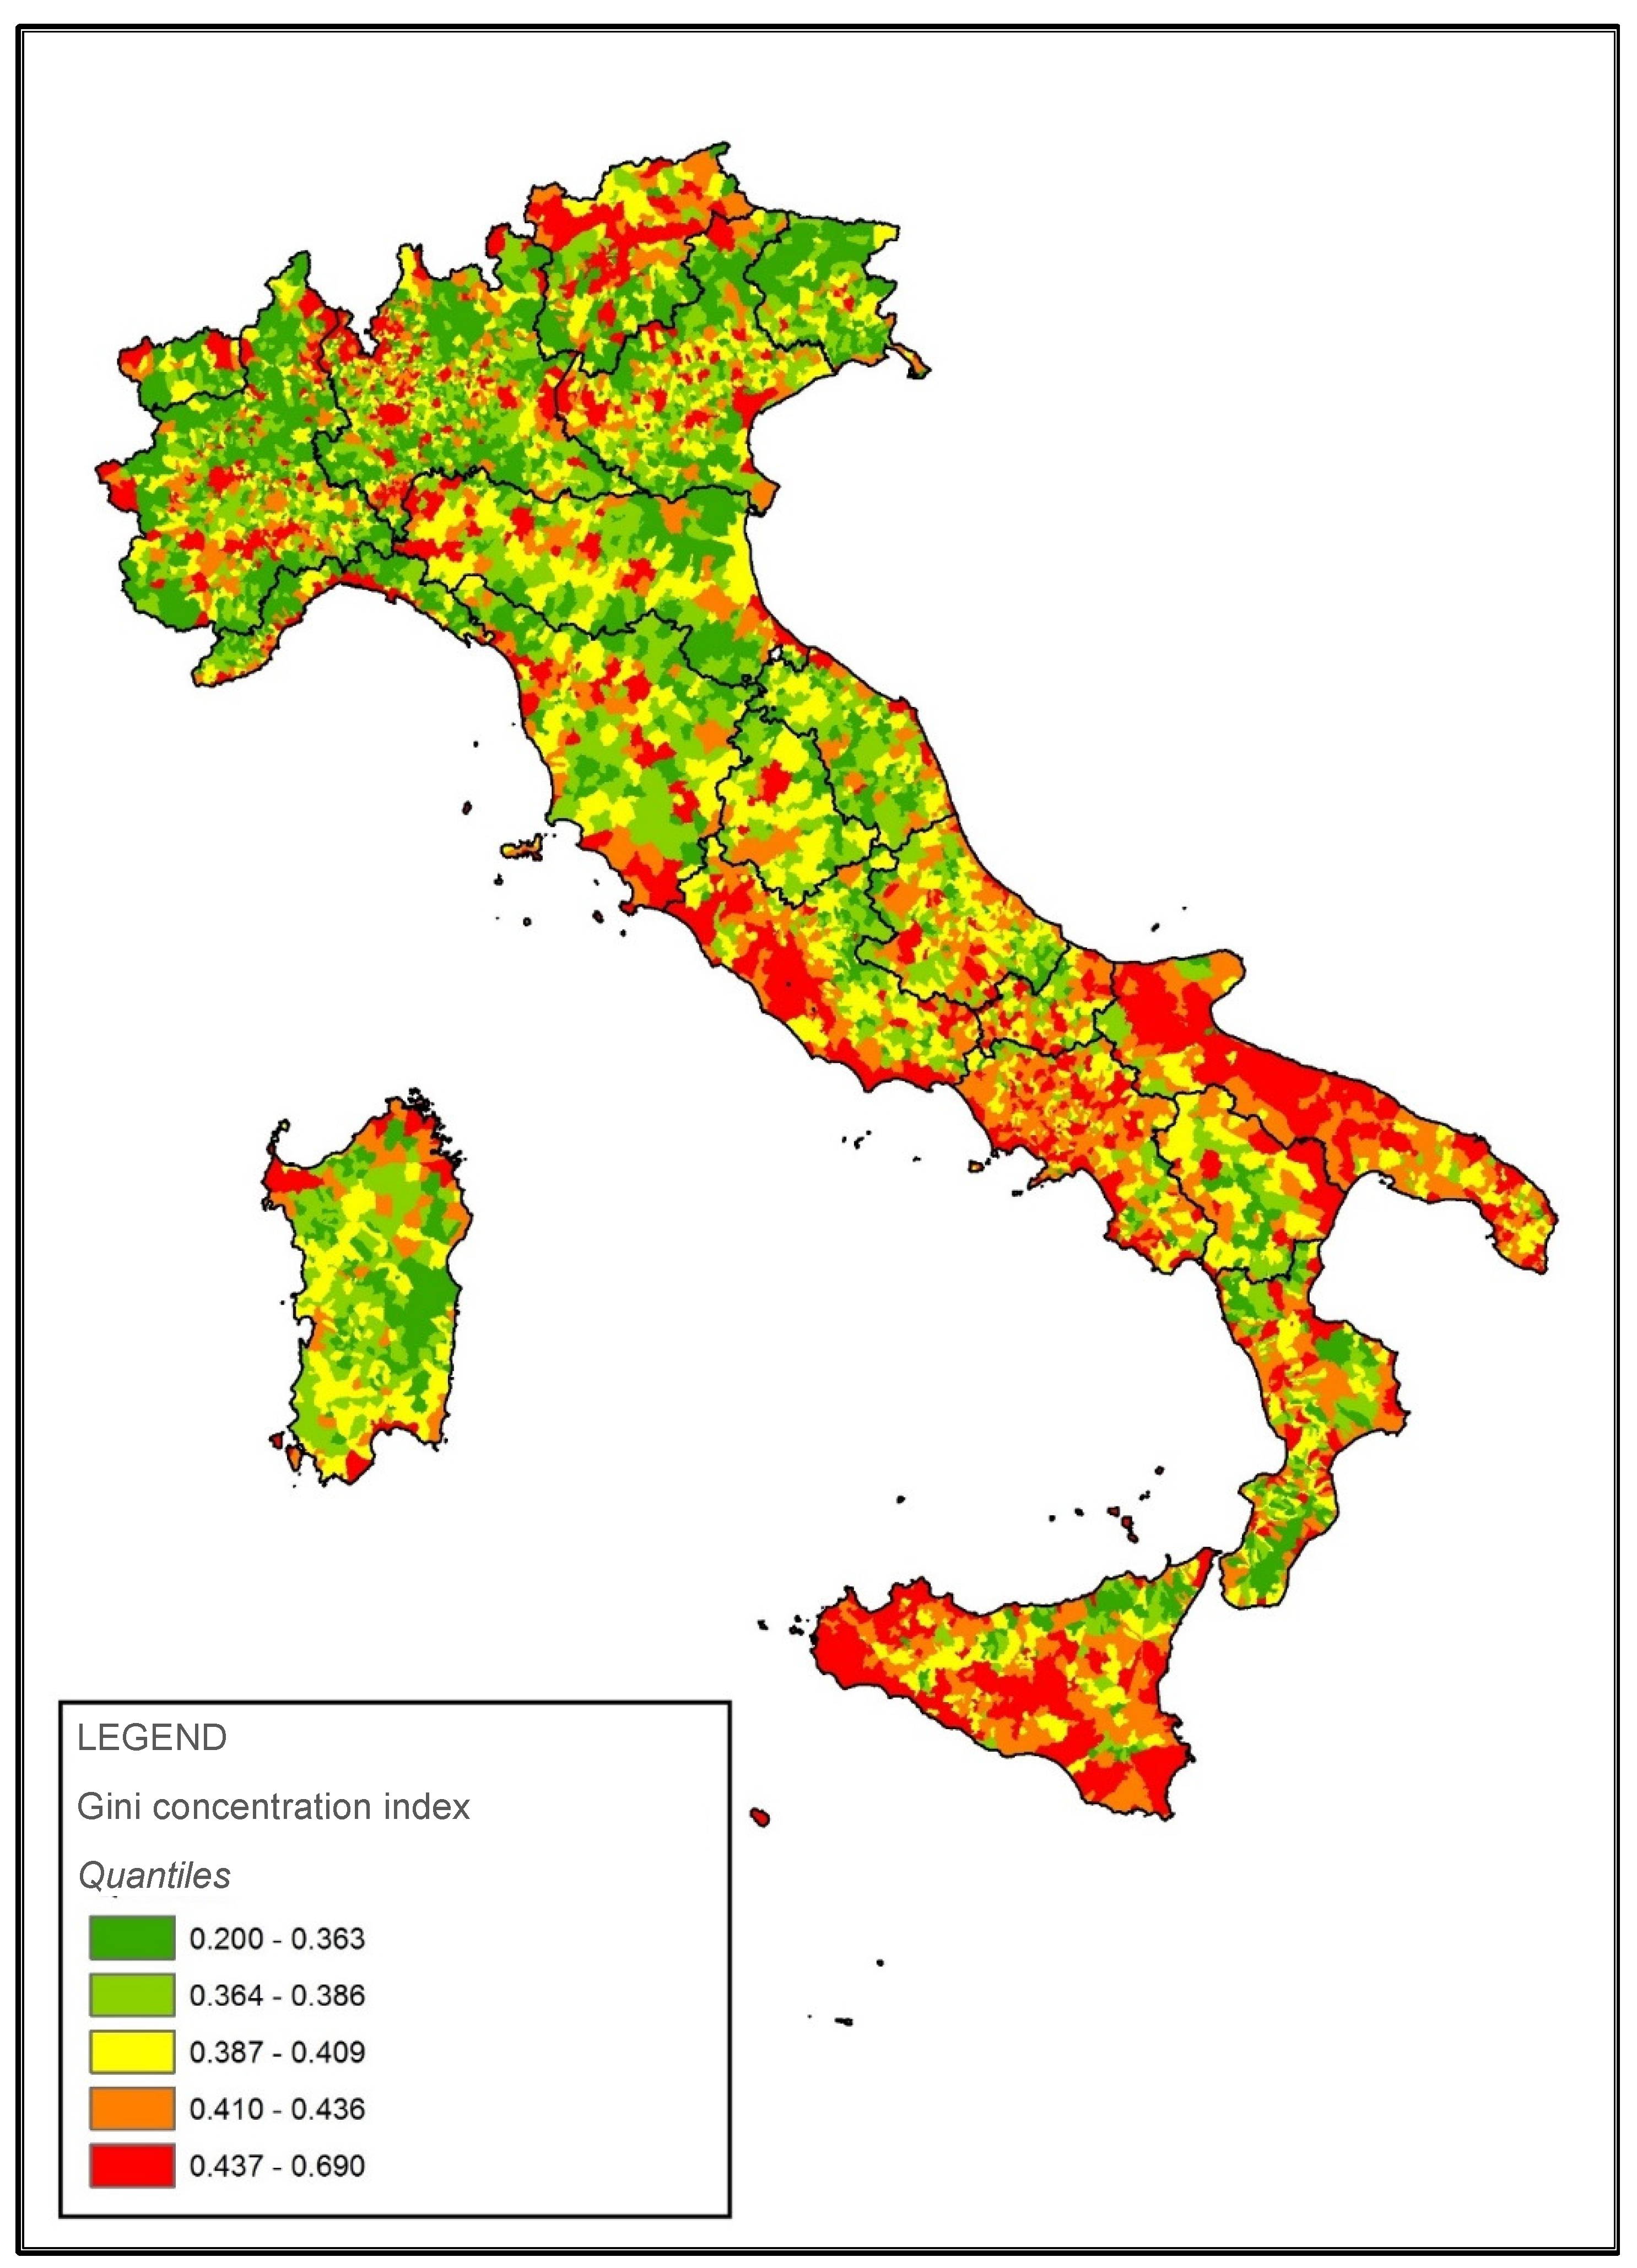
The inequality map is represented in
Figure 1. It was elaborated starting from municipal data, in which the Gini coefficient is reported in quintile classes. The red areas identify the portions of territory where inequality is concentrated, while the green areas are those in which the income distribution is more homogeneous. The metropolitan city of Rome as well as the hubs of the northern regions and some areas of Puglia and Sicily emerge.
As for the spatial distribution of Gini coefficient, the Moran index is positive (I = 0.3646) and significant (p < 0.001): this result suggests the presence of spatial fallout. In other words, municipalities with high (low) Gini coefficient values tend to position themselves near municipalities with high (low) values.
The application of Local Moran (LM) (
Figure 2) shows the presence of areas formed by municipalities with high values (AA) especially in the areas of southern Italy and in some areas of central Italy and low (BB) in the districts of northern Italy; conversely, the presence of high–low (AB) and low–high (BA) modes is somewhat reduced.
However, the spatial contiguity matrix was approximately constructed due to the difference between the number of municipalities present in Italy in 2015 (7939 units) and those present in the year in which the NSIA classification was carried out (8092 units). As a result, the rows and columns relating to the municipalities no longer present in 2015, compared to the NSIA ones, have been eliminated. In particular, this situation makes it impossible to apply a formal spatial regression model (SAR) or spatial error model (SEM) to the data.
Consequently, the analyses are based on a classic linear regression model.
Table 4 shows its main results. The histogram of the residuals is showed
Figure 3.
A first element of reflection is that the model explains 60% of the observed variability, confirming the strong territorial characterization of inequality in Italy. A second consideration is that, except L, all the selected variables are quite significant. In detail, the t ratio between coefficients and standard errors reports the relative variation of Gini coefficent, associated with a unitary variation of the explanatory variables. The last columns on the right show the p values and the relative significance under the hypothesis of robust standard errors with respect to heteroskedasticity (i.e., in the presence of a nonconstant variance between the residuals or discrepancies between observed and estimated values of the dependent variable, a possible cause of distorted estimations of the model parameters).
The positive values of the estimated coefficients indicate that possible variations in the reference variables would have a consequence in the same direction as the dependent variable. On the contrary, the negative values in the coefficients show an inverse behavior between independent and dependent variables.
The relation between Gini coefficent and income Y is clearly significant from an economic point of view and indicates a greater inequality in the places where income levels are higher, probably due to the greater weight of capital income and autonomous labor, which amplify the imbalances in the distribution of total income [
18]. This situation calls for reflection on the functional distribution of income between work, profits, and rents [
9].
Moving to the demographic variables, the population density D has a positive association, while the seniority rate (Ag) is negatively correlated to Gini coefficent. In relation to this, a greater inequality is to be assumed in densely populated areas with a relatively young population, while in the territories where the number of the elderly is higher, the distribution of income appears more balanced and this occurs essentially thanks to the contribution of the pension system, which has an “equalizing” effect.
Other variables positively associated with an increase in Gini coefficent are Hub and R. Inequality is relatively greater in easily accessible urban hubs, where services are concentrated and the management centers of public and private institutions operating in the industrial and financial sector are located rather than in the internal areas more distant from the centers. This highlights how, as in hubs, the greater job opportunities do not always allow populations to achieve decent living conditions, probably due to low wage levels and precarious conditions.
The spatial impact on inequality in Italy is further endorsed by the signs of the alt and geo variables, both negatively correlated with the index. In relation to this, it is legitimate to assume a greater inequality in the plain and coastal areas and, as already highlighted in the previous paragraph, in the south.
The div variable is negatively correlated with the dependent variable too: as the share of the population without broadband coverage increases, the inequality decreases. Digital infrastructures are present in Italy especially in urban areas. Information technology is associated with the phenomenon of skill-biased technological change, which represents one of the main drivers of inequality [
70,
71]. According to this phenomenon, workers who would have greater access to advanced technologies would enjoy better career opportunities and income growth than the less skilled workers, with the risk that the most innovative areas will be affected by a new malaise, the one definable “technological unemployment” [
79]. It is also to be assumed that digital technologies give higher employment opportunities to graduate workers, who are associated with a positive correlation with inequality [
55].
The t variable is positively associated with G. This result clearly highlights the presence of seismic risk phenomena in contexts in which inequality is greatest. These areas of social and environmental fragility probably have a lower ability to react to possible natural shocks—namely, a lower resilience capacity. From this, it follows that these situations call for reflection on the need to carry out interventions aimed at securing the places most at risk that are the most populous ones in the urban areas of southern Italy.
In summary, the most plausible explanation of the territorial characterization of inequality is probably to be found in the different structure of the social and economic fabric that characterizes urban hubs, where situations of hardship and potential conflict are found. It is less cohesive and more diversified and with greater incidence of tertiary activities with strong heterogeneity of professions ranging from the offer of highly specialized intellectual services, especially in the credit, financial intermediation, and tourism sectors, to low-skilled manual services (i.e., cleaning services).
In urban hubs, the four “engines” that fuel inequality [
80], such as the power of capital over labor, oligarchic capitalism, the individualization of economic conditions, and the backwardness of politics, probably develop a power greater than in other Italian areas, inner and mountain areas in particular.
In the centers, there is probably a persistence and intergenerational transmission of inequalities [
81], and with the process of intensification of migratory flows, the inequalities generated by belonging to different ethnic groups emerge [
53,
82,
83]. It is always in the centers that a greater tolerance towards inequalities is spreading [
84].
In the inner and mountain areas that have a significant production rarefaction, agriculture has an important role in terms of added value and employment. Therefore, in these areas, the distribution of income which is more balanced than in other territories, must be related to the presence of farms with rather homogeneous structures and cultivation systems as well as to the aid schemes of the Common Agricultural Policy, so particularly to direct payments, which reduce the concentration of agricultural incomes [
85] and have a redistributive effect.
In mountain and inner areas, the aging process of the population is also more pronounced due to the demographic decrease that has affected these areas in the past [
65], and consequently, the lower inequality must be related to the relative prevalence of pension income, characterized, as highlighted earlier, by a greater leveling compared to labor income.
Even the digital divide, which can be measured as a difference in the degree of accessibility to telecommunications services from fixed and mobile networks, represents a significant obstacle to the establishment of structures and services with high technological content in the municipalities of the inner areas and translates into a widespread presence of traditional activities with consequent despecialization of work, which probably has the effect of mitigating inequalities.
5. Discussion and Conclusion
This contribution highlighted the influence of the spatial dimension on income inequality in Italy. Inequality appears greater in densely populated urban centers with a high incidence of tertiary activities and young population. These are easily accessible centers, mainly located in the plain and coastal areas of central-southern Italy, more vulnerable from a seismic and hydrogeological point of view.
In the inner areas, the inequality is lower due to the homogeneity of the economic system; significant is the role of agriculture and pensions that have a redistributive effect. In fact, in the inner areas, the distribution of income is more balanced due probably to the fragility of the social and productive structure, which determines slightly lower levels of income than in the centers and greater job opportunities, mainly in the agricultural sector. In these areas, however, there is a systematic inequality in access to fundamental health [
86], education, and mobility services, which undermines the fundamental rights of citizenship; in real preconditions for sustainable development; and within the framework of the objectives of the Agenda 2030.
The paper sought to provide descriptions that restore the element of “granularity” [
87] of the ongoing economic, social, and environmental processes that produce very minute spatial boundaries. This contribution has sought to shed light on the territorial aspect of disparities, choosing the municipal level in order to develop descriptions of a smaller scale, capable of providing some interpretative keys of the territorial fragility that deserve, also within future research efforts, further local insights.
The role of the correlation between economic disparities and social regression represents a field of investigation. For example, in the direction of understanding anti-European issues or a protest vote, new research and measurement interests are placed [
59], connected to the emergence of authoritarian drifts in Europe and on a global scale.
In this direction, further efforts can be made not only to investigate the relationship between inequalities and closures of identity but also—more generally—to analyze the forms of territorial fragility in the inner areas.
Lastly, it may be useful to recover some reflections on the relation between the territorial dimension of inequalities and the role of policy action, in particular under a sustainable point of view within the framework of the Agenda 2030.
Policies of the place-based kind [
13] aimed at the production of collective goods can contribute to reducing inequalities; to creating new employment and income opportunities, especially in the inner areas; and to reversing the negative demographic trend of these areas, in particular reducing the exodus of the working-age population in urban centers. In the direction of restoring centrality to territorial specificities as a distinctive element of the policy action, the Lisbon Agenda and, subsequently, the Strategy 2020 updated the analysis of the convergence processes of economic development in Europe. However, as some scholars point out [
9,
22], it is necessary to seek integration between the so-called people-based policies, related to mobility, to healthy [
88], to education, and to the so-called place-based ones [
13] connected to employment, particularly focusing on the diffusion of knowledge, to innovation, and to a place-sensitive perspective [
22], which combines an individual perspective with a territorial one to face the multiple development trajectories [
89].
In general, the list of policies aimed at reducing inequalities is quite broad and diverse and includes—in addition to redistributive policies—macroeconomic policies, competition policies, tax policies, welfare, and education policies. The spatial issue of inequality makes, probably, insufficient the recourse to solely redistributive policies and urges the application of actions aimed at affecting the functioning of markets, corporate governance mechanisms, the intergenerational transmission of advantages and disadvantages, and more generally a link between structural and sectorial policies [
90,
91,
92]. In detail, policies aimed at eliminating the causes of market failure can be considered more effective in reducing inequality, when this is induced by factors that favor capital and labor income positions, which distort the functioning of markets and make them inefficient.
In relation to this, interventions must be aimed at (a) increasing competition in the oligopolistic sectors; (b) liberalizing professions; (c) regulating the sectors of the fundamental economy; (d) enhancing public services, especially in the inner areas; and (e) removing annuity positions. These policies can also reduce not only the efficiency issues related to the application of other policy measures, in particular the redistributive ones, but also those of practicality linked to the budget availability, as they are applicable “at no cost”.
The reduction of inequality in innovative sectors must be tackled taking into account that there is a misalignment between supply and demand in the sectors that show a clear geographical location. Some technologies can lead to a drastic reduction in jobs and can create “new” jobs slowly, probably due to cultural gaps in the digital field, which allow the technologies to be used well. The result is a framework in which training policies and social infrastructure processes take on a strategic role in allowing access to technologies to everybody.
The conceptual framework drawn by the authors and the results of the analysis conducted are part of a broad ongoing reflection, both among scholars and between policy makers, on the European inner and peripheral areas and their development trajectories, which addresses some crucial issues in the regional studies debate. The role of spatial analysis and the geographic scale crossed with the specific administrative and functional units of NSIA offer to the place-based approach important elements for the construction of future territorial policies and their impacts on sustainable local development.


