1. Introduction
It has been demonstrated that Earth Observation (EO) via satellites provides a useful tool to monitor, report, and verify the management of sustainable land use and land cover (LULC) in tropical forests [
1]. For example, the maps generated with EO data enable institutions to monitor deforestation [
2,
3]. Since 1973, the Brazilian Institute for Space Research (INPE) has been monitoring deforestation in the Amazon forest by using Landsat EO data [
4]. Since 1988, INPE has assessed the annual deforestation rates via the Amazon Deforestation Monitoring Project (PRODES), a leading example of operational monitoring to quantify land-cover change via EO data [
4,
5,
6]. While PRODES provided annual deforestation rates, INPE has also developed the Near Real Time Deforestation Detection System (DETER) to meet the needs of other users that require near-real time detection for early warning and the potential for quick response by government agencies [
7]. Information derived from PRODES and DETER is used by law enforcement and other institutions to help support actions on the ground [
8]. INPE sends deforestation alerts to institutions such as the Brazilian Institute of Environment and Renewable Natural Resources (IBAMA) [
9]. DETER was created in 2004, following demand from IBAMA to provide high-frequency alerts of deforestation instead of relying on annual data from PRODES [
9]. The information derived from PRODES and DETER is widely used by different agencies to verify deforestation and land use changes in the Amazon [
10,
11,
12]. Indeed, deforestation in the Brazilian Amazon, defined as clear cutting and conversion of the original forest cover to other land uses [
13], reduced from 7893 km
2/annum in 2016 to 6947 km
2/annum in 2017, but increased to 7536 and 10,129 km
2/annum, respectively, in 2018 and 2019 [
14].
This paper builds upon previously published work that illustrated how EO datasets, including the increasing availability of free datasets, has enabled users to generate and use the information available to them [
15]. Achard and Hansen [
4] suggest that, while unprocessed EO data from a range of satellite sensors may be available for a region of interest, adequate tools are essential to download and preprocess the data, to facilitate user access. Overall, there remains a lack of research to date on the challenges faced by users when trying to access, process, and use EO data for environmental management and other sustainability purposes [
9,
15]. In the present research, our objective was to address four key questions regarding these challenges:
What uses are made of EO data?
What are the factors that limit the use of EO data?
What are user needs/expectations with regard to EO data?
What suggestions do users have for improving EO data use?
“EO data” in these questions span both the raw data and the information that can be derived from those data. Cerbaro et al. [
15] noted that some of the major challenges identified in the complex and multifaceted aspects of using EO data were associated with access to, and with the processing of, raw data into usable information. The analysis also revealed novel insights on a lack of inter-institutional communication, adequate office infrastructure and personnel, availability of the right type of EO data and funding restrictions, political instability, and bureaucracy as factors that limit more effective use of EO data in Brazil at present. They used these findings to develop a conceptual model to illustrate the main steps and limitations in the flows of EO data and information for use in the management of land-use change in Brazil. This paper extends that work by reporting the results of a research project undertaken between 2016 and 2017 that was one of the first of its type designed to focus specifically on the challenges faced by end users and their needs/expectations when applying EO data for environmental and sustainability management in Brazil. The paper is structured to present the results obtained regarding each of the four questions, in turn, before arriving at an integrated discussion and conclusions.
3. Results
3.1. Uses Made of Earth Observation Data (RQ 1)
The main reported uses of EO data in this research were for agricultural forecasting, disaster management, land-use planning, environmental management, and monitoring deforestation in the Amazon region.
Table 1 shows that a majority of data used were from freely available sources, such as Landsat 8 (30 m resolution), Rapideye (5 m resolution), and Sentinel 2 (10 m resolution).
EO data made available through various government agreements with private sector providers are important. The acquisition of Rapideye (5 m) data by the federal government also enabled users in public institutions to access EO data from such private sector sources. The acquisition of SPOT 6/7 (10 m and 2.5 m;
https://earth.esa.int/web/eoportal/satellite-missions/s/spot-6-7) by the state of Mato Grosso and FORMOSAT (15, 4, and 2 m) by the state of Acre are examples of private EO data used in state institutions. SPOT is a commercial satellite operator that offered a range of EO data (2.5, 5, 10, and 20 m), and the main goal is to guarantee a sustainable operational service to customers [
18]. FORMOSAT is a program at the National Space Organization of Taiwan (NSPO), and the EO data are available at a cost for end-users, and can be used for applications such as a planning tool for urban development, environment and crop health monitoring, and disaster assessment [
19]. Several respondents mentioned that Landsat 8 (30 m) and Sentinel 2 (10 m) meet the demand for monitoring deforestation and land-use applications at a large scale, but not for land-use management in small properties at the national level. Both Sentinel and Landsat EO data are available at no cost for end-users.
However, key respondents complained that all the privately available EO data are over five years old and needed updating at the state level. The demand for new EO data at high spatial resolution for various applications, such as monitoring urban fires in Rio Branco and land-use planning, was mentioned by more than 50% of respondents. In Cuiaba, the state of Mato Grosso purchased the EO data for the entire state in 2008. The final products of the INPE Fire program and the information from PRODES are also widely used in several institutions. For example, the data of PRODES is used by environmental agencies (SEMA) in both Cuiaba and Rio Branco.
All respondents highlighted the importance of EO data to support their respective activities, indicating strong user recognition for its value in environmental management in relation to the first key research question of this study.
3.2. Limitations on the Use of EO Data (RQ 2)
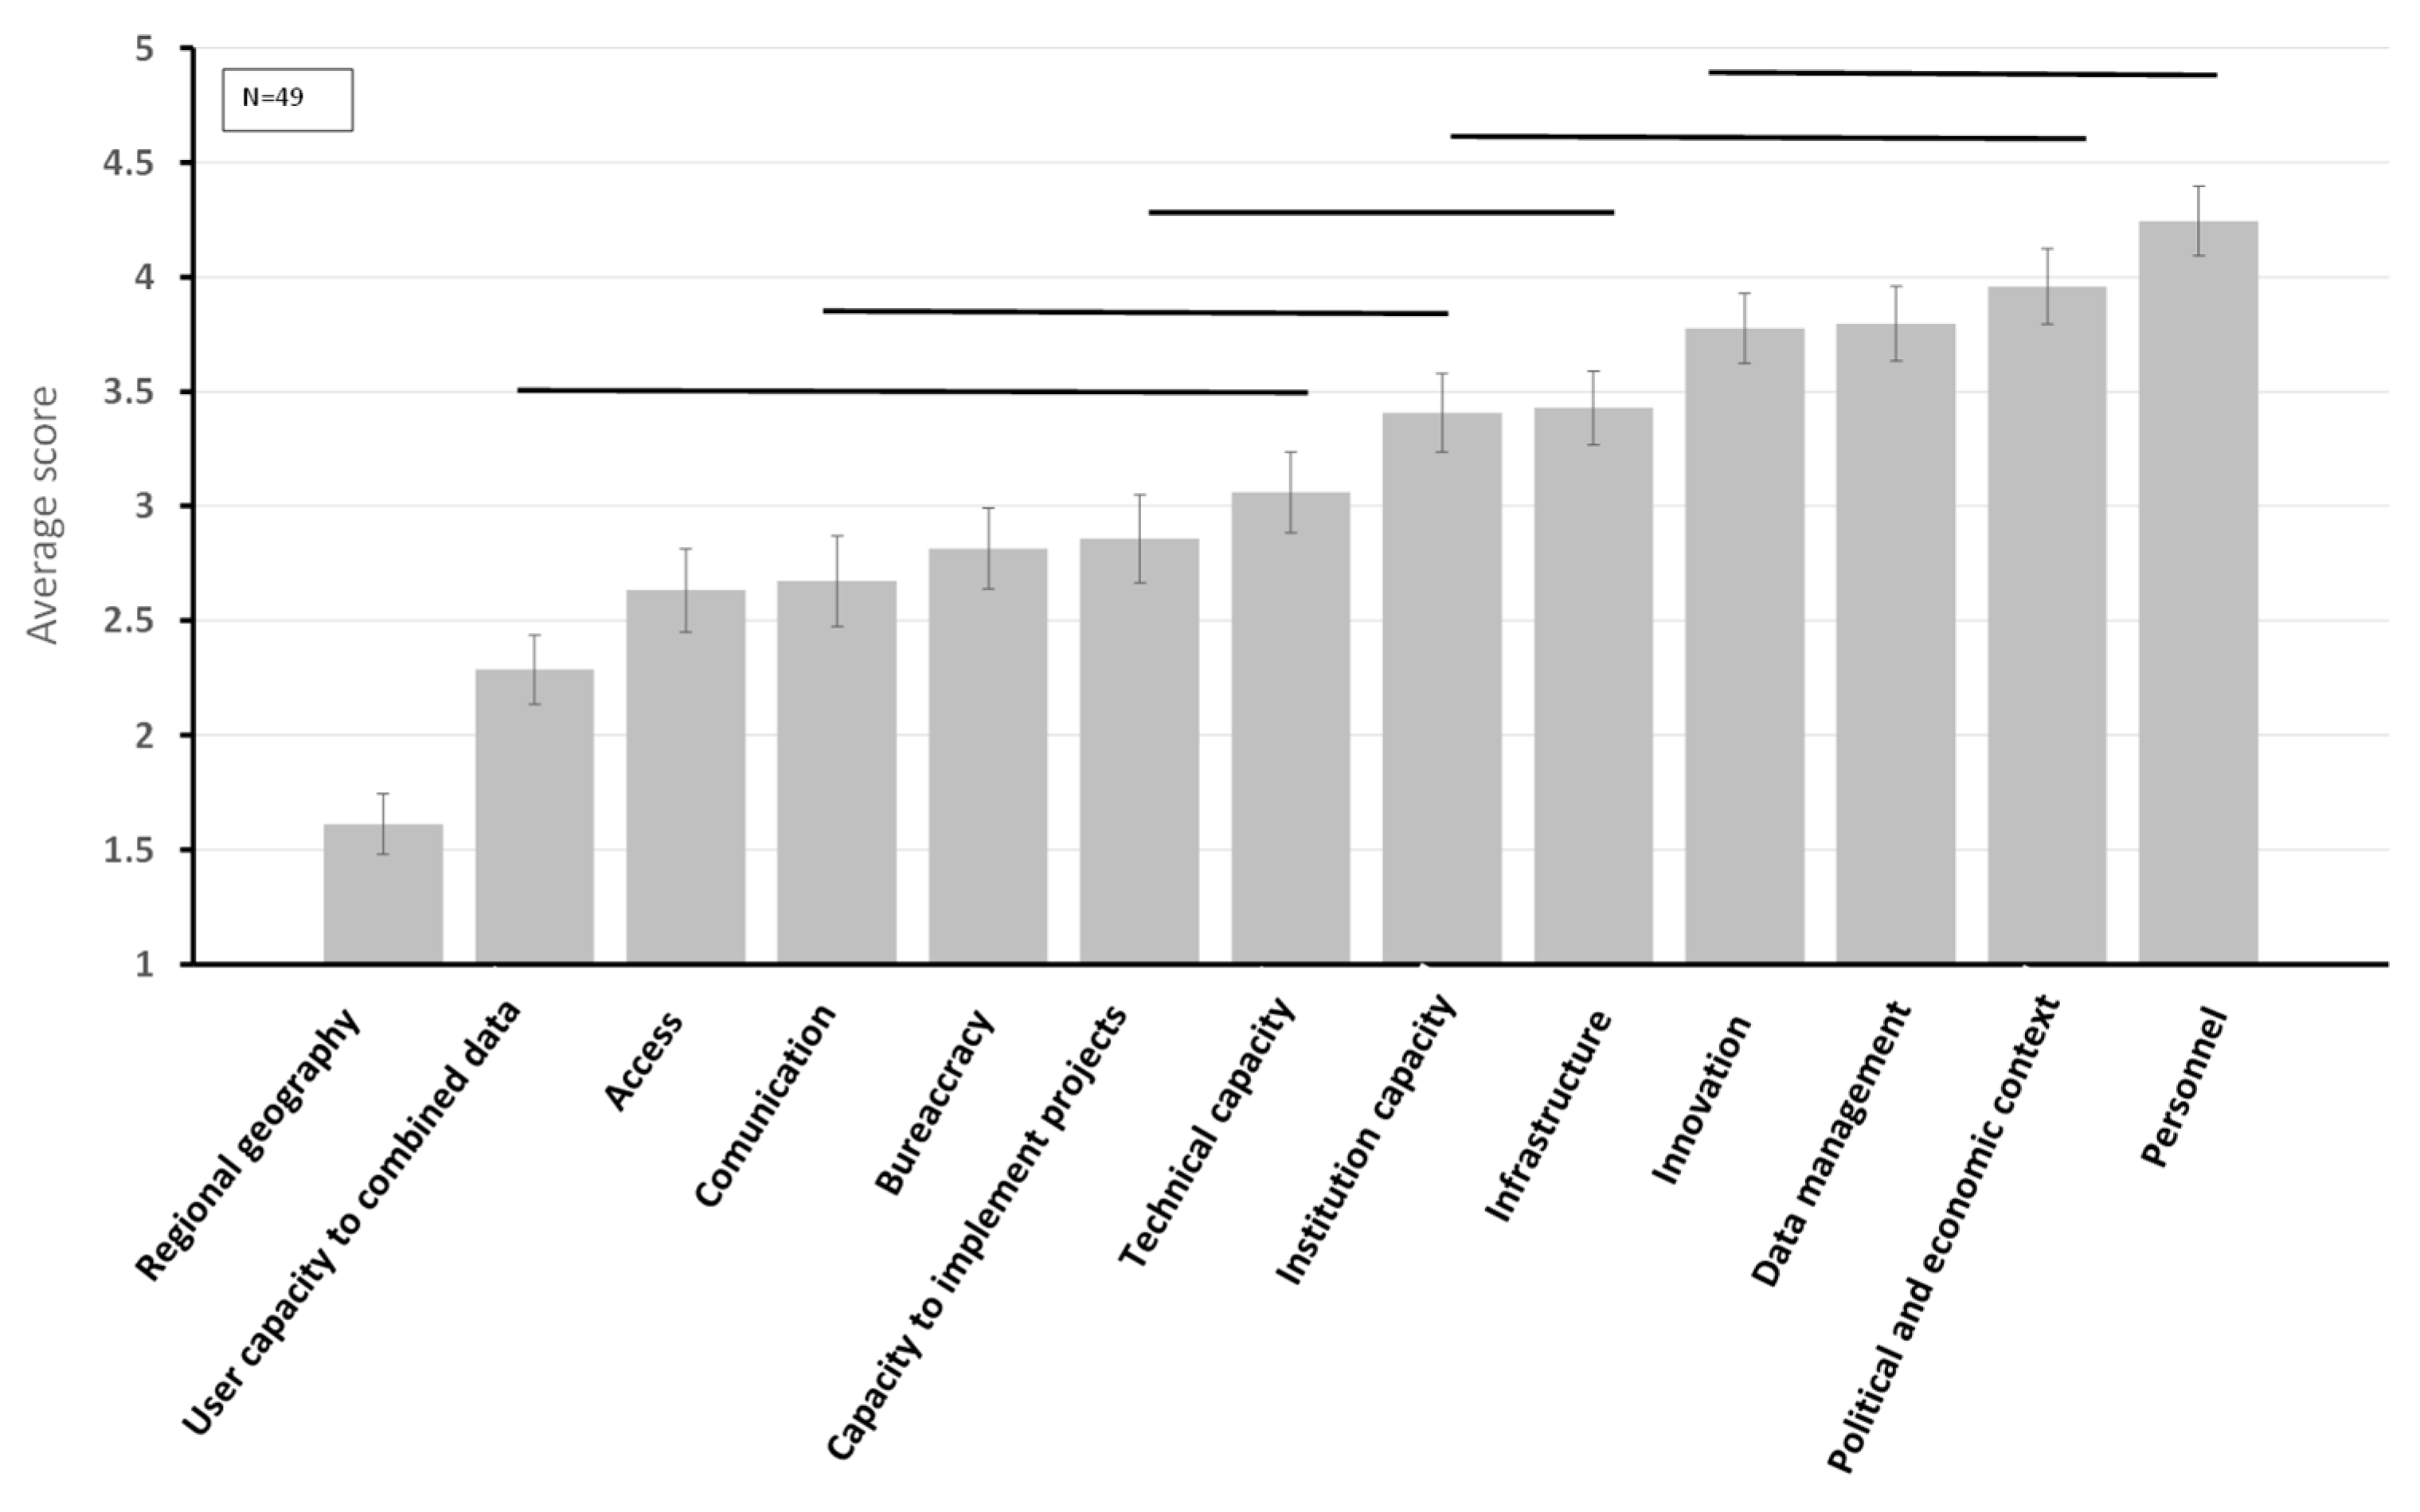
Figure 2 summarizes the mean rank scores at the national level for the set of limiting factors for the following question:
What is limiting your use of Earth Observation? The details of the five homogeneous subsets identified in the statistical analysis are provided in
Table 2. The analysis is based on responses from 49 respondents, with four respondents opting not to respond to the question, mainly because of time constraints during the interviews.
Subsets in
Table 2 are based on asymptotic significances, with a significant level of
p = 0.05. The respondents to this question had the opportunity to explain the main reasons why particular factors ranked low or high to complement the numerical rankings given in
Table 2. Lack of personnel (average score = 4.24) was seen as the most important individual limitation by respondents, and this was largely associated with a lack of financial resource represented in the political and economic context factor (average score = 3.95). Indeed, the respondents tended to mention the economic context within Brazil as a major factor which limited the use of EO in their institution (both factors ranked high). In general, challenges were also associated with lack of investment in data management and innovation (average scores = 3.8 and 3.78, respectively), which includes investments in IT, internet, and office conditions. Institutional capacity (capacity of institutions to deliver outcomes and use all the information available) was ranked in the middle of the table (average score = 3.41) and was often associated with lack of institutional capacity to implement projects on the ground. These limitations were often associated with the capacity of institutions to act on the ground, based on limited financial resources and personnel. Lower ranked limiting factors included administrative aspects such as capacity to implement projects, bureaucracy, and communication (average scores = 2.86, 2.82, and 2.67 respectively). Interestingly, access to EO data was considered by respondents to be of relatively low importance (average score = 2.63), despite the high demand for high-resolution EO data and limitations to accessing specific types of radar EO data. The capacity of users to combine EO data with other types of information was ranked low (average score = 2.29), which refers to the capacity of users to download EO data and process raw EO data into usable information in the respondent institution. However, end-users often mentioned the need for easy-to-use platforms to allow users with limited technical skills in EO data processing to use large EO datasets in combination with other data (e.g., agricultural statistics, health, income and other indicators). Regional geography (the knowledge of end-users to understand the problems at the regional context, e.g., fire, deforestation, and agriculture) was the single least important limiting factor for the use of EO data (average score = 1.61).
The following quotations provide examples of the responses received in the more open elements of the interviews to complement the quantitative data presented above:
I think the use of EO data is systematic (PRODES, DETER, Fire). In my opinion the main gap is that there is information available, but the problem is lack of people to process it. High demand and a few people to do the work.
(General coordinator, ICMBIO, Cuiaba)
We hire external services to attend our specific demands here at the Ministry of Environment in Brasilia, and our institutional capacity is related to lack of people. This is a critical problem in government institutions. For example, IBAMA used to have 1600 environmental agents in 2010 and only 900 in 2017.
(Senior analyst, Ministry of Environment, Brasilia)
The limitations associated with lack of personnel are often linked with the financial capacity of institutions to hire new personnel and this is reflected in the second highest scoring limitation being the political and economic context.
The user’s capacity to combine datasets, communication between institutions, capacity to implement projects, and technical capacity are some of the limitations at the national level (subsets 1 to 3). The major limitations are associated with innovation, data management, political and economic context, and availability of personnel with the required expertise (subsets 4 to 6). For example, financial resources were the critical factor at UCGEO in Rio Branco, initially having 12 staff in 2009 for geoprocessing and having only three in 2017. In Brasilia, the head of EO monitoring at ICMBIO described the problem of only having two permanent staff and the requirement of having to hire staff only on a short-term contract (six months to one year maximum). The work must be complemented with the short-term help of undergraduate students and temporary contracts. This creates problems of quality and control due to high demand of work and constant change. This constant turnover of staff is also a challenge, as time and resources had to be spent training someone for a limited period. A similar situation was evident in other institutions at the national level.
The speed of the internet (infrastructure) was noted to be an important limitation by almost all the users in Brasilia, and at the regional level, it was a main barrier of communication between Brasilia and the state levels. The following illustrate this point:
Internet with poor quality, it takes 12 h to download an EO image.
(Environmental Analyst, ICMBIO, Rio Branco)
We need to invest more in system of information and data management. The internet is very slow, old computers and the changes of staff is constant. Investments in technology and to hire new staff is related to the political and economic context in Brazil. For example, one area that requires investment is to integrate land ownership data with different databases. In general, technical capacity is good with a few limitations. This is because we have different training programs in academia or here at IBAMA. Also, EO data image processing and remote sensing is part of our day-to-day life. The main limitation is the speed of the internet here in Brasilia and the regional offices.
(Senior director, IBAMA, Brasilia)
When asked about EO restrictions associated with radar images and high-resolution optical data, more than half of the respondents mentioned challenges involved with processing and interpreting radar data.
One of the problems is the capacity of the end-user to use radar images.
(Environmental Analyst, ICMBIO, Rio Branco)
Lack of knowledge to use radar images. For example: the high number of clouds in the Amazon region. It would be useful, but we need proper training to process this type of data.
(PhD student, University of Acre, Rio Branco)
It is difficult to process EO data from Sentinel 1. It requires specific knowledge.
(Senior coordinator, ICMBIO, Brasilia)
The limitations of using EO radar data are also associated with economic limitations to purchase radar data available, but at a cost, in institutions where the end-user is skilled to use and process advanced information, such as IBAMA in Brasilia.
Radar images on band L, 15 day’s resolution and 20 m at no cost are essential to detect illegal deforestation in the Amazon. The images are not available for free.
(Senior director, IBAMA, Brasilia)
The results show that some of the main challenges in all locations are limitations of end-users with the technical capacity to process and extract the needed information and more than 70% of respondents mentioned challenges involved with processing and interpreting radar data. More than 50% of respondents noted that the problems are associated with both access to radar images and the technical capacity process EO radar data. The need for up-to-date high-resolution EO data of 1 m or lower was one of the main demands noted by respondents, and it was suggested that such high-resolution imagery should be available at no cost for public access.
We need EO data with high resolution and high frequency available for public access.
(Environmental analyst, Brazilian Forest Service, Brasilia)
It would be great to have access of high-resolution EO data of 1 m or 2 m. It would help the state of Acre to monitor public land and to monitor fiscalization. For example: problems of land conflicts, landless movements, land invasions and overlapping land areas registered with the different owner.
(Senior director, Land Institute of Acre (ITERACRE), Rio Branco)
3.3. Expectations of Earth Observation Data Providers (RQ 3)
In exploring this third key research question we sought responses from users on what they saw as their most important needs/expectations from EO data providers.
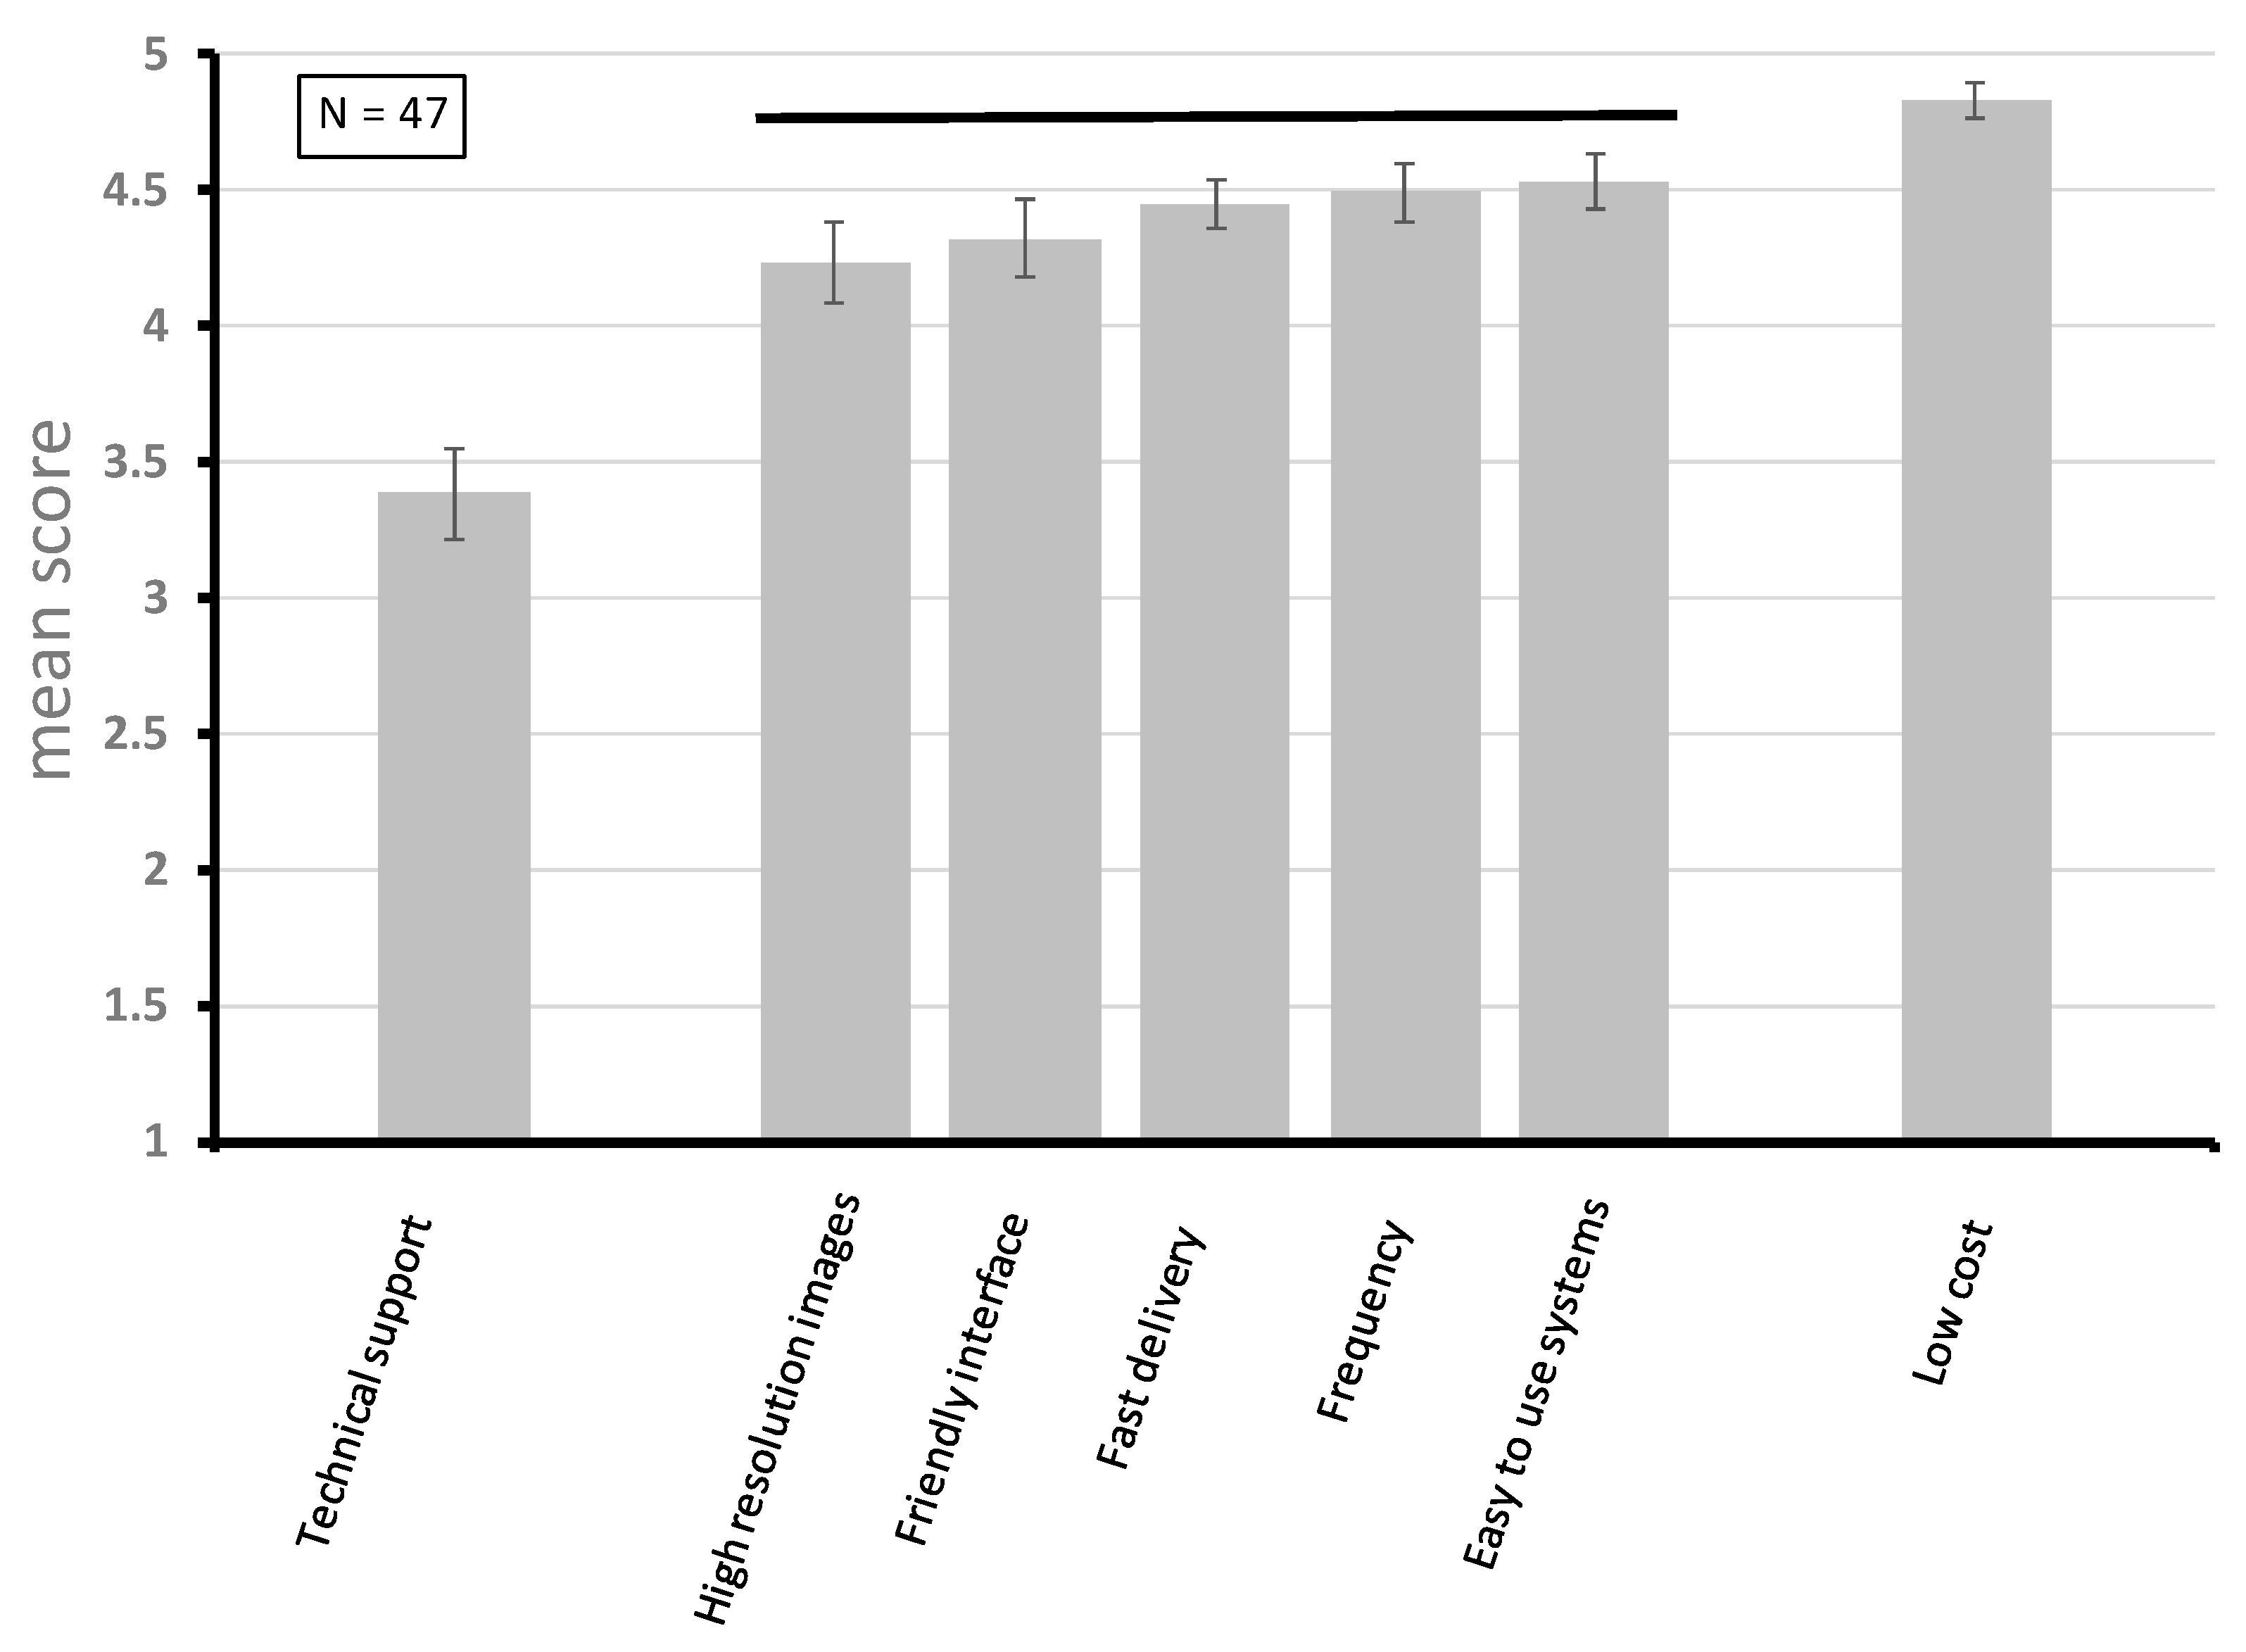
Figure 3 gives the mean rank scores at the national level for the set of needs/expectations for the following question:
What are your user needs/expectations from providers with regard to EO data? The details of the three homogeneous subsets identified in the statistical analysis are provided in
Table 3.
Perhaps unsurprisingly, low cost was mentioned as the most important factor for the respondents (average score = 4.83, subset 3). The factor products with high frequency and fast delivery was also ranked as very important (average scores = 4.49 and 4.45, respectively), although subset two comprised five of the factors and these could not be separated statistically. Technical support had the lowest average score (3.38); however, this still suggests a degree of importance ascribed to this factor by the respondents. Hence,
Figure 3 would suggest that all of these factors were regarded as “important” by the respondents, albeit with low cost emerging as the one having greater emphasis.
The following quotations provide examples of the responses received in the more open elements of the interviews to complement the quantitative data presented above:
We want products ready to use without the need of additional technical support from EO providers.
(Senior coordinator, IBAMA, Brasilia)
EO providers should improve systems to transform complex EO information into simple information for the farmers.
(Land analyst, Federation of Agriculture and Livestock of the state of Mato Grosso (FAMATO), Cuiaba)
We need to have access of new EO products that includes both high frequency and high-resolution data.
(Environmental analyst, Secretary of the State of Environment (SEMA), Cuiaba)
It would seem that respondents wish to have easy-to-use systems without any additional technical support from the main providers (INPE, USGS, and ESA). The relatively lower ranking of technical support compared to the others is perhaps surprising, but this did not mean that users of EO data saw this as unimportant, as indicated by its scores in the mid-range of the scale. Given that resourcing in terms of staff, IT, fast-internet connection, etc., were regarded as significant limitations in EO use, the services offered by providers were seen as a key ingredient for helping to address that gap by providing information that did not require further in-house processing. The use of EO data via WMS (Web Mapping Services) is a good example of practical solution that IBAMA headquarters provides to regional offices. The service accesses EO time series data in real time, with advanced computers at IBAMA headquarters. This reduces the infrastructure and staffing requirements at the regional level and in the field. The EO data are aggregated with information from PRODES and DETER. In general, respondents were confident that providers generate reliable and accurate information that does not require further verification.
3.4. Suggestions for Improving EO Data Use (RQ 4)
Respondents suggested several ideas for improving EO data use, although these often overlapped with infrastructure problems and institutional challenges. Indeed, the suggestions typically revolved around ways in which the limitations of staffing and other resources noted above could be addressed. For example, the infrastructure planning analyst at the State Secretariat of Planning of Mato Grosso (SEPLAN) in Cuiabá made three suggestions to improve the use of EO data in Mato Grosso:
- 1.
Policymakers need to see cartography as an essential part of planning.
- 2.
The workforce in public institutions needs to be renewed, as there is a lack of people to work in the field.
- 3.
The concept of information management is essential. More transparency of information between all public institutions is required, and there is a need to simplify the use of information for the regular user.
(Infrastructure planning analyst, State Secretariat of Planning of Mato Grosso (SEPLAN), Cuiaba)
The bureaucracy involved when establishing new partnerships, including with universities, was mentioned as a key barrier by respondents in Brasilia and Cuiaba, as exemplified by the following quotations from respondents:
We need to integrate the work of Universities with other public institutions and the private sector. The knowledge remains at the University and it does not reach the end-user. The problem is bureaucracy to establish partnerships. Internal and external communication with other institutions are major challenges for the University. Political will and conflict of interests are also major issues.
(Geography lecturer, Federal University of Mato Grosso (UFMT), Cuiaba)
Universities should participate in more active ways to disseminate knowledge.
(Senior director, CONAB, Brasilia)
We need more integration between academia at the state level and centers of information like INPE and federal institutions in Brasilia. Those institutions lack influence at the regional context to influence regional societies. INPE should work more at the state level.
(Infrastructure planning analyst, State Secretariat of Planning of Mato Grosso (SEPLAN), Cuiaba)
Respondents often mentioned the need to integrate databases between institutions and improve access to the final information generated by using EO data.
We need to improve the transparency of information in public organizations. One of the main problems is the integration of database between public institutions. We also need to improve communication between institutions. For example, better communication between the State Secretariat for the Environment (SEMA), IBAMA, and the public attorney. Information is power and is associated with politics.
(Senior staff, public attorney, Cuiaba)
We expect more transparency of information between public institutions. We have all the data, but we need to improve the links between institutions and the online platforms to share information. For example, between SEMA, IBAMA, INTERMAT, infrastructure departments, and other institutions.
(Senior analyst, Secretary of State for the Environment (SEMA), Cuiaba)
We need to improve the quality of the data and how we share the data between institutions. SEMA, the National Institute of Colonization and Agrarian Reform (INCRA), the National Indian Foundation (FUNAI) and improve the flow of information between institutions. We have internal capacity, but one limitation is to manage the large volume of data. One suggestion is to generate more thematic maps to help policymakers. The government budget is linked to our institutional capacity to hire new staff and invest in new technologies such as new data management (big data). We need more integration between public universities and public institutions to integrate our knowledge and resources.
(Senior Director, IBAMA, Cuiaba)
Several respondents highlighted that INPE (located in Sao Jose dos Campos) and federal institutions in Brasilia should influence actions at the regional level. The key factors of federal institutions contributions to regional development are associated with the general sense of disconnection between civil servants and policymakers in Brasilia with the reality of problems at the state and regional level. This point was mentioned several times during the interviews in Cuiaba and in Rio Branco.
4. Discussion
This research addresses the important but hitherto poorly understood requirements of, and limitations experienced by, the users of EO data for environmental and sustainable land management. It was conducted by obtaining quantitative and qualitative data from a diversity of relevant actors in Brazil, a country with a long history of interest in using EO data for such purposes. In total, extensive responses were obtained from 53 individual interviews, to provide representative coverage of both governmental institutions, other organizations, and tiers of EO users and enable a number of valuable insights to be drawn on the uses made of EO data, the factors that limit/enhance its use, and, importantly, on the needs of users and their suggestions for improving their use of EO data. While the majority of respondents was from federal or state institutions, this does reflect where much of the experience and responsibility rests for the sourcing and use of EO data and information for environmental and sustainability management in Brazil.
In the discussion below, we have combined the excellent breadth and depth of the freely given responses to the semi-structured represented in the Results section into an overall synthesis narrative addressing the four key research questions posed in the introduction that capture the challenges end-users encountered to extract the right information derived from different EO data. In more than half of the interviews, respondents mentioned that services with “ready-to-use” platforms are available from private providers and government (national level or state) should consider purchasing these specific applications associated with land-use management.
The use of EO data was acknowledged in this research to be indispensable as a means of providing policymakers and environmental and sustainability managers with reliable information e.g., on land use and land-use change. In the present study, the key areas of environmental and sustainability management that users wished to deploy EO data to help address were to monitor deforestation, crop forecast, disasters (e.g., flooding), fire, urban planning, and law enforcement. It is widely used in different sectors, such as government agencies, banks, NGOs, and academia. Potential users include small farmers and non-experts outside the EO community. It was often mentioned the need to create easy-to-use platforms to enable non-experts to understand the information generated from EO data. The main users in this study include civil servants, personnel in research institutions, and government institutions at the federal and state levels.
Lack of skilled personnel and finance emerged as the main limitations identified by users for EO data. The financial limitations restricted both investment in staff and in infrastructure (IT, speed of internet, and big data management), thereby limiting institutional capacity, but they are also a factor restricting investment in field operations and actions that utilize EO data. At the time of the research (2017), Brazil was going through an economic crisis which resulted in fewer funds being available for recruitment by government agencies (political and economic context). Salaries for GIS professionals tend to be low, and there was a lack of long-term career opportunities inside the respondent institutions. Access to EO data at medium resolution (e.g., Sentinel 10 m and Landsat 30 m) was not a limitation for users, but access to up-to-date high-resolution (≤1 m) data from government institutions or via international technical cooperation was an unmet demand.
Two ways emerged in this research whereby the limitations of a lack of skilled personnel and finance could be addressed:
It was suggested by some respondents that further cooperation and new partnerships between existing institutions are necessary to overcome limitations on the use of EO data. For example, the results of academic research should be used by policymakers and by institutions that rely on up-to-date information, as well new up-to-date GIS training provided by academics which could improve the technical capacity of regional institutions. In many cases, respondents learned to process EO data alone and technical support from experts could improve institutional capacity to use EO data more efficiently, but the bureaucracy involved in establishing new partnerships was mentioned as a significant barrier and the main reason why institutions do not create partnerships. It was often mentioned that institutions at the federal level, which are generally better resourced, should work closely with institutions at the state level, to improve the use of EO data.
Several ideas to address these barriers to cooperation and transparency were suggested, such as the expectation that INPE should provide high-resolution data with a high frequency of coverage at the national level. These data should be converted into easy-to-use information products. For example, final products or thematic maps that offer multiple information associated with an EO dataset in specific geographical regions could be managed and hosted by INPE. It was suggested that such an “EO portal” would integrate multiple data sources and include information about income, health, agriculture, regional development, and many other indicators associated with EO data to guide informed decisions. The end-user could access in a single online platform EO data and other relevant information according to end-user needs. The second approach, that of purchasing EO-based informational services from private sector providers, was popular and seen by respondents as a useful and trusted means of addressing their in-house limitations.
As noted earlier, there is an important distinction here between EO “data” and “information” derived from those data. In EO terms, data are the raw images, perhaps processed to distinguish factors such as land use. Information is the result of further processing of the data to provide details on the places where (for example) there are changes in the rate and extent of LULC. Hence, service providers may go further than just providing data and also provide high-level information that agencies can make use of. Here the main factor was cost along with a need for high frequency and fast delivery. The information provided need to be easy to use without any additional technical support. However, high-resolution EO data are expensive, and some institutions cannot afford to buy services or products provided by private enterprises. Satellites are valuable tools to monitor land-use change, and they have delivered consistent data on forest change, such as the DETER alert system provided from INPE [
2]. The evidence from the interviews suggests that EO data are widely used at the respondent institutions, and additional communication between institutions is necessary to increase the use of the information provided by different providers.
One of the key points identified in the research is how data, information, and knowledge are shared across institutions. Providers of information such as INPE, CONAB, EMBRAPA, IBAMA, and state agencies are users and providers of environmental information derived from EO data. However, access to EO data is not a major limitation in itself, except for the point made about the need for high-resolution EO data, but it is the availability of information derived from the EO data that matters. The problems associated with lack of cooperation and the needs to increase partnerships to improve shared information in different flows of information was mentioned as one of the main limitations by different respondents. This point about the sharing of information has been noted before, although not in the context of EO, and provides a challenge regarding analysis, given that there can be many facets involved. For example, Bruckmeier and Tovey [
20] point out the practices of hierarchy of data, information, knowledge, and the interactions amongst social actors involved in generating and using knowledge via complex interactions. Ostrom [
21] has suggested the use of multiple-level analytical framework, such as the Institutional Analysis and Development Framework (IAD), to understand the ways institutions operate and interact in terms of information flows, the complexity of such networks, and the changes over time [
22]. The IAD framework helps to organize the capabilities of institutions issues related to governance systems and institutional arrangements [
21]. However, it can be challenging in practice to determine the patterns of interactions, norms, and strategies between participants within such a complex institutional network [
23]. Nonetheless, additional in-depth institutional analysis would enhance the understanding of the flow of EO information between institutions.
Another key point that emerged in the respondent institutions is the skills levels available to use and process all the information available. For example, some respondents (e.g., in IBAMA and EMBRAPA) mentioned that they are very capable when it comes to using different types of EO data and integration of those data with external sources of information, to provide reliable information for managers. On the other hand, some end-users in small state institutions learned by themselves to process EO data and GIS independently via different online resources. Several respondents mentioned the need for EO data providers to provide thematic maps with “ready to use products” integrating multiple data sources to improve the use of EO data. For example, thematic maps with the best EO data available for specific geographical regions with additional information of socioeconomic factors (economic, unemployment, education, health, poverty, and unemployment) and environmental factors associated with land use and land-use change (agriculture production, deforestation, water quality, and environmental degradation) would be very useful.
Access to raw EO data in not the primary requirement of end-users, but access to online platforms that facilitate access to ready-to-use products and services is critical importance [
24]. Vinhas et al. [
25] points out that traditional methods where end-users transform data into information are being replaced by ready-to-use Web Map Services (WMS), which significantly facilitate the use of EO information by the wider community. Ready-to-use WMS end-users are not required to transform EO data into information [
25]. To extract information, experts use methods that assign a label to each pixel (e.g., grasslands, forest, and pasture), and labels can represent either land cover (observed biophysical cover of the Earth’s surface) or land use (description of the socioeconomic activities) [
26], but end-users have different knowledge to transform EO data into usable information (e.g., EO terminology, algorithms, software programs, and image processing skills) [
27]. The term “data as a service” (DaaS) is defined as the sourcing, management, and provision of data delivered in an immediately usable format to end-users, including non-expert users [
25]. Examples include machine-learning techniques and pattern-recognition to process EO data with spatial, temporal, and spectral features of different EO data [
28], or machine-learning techniques to solve a wide range of tasks to extract information from multiple EO datasets (e.g., optical and radar) to classify land-cover classes (e.g., crops and forests) [
29].
Synthetic Aperture Radar (SAR) is classified as an active system by which the instrument transmits radiation and captures the reflection, while passive systems are designed to only capture radiation from the earth’s surface [
30]. Passive systems have an important disadvantage in terms of their inability to capture data during unfavorable weather conditions (e.g., rain and clouds) [
30], while SAR can “see” through such barriers. Hence, SAR is a high-performing technology for studying the dynamics of forests in tropical forests (e.g., forest classification and detection of clear-cut and burned-out areas), but radar images are not intuitively understandable even by scientists and technicians due to centimetric band classifications [
30].
Overall, the results of this research clearly suggest that the challenge, as identified by users in Brazil (mainly in public institutions), is not lack of EO data per se, but rather mainly a lack of institutional resources to translate the data into information and to make use of the information on the ground (e.g., adequately resourced teams to fight fire or illegal deforestation). However, it is also clear that other limitations overlap with this main one and there is no single answer for every user group or institution. A shortage of skilled staff, the speed of the internet (communication between headquarters and regional offices), etc., are recognized problems in several institutions, and this will require further investment from the federal and state government. The federal institutions included in the interviews rely on public funding for new investments, and this seems unlikely in financially challenging times. Nonetheless, a substantial challenge is also associated with lack of cooperation between different government institutions and transparency to provide the environmental information for end-users. What would seem to be required are efficient ways in which the barriers to cooperation and transparency could best be addressed. In a study about forest governance and transparency in public institutions and state agencies in the Amazon region, Bizzo and Michener [
31] noted poor governance outcomes (passive transparency) and weak compliance with environmental open-data obligations and policies and with expenditures and procurement practices of government agencies. Their results are in line with those presented here: End-users complained about the lack of transparent access to environmental information in environmental agencies and government institutions.
The interview with a senior staff member at the public attorney office in Mato Grosso highlighted the power of vested interests. The role of private-sector service providers also requires more attention, particularly regarding the newer high-resolution (<1 m) optical data and what it can offer public-sector agencies. There is clearly a need for more research to untangle the factors at play with these interactions between various public sector institutions seeking to use EO data and between them and the private sector.
To transform EO data into useful information (e.g., maps), end-users require knowledge of technical geospatial approaches, observation, and analysis [
32]. It should be noted that the present research did not specifically cover disruptive changes in EO technologies, such as the use of video satellites capable of capturing tens of seconds of Very High Resolution Imagery (VHRI) steady images, such as the Carbonite-2 (Vivid-i) [
33], nor were such changes referred to in any substantial degree by respondents. However, it needs to be acknowledged that end-users are increasingly coming from non-EO domains, thus affecting user-centric technology developments to support the visualization of information [
32], and that these new disruptive capabilities are already playing an increasingly important role in disaster response and are likely to be used increasingly in environmental and sustainability monitoring of land-use-change detection [
33]. VHRI EO data (<1 m resolution) available from optical sensors offer rich spatial details [
34]. However, the present study indicates that taking advantage of such advances will be very difficult due to the challenges users in Brazil already face in terms of the lack of skilled personnel able to process existing EO data and potentially without easy access to ready-to-use service platforms for VHRI, etc. Agreements between public institutions and private providers to facilitate purchasing ready-to-use services with new technologies may help the performance of institutions, without adding to the long-term costs of permanent staff. Additionally, further initiatives to improve the use of information, such as the Norway International Climate and Forest Initiative (NICFI) in partnership with Kongsberg Satellite Services (KSAT), Planet, and Airbus, aiming to provide monthly universal access to high-resolution and ready-to-use platform of the tropics [
35], may prove to be highly useful in advancing EO usage in support of environmental and sustainability goals.


