Abstract
The healthcare systems of European countries currently face challenges regarding the sustainability of healthcare provision. The growing sophistication of new technologies is transforming the accessibility and management of health services and information, while also challenging society’s ability to offer fair access to health services for all people. The aim of this paper is to identify and analyze some of the determinants of the self-perceived health status across the EU28 area and to determine how the digitalization of health is impacting the self-rated health of the European populations, given the fact that a healthier population is one of the 17 goals of sustainable development on the 2030 Agenda. The research method used is panel-data regression using secondary data from international databases. The results indicate that there is a direct relationship between the way people are assessing personal health, the ability to use the Internet for seeking health-related information, and the use of various apps to purchase health-related items online. Our findings are useful for academics, industry specialists, and public authorities in designing sustainable health products and policies by focusing on the development of suitable mHealth programs for generating more patient-centered services where the idea of self-care is encouraged.
1. Introduction
The healthcare systems of European countries differ in many aspects, but they are all built on values such as equity, access to quality healthcare services, solidarity, and universality [1]. Almost everywhere in Europe, there is high public support for state responsibility in healthcare [2]. In recent years, due to the 2030 sustainability agenda development, there is also an increased preoccupation in all EU states about how people feel about their own health, and therefore, specific indicators have been developed for measuring it in order to create future sustainable health policies.
Moreover, the COVID-19 pandemic, which broke out in 2020, has put health systems around the world under severe stress and to a massive endurance test. According to the World Health Organization, China, Iran, and South Korea were initially among the hardest hit states but were quickly followed by the United States and the strongest developed countries of Europe (Italy, Spain, France, UK, and Belgium) [3]. The way governments have responded to this challenge has been extremely different, but it has become increasingly clear that a rethinking of health systems is needed, both nationally and globally, to become more sustainable and better able to respond to systemic shocks.
In their action of developing sustainable health care systems, the governments of the world have to face some systemic challenges, such as high costs, fast demographic changes, shortages of health professionals, and uneven access to healthcare [2,4,5,6,7,8]. In the European Union, the impact of these factors is higher in the emerging economies, such as those of southeastern Europe where meeting the increased healthcare demand is still somehow inhibited, as one can see by taking into consideration the health expenditure as a percentage of gross domestic product (GDP) (see Figure 1).
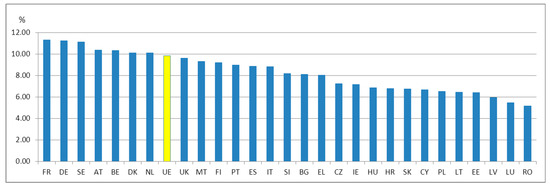
Figure 1.
Current health expenditure (% of gross domestic product (GDP)) in the EU28 area, 2017 (World Bank Data).
Investing in healthcare is important in order to counteract these challenges, so most of the stakeholders inside the European Union (EU) are ultimately searching for ways to improve the healthcare systems’ sustainability and their citizen’s health. Based on the new technology and digital advancements, the EU has become interested in using information and communication technologies for health, called “e-Health” tools by the World Health Organization (WHO), for reducing health systems access inequalities. Successive plans and actions were developed, such as the European Commission’s “e-Health Action Plan 2012–2020”, the “Digital Agenda for Europe” [9], and (more recently) the 2030 Agenda for Sustainable Development for making healthcare more patient-centric [10]. This roadmap and the related tools were destined to make people more empowered to manage their healthcare, by using a whole new set of devices and technologies. “To promote physical and mental health and well-being, and to extend life expectancy for all, we must achieve universal health coverage and access to quality health care. No one must be left behind.” [11]. Giving the context of a globalized world, the health of its population is a vital goal in attaining global sustainability.
With the development of information technologies, new opportunities appear, as well as new challenges in the development of national health systems. People have faster access to information and want to be treated as personalized as possible. Owning mobile phones and accessing the Internet has created new markets for information (health included) for which there are applications dedicated to this purpose.
Nowadays, there is a new pattern of developing mobile health services (so-called mHealth) for enabling increased accessibility and effectiveness of healthcare services for people around the world [12]. The mobile solutions transform the way healthcare is handled in terms of accessibility, costs, information, and effectiveness for both patients and organizations [13]. The most common categories of mHealth application are dedicated to help individuals and professionals in managing chronic illness (e.g., MOBIGUIDE), maternal and childcare, diagnosis process (e.g., INTERSTRESS), and interpretation of medical tests. Still, there are some concerns regarding the real benefits of using them and also regarding patients’ safety. Therefore, one of the most important preoccupations is to understand and assess the impact of mHealth use on the self-perceived health status of individuals. “Self-perceived health expresses a subjective assessment by the respondent of his/her health. Indicators based on this concept can be used to evaluate the general health status, health inequalities and health care needs at the population level.” [14] The aim of this paper is to identify, analyze, and discuss the situation of the self-perceived health status across the EU28 member states and to determine how the digitalization in health services impacts the self-rated health status of the European populations. This is a particularly important issue in the context of the 2030 Agenda at the European Union level, where one of the 17 Sustainable Development Goals (SDG) is dedicated to good health and wellbeing. According to the declarations of high commissioners of the European Commission, the responsibility for the health systems development should be placed on the shoulders of all stakeholders: public authorities, local communities, the private sector, academia, and citizens.
The paper is structured into four sections. The first section introduces the current situation of healthcare systems in European countries, emphasizing the importance of e-Health services and the role of new technologies in this area, as they are reflected in the literature review. The second section presents the data, the research methodology, and the drivers selected for the dynamic panel regression analysis. The third section includes the research results and the discussions based on the secondary data available on international databases. The final section discusses the results and presents several conclusions and further research directions.
2. Background
Healthcare systems in European countries are dealing with issues such as an aging population, an increasing number of chronic disease patients, and a lack of vital investments. These issues lead to more hospitalizations, continuous care, and increased healthcare costs [15]. Above all, the health systems were severely tested due to the COVID-19 pandemic.
In recent decades, the evolution of new technologies led the information technology and telecommunication (ICT) sectors to focus on various tools and devices for increasing the efficiency of health systems. These tools vary from reminders for hospital appointments or tools for data collection to the improvement of public health campaigns. Studies reveal that ICT devices can provide accurate and fast information to the health systems on the subject of patients’ illnesses and behaviors and also have the potential to drive to up to 30% savings in terms of time spent on accessing or analyzing health information by physicians. [16].
Probably, some of the most innovative of all the tools developed by these two sectors are the smartphone mHealth apps [17].
The concept of “Mobile Health” (mHealth) refers to the use of mobile technologies for health and well-being services, or for information purposes [18] for the benefit of individual users. The constant development of mobile networks (from 3G to 4G and now 5G) provides essential support for the mHealth apps because mHealth informatics need innovative technologies for collecting transparent and continuous evidence-based medical information anytime, anywhere, regardless of coverage and availability of communication means [19]. Based on that, mHealth plays an important role in health call centers/helplines, mobile telemedicine, emergency services, and remote monitoring [20]. mHealth applications encourage the transition from the care provision by physicians to self-managing care and well-being [21].
The mHealth area of use is constantly expanding, from the measurement of vital signs (heart rate, blood pressure, glucose level, etc.), to the tools related to information, communication, medication reminders, or even recommendations for fitness or diets [22].
Recent studies showed that communication with patients can be significantly improved via the app user data exchanges. Additionally, mHealth can drive to a more efficient delivery of healthcare services by having a positive impact on planning and shortening the waiting time, on guidance treatment and communication between patients and physicians [23].
Considering all this, mHealth could be suitable for facing these challenges, as it can contribute to patient-centered healthcare and to the improvement of the efficiency of health systems in general [24].
From the very beginning, mHealth has been created to help countries maintain and develop sustainable healthcare systems, as it supports more efficient healthcare delivery. However, now, mHealth tools’ usage requires adapting and/or developing digital skills not only from the physicians’ side, but also from the patients or the healthcare services consumers’ side [25]. This can lead to future possible problems in accessing healthcare services [26].
Along with some historical disparities of the healthcare offer in the EU, new e-Health (including mHealth) inequalities recently have appeared, coming from different perspectives (i.e., individual, institutional, or political perspectives) and being heightened by the fact that health systems’ priorities are not aligned at the European, national, and local levels [27]. Health inequalities at all levels also occur because of wrong planning, uneven infrastructure, operational issues, cost differences between various regions, as well as due to a lack of involvement of final users in the health systems’ designing process, and in the ICT procurement process, but also because of ICT unavailability for the health field. One main indicator of governments’ capability of sustainable development of health systems is the percentage of GDP spent on healthcare. In the EU28 area, it varies between 11.31% (France) and 5.16% (Romania) [28].
The dynamic changes in required technologies and of devices for adopting/implementing and developing health systems (including mHealth) added to the lack of knowledge, digital skills, and digital literacy, but also the doubts over the significance of information can drive to brand new health inequalities among various countries besides the ones stated before [8,29].
According to the Digital Economy and Society Index (DESI) report, countries in southeastern Europe (SEE) are among the least digital skilled in the EU, because of several factors such as low investment in infrastructure, poverty, low education, and low incomes, among others [30].
According to the last DESI report, less than one in five people in the EU have used health and care services provided online (18%). However, almost 50% of people in Finland and Estonia used e-Health services, while most of the southeastern European countries underperformed (see Figure 2). However, this report does not include the use of wellness apps (part of mHealth and e-Health applications) [31].
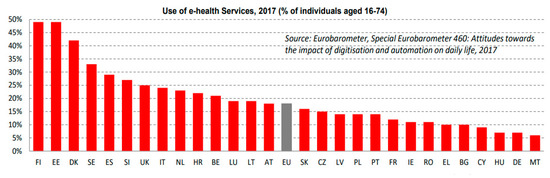
Figure 2.
Use of e-Health services, 2017 (Digital Economy and Society Index (DESI) 2019, European Commission).
3. Data, Methodology, and Model
Considering the differences between healthcare systems in the EU28 countries, we proceeded to identify and analyze the situation of the self-perceived health status across the EU28 member states and to determine if and how does the digitalization of health services impact the self-rated health of the European populations. For this analysis, 10 years of data from the 28 member states of the European Union was collected. The variables selected in this analysis refer to the self-rated health status of the population (—as a dependent variable—and some digitalization indicators related to health such as the internet usage level for seeking health-related information ( and the health-related online purchases or downloads (, as independent variables. The analysis has been conducted in the EU28 area, from 2009 to 2018, based on Eurostat, OECD, and WHO data. The authors faced a research limitation in the matter of self-reported data, which can contain potential sources of bias that the authors had no control of, such as the case of the self-perceived health status [18,32,33].
Because the data we gathered covers 28 states over a 10 year period, the panel data regression models, i.e., dynamic panel regression has been used for analyzing data and model creation. The authors applied the Arellano–Bond one-step difference general method of moments estimator, as this technique enables overcoming the associated econometric issues of the working dataset. The EViews 11 software has been used for data processing.
3.1. Data
The first step was to select the variables involved in the analysis. The dependent variable considered for the analysis is the self-perceived health status as being very good or good.
According to Eurostat statistics, self-perceived health status varies over time among the EU population on a four-item scale, ranking very good, too good, fair, and bad. A cumulative statistic of self-perceived health status as being good or very good has been used in our study, as was also provided in the same Eurostat database because we intended to explain how people that are concerned about their own health behave for maintaining and improving it via new technologies. Additionally, we aimed to provide the results to academia and governments in order to include them in further research studies and development policies for sustainable development of the health systems across Europe.
Eurostat statistics show that the share of the population concerned with personal health status increases with the level of education and income [30], reflecting the diverging levels of affordability of medical care, income-dependent lifestyles, or fewer problems in meeting medical needs for people with a higher level of income compared with the low-income earners; in the same note, education is linked to income levels, so people with increased education are likely to meet their medical needs and to be more aware of the suitability of adopting healthy lifestyles among others. This means that the more educated and wealthier the person is, the more interested he will be in monitoring his health status because he understands better the consequences of ignoring healthcare, and more than that, he owns the financial resources for investing in technology-related health apps. This population segment usually owns high-quality ICT devices and is able to use mobile technologies and the internet with ease in order to search for information, and therefore, the authors decided to focus on analyzing their health-related online behavior. As one can see from Figure 3, differences between the self-perceived health statuses of populations of the EU28 member states exist over the considered 10 year period of time [14].
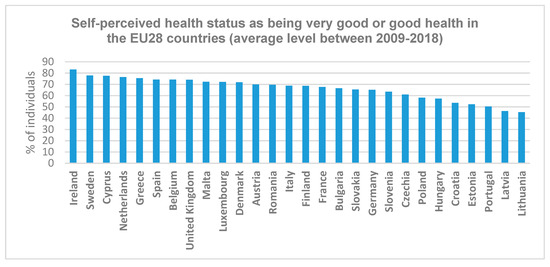
Figure 3.
Self-perceived health status as being very good or good in the analyzed countries.
Inside the EU, between 2009 and 2018, 66% of the population having completed tertiary education perceived their health as good or very good [34]. For most of the Eastern European countries, the population reporting their health status as being very good or good is similar to the EU28 level, Romania registering an even higher score starting from 2013. As shown in the figure above, Ireland is the highest-ranked country in terms of population perceiving their health as good or very good, followed by Cyprus, Greece, Spain, and Belgium, whereas the Baltic countries are those whose populations rate their health in a less positive way (only 46% of the Latvians perceive their health as good or very good, and 45% of the Lithuanians rate their health in a positive way). Nevertheless, self-perceived health status is an indicator of well-being, as well as a measurement unit for the quality of life [35,36], not only a predictor of healthy years of life, mortality, or life expectancy [37], therefore the differences occurring between countries in the matter of self-rated health accurately illustrates differences in health systems, i.e., the gaps between Western and Eastern European countries in terms of life quality, well-being, social inequalities, and so on.
The second variable considered for the analysis is “information seeking on health issues on the Internet”. Figure 4 shows the internet usage for health-related information seeking rates in the EU28 states [32]. As one can see, the populations from northern Europe use the internet for seeking health-related information the most (Finland, Denmark, Sweden, but also the Netherlands, Luxembourg, and Germany). This is because the mentioned countries are ranked the highest in terms of digital skills, according to the latest Digital Economy and Society Index [31]. On the other hand, Romania and Bulgaria present similarities in this case, in the sense that fewer individuals from these two countries use the internet for health-related information, compared to the EU28 level.
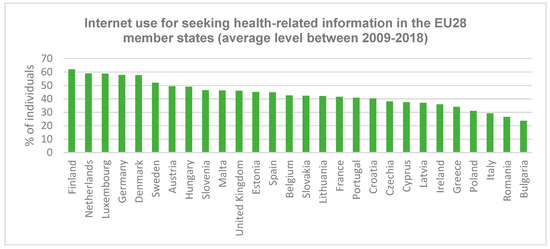
Figure 4.
Individuals using the Internet to seek health-related information.
The third variable considered for the analysis is related to the online purchases and downloads linked to health, including medicines purchased online and mobile health apps downloads/purchases. Regarding the percent of individuals who proceeded to health-related online purchases or downloads, Germany is ranked the highest with 28% of its population buying or downloading health-related goods (Figure 5). The top is completed by Denmark and, surprisingly, by Romania and Greece.
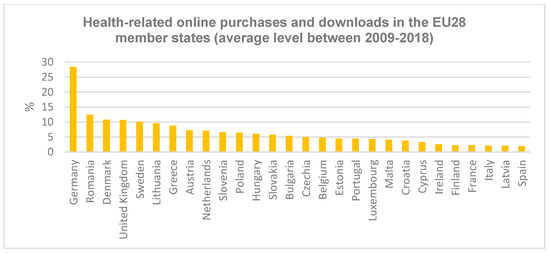
Figure 5.
Health-related online purchases and downloads in the EU28 area.
The differences between various countries in the European Union, highlighting the gaps between Eastern and Western Europe, happened mostly because of the disparities between them in terms of aspects such as digital skills, openness to new technologies, education attainment levels, and steps taken into what is called the “digitized economy”. So, the fact that a quite large percentage of Romanians purchase or download health-related goods and/or services online seems unexpected, especially considering that Romania is ranked among the lowest in Europe in terms of digital skills [31].
3.2. Methodology and Model
The analysis was based on a general model taking the following form:
where Yit is the “self-perceived health status” as the dependent variable, which indicates the percentage of the population reporting a good or very good health status, Xit is an independent variable referring to the “Internet use for seeking health-related information”, and Zit is another independent variable related to “health-related online purchases and downloads” (where “i” stands for the country and “t” for the time). While β and δ are two column vectors of coefficients, εit refers to the disturbance term, which is composed of random variables. As shown in Equation (2), the disturbance term εit has two orthogonal components: ui are the fixed effects (variables that are constant across individuals, meaning that they do not change or they change at a constant rate over time), and vit are the idiosyncratic shocks (unobserved factors that impact the dependent variable both over time and across individuals).
Before running the regression analysis, the authors had to decide what estimator should be used. The decision of using the Arellano–Bond one-step difference Generalized Method of Moments (GMM) estimator is based on the outputs of panel-data-specific problems examination such as endogeneity (situations when any of the independent variable—in our case ”Internet use for seeking health-related information” and/or ”health-related online purchases and downloads” is correlated with the disturbance term), heteroscedasticity (the standard errors of a variable monitored over a period of time are non-constant), and serial correlation, often occurring in time series when a variable and its lagged version, i.e., Yit and Yit−1 are correlated with one another over periods of time. This means that the level of a variable affects its future level. In our case, the self-perceived health status level monitored at t − 1 impacts its level at t moment.
The above-mentioned problems often arise in panel data analysis, and if they are not considered when choosing the appropriate method for estimation, classical methods such as the ordinary least squares method (OLS) would lead to biased estimators. For the fact that the process of self-rating the health status is a dynamic one, which means that the observations self-perceived health status level relate to past ones, as well as for the fact that the time-invariant country effects could be correlated with the independent variables and that the dataset consists in a quite short time component compared to the large territorial dimension (10 years and 28 countries), the authors proceeded to use a dynamic panel regression using the Arellano–Bond one-step difference General Method of Moments for estimation, as this is set to overcome the above highlighted econometric issues related to the working dataset of this analysis.
The Arellano–Bond one-step difference GMM converts the independent variable according to the differencing method. This produces the least amount of bias and variance in parameters estimation [38].
Taking all these into considerations, to justify the choice of the above-mentioned method, the variables for this analysis were first tested for endogeneity using EViews 11, the results showing that the variable (the health-related online purchases and downloads) is correlated with the error term (see Table 1). This leads to biased estimates.

Table 1.
Endogeneity testing results.
Thus, the simultaneity in this estimation leads to biased estimates, as the assumption in the Gauss–Markov theorem related to the independent variables not being correlated with the error term is violated [39]. As endogeneity is confirmed in this case, p < 0.05 for the independent variable, the authors concluded that the OLS estimation will produce an inconsistent and biased estimator, so they proceeded to use a method based on instrumental variables, which allow the derivation of consistent estimates.
Secondly, the likelihood test output confirmed that the standard errors are non-constant, thus meaning that heteroskedasticity occurred in our working dataset (p = 0.000 < 0.05, as for Table 2).
Table 2.
Likelihood ratio test results for heteroskedasticity.
The serial correlation was tested by applying the Breusch–Pagan Lagrange Multiplier (LM) test, which revealed that, in this classical regression model, the error terms are correlated (the p-value is lower than 0.05, thus confirming the presence of serial correlation, as shown in Table 3).
Table 3.
Serial correlation testing results.
To solve the problem related to the endogeneity occurring in the case of the variable Zit, a set of instrumental variables were included in the analysis. These variables referred to aspects such as the inequality of income distribution, the share of the population with tertiary education attainment, the digital inclusion of individuals, the Gini coefficient, at risk of poverty rate, the population distribution by gender, the median average age of the population, the employment rate, and the ability to make ends meet. The Sargan and Arellano–Bond tests (see Table 4 and Table 5) were used in order to identify possible restrictions.
Table 4.
Regression output using the GMM method.
Table 5.
Arellano–Bond serial correlation test.
The null hypothesis for this test was that the instruments as a group are not linked to a set of residuals. The statistical confirmation of this hypothesis proved the validity of the instrumental variables chosen for the analysis. On the other hand, the Arellano–Bond test for first-order (AR(1)) and for second-order (AR(2)) in the first differences was applied to the differenced residuals, being based on the no serial correlation null hypothesis. In our case, the test for the AR(1) process in first differences rejects the null hypothesis, while the test for AR(2) in first differences, which identifies the serial correlation in levels, states the acceptance of the null hypothesis of no serial correlation. According to the regression output, the R-Squared value of 0.78 indicates the fact that 78% of the variation in self-perceived health can be explained by the independent variables (“Internet use for seeking health-related information” and “health-related online purchases and downloads”).
Considering the p-values, the followings can be asserted: the model is valid, and all the variables included in the analysis are significantly influencing the self-perceived health of the population, as the p-value is lower than 0.05. The Sargan tested if the instruments are valid. The confirmation is given by the J-Statistic (Table 4), for which the p-value = 0.357. Therefore, the authors can state, with a probability of 95% that the instruments used in this analysis are valid. The Arellano–Bond test (Table 5) revealed no autocorrelation for the second order (AR(2)), p-value = 0.5118. While for the AR(1) in first differences, the Arellano–Bond test rejects the null hypothesis, as expected (p-value = 0.00 < 0.05). For the case of AR(2) in first differences, the null hypothesis stands, which means that no serial correlation is present.
Thus, the explanatory model will take the following expression:
where:
- Yit Yi,t−1—the percentage of the population in the country “i” that perceived its health status as being good or very good during the year “t” and in the previous year (“t − 1”).
- Xit—the percentage of the population in the “i” country that is using the internet for seeking health-related information during the year “t”.
- Zit—the percentage of the population in the “i” country that purchased health-related issues online during the year “t”.
4. Results and Discussion
The EU28 area economies are in a process of continuous political, economic, and social convergence, but some disparities still persist in terms of its population level of digital skills, education, and access to various social systems (such as the health system). A very important issue of sustainable development of the EU area is taking care that no one is left behind in terms of health and education. The growing sophistication of mobile phone networks is transforming the way health services and information are handled in terms of management and access. Mobile technologies facilitate the personalization of health and medical care and enable the so-called citizen-focused health services. Therefore, we analyzed how the self-perceived health rate of the EU population in the 28 member states is influenced by its ability to seek health-related information and also by the tendency to purchase health-related issues online (via various mobile apps). The variables considered for our research were the percentage of the population that perceived its health as being very good or good (), the percentage of the population (16 and above) that is seeking health-related information on the internet (), and the percentage of the population (16 and above) that purchases health-related issues online (). For analyzing the existence of a relation between these variables, a dynamic panel data regression analysis has been performed using data made available by Eurostat, OECD, and WHO, in a 10-year analysis (from 2009 to 2018).
The descriptive statistics for these variables for the 2009–2018 period of time in the EU28 area are stated in the table below (Table 6).
Table 6.
Descriptive statistics.
As resulted from Table 6, in the EU28 area, the average percent of the population perceiving their health as good or very good (between 2009 and 2018) is 66.37%, while 43.49% of the population uses the internet to seek health-related information. At the same time, only 6.54% of the EU28 area proceeds to online purchases or downloads, which are related to health. Table 6 highlights the cross-sectional differences for all the variables included in the analysis: as shown, the highest level of population perceiving their health as good or very good is 83.6%, whereas the lowest percentage of population rating their health as good or very good is of 42.8%. The same can be observed for the Internet usage level for seeking health-related info, where there is stated a difference of 62% between the minimum observed and the maximum. In the case of health-related online purchases or downloads, the minimum level is 1%, while the maximum level is 31%.
Taking into consideration the model that we obtained, one can see there is a positive correlation between the use of the internet to seek health-related information and the self-perceived health status of the individuals. In other words, educated people are more and more familiar with using the Internet as an important source for searching for information about health aspects.
On the other hand, there is a negative correlation between online purchasing or downloading health-related goods and the self-perceived health status of individuals. This result shows that those who have health issues and perceive their health status as being less good are preoccupied with buying/downloading health-related applications. The result we obtained is in line with Percheski and Hargittai (2011) and Myrick et al. (2019) who showed how educated people are documenting themselves and how education levels and emotional states combine to influence online health information seeking [40,41]. At the same time, buying fewer health-related issues from the internet and being more informed from various sources (internet included) seems to contribute to a higher self-perceived health rate in European countries. The development of internet use and the fast-accessible information sources are modeling people’s behaviors and perceptions. The effect and significance of explanatory variables of our model show that using the internet to seek health-related information improved self-rated health. In this regard, our results come to confirm a study result in 2010 (Tustin, 2010), which revealed that “dissatisfied patients were significantly more likely to rate the Internet as a better source of information than the provider” [42]. The result is also consistent with that obtained by Yun and Park (2010), which revealed that in Korea healthcare consumers will use the Internet actively in the future [43]. Cross-national comparisons regarding the self-perceived health status and the relation that people are establishing with e-Health tools offer valuable information to governments in their battle for improving the health system and in making them more efficient, more accessible, and more sustainable. One can see that mobile solutions transform the way healthcare is handled in terms of accessibility, information, and effectiveness for both patients and organizations. Taking into consideration that people are making a strong association between self-perceived health and satisfaction with healthcare services [44], and based on our findings, we suggest that academia and public decision-makers in the health domain pay increased attention to collaboration with ICT specialists for structuring the health information available on the Internet. This can be done by carefully promoting information campaigns on official websites about the benefits and the risks of various medical items, with the vast amount of information related to COVID-19 being a powerful example. Additionally, we suggest that an improvement of the framework of online purchases (e.g., the security of online purchases, protection of personal health data) by developing mHealth applications will encourage the transition from the care provision by physicians to self-managing care and well-being, and this will contribute to more sustainable health systems in all European countries.
The main limitation of the study is the fact that the stakeholders’ behaviors were not monitored in the context of the current health crisis. The authors aim to further deepen the influence of the COVID-19 pandemic crisis on key players in the healthcare market in future research. The authors also aim to determine how, during the COVID-19 crisis, the health decision-makers positioned themselves in relation to ICT companies and consumers of the new medical services/products offered, as well as how they will influence the quality of life of residents in EU28 countries. Another area of research is the analysis of how fake news on social media has influenced the consumption behavior of residents, while identifying ways to communicate to individual consumers/residents to select the information they have access to, based on accurate knowledge of the medical services market.
Author Contributions
All the authors equally contributed to this work, to the research design, and analysis. Conceptualization G.B., A.I.M.T., and L.D.; methodology G.B. and A.I.M.T.; writing, review, and editing, G.B., A.I.M.T., L.D., I.B.C., S.S., and A.T.; supervision G.B. All authors have read and agreed to the published version of the manuscript.
Funding
This research received no external funding.
Conflicts of Interest
The authors declare no conflict of interest.
References
- Thomson, S.; Foubister, T.; Mossialos, E. Financing Healthcare in European Union, Challenges and Policy Responses; World Health Organization: Geneva, Switzerland, 2009; Available online: https://www.euro.who.int/__data/assets/pdf_file/0009/98307/E92469.pdf?ua=1 (accessed on 30 November 2020).
- Wendt, C.; Kohl, J.; Mischke, M.; Pfeifer, M. How Do Europeans Perceive Their Healthcare System? Patterns of Satisfaction and Preference for State Involvement in the Field of Healthcare. Eur. Sociol. Rev. 2010, 26, 177–192. [Google Scholar] [CrossRef]
- World Health Organization. WHO Coronavirus Disease (COVID-19) Dashboard. 2020. Available online: https://covid19.who.int/ (accessed on 30 November 2020).
- European Commission. On Effective, Accessible and Resilient Health Systems. 2014. Available online: https://ec.europa.eu/health/sites/health/files/systems_performance_assessment/docs/com2014_215_final_en.pdf (accessed on 30 March 2019).
- Hunter, D.J.; Kieslich, K.; Littlejohns, P.; Staniszewska, S.; Tumilty, E.; Weale, A.; Williams, I. Public involvement in health priority setting: Future challenges for policy, research and society. J. Health Organ. Manag. 2016, 30, 796–808. [Google Scholar] [CrossRef] [PubMed]
- Kasthuri, A. Challenges to healthcare in India -The five A’s. Indian J. Community Med. 2018, 43, 141. [Google Scholar] [PubMed]
- Fritz, Z.; Cox, C.L. Integrating philosophy, policy and practice to create a just and fair health service. J. Med. Ethics 2020. [Google Scholar] [CrossRef] [PubMed]
- Matsuoka, Y.; Fukai, K. Medical Health Insurance Systems in Europe, USA, Canada, and Australia. Available online: http://www.fihs.org/volume19_1/article1.pdf (accessed on 30 October 2020).
- Neter, E.; Brainin, E. eHealth Literacy: Extending the Digital Divide to the Realm of Health Information. J. Med. Internet Res. 2012, 14, e19. Available online: https://www.ncbi.nlm.nih.gov/pubmed/22357448 (accessed on 30 March 2019). [CrossRef]
- United Nations. Transforming our world: The 2030 Agenda for Sustainable Development. 2016. Available online: https://www.un.org/ga/search/view_doc.asp?symbol=A/RES/70/1&Lang=E (accessed on 30 April 2020).
- World Health Organization. Sustainable Development Goals. Knowledge Platform. 2020. Available online: https://sustainabledevelopment.un.org/index.php?page=view&type=30022&nr=192&menu=3170 (accessed on 30 October 2020).
- Nisha, N.; Iqbal, M.; Rifat, A.; Idrish, S. Mobile Health Services: A New Paradigm for Health Care Systems. Int. J. Asia Bus. Inf. Manag. 2015, 6, 1–17. Available online: https://www.researchgate.net/publication/276121947_Mobile_Health_Services_A_New_Paradigm_for_Health_Care_Systems (accessed on 30 April 2020). [CrossRef]
- Hudes, M.K. Healthcare Gaps that Only Technology Can Fill. In Proceedings of the 2020 Pan Pacific Microelectronics Symposium, HI, USA, 10–13 February 2020; IEEE: New York, NY, USA, 2020; pp. 1–5. [Google Scholar]
- Eurostat. Self-Perceived Health Statistics. 2019. Available online: https://ec.europa.eu/eurostat/statistics-explained/index.php/Self-perceived_health_statistics (accessed on 30 March 2019).
- Stanculescu, M.; Neculau, G. The Performance of Public Health-Care Systems in South-East Europe. A Comparative Qualitative Study; Friedrich-Ebert-Stiftung: Belgrade, Serbia, 2014; Available online: http://library.fes.de/pdffiles/bueros/belgrad/10758.pdf (accessed on 30 March 2020).
- Goodman, M. Future Crimes: Inside the Digital Underground and the Battle for Our Connected World; Anchor Books: Toronto, ON, Canada, 2016. [Google Scholar]
- Emmanouilidou, M. The status of mHealth in Europe and a review of regulative challenges. In Proceedings of the MCCSIS International Conference e-Health 2016, Funchal, Madeira, Portugal, 1–3 July 2016; Available online: https://www.researchgate.net/profile/Maria_Emmanouilidou/publication/309609754_The_status_of_mHealth_in_Europe_and_a_review_of_regulative_challenges/links/58199e7508ae6378919ea6c6/The-status-of-mHealth-in-Europe-and-a-review-of-regulative-challenges.pdf (accessed on 30 April 2019).
- World Health Organization. eHealth and WHO 2017. Available online: http://www.who.int/ehealth/en/ (accessed on 30 March 2020).
- Spanakis, E.G.; Sakkalis, V. Resilent Network Services for Critcal mHealth Applications over 5G Mobile Network Technologies; ERCIM EEIG: Sophia Antipolis, France, 2019; Available online: https://ercim-news.ercim.eu/en118/special/resilient-network-services-for-critical-mhealth-applications-over-5g-mobile-network-technologies (accessed on 30 March 2020).
- European Commission. eHealth Action Plan 2012–2020: Innovative Healthcare for The 21st Century 2017. Available online: https://ec.europa.eu/digital-single-market/en/news/ehealthaction-plan-2012-2020-innovative-healthcare-21st-century (accessed on 30 March 2020).
- European Public Health Alliance. Health Inequalities and eHealth. Report of the eHealth Stakeholder Group 2014. Available online: http://ec.europa.eu/information_society/newsroom/cf/dae/document.cfm?doc_id=5170 (accessed on 30 April 2019).
- Larson, R.S. A path to Better-Quality mHealth Apps. JMIR mHealth uHealth 2018, 6, 104–114. Available online: https://mhealth.jmir.org/2018/7/e10414 (accessed on 30 March 2019). [CrossRef] [PubMed]
- PricewaterhouseCoopers. Socio-Economic Impact of mHealth. An Assessment Report for the European Union 2013. Available online: https://www.gsma.com/iot/wp-content/uploads/2013/06/Socio-economic_impact-of-mHealth_EU_14062013V2.pdf (accessed on 30 March 2019).
- Șener, Y.; Albertino, G.; Bénié, K.; Depuydt, D.; Ferracane, M.F.; Lemaistre, M.; Pronckute, S.; Reiland, J.B.; Timmers, M.; Electronic Mobile Health. European Health Parliament. 2017. Available online: https://www.healthparliament.eu/wp-content/uploads/2017/09/Electronic_mobile-health.pdf (accessed on 30 March 2019).
- European Commission. Green Paper on mobile Health (“mHealth”). 2014. Available online: http://ec.europa.eu/newsroom/dae/document.cfm?doc_id=5147 (accessed on 30 March 2019).
- Morris, N.P. Virtual Visits and the Future of No-Shows. J. Gen. Intern. Med. 2020, 1. [Google Scholar] [CrossRef] [PubMed]
- Arcaya, M.C.; Arcaya, A.L.; Subramanian, S.V. Inequalities in health: Definitions, concepts, and theories. Glob. Health Action 2015, 8, 27106. Available online: https://www.tandfonline.com/doi/full/10.3402/gha.v8.27106 (accessed on 30 April 2019). [CrossRef] [PubMed]
- World Bank Open Data. World Development Indicators. 2018. Available online: http://datatopics.worldbank.org/world-development-indicators/ (accessed on 30 March 2019).
- Hebert, M.A.; Jansen, J.J.; Brant, R.; Hailey, D.; van der Pol, M. Successes and challenges in a field-based multi-method study of home telehealth. J. Telemed. Telecare 2004, 10, 41–44. Available online: https://www.ncbi.nlm.nih.gov/pubmed/15603606 (accessed on 30 March 2020). [CrossRef] [PubMed]
- Eurostat. Individuals who Have Basic or above Basic Overall Digital Skills. 2018. Available online: https://ec.europa.eu/eurostat/web/products-datasets/product?code=tepsr_sp410 (accessed on 30 March 2020).
- European Comission. The Digital Economy and Society Index. 2019. Available online: https://ec.europa.eu/digital-single-market/desi (accessed on 30 June 2019).
- Eurostat. Internet Use Statistics–Individuals. 2019. Available online: https://ec.europa.eu/eurostat/statistics-explained/index.php/Archive:Internet_use_statistics_-_individuals (accessed on 30 March 2020).
- OECD. Health at a Glance: Europe 2018. State of Health in the EU Cycle. Available online: https://read.oecd-ilibrary.org/social-issues-migration-health/health-at-a-glance-europe-2018_health_glance_eur-2018-en#page3 (accessed on 30 April 2019).
- European Commission. Attitudes towards the Impact of Dicitalisation and Automation on Daily Life. 2019. Available online: https://ec.europa.eu/digital-single-market/en/news/attitudes-towards-impact-digitisation-and-automation-daily-life (accessed on 30 June 2019).
- Sposito, G.; Diogo, M.J.D.; Cintra, F.A.; Neri, A.L.; Guariento, M.E.; de Sousa, M.L.R. Relationship between subjective well-being and the functionality of elderly outpatients. Rev. Bras. Fisioter. 2010, 14, 81–89. [Google Scholar] [CrossRef] [PubMed]
- Gilmour, H. Social participation and the health and well-being of Canadian seniors. Health Rep. 2012, 23, 23–32. [Google Scholar] [PubMed]
- Mohan, R.; Beydoun, H.A.; Beydoun, M.A.; Barnes-Eley, M.; Davis, J.; Lance, R.; Schellhammer, P. Self-rated health as a tool for estimating health-adjusted life expectancy among patients newly diagnosed with localized prostate cancer: A preliminary study. Qual. Life Res. 2011, 20, 713–721. [Google Scholar] [CrossRef] [PubMed][Green Version]
- Arellano, M.; Bond, S. Some tests of specification for panel data: Monte Carlo evidence and an application to employment equations. Rev. Econ. Stud. 1991, 58, 277–297. [Google Scholar] [CrossRef]
- Fumio, H. Econometrics; Princeton University Press: Princeton, NJ, USA, 2000; p. 10. [Google Scholar]
- Percheski, C.; Hargittai, E. Health information-seeking in the digital age. J. Am. Coll. Health 2011, 59, 379–386. [Google Scholar] [CrossRef] [PubMed]
- Myrick, J.G.; Willoughby, J.F. Educated but anxious: How emotional states and education levels combine to influence online health information seeking. Health Inform. J. 2019, 25, 649–660. [Google Scholar] [CrossRef]
- Tustin, N. The role of patient satisfaction in online health information seeking. J. Health Commun. 2010, 15, 3–17. [Google Scholar] [CrossRef]
- Yun, E.K.; Park, H.A. Consumers’ disease information–seeking behaviour on the Internet in Korea. J. Clin. Nurs. 2010, 19, 2860–2868. [Google Scholar] [CrossRef]
- Paul, P.; Hakobyan, M.; Valtonen, H. The association between self-perceived health status and satisfaction with healthcare services: Evidence from Armenia. BMC Health Serv. Res. 2016, 16, 67. Available online: https://link.springer.com/article/10.1186/s12913-016-1309-6 (accessed on 30 October 2020). [CrossRef]
Publisher’s Note: MDPI stays neutral with regard to jurisdictional claims in published maps and institutional affiliations. |
© 2020 by the authors. Licensee MDPI, Basel, Switzerland. This article is an open access article distributed under the terms and conditions of the Creative Commons Attribution (CC BY) license (http://creativecommons.org/licenses/by/4.0/).